 Open Access Article
Plasmonic-based Raman sensor for ultra-sensitive detection of pharmaceutical waste†
Mohamed
Hamode
 ab,
Alon
Krause
ab,
Maria
Shehadeh
ab,
Bruria
Schmerling
a,
Tchiya
Zar
ab,
Alon
Krause
ab,
Maria
Shehadeh
ab,
Bruria
Schmerling
a,
Tchiya
Zar
 ab,
Iddo
Pinkas
 c,
David
Zitoun
 ab and
Adi
Salomon
 *ab
*ab
aDepartment of Chemistry, Bar-Ilan University, Ramat-Gan 5290002, Israel. E-mail: Adi.Salomon@biu.ac.il
bInstitute of Nanotechnology and Advanced Materials (BINA), Bar-Ilan University, Ramat-Gan 5290002, Israel
cDepartment of Chemical Research Support, Weizmann Institute of Science, Rehovot, Israel
First published on 11th March 2024
Abstract
Pharmaceutical waste and contaminants pose a significant global concern for water and food safety. The detection of piperidine, a common residue in drug and supplement synthesis, is critical due to its toxic nature to both humans and animals. In this study, we develop a plasmonic-based detector for surface enhanced Raman scattering (SERS) measurements. The plasmonic device is composed of triangular cavities, milled in silver thin film, and protected by a 5 nm SiO2 layer. Due to the confined and enhanced electromagnetic field, remarkable sensitivity to piperidine with a concentration of 10−8 M in water is achieved. Despite the relatively small polarizability of piperidine, high sensitivity is observed even when using a low numerical aperture of 0.3, attributed to the directional scattering from our plasmonic device. Thus, it offers a cost-effective alternative to traditional high numerical aperture used in SERS, and the ability to use a portable Raman device for a cheaper and faster analysis.
Environmental significancePiperidine is a small potent molecule that serves as a crucial building block in the pharmaceutical and food additive industries; however, it is toxic in nature. Unfortunately, it can also be found in drinking water as a result of pharmaceutical waste. Therefore, the development of an optical-sensitive detector is crucial for the environment. Raman scattering is a sensitive optical technique; however, its contribution to environmental monitoring is negligible. Moreover, the required optics for Raman scattering are often demanding and expensive, making the instrument challenging to use in environmental science. Using our nano-patterned metallic surfaces, the detection of low concentrations of piperidine in water using affordable optics is possible. The utilization of these surfaces presents an opportunity to employ portable cost-effective Raman devices as an environmental analytical set-up. |
1. Introduction
In spontaneous Raman scattering, the Raman effect is remarkably feeble, typically resulting in only 1 out of 108 incident radiation events undergoing spontaneous Raman scattering.1–4 Employing lasers with relatively high power and objectives featuring a high numerical aperture (N.A.) allows for the collection of sufficient scattered photons. Yet, such a set-up is expensive and inadequate for many practical applications. Thus, finding solutions to enhance the Raman responses is always necessary. Metallic nano-structures may lead to deep sub-wavelength confinement and amplification of the electromagnetic (EM) field due to the excitation of plasmonic modes.5,6 This can yield remarkably strong SERS responses, often spanning over several orders of magnitude. Therefore, it is not surprising that over the past decade, SERS has emerged as a potent analytical technique, renowned for its ability to detect trace amounts of chemicals with exceptional sensitivity and specificity.7–10 Applications of SERS were realized in various fields, encompassing environmental science, biology, food safety, medicine, chemistry, and more. Notably, SERS has been instrumental in the field of COVID-19 diagnostics,11 specifically in the identification of the SARS-CoV-2 virus within nasal swab samples, achieving an impressive accuracy of about 250 fg mL−1.12–16Within the realm of environmental science,17 SERS has been effectively employed for the monitoring of heavy metal levels and the detection of microplastics in water.18,19 Moreover, SERS has proven effective in detecting and quantifying pesticides,20–26 food additives,27–29 drug residues,30,31 and industrial discharges32,33 within food and water samples. In the field of biology, SERS has facilitated high-resolution imaging of cells and tissues, offering detailed insights into their chemical composition, which holds the potential for diagnosing various diseases.34,35 Furthermore, SERS has shown promising results in drug delivery applications, allowing for the monitoring of drug release from nanoparticles and providing valuable kinetic information regarding the process.36–40
Despite the advances in SERS over the last few decades, several challenges still persist. These include the reliable detection of small molecules, the durability of SERS substrates, signal stability, and the use of cost-effective optics.
Herein, we use plasmonic cavities milled in a thin silver film and protected by a thin silica layer to enhance the Raman signal. With our developed plasmonic surfaces, low concentrations of 10−8 M of piperidine in water can be detected. Furthermore, due to the directed scattering of the Raman signal from the plasmonic surfaces, enhanced signal can be measured, using a low N.A. of 0.3. Furthermore, we show that a mix of analytes can be distinguished as well using our SERS substrate.
We undertook the challenge of detection of the small molecule piperidine because this molecule and its derivatives play a pivotal role as fundamental building blocks in the pharmaceutical industry for the synthesis of drugs and supplements. More than 70 FDA-approved drugs contain the piperidine moiety.41,42 Piperidine can be found as a derivative in various pharmaceuticals, including selective estrogen receptor modulators (SERMs) such as minoxidil, opioids, antipsychotic drugs (e.g. melperone), and insect-repellent products. Another source of piperidine is the hydrolysis of piperine, a naturally occurring compound found in plants such as pepper.43 Humans are exposed to piperidine on a daily basis, as evidenced by its wide presence in the food supply and, consequently, in human urine. As a food additive, piperidine is found at 2.5–3.33 ppm in nonalcoholic beverages, 4–5.67 ppm in candy, 9.69 ppm in baked goods, and 0.04–1.66 ppm in condiments, meats, and soups. Baked ham contains 0.2 ppm of piperidine, milk 0.11 ppm, and dry coffee 1 ppm.44 Von Euler reported that humans excrete 7.6–8.5 mg of piperidine in a 24-hour period;45 more recently, Tricker et al. reported excretion rates of 26.1–31.7 mg per day.46
Fig. 1a shows the selected analyte, piperidine, and its derivatives from different pharmaceutical drug families. This colorless molecule is known to be toxic to both humans and animals, even at low concentrations, with an LD50 value of 30 mg kg−1. Inhalation of high vapor concentrations of piperidine may lead to symptoms such as weakness, dizziness, headache, nausea, vomiting, labored breathing, increased heart rate, and elevated blood pressure.47 Additionally, piperidine is corrosive to the skin and eyes upon contact, and it can readily penetrate the skin, thereby being considered toxic through dermal exposure as well. Sensors for piperidine are mainly based on electrochemical detection, for example by using hollow mesoporous ZnO on a carbon electrode, the detection limit of ∼3.3 μM was realized.48 Additionally, a detection limit of ∼60 nM was achieved with a direct growth of well-aligned ZnO nano-rods on conductive electrode substrate.49 Yet, the durability of those electrodes is not high, as they can become contaminated over time leading to reduced sensitivity and accuracy. In addition, this technique has limited sensitivity when dealing with low concentrations. Our SERS substrates contain an additional protective 5 nm thin layer of SiO2 and therefore, they demonstrate high sensitivity, rapid analysis, low-cost preparation, and long-term stability. It allows for repeated use without significant degradation in performance. This is in contrast to some electrochemical electrodes, which may require frequent replacement or maintenance.
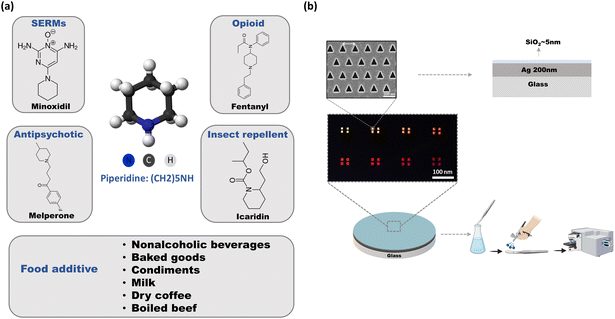 | ||
| Fig. 1 (a) 3d chemical structure of piperidine, and its drug derivatives, food additive, explaining the reason for choosing this analyte. (b) Our device, composed of a fused silica substrate covered by a smooth silver thin film (200 nm) and then covered with 5 nm of SiO2 for stability (see illustration of cross section). Series of hexagonal triangular hole-arrays were milled in the silver thin film, with different periodicities. SEM image of the plasmonic structure shows the accuracy of the FIB milling, and the uniformity of the structure. The light transmission color micrograph below is the transmission of light through a series of plasmonic structures (see also Fig. S3† for the spectra). The fabricated plasmonic devices were immersed in different solutions and dried using N2 as shown in the illustration. | ||
2. Materials and methods
2.1. Sample preparation
2.2. Optical imaging and spectra
The transmission imaging and spectra of the plasmonic nano-cavities were acquired using a bright field mode in an inverted microscope setup (OLYMPUS IX83). The samples were illuminated by a non-polarized collimated light. The transmitted light was directed to a spectrograph (IsoPlane SCT-320, Princeton Instruments) and then detected by a high quantum efficiency charge-coupled device (CCD) camera (PIXS1024b) using an objective ×40 magnification (N.A of 0.6). The grating used for acquiring the spectra was 50 grooves per mm (density), and the blaze wavelength was 600 nm (Princeton Instruments). The spectra were always collected under the same conditions (40× and N.A. of 0.6). All acquired spectra were normalized to the reference glass spectrum taken using the same parameters. The images and spectra obtained provided us with valuable information regarding the plasmonic modes and their interaction with light. The symmetry, shape, size, and geometry of the cavities will dictate their optical response and will be elaborated in the Results and discussion section later in this proposal thesis.2.3. Raman spectroscopy measurements
Raman spectra were measured using the LabRAM Soleil (Horiba, France) set-up. We used a 532 nm laser source with a low laser power of 0.55 mW, to ensure the stability of the measurements. The spectra were acquired in a region of 400 cm−1 to 2000 cm−1 with a 600 gr mm−1 grating, confocal hole of 200 μm, and 1.3 cm−1 per pixel spectral dispersion. The sample was placed under an optical microscope, with the following objectives: ×50 N.A. 0.6 and ×10 N.A. 0.3 (Nikon). Only clean samples were measured, that is, if aggregation of the analytes was observed by the optical microscope, it was not measured. We repeated those measurements with many samples, and 3 different Raman systems, and different conditions.3. Results and discussion
Our plasmonic device is composed of hexagonal triangular nano-cavities with different periodicities, milled in a 200 nm silver thin film and covered by a 3–5 nm thin layer of SiO2 (see Fig. 1b).The observed different physical colors are due to extraordinary light transmission through the cavities at different wavelengths (see Fig. S3† for the spectroscopic measurements). These unique plasmonic structures give rise to an enhanced electromagnetic (EM) field at the vicinity of the surface, namely hot spots, and deep sub-wavelength confinement of the EM field can be achieved. Therefore, nonlinear optical processes such as Raman can be boosted by orders of magnitudes. The array periodicity was tuned to match the plasmonic mode resonance with the Raman laser wavelength, as shown in Fig. S3.† Thus, herein we used a periodicity of approximately 400 nm, which has a considerable overlap between the plasmonic resonance and the wavelength of the laser (532 nm), as well as with scattered Raman photons at lower energy. The plasmonic device was carefully immersed in solutions containing piperidine at different concentrations and allowed to be set for approximately two minutes. Following this, the device was gently removed from the solution and dried using a stream of nitrogen gas to remove any residual solvent. Finally, the sample was measured using a Raman system. It is worth noting that the plasmonic surface remains clean after this process, with no detectable aggregation of molecules, otherwise such samples were not measured.
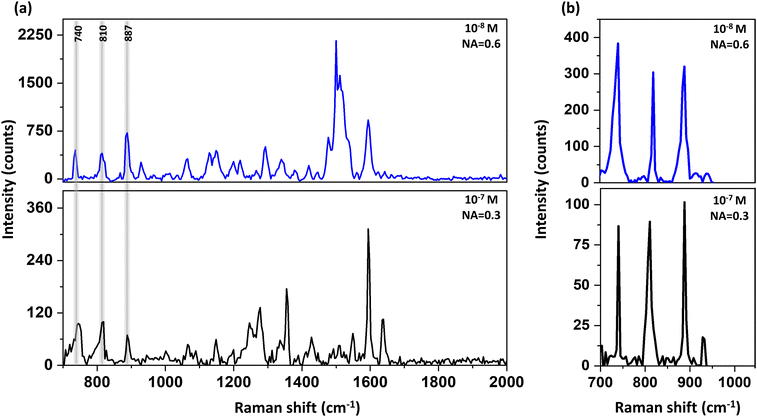
Piperidine has a very small cross-section for Raman, nevertheless due to the enhanced EM field in proximity to the plasmonic structures, detection of this analyte by Raman is possible both in di-ionized (DI) water and in ethanol down to concentrations of 10−8 M, as is presented in Fig. 2. The blue spectra were taken using objective of N.A. = 0.6, and the black spectra were taken using a lower N.A. = of 0.3. Yet, due to our plasmonic surfaces, which allow efficient directed scattering, we could measure the low concentration of 10−7 M of piperidine even using low N.A. = of 0.3 (see Fig. 2). In essence, the plasmonic structure directs scattered emitted photons towards the detector, thereby requiring a reduced collection angle.
The enhancement factor was calculated to be 4 × 10⁶ as shown in Fig. S4.† Piperidine has several vibration modes50 as summarized in Table S1 and Fig. S5.†
Herein, we focused on three characteristic peaks of piperidine: 740 cm−1, 810 cm−1 and 887 cm−1 that were assigned to N–H deformation, ring “breathing” and C–N–C stretch, respectively.50 The reason behind the focus on these peaks is due to additional responses resulting from the ethanol solution alone and overlapping with the vibrational modes of piperidine above 1200 cm−1 (see Fig. S6†).
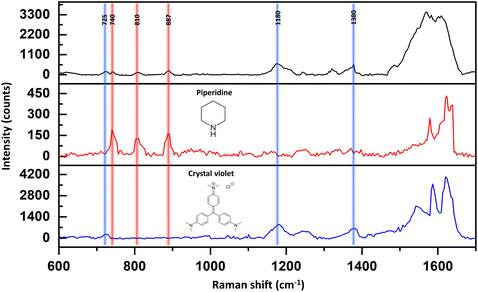
In addition, at the spectral regime above 1400 cm−1, the signal was not stable and reproducible over time. The instability could stem from contamination on the silver surface, primarily caused by the introduction of carbon particles during the sputtering process. However, even though we have achieved highly clean surfaces, we believe it is valuable to have the capability to measure Raman responses of small molecules under realistic laboratory conditions. We argue that our SERS device not only possesses high sensitivity but also selectivity in water. Fig. 3 shows the detection of 10−7 M crystal violet (CV), piperidine, and the mixture (black curve) using our SERS substrate. The vibration mode of the CV that we focused on was 725 cm−1, which is assigned to C–N–C stretching. The band at 1180 cm−1 is attributed to C–H in bending vibrations. The band at 1380 cm−1 is assigned to N-phenyl stretching. In the case of piperidine, we focused on three characteristic peaks as discussed before. All those vibration modes are presented in the Raman spectrum of their mixture. Yet, we are aware of the fact that other vibrational modes may be presented due to hydrogen bonds and re-organization of the analytes in the solutions, which can be a subject for future studies.
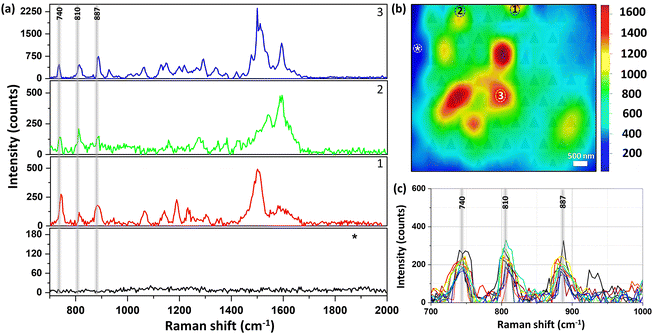
Fig. 4 shows the Raman mapping measurement of 10−8 M piperidine dissolved in ethanol using our plasmonic surfaces (p = 400 nm) as described above (see Fig. 1). Raman mapping was conducted both on the plasmonic array and on the smooth silver surface outside the array. It is noteworthy that negligible to nonexistent signals were detected on the smooth silver surface (Fig. 4a, black curve), even at higher concentrations, as no peaks were observed. However, within the array, clear spectra of piperidine were obtained, exhibiting the three vibration modes of interest (refer to spectra 1–3 and the corresponding map). The mapping presented in Fig. 4b reveals the nonhomogeneous responses of the array, with variations of up to threefold, indicating the presence of hot spots where certain areas exhibit higher Raman responses compared to others. Importantly, we observed the presence of all three vibrational modes in different areas, validating the appropriateness of our selection. In addition, the reproducibility and the repetitively of those selected vibrational modes are notable in the 10 different spectra presented in Fig. 4c (see also S7†). If our fabricated plasmonic surfaces indeed possess hot spots, which are characterized by localized regions of enhanced Raman responses, it is highly probable that these hot spots will also be evident in the second harmonic generation (SHG) process, which is another nonlinear optical phenomenon. Hot spots indicate areas with heightened local electromagnetic field intensities, thus significantly enhancing nonlinear optical processes such as SHG. The hotspots depend on the unique atomic structure of the surface at the specific spot. Fig. 5 showcases the SHG scanning of the identical plasmonic structure with a relatively low laser power of 2 mW using N.A. of 0.5. The efficiency of this process heavily relies on the strength of the local electric field. The regions with triangular cavities experience an intensified electric field enhancement, resulting in enhanced SHG signals compared to the surrounding areas. The nonlinear responses within the array exhibit notable variations, up to a factor of 3, while it is negligible outside the array on the flat silver surface. It is worth noting that the inadequate fabrication or milling of the plasmonic array leads to a drastic suppression of the SHG response as shown in Fig. 5c (see also Fig. S8†). The coexistence of hot spots in both Raman and SHG measurements suggests that the enhanced local electromagnetic fields and nonlinear optical responses are present in the plasmonic structures, further affirming their potential for Raman sensing applications.
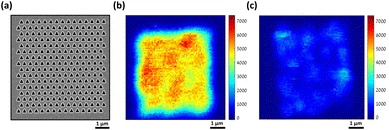 | ||
| Fig. 5 Second harmonic generation (SHG) intensity maps of our plasmonic device. (a) A typical plasmonic array that was used in this study. (b) SHG scanning of (a), showing that the nonlinear responses are high, yet not uniform, in agreement with the Raman mapping. (c) An example of SHG mapping of plasmonic device in which the milling process was not good (see S5†). Laser power = 2 mW, λω = 940 nm. | ||
4. Conclusion
In conclusion, we successfully demonstrated the detection of piperidine both in water and ethanol solutions, down to a concentration of 10−8 M, utilizing a low numerical aperture N.A. of 0.3. This achievement was made possible by using our plasmonic array, which generates enhanced EM fields in the proximity of the array. Our SERS substrate is covered by 5 nm of silica, increasing its stability and durability. In addition, a mixture of two analytes in water was successfully detected down to a concertation of 10−7 M. The utilization of a low N.A. has an economic advantage as it eliminates the need to purchase a high numerical aperture system, thus reducing costs. Furthermore, the mapping image obtained from the Raman and SHG measurements confirms the presence of hot spots in the plasmonic array, validating its potential for enhancing signal intensities. For the specific detection of piperidine, we focused on the following peaks (740, 815, and 887 cm−1), as they remain unaffected by peak overlap resulting from the adsorption of common solvents and other contaminants commonly encountered on surfaces during experiments. This selection ensures reliable and accurate identification of piperidine in the presence of potential interfering factors.Author contributions
A. S. and D. Z. supervised and designed this research. M. H. designed this research, fabricated samples, and performed measurements, and analysis. I. P., M. S. and B. S. did together with M. H. the Raman measurements. A. K. did the SHG measurements. All authors contributed to the interpretation of data. M. H. and A. S. wrote the article.Conflicts of interest
The authors assert they have no competing financial involvement.References
- L. A. Lyon, C. D. Keating, A. P. Fox, B. E. Baker, L. He, S. R. Nicew, S. P. Mulvaney and M. J. Natan, Raman Spectrosc., 1998, 70, 341–362 Search PubMed.
- P. Rostron, S. Gaber and D. Gaber, Raman Spectroscopy, a Review, International Journal of Engineering and Technical Research, 2016, 6, 2454–4698 Search PubMed.
- A. Kudelski, Analytical applications of Raman spectroscopy, Talanta, 2008, 76, 1–8 CrossRef CAS PubMed.
- R. S. Das and Y. K. Agrawal, Raman spectroscopy: Recent advancements, techniques and applications, Vib. Spectrosc., 2011, 57, 163–176 CrossRef CAS.
- X. Xue, Y. Fan, E. Segal, W. Wang, F. Yang, Y. Wang, F. Zhao, W. Fu, Y. Ling, A. Salomon and Z. Zhang, Periodical concentration of surface plasmon polaritons by wave interference in metallic film with nanocavity array, Mater. Today, 2021, 46, 54–61 CrossRef CAS.
- F. Zhao, W. Wang, H. Zhong, F. Yang, W. Fu, Y. Ling and Z. Zhang, Robust quantitative SERS analysis with Relative Raman scattering intensities, Talanta, 2021, 221, 121465 CrossRef CAS PubMed.
- P. A. Mosier-Boss, Review of SERS substrates for chemical sensing, Nanomaterials, 2017, 7, 142 CrossRef PubMed.
- J. Perumal, Y. Wang, A. B. E. Attia, U. S. Dinish and M. Olivo, Towards a point-of-care SERS sensor for biomedical and agri-food analysis applications: A review of recent advancements, Nanoscale, 2021, 13, 553–580 RSC.
- B. Sharma, R. R. Frontiera, A. I. Henry, E. Ringe and R. P. Van Duyne, SERS: Materials, applications, and the future, Mater. Today, 2012, 15, 16–25 CrossRef CAS.
- C. Liu, D. Xu, X. Dong and Q. Huang, A review: Research progress of SERS-based sensors for agricultural applications, Trends Food Sci. Technol., 2022, 128, 90–101 CrossRef CAS.
- W. Wang, S. Kang, W. Zhou and P. J. Vikesland, Environ. Sci.: Nano, 2022, 10, 393–423 RSC.
- D. Antoine, M. Mohammadi, M. Vitt, J. M. Dickie, S. S. Jyoti, M. A. Tilbury, P. A. Johnson, K. E. Wawrousek and J. G. Wall, Rapid, Point-of-Care scFv-SERS Assay for Femtogram Level Detection of SARS-CoV-2, ACS Sens., 2022, 7, 866–873 CrossRef CAS PubMed.
- A. A. Kowalska, SERS Signature of SARS-CoV-2 in Saliva and Nasopharyngeal Swabs : Towards Perspective COVID-19 Point-of-Care Diagnostics, Int. J. Mol. Sci., 2023, 24, 9706 CrossRef PubMed.
- S. M. Mousavi, S. A. Hashemi, V. Rahmanian, M. Y. Kalashgrani, A. Gholami, N. Omidifar and W. H. Chiang, Highly Sensitive Flexible SERS-Based Sensing Platform for Detection of COVID-19, Biosensors, 2022, 12, 466 CrossRef CAS PubMed.
- V. Karunakaran, M. M. Joseph, I. Yadev, H. Sharma, K. Shamna, S. Saurav, R. P. Sreejith, V. Anand, R. Beegum, S. Regi David, T. Iype, K. L. Sarada Devi, A. Nizarudheen, M. S. Sharmad, R. Sharma, R. Mukhiya, E. Thouti, K. Yoosaf, J. Joseph, P. Sujatha Devi, S. Savithri, A. Agarwal, S. Singh and K. K. Maiti, A non-invasive ultrasensitive diagnostic approach for COVID-19 infection using salivary label-free SERS fingerprinting and artificial intelligence, J. Photochem. Photobiol., B, 2022, 234, 112545 CrossRef CAS.
- S. Srivastav, A. Dankov, M. Adanalic, R. Grzeschik, V. Tran, S. Pagel-Wieder, F. Gessler, I. Spreitzer, T. Scholz, B. Schnierle, O. E. Anastasiou, U. Dittmer and S. Schlücker, Rapid and Sensitive SERS-Based Lateral Flow Test for SARS-CoV2-Specific IgM/IgG Antibodies, Anal. Chem., 2021, 93, 12391–12399 CrossRef CAS.
- R. A. Halvorson and P. J. Vikesland, Environ. Sci. Technol., 2010, 44, 7749–7755 CrossRef CAS.
- X. Xu, S. Yang, Y. Wang and K. Qian, Nanomaterial-based sensors and strategies for heavy metal ion detection, Green Analytical Chemistry, 2022, 2, 100020 CrossRef.
- L. Mikac, I. Rigó, L. Himics, A. Tolić, M. Ivanda and M. Veres, Surface-enhanced Raman spectroscopy for the detection of microplastics, Appl. Surf. Sci., 2023, 608, 155239 CrossRef CAS.
- E. Segal, E. Haleva and A. Salomon, Ultrasensitive Plasmonic Sensor for Detecting Sub-PPB Levels of Alachlor, ACS Appl. Nano Mater., 2019, 2, 1285–1293 CrossRef CAS.
- T. Xie, Z. Cao, Y. Li, Z. Li, F. L. Zhang, Y. Gu, C. Han, G. Yang and L. Qu, Highly sensitive SERS substrates with multi-hot spots for on-site detection of pesticide residues, Food Chem., 2022, 381, 132208 CrossRef CAS.
- A. Jiao, X. Dong, H. Zhang, L. Xu, Y. Tian, X. Liu and M. Chen, Construction of pure worm-like AuAg nanochains for ultrasensitive SERS detection of pesticide residues on apple surfaces, Spectrochim. Acta, Part A, 2019, 209, 241–247 CrossRef CAS.
- S. Pang, T. Yang and L. He, Review of surface enhanced Raman spectroscopic (SERS) detection of synthetic chemical pesticides, TrAC, Trends Anal. Chem., 2016, 85, 73–82 CrossRef CAS.
- M. L. Xu, Y. Gao, X. X. Han and B. Zhao, Detection of Pesticide Residues in Food Using Surface-Enhanced Raman Spectroscopy: A Review, J. Agric. Food Chem., 2017, 65, 6719–6726 CrossRef CAS PubMed.
- T. Wang, S. Wang, Z. Cheng, J. Wei, L. Yang, Z. Zhong, H. Hu, Y. Wang, B. Zhou and P. Li, Emerging core–shell nanostructures for surface-enhanced Raman scattering (SERS) detection of pesticide residues, Chem. Eng. J., 2021, 424, 130323 CrossRef CAS.
- Y. Zhu, M. Li, D. Yu and L. Yang, A novel paper rag as ‘D-SERS’ substrate for detection of pesticide residues at various peels, Talanta, 2014, 128, 117–124 CrossRef CAS PubMed.
- Y. Sun, W. Li, L. Zhao, F. Li, Y. Xie, W. Yao, W. Liu and Z. Lin, Simultaneous SERS detection of illegal food additives rhodamine B and basic orange II based on Au nanorod-incorporated melamine foam, Food Chem., 2021, 357, 129741 CrossRef CAS PubMed.
- N. Peica, I. Pavel, S. Cîntă Pînzaru, V. K. Rastogi and W. Kiefer, Vibrational characterization of E102 food additive by Raman and surface-enhanced Raman spectroscopy and theoretical studies, J. Raman Spectrosc., 2005, 36, 657–666 CrossRef CAS.
- N. Peica, C. Lehene, N. Leopold, S. Schlücker and W. Kiefer, Monosodium glutamate in its anhydrous and monohydrate form: Differentiation by Raman spectroscopies and density functional calculations, Spectrochim. Acta, Part A, 2007, 66, 604–615 CrossRef CAS.
- X. Zheng, P. Guo, Y. Zhang, J. Xu, J. Sun and Y. Lei, An ultra sensitive and rapid SERS detection method based on vortex aggregation enhancement effect for anti-infective drug residues detection in water, Anal. Chim. Acta, 2022, 1235, 340539 CrossRef CAS.
- M. Li and X. Zhang, Nanostructure-Based Surface-Enhanced Raman Spectroscopy Techniques for Pesticide and Veterinary Drug Residues Screening, Bull. Environ. Contam. Toxicol., 2021, 107, 194–205 CrossRef CAS PubMed.
- Z. Yang, C. Ma, J. Gu, Y. Wu, C. Zhu, L. Li, H. Gao, W. Yin, Z. Wang and G. Chen, Detection of melamine by using carboxyl-functionalized Ag-COF as a novel SERS substrate, Food Chem., 2023, 401, 134078 CrossRef CAS.
- J. Cheng, P. Wang and X. O. Su, Surface-enhanced Raman spectroscopy for polychlorinated biphenyl detection: Recent developments and future prospects, TrAC, Trends Anal. Chem., 2020, 125, 15836 CrossRef.
- J. Lin, O. U. Akakuru and A. Wu, Advances in surface-enhanced Raman scattering bioprobes for cancer imaging, View, 2021, 2, 10–1002 Search PubMed.
- J. Lin, X. Ma, A. Li, O. U. Akakuru, C. Pan, M. He, C. Yao, W. Ren, Y. Li, D. Zhang, Y. Cao, T. Chen and A. Wu, Multiple valence states of Fe boosting SERS activity of Fe3O4 nanoparticles and enabling effective SERS-MRI bimodal cancer imaging, Fundam. Res., 2022, 10, 2667–3258 Search PubMed.
- X. Huang, B. Sheng, H. Tian, Q. Chen, Y. Yang, B. Bui, J. Pi, H. Cai, S. Chen, J. Zhang, W. Chen, H. Zhou and P. Sun, Real-time SERS monitoring anticancer drug release along with SERS/MR imaging for pH-sensitive chemo-phototherapy, Acta Pharm. Sin. B, 2023, 13, 1303–1317 CrossRef CAS PubMed.
- P. In, Surface Plasmon Properties of Hollow Auagalloyed Triangular Nanoboxes and its Ap-plications in SERS Imiging abd Potential Drug Delivery, Prog. Electromagn. Res., 2012, 128, 35–53 CrossRef.
- Y. Wang, L. Polavarapu and L. M. Liz-Marzán, Reduced graphene oxide-supported gold nanostars for improved SERS sensing and drug delivery, ACS Appl. Mater. Interfaces, 2014, 6, 21798–21805 CrossRef CAS PubMed.
- F. Tian, J. Conde, C. Bao, Y. Chen, J. Curtin and D. Cui, Gold nanostars for efficient in vitro and in vivo real-time SERS detection and drug delivery via plasmonic-tunable Raman/FTIR imaging, Biomaterials, 2016, 106, 87–97 CrossRef CAS PubMed.
- F. Hu, Y. Zhang, G. Chen, C. Li and Q. Wang, Double-walled Au nanocage/SiO2 nanorattles: Integrating SERS imaging, drug delivery and photothermal therapy, Small, 2015, 11, 985–993 CrossRef CAS PubMed.
- R. Vardanyan, Piperidine-based drug discovery, Elsevier, 2017, p. 347 Search PubMed.
- E. Vitaku, D. T. Smith and J. T. Njardarson, Analysis of the structural diversity, substitution patterns, and frequency of nitrogen heterocycles among U.S. FDA approved pharmaceuticals, J. Med. Chem., 2014, 57, 10257–10274 CrossRef CAS PubMed.
- A. Schnabel, B. Athmer, K. Manke, F. Schumacher, F. Cotinguiba and T. Vogt, Identification and characterization of piperine synthase from black pepper, Piper nigrum L., Commun. Biol., 2021, 4, 1–10 CrossRef.
- G. B. Neurath, M. Dünger, F. G. Pein, D. Ambrosius and O. Schreiber, Primary and secondary amines in the human environment, Food Cosmet. Toxicol., 1977, 15, 275–282 CrossRef CAS PubMed.
- U. S. V. Euler, The Occurrence and Determination of Piperidine in Human and Animal Urine1, Acta Pharmacol. Toxicol., 1945, 1, 29–59 CrossRef CAS.
- A. R. Tricker, B. Pfundstein, T. Kalble and R. Preussmann, Secondary amine precursors to nitrosamines in human saliva, gastric juice, blood, urine and faeces, Carcinogenesis, 1992, 13, 563–568 CrossRef CAS.
- Piperidine: Human health tier II assessment, 2016.
- S. Ameen, M. S. Akhtar, H. K. Seo and H. S. Shin, An electrochemical sensing platform based on hollow mesoporous ZnO nanoglobules modified glassy carbon electrode: Selective detection of piperidine chemical, Chem. Eng. J., 2015, 270, 564–571 CrossRef CAS.
- R. Khan, U. Periyayya, G. C. Kim and I. H. Lee, Fabrication of ultra-sensitive piperidine chemical sensor with a direct grown well-aligned ZnO nanorods on FTO substrate as a working electrode, Solid State Sci., 2019, 97, 105986 CrossRef CAS.
- L. A. Sanchez, R. L. Birke and J. R. Lombardi, Surface-enhanced Raman scattering of piperidine. The effect of electrode potential on intensity, J. Phys. Chem., 1984, 88, 1762–1766 CrossRef CAS.
Footnote |
| † Electronic supplementary information (ESI) available: Cross-section and surface morphology analysis, transmission spectra of the arrays, vibrational modes of the piperidine molecule, comparison between Raman spectra of the SERS device (p400 nm), non-well milled arrays: surface morphology and low sensitivity. See DOI: https://doi.org/10.1039/d3en00821e |
| This journal is © The Royal Society of Chemistry 2024 |

