 Open Access Article
Creative Commons Attribution 3.0 Unported Licence
Towards standardized grid emission factors: methodological insights and best practices†
Malte
Schäfer
 *,
Felipe
Cerdas
and
Christoph
Herrmann

Institute of Machine Tools and Production Technology (IWF), Technische Universität Braunschweig, 38106 Braunschweig, Germany. E-mail: malte.schaefer@tu-braunschweig.de; Tel: +49 (0)531 391-7650
First published on 14th March 2024
Abstract
Inconsistent calculation of grid emission factors (EF) can result in widely divergent corporate greenhouse gas (GHG) emissions reports. We dissect this issue through a comprehensive literature review, identifying nine key aspects—each with two to six methodological choices—that substantially influence the reported EF. These choices lead to relative effect variations ranging from 1.2% to 69%. Using Germany's 2019–2022 data as a case study, our method yields results that largely align with prior studies, yet reveal relative effects from 0.4% to 34.6%. This study is the first to methodically unpack the key determinants of grid EF, quantify their impacts, and offer clear guidelines for their application in corporate GHG accounting. Our findings hold implications for practitioners, data publishers, researchers, and guideline-making organizations. By openly sharing our data and calculations, we invite replication, scrutiny, and further research.
Broader contextThis article highlights advancements in standardizing grid emission factors (EF) for corporate greenhouse gas (GHG) accounting, essential for energy and environmental science. Addressing inconsistencies in EF calculations, our study enhances the accuracy of corporate GHG reports. Through a literature review, we identify nine key methodological aspects affecting EFs. We analyze the relevance of these aspects by applying them to Germany's 2019–2022 data. Our recommendations for calculating EFs are based on principles of relevance, completeness, consistency, transparency, and accuracy, aiming to improve corporate GHG accounting reliability. This is crucial as accurate emission reporting becomes mandatory in regions like the European Union and California. Beyond corporate GHG accounting, our insights are significant for applications like electric vehicle charging and hydrogen production. By making our data and calculations available for public scrutiny, we seek to foster collaboration and establish a standardized approach to GHG emission reporting. |
1 Introduction
In the European Union, companies will be legally obliged to report on sustainability in the near future. According to the corporate sustainability reporting directive (CSRD), all large and many small and medium-sized companies have to start doing so, beginning with the financial year 2024.1 Meanwhile, in California, the Climate Corporate Data Accountability Act requires businesses with a revenue of USD 1 billion or more to disclose their greenhouse gas (GHG) emissions by the year 2026.2 In addition, sustainability reporting is not only important for meeting legal requirements, but it can also increase an organization's credibility towards its stakeholders and help legitimize its business operations towards society.One of the key tasks in preparing a sustainability report is the calculation of the company's annual GHG emissions. Given the often substantial electricity usage of companies, understanding the emissions from this sector is crucial for the company and its stakeholders. Many organizations rely on the Greenhouse Gas Protocol for guidelines on GHG accounting,3 and more specifically, its Scope 2 Guidelines for electricity-related emissions.4,5
A vital part of these calculations involves emission factors (EF), which quantify the amount of emissions (e.g. CO2) generated per unit of electricity consumed (e.g. kW h). For example, to assess the company's annual electricity-based GHG emissions, its total annual electricity consumption is multiplied with the EF.
The EF value depends on the mix of primary energy sources used for electricity generation. If a company procures electricity through a specific supplier, then the EF should correspond to that source, known as the market-based approach (cf.Fig. 1b). The market-based approach may take into consideration instruments such as guarantees of origin (GOs), which allow consumers to claim electricity from a specific source. In addition to the market-based approach, a grid-average EF should also be calculated, termed the location-based approach4 (cf.Fig. 1a). The location-based approach does not take into account GOs.
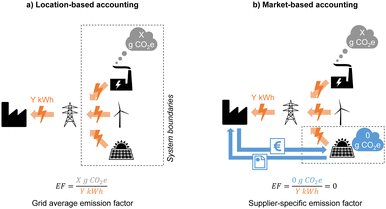 | ||
| Fig. 1 (a) Location-based and (b) market-based accounting, as described in the GHG Protocol Scope 2 Guidelines.4 Location-based accounting relies on a grid-average EF (focus of this study), which reflects the emissions from all generators feeding into a grid. Market-based accounting relies on a supplier-specific EF, which reflects the emissions from the energy supplier that the electricity consumer has a contractual agreement with. | ||
One of the challenges for determining a grid-average EF lies in selecting suitable data sources. To highlight this issue, Fig. 2 presents the 2020 grid-average EF for Germany, as reported by diverse organizations such as the international energy agency (IEA),6,7 the European Environmental Agency (EEA),8 and the German Federal Environmental Agency (UBA).9
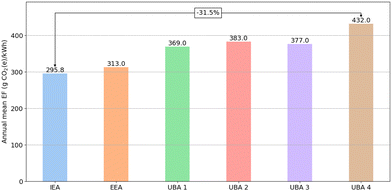 | ||
| Fig. 2 Annual mean grid emission factor for Germany in 2020, according to different sources (IEA,6,7 EEA8 and UBA9). UBA 1–UBA 4 represent four different approaches to calculating a grid EF, varying the aspects impact metric (CO2, CO2-equivalents), inclusion of electricity trade (with, w/o) and system boundaries (direct, life-cycle emissions). UBA 1: CO2, w/o trade, direct emissions; UBA 2: CO2, with trade, direct emissions; UBA 3: CO2e, w/o trade, direct emissions; UBA 4: CO2e, w/o trade, life-cycle emissions. | ||
As illustrated in the figure, the disparity in reported grid EF values is significant, with the lowest being 31.5% smaller than the highest. At least part of this divergence stems from variations in calculation methodologies. For instance, the UBA differentiates between an electricity production (w/o trade) and consumption (with trade) perspective, operational (direct/combustion) versus life-cycle (including upstream and downstream) emissions, and CO2versus CO2-equivalents (including multiple GHG instead of only CO2). The result are UBA values ranging from 369 to 432 g CO2(e) per kW h.
The GHG Protocol Scope 2 Guidance provides limited advice on these methodological aspects, suggesting only that electricity trade across borders should not be factored into the EF.4 It falls short in offering guidance on other aspects or recommending specific data sources. Consequently, an organization aiming to report lower Scope 2 emissions could technically achieve a one-third reduction simply by choosing an EF from the IEA over one from the UBA—without altering its electricity supply or consumption.
Given this landscape, and the increasing importance of reliable data on grid emissions, there is a clear need to scrutinize how grid EFs are calculated. Thus, the question arises: what constitutes a methodology for calculating a grid EF that best represents the emissions caused by the electricity consumer, and should therefore be used in Scope 2 emission accounting? Understanding the methodological aspects and choices involved in determining grid EFs, their impact on the outcomes, and issuing recommendations related to these choices is crucial.
The need for scrutinization leads to three research questions (RQs) guiding this study, each aimed at dissecting the complexities of grid emission factors (EF):
RQ1: Which methodological aspects impact the final grid-average electricity EF?
RQ2: How significant is the effect of various choices within these aspects on the outcome?
RQ3: Which methodological choices best represent the emissions from an organization's electricity consumption?
To address RQ1, we conduct a literature review of studies that calculate grid-average electricity EFs, focusing on key methodological aspects. This review also informs RQ2 as we compile insights from studies that quantify the influence of these methodological aspects. We supplement these findings with our own analysis, examining the impact of various choices within these aspects on Germany's grid EF for the years 2019–2022. Lastly, for RQ3, we offer recommendations on which choices best reflect the emissions of an organization drawing electricity from the grid.
The remaining paper is structured as follows: Section 2 dives into the existing literature to identify and assess the methodological aspects and choices that affect the grid EF calculations. Section 3 outlines the methodology and data used for our own calculations, guided by insights from the literature review. Section 4 presents the results of the analysis. In Section 5, we compare our results to prior studies and official grid EF data sources, and offer recommendations based on our findings. Finally, Section 6 contains our conclusions.
2 State of research
To address RQ1, we undertake a comprehensive literature review, aiming to pinpoint the methodological decisions that influence grid EF calculations. Section 2.1 presents the results of the review, summarized in Section 2.2. For more information on the scope and search process, the reader is referred to the ESI.†2.1 Key methodological aspects
The review produced 48 primary research articles.10–57 The nine aspects that most frequently appeared in these articles and were found to have an impact on the resulting grid EF are:• Choice of impact metric (e.g. CO2vs. multiple GHG)
• Choice of system boundaries (e.g. operational vs. life-cycle)
• Allocation for co-generated heat (e.g. by energy vs. by exergy)
• Treatment of auto-producers (e.g. inclusion vs. exclusion)
• Treatment of auxiliary consumption (incl./excl.)
• Treatment of electricity trading (incl./excl.)
• Treatment of storage cycling losses (incl./excl.)
• Treatment of transformation & distribution (T&D) losses (incl./excl.)
• Choice of temporal resolution (e.g. annual vs. hourly)
In addition to the aspects listed above, there are additional ones that are relevant. These include the spatial and technological resolution, both of which are not covered in this study. The primary reason for excluding these aspects is data availability. The rationale behind this decision is further discussed in the ESI.†
2.2 Summary of the state of research
None of the reviewed studies covers all nine methodological aspects, but each study addresses at least one. Notably, only five studies delve into the role of auto-producers (also referred to as self-generation or distributed generation), whereas 31 consider the impact of electricity trading on grid EF calculations. Table 1 details the magnitude of each aspect's effect, specifically focusing on data from Germany.| Aspect | Abs. effect (g kW−1 h−1) | Rel. effect (%) |
|---|---|---|
| a Countries other than Germany. | ||
| Impact metric | +9…+33 | +1.9…+5.9 |
| System boundaries | +14…+69 | +2.2…+13.2 |
| Co-generation of heat | +54…+60 | +9.9…11.4 |
| Auto-producers | — | — |
| Auxiliary consumption | +20 | +5.1 |
| Electricity trade | −22…+12 | −4.0…+2.9 |
| Storage cycling | +5…+6 | +1.2…+1.3 |
| Transformation & distribution | — | +3.9…+4.2 |
| Temporal resolutiona | — | −28…+69 |
One can observe that changing the impact metric (e.g. from CO2 to one that includes multiple GHG) increases the EF by 9–33 g kW−1 h−1 in absolute terms, which is equivalent to 1.9–5.9% in relative terms. For auto-producers the effect has not been quantified before, while for T&D losses it has only been quantified in relative terms. For the temporal resolution, the effect has only been quantified for countries other than Germany.
The literature review covered in this section addresses RQ1, and to some extent also RQ2: nine methodological aspects influencing the grid EF have been identified, and for most of them, the effect that these aspects have on the grid EF have been quantified. However, no study provides a comprehensive analysis using consistent assumptions and data across all aspects, which is the focus of the subsequent sections.
3 Methodology and data
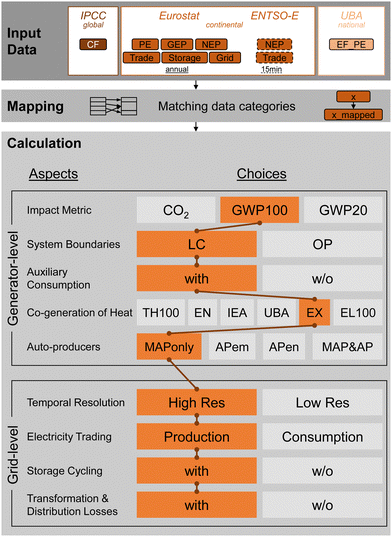
In this section, we describe how we calculate grid EF, considering each of the aspects mentioned in Section 2. The methodology outlined here serves the purpose of calculating a grid EF at a temporal resolution of 15 minutes, while providing multiple choices for each of the methodological aspects reviewed in the previous section. An example of a methodological aspect is impact metric, and an exemplary choice with respect to that aspect is GWP100 (the global warming potential observed over a time period of 100 years). Fig. 3 depicts the calculation procedure. The link to the code and data used in this article can be found in the ESI.†The four primary input data sources are the IPCC (characterization factors), Eurostat (low resolution energy data), ENTSO-E (high resolution energy data) and the UBA (primary energy referenced EF). The input data does not match in all cases with respect to the categories used to describe fuels/energy carriers (e.g. fossil gas is used by ENTSO-E, natural gas by Eurostat). Thus, mapping is required to match the different types of categories. Finally, in multiple calculation steps, the input data is combined and transformed.
The first part of these calculations are conducted at the generator level, i.e. separate EF exist for individual production types (e.g. hard coal, wind onshore). The second part occurs at the grid level, where individual fuels/energy carriers cannot be not distinguished anymore. The following sections describe in more detail each of the three layers of the methodology depicted in Fig. 3.
3.1 Input data
The input data layer encompasses all data necessary for calculating grid EFs. The selection criteria for choosing the input datasets are as follows:• Comprehensive
• Relevant to the German context
• Available for/applicable to the years 2019–2022
• Consistent with all methodological aspects
The ESI,† provides more information on each data source and any necessary pre-mapping adjustments.
3.2 Mapping
The mapping layer aligns disparate data categories from the raw datasets. This harmonization is essential, given that the datasets originate from varied sources with inconsistent categorization. Without mapping, some production types may be over- or underrepresented, or in some cases not counted towards the grid EF at all. This would lead to distorted results.3.3 Calculation
The calculation layer transforms the mapped input data into emission factors through a series of steps. Initial calculations are made at the generator level, producing individual EFs for each production type (fuel/energy carrier). As electricity flows into the grid, subsequent EF calculations are generalized to the grid level. Table 2 summarizes the methodological considerations incorporated into our calculations.| Aspect | Choices |
|---|---|
| TH100: all emissions allocated to heat; EN: emissions allocated by energy; IEA: IEA allocation method; UBA: UBA allocation method; EX: allocation by exergy; EL100: all emissions allocated to electricity; MAPonly: emissions and electricity from main-activity producers only; APem: emissions from all generators (main-activity producers and auto-producers), electricity from main-activity producers only; APen: emissions from main-activity producers only, electricity from all generators; MAP&AP: emissions and energy from all generators. | |
| Impact metric | CO2, GWP100, GWP20 |
| System boundaries | OP, LC |
| Co-generation of heat | TH100, EN, IEA, UBA, EX, EL100 |
| Auto-producers | MAPonly, APem, APen, MAP&AP |
| Auxiliary consumption | With, w/o |
| Electricity trade | With, w/o |
| Storage cycling | With, w/o |
| Transformation & distribution | With, w/o |
| Temporal resolution | High (15 min), low (1 year) |
The choices outlined in Table 2 represent a broad spectrum found in the literature. For Co-generation of heat, we introduce two new choices not previously found in the literature reviewed in this study. EX, or allocation by exergy, is commonly used in CHP units,58,59 even though it was not featured in the literature review. TH100, which allocates all emissions to heat, serves as a counterpoint to EL100, which allocates all emissions to electricity. The ESI,† contains a section breaking down the calculation steps from mapped input data to finalized grid EFs in detail.
4 Results
This section presents the calculated grid emission factors (EF) for Germany for the years 2019–2022. After an overview of the whole dataset, two methodological aspects' influence on the grid EF are explored in detail.4.1 Overview
The entire dataset comprises 323![[thin space (1/6-em)]](https://www.rsc.org/images/entities/char_2009.gif) 149
149![[thin space (1/6-em)]](https://www.rsc.org/images/entities/char_2009.gif) 824 data points. This number represents 2304 grid EF configurations, measured every 15 minutes for four years (equivalent to 140
824 data points. This number represents 2304 grid EF configurations, measured every 15 minutes for four years (equivalent to 140![[thin space (1/6-em)]](https://www.rsc.org/images/entities/char_2009.gif) 256 time steps). Fig. 4 plots the temporal evolution of these grid EFs.
256 time steps). Fig. 4 plots the temporal evolution of these grid EFs.
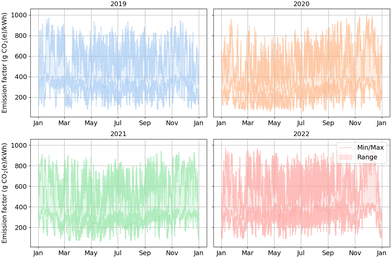 | ||
| Fig. 4 Temporal summary of 2304 unique grid EFs for Germany from 2019 to 2022. The plot captures the minimum, maximum and the range in between for each time point. | ||
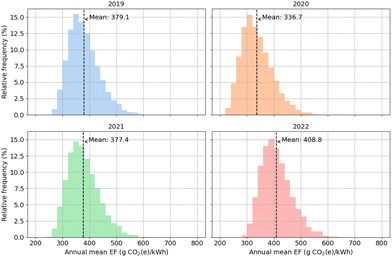
The figure differentiates by year, revealing noticeable temporal variability. Extreme values range from approximately 100 to nearly 1000 g CO2(e) per kW h. However, it is difficult to perceive other temporal trends, e.g. how the EF has evolved over the years or how the different EF configurations are distributed around the mean. For an alternative view, Fig. 5 presents a histogram of the annual mean grid EFs for these configurations.
This histogram is based on the same data as Fig. 4, but depicts the annual average instead of 15 minute values. The plot indicates the share of all 2304 grid EF configurations falling into a certain bin. For example, for 2020, most configurations (>15%) fall into the bin ranging from 300 to 320 g CO2(e) per kW h. Additionally, one can observe that the mean of all configurations shifts over the years, reaching its lowest point in 2020 with 336.7 g CO2(e) per kW h. The data further reveal that the smallest and largest annual mean grid EFs can differ by a factor of three, e.g. ranging from about 200 to 600 g CO2(e) per kW h for the year 2020.
4.2 Influence of individual methodological aspects
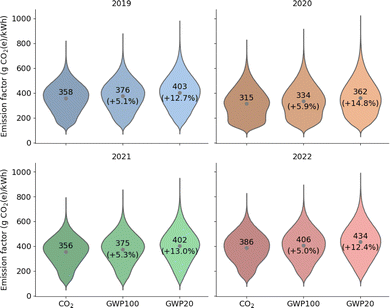
This part analyzes the sensitivity of the grid EF to two out of nine aspects: impact metric and temporal resolution. The remaining aspects are investigated in the ESI.†The analysis reveals that, when broken down by year, a GWP100-based EF tends to be 5.0–5.9% higher than a CO2-based EF. Similarly, a GWP20-based EF exhibits an average increase of 12.4–14.8% over a CO2-based EF. The trend across years is consistent with Fig. 4 and 5: the mean values are lowest for the year 2020 and highest for the year 2022. The fact that GWP20 values are consistently higher than GWP100 values, which are again higher than CO2 values, aligns with our expectations. GWP covers multiple climate-change-relevant substances, while CO2 represents only one. GWP20 has higher characterization factors for methane (CH4) than GWP100, which explains the difference between these two metrics.
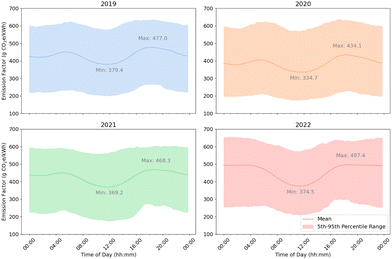
4.2.2.1 Grid EF temporal trends. Germany's grid EF exhibits some typical temporal patterns, depicted in Fig. 7. The plot illustrates how the grid EF varies between years and throughout a typical day. The grid EF configuration is the recommended configuration described in Section 5.2.1.
It is apparent that while the grid EF changes from year to year, reaching a low point in 2020, the pattern throughout a typical day remains relatively stable. The grid EF is typically highest in the morning and in the evening, and lowest at night and around midday. However, the ‘dip’ at night becomes less pronounced and is barely detectable for the year 2022.
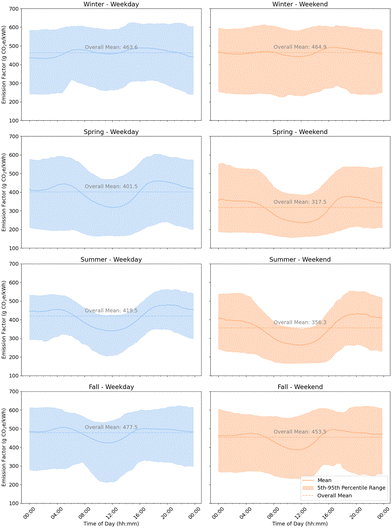
Other temporal patterns besides inter-annual and intraday changed in the grid EF can be observed as well. Fig. 8 illustrates how the grid EF varies throughout the day, distinguishing between weekdays and weekends, as well as between seasons.
The plot demonstrates how the overall mean grid EF tends to be lower on weekends than on weekdays, with the exception of the winter season. The overall mean grid EF further tends to be lowest in the spring and highest in the fall and in the winter. The grid EF variation throughout the day is most pronounced in the spring and in the summer, and least pronounced in the winter. Finally, the range between the 5th and the 95th percentile is notably narrower in the summer than in the winter.
A more detailed analysis of temporal trends, including possible explanations for the patterns described above, and a correlation analysis with overall generation, can be found in the ESI.†
4.2.2.2 Case study. To investigate the effect of the temporal resolution on the emissions of an electricity consumer, we calculate emissions at two different temporal resolutions and compare the results. The two resolutions are one year and 15 minutes. The resolution applies to both the grid EF and the load profile of an exemplary consumer.
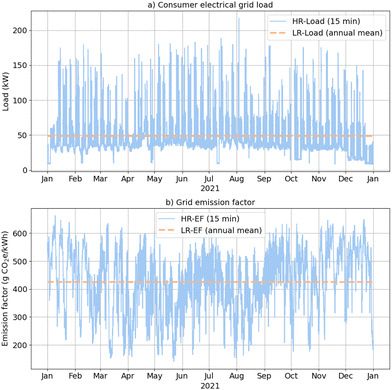
Fig. 9 presents the grid load profile for an exemplary electricity consumer, the Battery Lab Factory (BLB) in Braunschweig, Germany (for details on the BLB, see e.g. ref. 60–62). The figure also displays the corresponding grid EF for Germany during the same time frame, in both high and low temporal resolutions. The configuration chosen for the grid EF is the one recommended in Section 5.2.1.
The grid load profile reveals typical daily and weekly patterns, with a base electrical load ranging from 10 to 40 kWel. Notably, a drop in demand is observed around the holiday season at the end of december. The mean load hovers around 50 kWel, while the grid EF shows significant fluctuations, averaging between 430–440 g CO2e per kW h.
Eqn (1) and (2) detail the computational steps for determining total emissions at both resolutions.
 | (1) |
 | (2) |
5 Discussion
This section begins with a validation of the results (Section 5.1), followed by an outline of recommendations grounded in this study's outcomes (Section 5.2). The ESI,† contains sections that reflect on the limitations of this investigation and suggest avenues for future investigations.5.1 Validation
To benchmark our results and methodology, we compare them with both prior academic investigations (Section 5.1.1) and official grid EF figures (Section 5.1.2).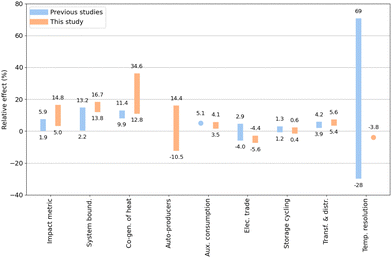 | ||
| Fig. 10 Benchmarking of our findings against prior research (data on prior research from Table 1). The plot delineates the effect range for each methodological aspect, defined as the relative difference in grid EF arising from different choices within each aspect. Note that the reference range (blue bar) for temporal resolution is the only one that does not refer to values for Germany, but other countries. | ||
For impact metric, our findings indicate a larger effect than previous studies. However, when only comparing CO2 and GWP100 (for GWP20, the effect has not been previously quantified), the effect is limited to 5.0–5.9%—well in line with previous results.
For system boundaries, our results skew towards the high end of previous findings. This may be explained by our choice of primary energy emission factors (UBA), for which the upstream emissions make up a relatively large share of the life-cycle emissions compared to other sources.
Emission allocation with respect to Co-generation of heat appears to have a much larger effect in this study than in previous research articles. However, the upper end (34.6% divergence) can be explained by comparing extreme allocation methods (all emissions allocated to heat only (TH100) vs. to electricity output only (EL100)), a comparison not found in previous studies. When comparing only the EN and the EL100 allocation method (as it was done in the only reference study for CHP allocation methods11), the relative differences between the two methods for this study (10.7–12.7%) are comparable to those from the previous study (9.9–11.4%).
For auto-producers, with up to 14.4%, the effect appears to be quite large (no previous studies have quantified this effect). However, the larger effects occur only when either only emissions or only electricity from auto-producers are considered, but not both. The difference between considering neither emissions nor electricity from auto-producers and considering both emissions and electricity from auto-producers is less than 1%.
The results for auxiliary consumption are close to those of previous studies and are based on well-documented data on gross and net electricity production.
The effect size for electricity trade in this study is similar to that documented in other studies. However, not all other studies come to the conclusion that trading reduces Germany's grid EF. The direction of the effect depends on the trade deficit, and on the grid EF of Germany compared to its neighbors' grid EF. A detailed analysis of the effect of electricity trade can be found in the ESI.†
The effect of storage cycling is relatively small for the case of Germany (0.4–0.6%), and does not differ greatly from previous findings (1.2–1.3%)
Transformation & distribution (T&D) losses, approximately in line with previous results, have a notable effect on the grid EF (5.4–5.6% in our study vs. 3.9–4.2% in previous ones).
The effect of changing the temporal resolution cannot be directly compared to other studies, since no previous study quantified the effect for Germany. The largest relative effects of +69% and +36% were observed for countries with a relatively low overall grid EF (Switzerland and France, see ESI†). In these countries, a small absolute effect results in a relatively large relative effect, due to the low baseline. For the UK, with a baseline grid EF closer to that of Germany, Mehlig et al. observe a relative effect of +4.2%. In absolute terms, this is close to the relative effect observed in our study (−3.8%; cf. Section 4.2.2).
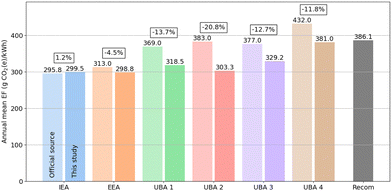 | ||
| Fig. 11 Methodological validation of this study against official grid EF data. The figure contrasts the grid EF figures from IEA, EEA, UBA, (cf.Fig. 2) against the ones generated in this study, all for Germany in 2020. The bars labeled this study (darker shade) are calculated using the methodology from this study and the methodological choices from the respective documentations.7–9 Data labels indicate the annual mean grid EF atop each bar and the relative difference between the official and our calculated figures between bars. The far-right bar, labeled Recom, shows the annual mean grid EF based on our study's recommended configuration of methodological choices (cf. Section 5.2.1). The methodological aspects defining the configurations UBA 1–UBA 4 are provided in the caption of Fig. 2. | ||
Our results align closely with the IEA's grid EF, deviating 1.2%. For the EEA's value, the divergence is larger, with a 4.5% difference. The gap widens considerably with the UBA's figures, with the difference ranging from 11.8% to 20.8%. Aspects that may explain this divergence include differences in the characterization factors (CF) used: the UBA relies on CF from the 5th IPCC assessment report (AR), while this study applies CF from the more recent 6th IPCC AR. Furthermore, the different data sources used may have an influence. The UBA applies a top-down approach, relying on national emission and energy statistics, while this study pursues a bottom-up approach, multiplying energy flows with production-type specific EFs. As illustrated by Unnewehr et al. these two approaches can yield different results.55
Finally, the UBA takes a different approach to electricity trade: an UBA grid EF that takes trade into account is larger than one that does not, while the opposite is true for this study. This effect can be observed when comparing the values for UBA 1 (w/o trade) and UBA 2 (with trade), and explains why the difference between this study and the official value is largest for UBA 2. Following the UBA logic, a country exporting more electricity than it imports (like Germany in 2020) has a higher grid EF after accounting for trade, while the opposite is true for this study. In addition, our study takes into account the grid EF both of the importing and of the exporting nation, while the UBA only considers the EF of the exporting nation (Germany).
5.2 Steering the course: recommendations
In light of the insights gathered throughout our investigation, we articulate a series of recommendations. These not only aim to guide the mechanics of grid EF calculation (Section 5.2.1) thereby addressing RQ3, but also touch upon broader considerations we believe are crucial in the context of calculating grid EF for Scope 2 emission accounting (Section 5.2.2).| Aspect | Recommended choice |
|---|---|
| Impact metric | GWP100 |
| System boundaries | LC |
| Co-generation of heat | EX |
| Auto-producers | MAPonly |
| Auxiliary consumption | With |
| Electricity trade | With |
| Storage cycling | With |
| Transformation & distribution | With |
| Temporal resolution | High (15 min) |
By including all losses and transformations that occur between electricity production and consumption (auxiliary consumption, electricity trade, storage cycling and T&D losses), the recommended configuration considers the consumer perspective relevant for Scope 2 accounting, meeting the relevance, completeness, and consistency criteria. The impact metric GWP100 is more complete than CO2, as it considers multiple GHG, and is consistent with most other studies, which typically use GWP100 over GWP20. Similarly, life-cycle (LC) system boundaries are more complete than operational (OP) boundaries.63 Emission allocation by exergy (EX) reflects the usefulness of the heat and electricity output energy flows better than all other allocation methods, thus meeting the relevance and accuracy criteria. Excluding generators not feeding into the grid (MAPonly) from the grid EF calculation appears to be the most consistent and accurate way of handling auto-producers among all the choices available. Including auto-producers (which do not feed electricity into the grid) in the calculation of a grid EF would be logically inconsistent. Finally, a higher temporal resolution (15 minutes) certainly yields more accurate result than a lower one (e.g. one year). For a nuanced justification of why we believe this set of choices best embodies the five guiding principles, the reader is directed to the ESI.†
However, the necessary data may not be available for all regions to calculate a grid EF with the recommended configuration. This study only demonstrates that the data is available, and the computation is viable for the case of Germany. For regions where some input data are lacking, compromises may be required. For example, should no data on the share of auto-producers in a region exist, then they may be included in the calculation of a grid EF against better knowledge. Fig. 10 can provide orientation on how much neglecting a specific aspect may potentially influence the resulting grid EF.
5.2.2.1 Standardize data categories. Harmonizing the categories for production types between Eurostat and ENTSO-E is advisable. The current disparity in categorization presented challenges in our study and may affect the accuracy of the results.
5.2.2.2 Provide detailed methodologies. Institutions such as the IEA, EEA, and UBA that publish grid EF should also offer comprehensive methodology descriptions. While some existing methodologies are accessible,8,9,64 they occasionally lack detail on essential aspects. Greater transparency and comparability in documentation is recommended (e.g. with regard to the methodological aspects discussed in this study).
5.2.2.3 Open data accessibility. The availability of data is crucial for advancing both scientific research and climate change mitigation efforts. In the case of this study, data availability posed certain challenges. For instance, the IEA offers grid emission factors for global application but restricts access behind a paywall. Similarly, while ENTSO-E provides free data access upon account creation, the licensing terms limit its further dissemination by researchers. Such restrictions can impede the progress of science and the broader climate agenda. Therefore, we advocate for more open licensing arrangements and the removal of paywalls for such vital data.
5.2.2.4 Align methodological approaches. A common methodology for calculating grid EF should be considered by institutions that publish these figures. Such standardization would provide clear benefits for various stakeholders, ranging from power plant operators to electricity consumers. If multiple grid EF figures are to be published, clarity on which metric is appropriate for Scope 2 emission accounting is essential.
5.2.2.5 Disclose source of EF in reports. It is advisable for organizations reporting their Scope 2 emissions to include the grid EF value and source used in their calculations. This information is often missing from current sustainability reports, making it challenging to validate and compare emissions data.
5.2.2.6 Incorporate guidelines into existing protocols. The GHG Protocol and other institutions publishing guidelines on Scope 2 emission accounting could include specific recommendations on grid EF calculation in their Scope 2 Guidelines. This could encompass the nine methodological aspects identified in this study. The currently ongoing review process for the Scope 2 Guidelines may serve as an appropriate context for such an inclusion.
6 Conclusion
This study started with a practical question in mind: how can one accurately account for a company's Scope 2 emissions? Through the course of this research, we have shed light on the methodological aspects and choices involved in calculating grid emission factors, a critical component in Scope 2 accounting.We identified nine key methodological aspects (e.g. impact metric, temporal resolution) that significantly influence the outcome of a grid emission factor. For each of these aspects, we explored various choices (e.g. CO2, GWP100) and quantified their impacts, some of which alter the emission factor by more than 10%. Building upon these findings, we proposed a set of recommended choices grounded in the principles of relevance, completeness, consistency, transparency, and accuracy. These recommendations are aimed at providing a more standardized approach for calculating Scope 2 emissions.
Standardized emission calculations not only benefit corporate GHG accounting, but also other areas where electricity-related emissions are relevant. Energy systems at various scales are increasingly optimized for low emissions,65 as is electric vehicle charging66 and hydrogen production.67 All these applications require a transparent and consistent calculation procedure to determine the resulting emissions.
Moreover, the study underscores the need for further standardization and harmonization in the domain of corporate GHG accounting and reporting. Various stakeholders, including practitioners, researchers, and data providers, can contribute to these standardization efforts.
In a move toward greater transparency and academic rigor, this study makes all its data and calculations openly available in the ESI.† We invite the scholarly community and interested parties to review, reuse, and build upon this foundation, further contributing to the robustness and comparability in the field of Scope 2 emissions accounting.
Author contributions
Conceptualization: M. S., F. C.; data curation: M. S.; formal analysis: M. S., F. C.; funding acquisition: C. H.; investigation: M. S., F. C.; methodology: M. S., F. C.; project administration: M. S.; resources: F. C., C. H.; software: M. S.; supervision: F. C., C. H.; validation: M. S.; visualization: M. S.; writing – original draft: M. S.; writing – review & editing: M. S., F. C., C. H.Conflicts of interest
There are no conflicts to declare.Acknowledgements
The authors thank Benoît Gschwind for his help with the mapping of production type categories. The research that led to the results presented in this paper was funded by the Federal Ministry for Economic Affairs and Climate Action (BMWK) as part of the research project ‘flexess’ under Grant No. 03EI4005A.Notes and references
- Directive (EU) 2022/2464 of the European Parliament and of the Council of 14 December 2022, Official Journal of the European Union, 2022, Available online: https://eur-lex.europa.eu/legal-content/EN/TXT/?uri=CELEX:32022L2464.
- C. S. Legislature, SB-253 Civil law: omnibus, California Legislative Information, 2023, Available online: https://leginfo.legislature.ca.gov/faces/billTextClient.xhtml?bill_id=202320240SB253.
- World Resources Institute, The Greenhouse Gas Protocol: A Corporate Accounting and Reporting Standard: Revised Edition, https://ghgprotocol.org/corporate-standard.
- World Resources Institute, GHG Protocol Scope 2 Guidance: An amendment to the GHG Protocol Corporate Standard, https://ghgprotocol.org/scope-2-guidance.
- T. Hickmann, J. Cleaner Prod., 2017, 169, 94–104 CrossRef.
- International Energy Agency, Electricity Market Report – December 2020, https://www.iea.org/reports/electricity-market-report-december-2020.
- International Energy Agency, Emission Factors 2020: Database Documentation, https://iea.blob.core.windows.net/assets/24422203-de22-4fe6-8d54-f51911addb8b/CO2KWH_Methodology.pdf.
- European Environmental Agency, Greenhouse gas emission intensity of electricity generation in Europe, 2023, https://www.eea.europa.eu/ims/greenhouse-gas-emission-intensity-of-1.
- Umweltbundesamt, Entwicklung der spezifischen Kohlendioxid-Emissionen des deutschen Strommix in den Jahren 1990–2022: CLIMATE CHANGE 20/2023, https://www.umweltbundesamt.de/publikationen/entwicklung-der-spezifischen-treibhausgas-9.
- S. Jiusto, Energy Policy, 2006, 34, 2915–2928 CrossRef.
- S. Soimakallio and L. Saikku, Energy, 2012, 38, 13–20 CrossRef.
- B. Li, Y. Song and Z. Hu, IEEE Trans. Sustain. Energy, 2013, 4, 1100–1107 Search PubMed.
- J.-N. Louis, A. Caló and E. Pongrácz, Smart houses for energy efficiency and carbon dioxide emission reduction, EnErgy, 2014, pp. 44–50.
- E. Maurice, T. Dandres, R. F. Moghaddam, K. Nguyen, Y. Lemieux, M. Cherriet and R. Samson, Proceedings of the 2014 Conference ICT for Sustainability, 2014/08, pp. 290–298.
- M. Messagie, J. Mertens, L. Oliveira, S. Rangaraju, J. Sanfelix, T. Coosemans, J. van Mierlo and C. Macharis, Appl. Energy, 2014, 134, 469–476 CrossRef CAS.
- P. Stoll, N. Brandt and L. Nordström, Energy Policy, 2014, 65, 490–500 CrossRef.
- M.-A. M. Tamayao, J. J. Michalek, C. Hendrickson and I. M. L. Azevedo, Environ. Sci. Technol., 2015, 49, 8844–8855 CrossRef CAS PubMed.
- J. S. Colett, J. C. Kelly and G. A. Keoleian, J. Ind. Ecol., 2016, 20, 29–41 CrossRef CAS.
- L. Ji, S. Liang, S. Qu, Y. Zhang, M. Xu, X. Jia, Y. Jia, D. Niu, J. Yuan, Y. Hou, H. Wang, A. S. Chiu and X. Hu, Appl. Energy, 2016, 184, 751–758 CrossRef.
- C. Roux, P. Schalbart and B. Peuportier, J. Cleaner Prod., 2016, 113, 532–540 CrossRef.
- J. Kono, Y. Ostermeyer and H. Wallbaum, Int. J. Life Cycle Assess., 2017, 22, 1493–1501 CrossRef CAS.
- M. Kopsakangas-Savolainen, M. K. Mattinen, K. Manninen and A. Nissinen, J. Cleaner Prod., 2017, 153, 384–396 CrossRef.
- G. Mills and I. MacGill, Int. J. Sustainable Trans., 2017, 11, 20–30 CrossRef.
- A. Nilsson, P. Stoll and N. Brandt, Resour., Conserv. Recycl., 2017, 124, 152–161 CrossRef.
- S. Qu, S. Liang and M. Xu, Environ. Sci. Technol., 2017, 51, 10893–10902 CrossRef CAS PubMed.
- J. Clauß, S. Stinner, C. Solli, K. B. Lindberg, H. Madsen and L. Georges, Proceedings of the 10th International Conference on System Simulation in Buildings, Liege, Belgium, 2018, pp. 10–12 Search PubMed.
- W. O. Collinge, H. J. Rickenbacker, A. E. Landis, C. L. Thiel and M. M. Bilec, Environ. Sci. Technol., 2018, 52, 11429–11438 CrossRef CAS PubMed.
- L. Fiorini and M. Aiello, Energy Informatics, 2018, 1, 21–34 CrossRef.
- I. Khan, Energy Sources, Part A, 2018, 1–15 Search PubMed.
- A. Milovanoff, T. Dandres, C. Gaudreault, M. Cheriet and R. Samson, Int. J. Life Cycle Assess., 2018, 23, 1981–1994 CrossRef.
- S. Qu, Y. Li, S. Liang, J. Yuan and M. Xu, Environ. Sci. Technol., 2018, 6666–6675 CrossRef CAS PubMed.
- D. Vuarnoz and T. Jusselme, Energy, 2018, 161, 573–582 CrossRef.
- M. Baumann, M. Salzinger, S. Remppis, B. Schober, M. Held and R. Graf, World Electric Vehicle J., 2019, 10, 13 CrossRef.
- N. Baumgärtner, R. Delorme, M. Hennen and A. Bardow, Appl. Energy, 2019, 247, 755–765 CrossRef.
- D. Beloin-Saint-Pierre, P. Padey, B. Périsset and V. Medici, IOP Conf. Series: Earth Environ. Sci., 2019, 323, 012096 Search PubMed.
- J. A. de Chalendar, J. Taggart and S. M. Benson, Proc. Natl. Acad. Sci. U. S. A., 2019, 116, 25497–25502 CrossRef CAS PubMed.
- J. Clauß, S. Stinner, C. Solli, K. B. Lindberg, H. Madsen and L. Georges, Energies, 2019, 12, 1345 CrossRef.
- P. L. Donti, J. Z. Kolter and I. L. Azevedo, Environ. Sci. Technol., 2019, 9905–9914 CrossRef CAS PubMed.
- I. Munné-Collado, F. M. Aprà, P. Olivella-Rosell and R. Villafáfila-Robles, Energies, 2019, 12, 4443 CrossRef.
- M. Rupp, N. Handschuh, C. Rieke and I. Kuperjans, Appl. Energy, 2019, 237, 618–634 CrossRef.
- W. Schram, A. Louwen, I. Lampropoulos and W. van Sark, Energies, 2019, 12, 4440 CrossRef CAS.
- D. Schwabeneder, A. Fleischhacker, G. Lettner and H. Auer, Appl. Energy, 2019, 255, 113860 CrossRef.
- B. Tranberg, O. Corradi, B. Lajoie, T. Gibon, I. Staffell and G. B. Andresen, Energy Strategy Rev., 2019, 26, 100367 CrossRef.
- J. Walzberg, T. Dandres, N. Merveille, M. Cheriet and R. Samson, J. Cleaner Prod., 2019, 240, 118251 CrossRef.
- P. Wörner, A. Müller and D. Sauerwein, Bauphysik, 2019, 41, 17–29 CrossRef.
- F. Braeuer, R. Finck and R. McKenna, J. Cleaner Prod., 2020, 266, 121588 CrossRef CAS.
- F. Neirotti, M. Noussan and M. Simonetti, Energy, 2020, 195, 116974 CrossRef.
- M. Noussan and F. Neirotti, Energies, 2020, 13, 2527 CrossRef CAS.
- A. Papageorgiou, A. Ashok, T. Hashemi Farzad and C. Sundberg, Appl. Energy, 2020, 268, 114981 CrossRef.
- L. Pereira and I. D. Posen, J. Cleaner Prod., 2020, 270, 122514 CrossRef CAS.
- J. A. de Chalendar and S. M. Benson, Appl. Energy, 2021, 304, 117761 CrossRef CAS.
- M. Fleschutz, M. Bohlayer, M. Braun, G. Henze and M. D. Murphy, Appl. Energy, 2021, 295, 117040 CrossRef.
- J. F. Peters, D. Iribarren, P. Juez Martel and M. Burguillo, Sci. Total Environ., 2022, 843, 156963 CrossRef CAS PubMed.
- N. Scarlat, M. Prussi and M. Padella, Appl. Energy, 2022, 305, 117901 CrossRef CAS.
- J. F. Unnewehr, A. Weidlich, L. Gfüllner and M. Schäfer, Cleaner Energy Systems, 2022, 3, 100018 CrossRef.
- D. Blizniukova, P. Holzapfel, J. F. Unnewehr, V. Bach and M. Finkbeiner, Int. J. Life Cycle Assess., 2023, 1–18 Search PubMed.
- D. Mehlig, H. ApSimon and I. Staffell, Transportation Research Part D: Transport and Environment, 2022, 110, 103430 CrossRef.
- S. Choi, S. Kim, M. Jung, J. Lee, J. Lim and M. Kim, Energy, 2022, 240, 122837 CrossRef.
- E. Mollenhauer, A. Christidis and G. Tsatsaronis, Int. J. Renew. Energy Environ. Eng., 2016, 7, 167–176 CrossRef CAS.
- A. Turetskyy, S. Thiede, M. Thomitzek, N. von Drachenfels, T. Pape and C. Herrmann, Energy Technol., 2020, 8, 1900136 CrossRef.
- N. von Drachenfels, P. Engels, J. Husmann, F. Cerdas and C. Herrmann, Proc. CIRP, 2021, 98, 13–18 CrossRef.
- J. Wessel, A. Turetskyy, F. Cerdas and C. Herrmann, Proc. CIRP, 2021, 98, 388–393 CrossRef.
- M. K. Dixit, C. H. Culp and J. L. Fernandez-Solis, RSC Adv., 2014, 4, 54200–54216 RSC.
- Umweltbundesamt, Emissionsbilanz erneuerbarer Energieträger: Bestimmung der vermiedenen Emissionen im Jahr 2020, https://www.umweltbundesamt.de/publikationen/emissionsbilanz-erneuerbarer-energietraeger-2020.
- J. A. de Chalendar, P. W. Glynn and S. M. Benson, Energy Environ. Sci., 2019, 12, 1695–1707 RSC.
- A. R. Holdway, A. R. Williams, O. R. Inderwildi and D. A. King, Energy Environ. Sci., 2010, 3, 1825–1832 RSC.
- M. Millinger, P. Tafarte, M. Jordan, A. Hahn, K. Meisel and D. Thrän, Sustainable Energy Fuels, 2021, 5, 828–843 RSC.
Footnote |
| † Electronic supplementary information (ESI) available. See DOI: https://doi.org/10.1039/d3ee04394k |
| This journal is © The Royal Society of Chemistry 2024 |

