 Open Access Article
Organometallic Ru(II), Rh(III) and Re(I) complexes of sterane-based bidentate ligands: synthesis, solution speciation, interaction with biomolecules and anticancer activity†
Tamás
Pivarcsik
 ab,
Márton A.
Kiss
 b,
Uroš
Rapuš
 c,
Jakob
Kljun
 c,
Gabriella
Spengler
 ad,
Éva
Frank
 b,
Iztok
Turel
 c and
Éva A.
Enyedy
 *ab
*ab
aMTA-SZTE Lendület Functional Metal Complexes Research Group, Department of Molecular and Analytical Chemistry, Interdisciplinary Excellence Centre, University of Szeged, Dóm tér 7-8., H–6720 Szeged, Hungary. E-mail: enyedy@chem.u-szeged.hu
bDepartment of Molecular and Analytical Chemistry, University of Szeged, Dóm tér 7-8., H–6720 Szeged, Hungary
cFaculty of Chemistry and Chemical Technology, University of Ljubljana, Večna pot 113, SI–1000 Ljubljana, Slovenia
dDepartment of Medical Microbiology, Albert Szent-Györgyi Health Center and Albert Szent-Györgyi Medical School, University of Szeged, Semmelweis u. 6, H-6725 Szeged, Hungary
First published on 14th February 2024
Abstract
In this study, we present the synthesis, characterization and in vitro cytotoxicity of six organometallic [Ru(II)(η6-p-cymene)(N,N)Cl]Cl, [Rh(III)(η5-C5Me5)(N,N)Cl]Cl and [Re(I)(CO)3(N,N)Cl] complexes, in which the (N,N) ligands are sterane-based 2,2′-bipyridine derivatives (4-Me-bpy-St-OH, 4-Ph-bpy-St-OH). The solution chemical behavior of the ligands and the complexes was explored by UV-visible spectrophotometry and 1H NMR spectroscopy. The ligands and their Re(I) complexes are neutral at pH = 7.40; this contributes to their highly lipophilic character (log![[thin space (1/6-em)]](https://www.rsc.org/images/entities/char_2009.gif) D7.40 > +3). The Ru(II) and Rh(III) half-sandwich complexes are much more hydrophilic, and this property is greatly affected by the actual chloride ion content of the medium. The half-sandwich Ru and Rh complexes are highly stable in 30% (v/v) DMSO/water (<5% dissociation at pH = 7.40); this is further increased in water. The Rh(III)(η5-C5Me5) complexes were characterized by higher water/chloride exchange and pKa constants compared to their Ru(II)(η6-p-cymene) counterparts. The Re(I)(CO)3 complexes are also stable in solution over a wide pH range (2–12) without the release of the bidentate ligand; only the chlorido co-ligand can be replaced with OH− at higher pH values. A comprehensive discussion of the binding affinity of the half-sandwich Ru(II) and Rh(III) complexes toward human serum albumin and calf-thymus DNA is also provided. The Ru(II)(η6-p-cymene) complexes interact with human serum albumin via intermolecular forces, while for the Rh(III)(η5-C5Me5) complexes the coordinative binding mode is suggested as well. They are also able to interact with calf-thymus DNA, most likely via the coordination of the guanine nitrogen. The Ru(II)(η6-p-cymene) complexes were found to be the most promising among the tested compounds as they exhibited moderate-to-strong cytotoxic activity (IC50 = 3–11 μM) in LNCaP as well as in PC3 prostate cells in an androgen receptor-independent manner. They were also significantly cytotoxic in breast and colon adenocarcinoma cancer cell lines and showed good selectivity for cancer cells.
D7.40 > +3). The Ru(II) and Rh(III) half-sandwich complexes are much more hydrophilic, and this property is greatly affected by the actual chloride ion content of the medium. The half-sandwich Ru and Rh complexes are highly stable in 30% (v/v) DMSO/water (<5% dissociation at pH = 7.40); this is further increased in water. The Rh(III)(η5-C5Me5) complexes were characterized by higher water/chloride exchange and pKa constants compared to their Ru(II)(η6-p-cymene) counterparts. The Re(I)(CO)3 complexes are also stable in solution over a wide pH range (2–12) without the release of the bidentate ligand; only the chlorido co-ligand can be replaced with OH− at higher pH values. A comprehensive discussion of the binding affinity of the half-sandwich Ru(II) and Rh(III) complexes toward human serum albumin and calf-thymus DNA is also provided. The Ru(II)(η6-p-cymene) complexes interact with human serum albumin via intermolecular forces, while for the Rh(III)(η5-C5Me5) complexes the coordinative binding mode is suggested as well. They are also able to interact with calf-thymus DNA, most likely via the coordination of the guanine nitrogen. The Ru(II)(η6-p-cymene) complexes were found to be the most promising among the tested compounds as they exhibited moderate-to-strong cytotoxic activity (IC50 = 3–11 μM) in LNCaP as well as in PC3 prostate cells in an androgen receptor-independent manner. They were also significantly cytotoxic in breast and colon adenocarcinoma cancer cell lines and showed good selectivity for cancer cells.
Introduction
The adverse effects induced by clinically used anticancer drugs have attracted interest towards more effective and selective chemotherapeutic candidates.1 Considerable attention has been paid to the potential of organometallic complexes in the field of cancer treatment.2–8 Notably, numerous piano-stool half-sandwich Ru(η6-p-cymene) (RuCym) and Rh(η5-C5Me5) (RhCp*) complexes of bidentate ligands, often with a chlorido co-ligand, were reported to exhibit remarkable anticancer activity.3–5,8–14 In these complexes, the bidentate ligand affects many characteristics, such as stability in solution, the actual charge and lipophilicity at a particular pH; consequently, it has an impact on the pharmacokinetic properties and ultimately on the anticancer activity. Ligands bearing the (N,N) or (N,O) donor set, such as oligopyridines or 8-hydroxyquinolines, respectively, are recognized as strong chelators of half-sandwich RuCym and RhCp* triaqua cations. Certain complexes incorporating these bidentate ligands have displayed remarkable cytotoxicity;10,15–17 moreover, selected compounds within this class have been reported to exhibit multidrug resistant selective toxicity.15 Recently, as additional alternatives, Re(I) tricarbonyl (Re(CO)3) complexes have also emerged as effective anticancer agents. In these rhenium complexes, the coordination sphere is also often saturated by a bidentate ligand as well as a monodentate co-ligand such as Cl− or H2O.18–23 It has been reported that 2,2′-bipyridine (bpy) and 1,10-phenanthroline (phen) and their derivatives bearing the (N,N) donor set are efficient chelators for Re(I) as well. Therefore, a plethora of Re(I) complexes of these oligopyridine ligands have been developed and evaluated in various cancer cell lines, showing moderate-to-strong cytotoxic activity;18–22 and among them some representatives also demonstrated a noticeable in vivo anticancer effect.20 Furthermore, similar complexes were tested as antiviral agents, and many of them were effective against SARS-CoV-2.24,25Indeed, modification of the ligand scaffold and the metal center in these organometallic complexes results in altered physicochemical properties that greatly affect their bioactivity. Molecular hybridization, when two or more structural entities are combined, serves as a valuable tool in the design of innovative drug molecules to explore the chemical space and to obtain compounds with improved pharmacological properties. Combining a metal binding ligand with a lipophilic sterane backbone proved to be a beneficial approach, as exemplified by our previous works on thiosemicarbazones and hydroxamic acids.26–31 Namely, many sterane-based compounds were reported to display remarkable anticancer activity on various cancer cell lines, and some of them were characterized by negligible hormonal effects due to a hormone receptor-independent mechanism of action.32–36 In the case of estrogen derivatives, scaffold substitution at position 2 of the A-ring was observed to result in derivatives with negligible binding to estrogen receptors.33–35 These steroid derivatives exert a direct anticancer effect by inhibiting angiogenesis, tubulin polymerization or upregulating apoptotic pathways.36 The aim of the current work is to develop organometallic complexes that target hormone-independent cancers and are free of unwanted hormonal effects. In our previous work, we also showed that by introducing pyridine- and quinoline-based ring systems into the A-ring of the estrone and 5α-androstane skeletons, compounds with noticeable anticancer activity on various cancer cell lines could be obtained, including gynecological and androgen receptor (AR)-positive prostate cancer cells.37,38 It is worth mentioning that A-ring fused quinoline derivatives of the androgen 5α-dihydrotestosterone were found to be cytotoxic to human cervical and breast cancer cells.38
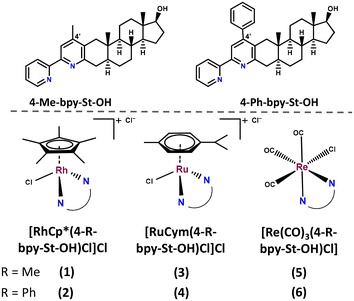
Metal complexation has an impact on aqueous solubility, lipophilicity and albumin binding ability, thus on the pharmacokinetic properties, and even novel mechanisms of action may be induced due to the presence of the metal center. Herein, four cytotoxic sterane-based ligands containing a bidentate chelating moiety with the (N,N) (4-Me-bpy-St-OH, 4-Ph-bpy-St-OH in Chart 1) or (N,O) donor set (4-Me-2pp-St-OH, 4-Ph-2pp-St-OH in Table S1†) were selected to prepare their RuCym, RhCp* and Re(CO)3 organometallic complexes.
Ligands bearing a methyl substituent at the 4′-position (4-Me-bpy-St-OH, 4-Me-2pp-St-OH) showed weak-to-moderate antagonistic properties, while ligands with a phenyl group (4-Ph-bpy-St-OH, 4-Ph-2pp-St-OH) were reported to have moderate-to-strong agonistic activities towards AR.37 The ligands were moderately cytotoxic on AR-positive prostate cancer cells.37 We also report the characterization of these ligands in terms of their proton dissociation processes and lipophilicity, in addition to the synthesis of the half-sandwich RuCym, RhCp* and Re(CO)3 complexes of the 2,2-bipyridyl-type 4-Me-bpy-St-OH and 4-Ph-bpy-St-OH ligands (Chart 1). The anticancer activity of the novel metal complexes was also evaluated in various human cancer and non-cancerous fibroblast cell lines along with the investigation of their solution speciation and interaction with human serum albumin (HSA) and calf-thymus DNA (ct-DNA).
Results and discussion
Synthesis of the organometallic complexes
The synthesis of the four differently substituted steroid hybrid ligands was previously reported, namely the 2-ethylidene and 2-phenylidene derivatives of 5α-dihydrotestosterone were reacted with the corresponding α-pyridinium methyl ketone salts in the Kröhnke pyridine cyclization reaction.37 These compounds are able to chelate metal ions either due to the built-in 2,2-bipyridyl or 2-(pyridin-2-yl)phenol unit via the (N,N) and (N,O) donor sets, respectively. Regrettably, the isolation of complexes with the latter type of ligand could not be implemented. In general, ligands that exhibit the (N,O) binding mode, such as 8-hydroxyquinolines or 2-picolinates, tend to form highly stable half-sandwich Ru or Rh complexes;39–41 however, the 2-(pyridin-2-yl)phenolate-type ligands form a six-membered chelate ring, which is not favored. The crystal structures of Pd(II), Cu(II) and half-sandwich Rh(III) complexes with similar ligands showed rotation around the C–C bond connecting the two aromatic rings, resulting in a significant deviation from a planar structure;42–45 this most probably contributes to the decreased stability compared to the complexes formed with bpy-type ligands.The synthesis of the RhCp* and RuCym complexes of 4-Me-bpy-St-OH and 4-Ph-bpy-St-OH (1–4) was carried out in CH2Cl2 using half an equivalent of the corresponding dimeric metal precursor [M(arene)Cl2]2 (Chart 2). After 1–2 h, the progress of the reaction was checked with thin layer chromatography (TLC), and no free ligand was detected. Then the solution was partly evaporated, and precipitation was completed with n-hexane. The formed brown (RuCym) or orange (RhCp*) solid complexes with general formula [M(arene)(L)Cl]Cl (where L: 4-Me-bpy-St-OH, 4-Ph-bpy-St-OH) were filtered, washed with n-hexane and dried.
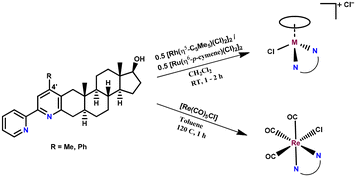 | ||
| Chart 2 Reaction scheme for the synthesis of complexes 1–6. The composition of complexes 1–6 is given in Table 1. | ||
The preparation of the [Re(CO)3(L)Cl] (where L: 4-Me-bpy-St-OH (5), 4-Ph-bpy-St-OH (6)) complexes was performed in toluene using equivalent amounts of the ligand and the metal precursor [Re(CO)5Cl] at 120 °C for 1 h (Chart 2). In the case of 4-Me-bpy-St-OH, the complex precipitated and was then filtered from the mother solution. The complex of 4-Ph-bpy-St-OH was soluble in toluene; therefore, the solvent was completely evaporated, then the resulting residue was dissolved in CH2Cl2 and the yellow product was precipitated with n-hexane.
The isolated complexes were characterized by 1H and 13C NMR spectroscopy in CDCl3, electrospray ionization mass spectrometry (ESI-MS) (see Fig. S1–S18 and data in the ESI†) and X-ray crystallography for the fac-[Re(CO)3(4-Me-bpy-St-OH)Cl] (5) complex (see the next section). The formation of the complexes ([M(arene)(L)Cl]Cl (1–4) and fac-[Re(CO)3(L)Cl]) (5, 6) is fully supported by ESI-MS and NMR experiments. The main peaks in the ESI-MS spectra showed the formation of the corresponding positively charged chlorido complexes in the case of half-sandwich complexes, while the formation of fac-[Re(CO)3(L)CH3CN] acetonitrilo complexes could be observed due to the binding of acetonitrile used as a solvent for ESI-MS measurements (see ESI†). The integrals and positions of all resonance signals in 1H and 13C NMR spectra corresponded well with expectations, i.e. all ligands were coordinated to the metal center and no unbound ligand or metal precursor peaks could be identified. In the NMR spectra of the complexes, two sets of signals were found, indicating the formation of stereoisomers. The metal ion can act as a stereocenter, and the bidentate ligands are enantiomerically pure and asymmetric. Mainly the peaks belonging to the aromatic part of the ligand in the downfield region (e.g. C(5′)H, C(3′′)H, C(6′′)H) as well as methyl groups (C(1′′′)H, C(18)H, C(19)H) in all cases, and the aliphatic C(1)H; C(4)H protons, and protons of the Cp*/Cym arene ring in the case of the half-sandwich complexes, were sensitive to the formation of the stereoisomeric pairs. The ratios of the isomers of each complex (based on integrals of selected peaks in the spectra) are collected in Table 1. Interestingly, for the RhCp* and Re(CO)3 complexes, the ratio of these diastereomers was close to 50![[thin space (1/6-em)]](https://www.rsc.org/images/entities/char_2009.gif) :
:![[thin space (1/6-em)]](https://www.rsc.org/images/entities/char_2009.gif) 50, while for the RuCym complexes, bearing the asymmetric p-cymene ring, the formation of one of the isomers was more favorable. For the positively charged half-sandwich complexes, considering the reaction conditions, the chloride ion is the most likely counter ion and the coordination of a chlorido co-ligand is also suggested. To prove our assumption, quantitative-NMR (via the use of maltol as an internal standard, Fig. S19†) was applied in the case of the RhCp*–4-Me-bpy-St-OH (1) complex. Based on the integrals of the peaks in the 1H NMR spectra, the estimated molar mass of the complex is ∼796. This value exceeds the theoretical molar mass (725.64, with Cl− counter ion), suggesting the presence of four additional crystal water molecules in addition to the chloride ions.
50, while for the RuCym complexes, bearing the asymmetric p-cymene ring, the formation of one of the isomers was more favorable. For the positively charged half-sandwich complexes, considering the reaction conditions, the chloride ion is the most likely counter ion and the coordination of a chlorido co-ligand is also suggested. To prove our assumption, quantitative-NMR (via the use of maltol as an internal standard, Fig. S19†) was applied in the case of the RhCp*–4-Me-bpy-St-OH (1) complex. Based on the integrals of the peaks in the 1H NMR spectra, the estimated molar mass of the complex is ∼796. This value exceeds the theoretical molar mass (725.64, with Cl− counter ion), suggesting the presence of four additional crystal water molecules in addition to the chloride ions.
| Complex | Ratio of isomers (%) | |
|---|---|---|
| 1 | [RhCp*(4-Me-bpy-St-OH)Cl]Cl | 55![[thin space (1/6-em)]](https://www.rsc.org/images/entities/char_2009.gif) : :![[thin space (1/6-em)]](https://www.rsc.org/images/entities/char_2009.gif) 45 45 |
| 2 | [RhCp*(4-Ph-bpy-St-OH)Cl]Cl | 55![[thin space (1/6-em)]](https://www.rsc.org/images/entities/char_2009.gif) : :![[thin space (1/6-em)]](https://www.rsc.org/images/entities/char_2009.gif) 45 45 |
| 3 | [RuCym(4-Me-bpy-St-OH)Cl]Cl | 62![[thin space (1/6-em)]](https://www.rsc.org/images/entities/char_2009.gif) : :![[thin space (1/6-em)]](https://www.rsc.org/images/entities/char_2009.gif) 38 38 |
| 4 | [RuCym(4-Ph-bpy-St-OH)Cl]Cl | 67![[thin space (1/6-em)]](https://www.rsc.org/images/entities/char_2009.gif) : :![[thin space (1/6-em)]](https://www.rsc.org/images/entities/char_2009.gif) 33 33 |
| 5 | [Re(CO)3(4-Me-bpy-St-OH)Cl]Cl | 50![[thin space (1/6-em)]](https://www.rsc.org/images/entities/char_2009.gif) : :![[thin space (1/6-em)]](https://www.rsc.org/images/entities/char_2009.gif) 50 50 |
| 6 | [Re(CO)3(4-Ph-bpy-St-OH)Cl]Cl | 55![[thin space (1/6-em)]](https://www.rsc.org/images/entities/char_2009.gif) : :![[thin space (1/6-em)]](https://www.rsc.org/images/entities/char_2009.gif) 45 45 |
Structural characterization of the fac-[Re(CO)3(4-Me-bpy-St-OH)Cl] (5) complex by X-ray crystallography
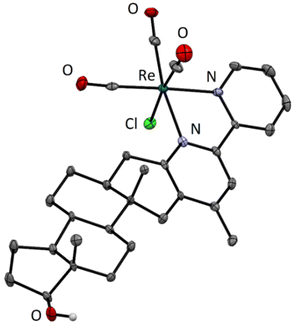
Crystallization was successful with only one compound. Single crystals of fac-[Re(CO)3(4-Me-bpy-St-OH)Cl] (5) suitable for X-ray diffraction analysis were grown from a solution of the previously isolated complex dissolved in a mixture of acetone and water. The solution was left at 4 °C to slowly evaporate to yield bright yellow crystals (Fig. S20†). The crystal structure of the organometallic compound was determined by X-ray crystallography (Table S2†). The complex adopts the expected octahedral geometry with the rhenium tricarbonyl fragment in the facial configuration and the remaining three coordination sites are occupied by the chlorido ligand and the (N,N) metal binding moiety of the sterane-based ligand (Fig. 1). The hydroxyl group on the steroidal scaffold remains in neutral form and the crystal packing is stabilized by an O–H⋯Cl hydrogen bond.Solution chemical properties of the compounds
![[thin space (1/6-em)]](https://www.rsc.org/images/entities/char_2009.gif) D7.40) determined. The notably high log
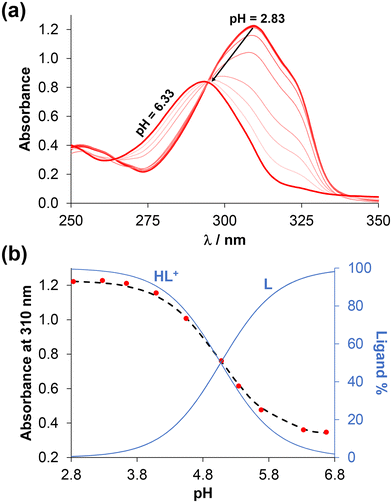
D7.40) determined. The notably high log![[thin space (1/6-em)]](https://www.rsc.org/images/entities/char_2009.gif) D values (>+3) indicate the strongly lipophilic nature of these compounds, which consequently results in limited aqueous solubility. To investigate the proton dissociation processes of the ligands, UV-visible (UV-vis) and 1H NMR spectroscopic titrations were attempted in 30% (v/v) DMSO/water medium instead of water. (The presence of DMSO was required due to the poor aqueous solubility of the compounds.) Representative UV-vis and 1H NMR spectra are shown in Fig. 2 and S21† for 4-Me-bpy-St-OH recorded at different pH values.
D values (>+3) indicate the strongly lipophilic nature of these compounds, which consequently results in limited aqueous solubility. To investigate the proton dissociation processes of the ligands, UV-visible (UV-vis) and 1H NMR spectroscopic titrations were attempted in 30% (v/v) DMSO/water medium instead of water. (The presence of DMSO was required due to the poor aqueous solubility of the compounds.) Representative UV-vis and 1H NMR spectra are shown in Fig. 2 and S21† for 4-Me-bpy-St-OH recorded at different pH values.
![[thin space (1/6-em)]](https://www.rsc.org/images/entities/char_2009.gif) D values at pH = 7.40. {I = 0.10 M KCl; T = 25.0 °C} (Uncertainties (SD) are shown in parentheses. pKa: N1′bpyH+)
D values at pH = 7.40. {I = 0.10 M KCl; T = 25.0 °C} (Uncertainties (SD) are shown in parentheses. pKa: N1′bpyH+)
Notably, with the performed titrations, reliable proton dissociation constants (pKa) were obtained exclusively for this compound. In the case of 4-Ph-bpy-St-OH, the pKa could be obtained with greater inaccuracy by 1H NMR titration due to the formation of some precipitates, while the predicted data are provided for the compounds bearing (N,O) donors due to their limited solubility (Table S1†).
In the fully protonated state, ligands 4-Me-bpy-St-OH and 4-Ph-bpy-St-OH possess three dissociable protons, namely the alcoholic OH group, the pyridinium nitrogen (N1′) adjacent to the sterane scaffold, and an additional pyridinium nitrogen (N1′′) in the 4-Me/Phe-bpy-St-OH compounds. Based on the spectral changes (Fig. 2 and S15†), only one pKa value could be calculated for 4-Me-bpy-St-OH (Table 2); this was attributed to the pyridinium nitrogen (N1′). Deprotonation of the other pyridinium nitrogen (N1′′) most likely occurs at pH < 2, while the OH group of the sterane D-ring stays protonated over the entire pH range studied. Upon deprotonation of the pyridinium nitrogen (N1′) at pH > 6, the ligand becomes neutral, resulting in the formation of precipitate at the higher concentrations used for the 1H NMR titrations. This is evidenced by the lower signal-to-noise ratio in spectra (Fig. S21†). For 4-Ph-bpy-St-OH, precipitation was also observed during UV-vis titrations, even at a concentration as low as 6 μM. A somewhat lower value was obtained for this ligand by 1H NMR titration compared to 4-Me-bpy-St-OH; this is consistent with the electron donating effect (+I) of the methyl group compared to the phenyl substituent with −I and +M effects.
Based on the experimentally determined and/or predicted proton dissociation constants, it can be concluded that all of the ligands studied predominantly exist in their neutral form at pH = 7.40.
![[thin space (1/6-em)]](https://www.rsc.org/images/entities/char_2009.gif) K′(H2O/Cl−) values) and higher pKa (H2O) values for the aqua co-ligand when compared to the RuCym complexes.10,15,16
K′(H2O/Cl−) values) and higher pKa (H2O) values for the aqua co-ligand when compared to the RuCym complexes.10,15,16
In order to characterize the stability of the complexes in solution, UV-vis spectrophotometric measurements were performed in 30% (v/v) DMSO/H2O at 0.1 M KCl ionic strength. Initially, the complex formation rates were examined at pH = 4 (Fig. S22†), revealing that equilibrium was reached rather slowly (<10 h) in the case of RuCym compared to RhCp* (∼30 min). To determine the formation constants, individual samples were collected and spectra were recorded as soon as equilibrium was reached (waiting time for RhCp*: 30 min and for RuCym: 24 h; pHmax ∼ 8). The representative spectral series for the RhCp*–4-Me-bpy-St-OH (1![[thin space (1/6-em)]](https://www.rsc.org/images/entities/char_2009.gif) :
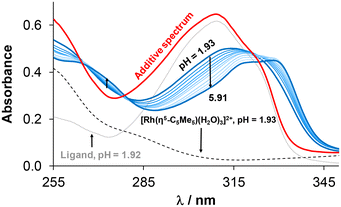
:![[thin space (1/6-em)]](https://www.rsc.org/images/entities/char_2009.gif) 1) system is shown in Fig. 3 (or for the RuCym–4-Me-bpy-St-OH system in Fig. S23†), indicating complex formation with increasing pH. Analysis of the collected spectra revealed that the complex was already present to a significant extent (∼57%) at the initial acidic pH (1.93). This was evident from the distinct difference observed between the spectrum of the complex and the additive spectrum of the triaqua cation and the ligand at the same pH. Further spectral changes were observed by increasing the pH, as the complex formation was completed. Formation constants (log
1) system is shown in Fig. 3 (or for the RuCym–4-Me-bpy-St-OH system in Fig. S23†), indicating complex formation with increasing pH. Analysis of the collected spectra revealed that the complex was already present to a significant extent (∼57%) at the initial acidic pH (1.93). This was evident from the distinct difference observed between the spectrum of the complex and the additive spectrum of the triaqua cation and the ligand at the same pH. Further spectral changes were observed by increasing the pH, as the complex formation was completed. Formation constants (log![[thin space (1/6-em)]](https://www.rsc.org/images/entities/char_2009.gif) β (M(arene)L)) (Table 3) were calculated for the RhCp* and RuCym complexes of 4-Me-bpy-St-OH based on the spectra recorded using the program HypSpec.46 (Due to the precipitation of the unbound phenyl-substituted ligand under the same conditions, formation constants could not be calculated for its half-sandwich complexes.) Using the obtained log
β (M(arene)L)) (Table 3) were calculated for the RhCp* and RuCym complexes of 4-Me-bpy-St-OH based on the spectra recorded using the program HypSpec.46 (Due to the precipitation of the unbound phenyl-substituted ligand under the same conditions, formation constants could not be calculated for its half-sandwich complexes.) Using the obtained log![[thin space (1/6-em)]](https://www.rsc.org/images/entities/char_2009.gif) β (M(arene)(L)) constants, concentration distribution curves were calculated (Fig. S24†), and it could be concluded that the two complexes possessed considerably high stability in solution. Namely, the extents of dissociation are ∼2% and ∼4–5% for RhCp* and RuCym complexes at pH = 7.40 and 30 μM concentration; these values indicate slightly higher stability of the former compound. Notably, the extent of complex dissociation is <0.1% for the reference RhCp* and RuCym complexes formed with bpy in water at similar pH and concentration.15,48 However, the solution stability of the tested steroidal complexes is also probably higher in water than in the presence of 30% DMSO, since the latter solvent can act as a competitive ligand.
β (M(arene)(L)) constants, concentration distribution curves were calculated (Fig. S24†), and it could be concluded that the two complexes possessed considerably high stability in solution. Namely, the extents of dissociation are ∼2% and ∼4–5% for RhCp* and RuCym complexes at pH = 7.40 and 30 μM concentration; these values indicate slightly higher stability of the former compound. Notably, the extent of complex dissociation is <0.1% for the reference RhCp* and RuCym complexes formed with bpy in water at similar pH and concentration.15,48 However, the solution stability of the tested steroidal complexes is also probably higher in water than in the presence of 30% DMSO, since the latter solvent can act as a competitive ligand.
![[thin space (1/6-em)]](https://www.rsc.org/images/entities/char_2009.gif) β (M(arene)L)), pKa (H2O) and H2O/chloride exchange constants (log
β (M(arene)L)), pKa (H2O) and H2O/chloride exchange constants (log![[thin space (1/6-em)]](https://www.rsc.org/images/entities/char_2009.gif) K′ (H2O/Cl−)) of organometallic half-sandwich complexes 1–4. {I = 0.10 M KCl or 0.20 M KNO3; T = 25.0 °C}
K′ (H2O/Cl−)) of organometallic half-sandwich complexes 1–4. {I = 0.10 M KCl or 0.20 M KNO3; T = 25.0 °C}
| Method | Complex | log![[thin space (1/6-em)]](https://www.rsc.org/images/entities/char_2009.gif) β (M(arene)L)a β (M(arene)L)a |
pKa (H2O)b | log![[thin space (1/6-em)]](https://www.rsc.org/images/entities/char_2009.gif) K′ (H2O/Cl−)b K′ (H2O/Cl−)b |
|---|---|---|---|---|
| Uncertainties (SD) are shown in parentheses.a Determined in 30% (v/v) DMSO/H2O (I = 0.10 M KCl).b Determined in H2O (I = 0.20 M KNO3).c Could not be determined due to precipitation. | ||||
| pH-Pot. | 1 | — | 8.98(0.08) | — |
| UV-vis | 1 | 8.07(0.07) | 9.02(0.02) | 3.04(0.04) |
| 2 | —c | 8.83(0.02) | 2.90(0.07) | |
| 3 | 7.18(0.07) | — | 2.17(0.03) | |
| 4 | —c | — | 2.17(0.10) | |
| 1H NMR | 3 | — | 7.60(0.04) | — |
| 4 | — | 7.46(0.04) | — | |
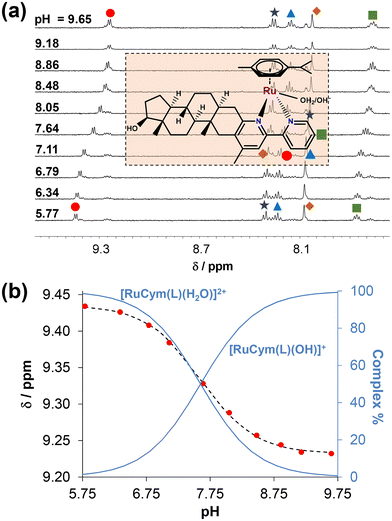
Based on our data, the prepared half-sandwich complexes 1–4 exhibit enhanced aqueous solubility compared to the free ligands, mainly due to their positively charged state (+2) in the absence of chloride ions. Thus, the deprotonation process of the coordinated aqua co-ligand in the [M(arene)(L)H2O]2+ complexes was investigated in water (without DMSO) using 0.20 M KNO3 to maintain a constant ionic strength. This approach was also adopted to obtain comparable data to analogous bpy-type complexes.15,48 For this purpose, UV-vis titrations for the RhCp* and 1H NMR titrations for the RuCym complexes could be performed in water. Moreover, the good aqueous solubility of the [RhCp*(4-Me-bpy-St-OH)Cl]Cl (1) complex enabled the execution of pH-potentiometric titrations as well (Fig. S25†). Representative UV-vis spectra shown for the RhCp* complexes (1, 2) in Fig. S26† reveal significant spectral changes between pH = 7.3 and 10.5. Meanwhile, for the RuCym complexes (3, 4), the deprotonation process was not accompanied by adequate changes in the UV-vis spectra (for 3 see Fig. S27†); therefore, 1H NMR titrations were performed for the [RuCym(4-Me-bpy-St-OH)Cl]Cl (3) complex, as shown in Fig. 4. Based on collected titration data, pKa (H2O) values (where Ka: proton dissociation constant of the coordinated water in the complex) were calculated for all four complexes (Table 3). Comparing these constants, we can conclude that the pKa values of RhCp* complexes are ca. 1.5 logarithm units higher than those of the RuCym complexes. A similar trend in pKa values was reported for the bpy complexes as well (RhCp*: 8.61, RuCym: 7.48).15,48 The presence of the phenyl substituent at the 4′-position slightly reduced the pKa values compared to the methyl group. Based on the obtained constants, the formation of mixed-hydroxido [M(arene)(L)OH]+ species, which are generally considered kinetically more inert and biologically inactive species, is insignificant at pH = 7.40 for the RhCp* complexes. In contrast, it accounts for 40–47% for the RuCym complexes. Nevertheless, in the presence of chloride ions, it is assumed that the pKa of the complexes is considerably higher due to coordination of the chlorido co-ligand, which inhibits the deprotonation process, resulting in the presence of much less mixed-hydroxido complex at pH = 7.40.15,48
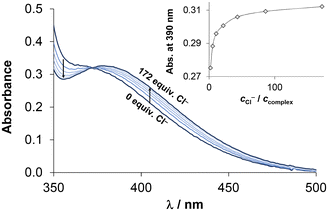
Chloride ions are found at varying concentrations in different biofluids, with levels of 100, 24 and 4 mM in blood serum, the cytosol and the nucleus, respectively. The presence of chlorido complexes is influenced by both the actual concentration of chloride ions and the affinity of the complexes towards this endogenous anion. It affects the actual charge, thus, the lipophilicity of the complexes as well. Consequently, exchange of coordinated water with the chlorido ligand was also investigated by UV-vis spectrophotometry, as shown in Fig. 5 for the [RhCp*(4-Me-bpy-St-OH)Cl]Cl (1) complex. Based on the spectral changes, log![[thin space (1/6-em)]](https://www.rsc.org/images/entities/char_2009.gif) K′ (H2O/Cl−) equilibrium constants were calculated at pH = 7.40 and 5.50 (Table 3). The latter slightly acidic environment was needed for the RuCym complexes to avoid the formation of mixed hydroxido species. Nevertheless, the spectral changes of the charge transfer bands were minimal, which posed a challenge for accurately determining the exchange constant (Fig. S28†). Given that the pKa of coordinated water is higher for the [RhCp*(arene)(L)H2O]2+ complexes, herein pH = 7.40 could be utilized. Generally, RhCp* complexes showed a higher affinity for chloride ions than the RuCym compounds; this is in good agreement with analogous complexes. No significant differences were found for the methyl- and phenyl-substituted complexes. It is noteworthy that the tested complexes display stronger chloride ion affinity than the reference bpy complexes (log
K′ (H2O/Cl−) equilibrium constants were calculated at pH = 7.40 and 5.50 (Table 3). The latter slightly acidic environment was needed for the RuCym complexes to avoid the formation of mixed hydroxido species. Nevertheless, the spectral changes of the charge transfer bands were minimal, which posed a challenge for accurately determining the exchange constant (Fig. S28†). Given that the pKa of coordinated water is higher for the [RhCp*(arene)(L)H2O]2+ complexes, herein pH = 7.40 could be utilized. Generally, RhCp* complexes showed a higher affinity for chloride ions than the RuCym compounds; this is in good agreement with analogous complexes. No significant differences were found for the methyl- and phenyl-substituted complexes. It is noteworthy that the tested complexes display stronger chloride ion affinity than the reference bpy complexes (log![[thin space (1/6-em)]](https://www.rsc.org/images/entities/char_2009.gif) K′ (H2O/Cl−) for RhCp*: 2.58; for RuCym: 1.83).15,48
K′ (H2O/Cl−) for RhCp*: 2.58; for RuCym: 1.83).15,48
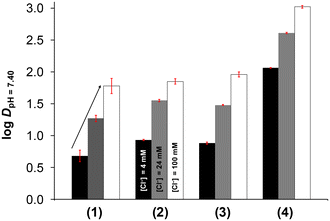
When the chlorido complex is formed from the aqua complex, the actual charge changes from +2 to +1, which probably affects the lipophilicity of the complexes. Therefore, the lipophilicity at different concentrations of chloride ions was assessed in a similar manner to that described in our previous reports, taking into account the diverse chloride ion concentrations found in the biofluids.49–51 For this purpose, n-octanol/buffered aqueous solution partitioning was performed at pH = 7.40. The determined log![[thin space (1/6-em)]](https://www.rsc.org/images/entities/char_2009.gif) DpH=7.40 values are depicted in Fig. 6. It is clearly seen that the lipophilicity is significantly decreased upon complexation compared to the corresponding ligand (see data in Table 2), although the complexes still retain a certain degree of lipophilic character (log
DpH=7.40 values are depicted in Fig. 6. It is clearly seen that the lipophilicity is significantly decreased upon complexation compared to the corresponding ligand (see data in Table 2), although the complexes still retain a certain degree of lipophilic character (log![[thin space (1/6-em)]](https://www.rsc.org/images/entities/char_2009.gif) DpH=7.40 values between +0.68 and +3.02). On one hand, the RuCym complexes (3, 4) are more lipophilic than the RhCp* complexes (1, 2) and the complexes with the phenyl-substituted ligands (2, 4) are more lipophilic than their methyl-bearing counterparts (1, 3). On the other hand, the lipophilicity was increased upon increasing the chloride ion concentration, as expected.
DpH=7.40 values between +0.68 and +3.02). On one hand, the RuCym complexes (3, 4) are more lipophilic than the RhCp* complexes (1, 2) and the complexes with the phenyl-substituted ligands (2, 4) are more lipophilic than their methyl-bearing counterparts (1, 3). On the other hand, the lipophilicity was increased upon increasing the chloride ion concentration, as expected.
The lipophilicity was also examined for the Re(CO)3 complexes and log![[thin space (1/6-em)]](https://www.rsc.org/images/entities/char_2009.gif) DpH=7.40 = +3.29 ± 0.11 and +3.68 ± 0.16 were determined for the complexes of 4-Me-bpy-St-OH (5) and 4-Ph-bpy-St-OH (6), respectively. As expected, these neutral and intact complexes (vide infra) are highly lipophilic, given that no ligand-exchange process occurs in aqueous solution at pH = 7.40 during the monitored period.
DpH=7.40 = +3.29 ± 0.11 and +3.68 ± 0.16 were determined for the complexes of 4-Me-bpy-St-OH (5) and 4-Ph-bpy-St-OH (6), respectively. As expected, these neutral and intact complexes (vide infra) are highly lipophilic, given that no ligand-exchange process occurs in aqueous solution at pH = 7.40 during the monitored period.
The stability of the complexes was further investigated over time using spectrophotometric measurements at pH = 7.40 in various relevant biological matrices such as modified phosphate saline (PBS’) buffer, Roswell Park Comprehensive Cancer Center (RPMI-1640) medium and blood serum. Representative spectra are shown in Fig. S29† for the [RhCp*(4-Ph-bpy-St-OH)Cl]Cl (2) complex. The complex was found to be stable in PBS’ as no spectral changes were observed over 72 h. In contrast, significant spectral changes were observed in RPMI-1640. These changes, as well as the fact that there was no ligand precipitation (if the ligand dissociates from the complex, it is almost insoluble in water), suggest that the co-ligands Cl− or H2O may undergo substitution with a component present in the medium. In blood serum, no significant changes were observed within the first few hours, however, later on, precipitation occurred. In addition to the appearance of precipitate, the characteristics of the spectra exhibited some minor changes under the conditions used, indicating interaction with the serum component(s). The behaviour of the other RhCp* and RuCym complexes was found to be similar in these solutions.
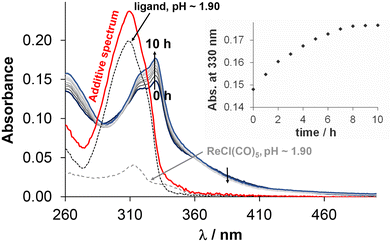
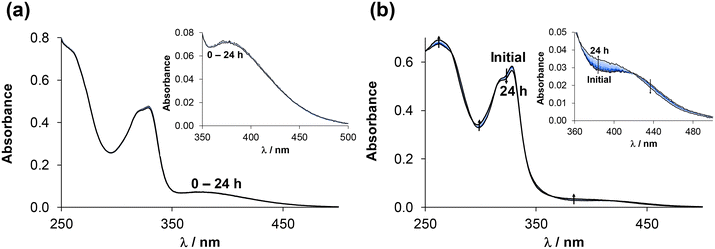
Due to the low solubility of Re(CO)3 containing complexes, stability measurements had to be carried out in 30% and 60% (v/v) DMSO or DMF/H2O mixtures, respectively. For these experiments, the selected fac-[Re(CO)3(4-Me-bpy-St-OH)Cl] complex (5) was dissolved in different media. At first, the stability of the complex in 30% (v/v) DMSO/H2O was monitored over time at different pH values by UV-vis spectrophotometry (Fig. 7 (pH = 2); S30† (pH = 5.1, 7.0, 12.2)). At pH ∼ 2, the spectral changes are significant, however, complex dissociation required for the release of unbound 4-Me-bpy-St-OH is unlikely, since the additive spectrum of the ligand and the metal precursor differs significantly from that recorded after 10 h, when equilibrium is reached. At higher pH values, the changes are minor; however, these suggest some kind of change in the coordination sphere of the complex (Fig. S30†). Most probably, the solvents H2O (or OH−) and DMSO are able to coordinate to the metal ion, replacing the chloride co-ligand in a slow process. Based on these results, we continued our investigation with DMF, as a weaker coordinating solvent than DMSO. Although the differences between spectra recorded in DMF and DMSO are minor (Fig. S31†), the coordination of DMSO cannot be ruled out. Therefore, the stability of the Re complexes was also monitored in 30% (v/v) DMF/H2O over time at different pH values (for 5 see Fig. S32†) for comparison. Based on analysis of the spectral changes in different media at different pH values, it can be assumed that the chlorido co-ligand can be replaced by DMSO and OH−. However, Cl−/H2O exchange is unlikely, as the spectrum remains unchanged even at a large excess of chloride ions (∼2600×) at pH = 7.40 (Fig. S33†). In conclusion, complex 5 is stable over a broad pH range (2–12) and the exchange of Cl− for OH− can occur under alkaline conditions.
Interaction of the complexes with biological macromolecules
At first, global binding was investigated using UV-vis spectrophotometry at a 1![[thin space (1/6-em)]](https://www.rsc.org/images/entities/char_2009.gif) :
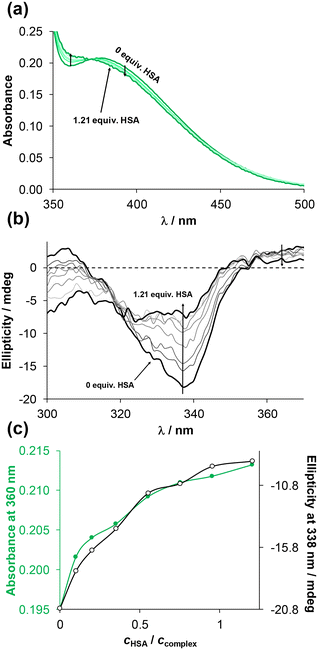
:![[thin space (1/6-em)]](https://www.rsc.org/images/entities/char_2009.gif) 2 ratio of HSA to complex (see Fig. S34† for 4-Me-bpy-St-OH complexes 1 and 3). The time-dependent spectral changes within 24 h were more significant for complex 1. Changes within the charge-transfer region suggest coordinative binding to HSA, as reported for similar half-sandwich complexes.50,53 Then UV-vis spectra of the complexes were recorded at various complex-to-HSA ratios (see Fig. 8a for complex 2). Taking advantage of the stereocenters present in the ligands, circular dichroism (CD) spectra were also measured for the same samples, and changes to the negative CD band at ∼338 nm were monitored (see Fig. 8b for complex 2).
2 ratio of HSA to complex (see Fig. S34† for 4-Me-bpy-St-OH complexes 1 and 3). The time-dependent spectral changes within 24 h were more significant for complex 1. Changes within the charge-transfer region suggest coordinative binding to HSA, as reported for similar half-sandwich complexes.50,53 Then UV-vis spectra of the complexes were recorded at various complex-to-HSA ratios (see Fig. 8a for complex 2). Taking advantage of the stereocenters present in the ligands, circular dichroism (CD) spectra were also measured for the same samples, and changes to the negative CD band at ∼338 nm were monitored (see Fig. 8b for complex 2).
Both the UV-vis and CD spectra of complex 2 showed substantial changes until the addition of ca. 1 equiv. HSA (Fig. 8c). In contrast, the UV-vis spectra of [RuCym(4-Me-bpy-St-OH)Cl]Cl complex (3) showed negligible changes in the presence of HSA (Fig. S35a†).
However, the positive CD band exhibited slight hypsochromic and hypochromic shifts (Fig. S35b†), suggesting a weak interaction with HSA that does not lead to a significant change in the charge-transfer bands observed in the UV-vis spectrum. Notably, the reference RuCym–bpy complex showed no considerable binding toward HSA, as reported in our previous work.53
Therefore, for a more comprehensive and detailed understanding of the binding interactions, ultrafiltration–UV-vis and capillary zone electrophoresis (CZE) measurements were conducted. It was found that the compounds adhered to the filter to a significant extent (∼66%), making it challenging to obtain quantitative information about binding based on the ultrafiltration experiments (Fig. S36†). The UV-vis spectra of the ultrafiltered complexes 1 and 3 in the presence and absence of HSA were compared to each other and to the non-filtered reference sample. The concentration of both complexes in the filtrate is significantly lower in the presence of HSA compared to the sample without the protein. Interestingly, the fraction of protein-bound complex is very similar (∼20%) for both complexes. The fraction of unbound complex can also be monitored by CZE in the case of coordinative binding. The protein-bound complex migrates together with the protein, resulting in a single merged peak in the electropherogram, and the peak of the unbound complex appears separately. Therefore, the concentration of unbound complex can be measured using external calibration. Dissociation of the complex can also be detected upon binding to the protein, which leads to the appearance of peaks corresponding to the free ligand and metal precursor. Selected electropherograms for the 2–HSA system are shown in Fig. 9. The unbound, positively charged (+1 or +2) complex migrates at 2.3–2.4 min, while HSA and the HSA–bound complex appear at ca. 4 min.
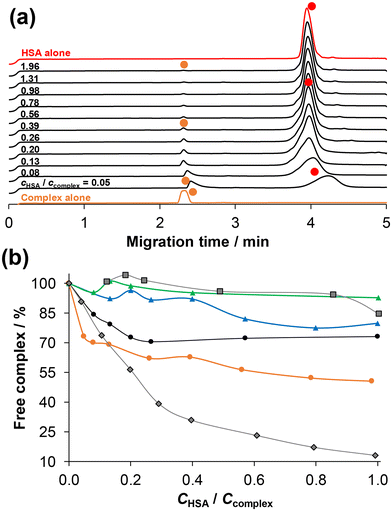 | ||
| Fig. 9 (a) Electropherograms for both the [RhCp*(4-Ph-bpy-St-OH)Cl]Cl complex (2) and HSA alone and together at various complex-to-HSA ratios using 24 h incubation time. Symbols indicate the free complex (orange circles) and HSA & HSA–complex adduct (red circles). Peaks belonging to the free complex were assigned based on their UV-vis spectra measured at the peak maxima. (b) Fraction of free (unbound) complex for [RhCp*(4-Ph-bpy-St-OH)Cl]Cl (2) (orange circle), for [RhCp*(4-Me-bpy-St-OH)Cl]Cl (1) (black circles), [RuCym(4-Me-bpy-St-OH)Cl]Cl (3) (green triangles), and [RuCym(4-Ph-bpy-St-OH)Cl]Cl (4) (blue triangles) under the same conditions. For comparison, data for RuCym–bpy (black squares) and RhCp*–bpy (black rhombs) complexes are also shown.53 (The solid lines are not fitted curves; they are used to enhance the visual separation between the rows of data points.) {cHSA = 20 μM; ccomplex = 10–400 μM; pH = 7.40 (PBS’ buffer); λ = 200 nm; T = 25.0 °C.} | ||
Based on the electropherograms, the molar fraction (%) of free complex was plotted against the cHSA/ccomplex ratio in Fig. 9b. This reveals that the RhCp* complexes (1, 2) show higher affinity towards HSA than RuCym complexes (3, 4). The phenyl-substituted complexes (2, 4) bind to the protein to a greater extent compared to the methyl-substituted analogues (1, 3), most probably due to the higher lipophilicity of the former complexes, which suggests the role of intermolecular binding. At a 1![[thin space (1/6-em)]](https://www.rsc.org/images/entities/char_2009.gif) :
:![[thin space (1/6-em)]](https://www.rsc.org/images/entities/char_2009.gif) 1 ratio of HSA to complex, approximately 50% of complex 2 is bound to the protein, which is ∼25–30 and 20% for 1 and 4, respectively. The binding affinity of the reference RhCp*–bpy complex, which is known to interact with HSA via a coordination bond, is remarkably higher than the investigated RhCp* complexes based on CZE data (Fig. 9b).53 (However, CZE has limitations when the binding is based on intermolecular interactions.)
1 ratio of HSA to complex, approximately 50% of complex 2 is bound to the protein, which is ∼25–30 and 20% for 1 and 4, respectively. The binding affinity of the reference RhCp*–bpy complex, which is known to interact with HSA via a coordination bond, is remarkably higher than the investigated RhCp* complexes based on CZE data (Fig. 9b).53 (However, CZE has limitations when the binding is based on intermolecular interactions.)
In order to further explore the binding events occurring within the hydrophobic pockets of HSA, spectrofluorometric measurements were carried out. These hydrophobic binding sites, also referred to as Sudlow's sites I and II, can accommodate structurally diverse molecules, mainly through intermolecular binding. The interaction of the analogous RhCp*–bpy and RuCym–bpy complexes to HSA was already characterized in our previous work.53 The RuCym–bpy complex showed no considerable binding during the monitored period (24 h), while log![[thin space (1/6-em)]](https://www.rsc.org/images/entities/char_2009.gif) K′ ∼ 3.5–4.1 conditional stability constants could be calculated for the RhCp*–bpy complex at both binding sites.53 Fluorescence quenching curves of the Trp-214 residue of HSA in the presence of the title complexes were recorded and quenching constants, which were considered as conditional binding constants, were computed using the HypSpec46 program (Table 4). Spectra recorded for complexes 1–4 confirmed their interaction with HSA (see representative spectra of 1 in Fig. S37†). Interestingly, not only the RhCp* complexes (1 and 2) but also the RuCym complexes (3 and 4, Fig. S37b†) showed similar affinity to the protein, based on the computed conditional binding constants (Table 4). Even though similar binding strengths were obtained for the four complexes, different binding modes were suggested based on our further studies. Probably, the RuCym complexes can only bind to HSA through intermolecular binding interactions due to the sterane backbone, while the RhCp* complexes showed coordinative binding as well. To support this suggestion, N-methyl-imidazole (MIM) was selected as the HSA binding model for further investigation. It was reported that half-sandwich RuCym and RhCp* complexes mostly preferred to bind to the His-imidazole residue of the protein.54–58
K′ ∼ 3.5–4.1 conditional stability constants could be calculated for the RhCp*–bpy complex at both binding sites.53 Fluorescence quenching curves of the Trp-214 residue of HSA in the presence of the title complexes were recorded and quenching constants, which were considered as conditional binding constants, were computed using the HypSpec46 program (Table 4). Spectra recorded for complexes 1–4 confirmed their interaction with HSA (see representative spectra of 1 in Fig. S37†). Interestingly, not only the RhCp* complexes (1 and 2) but also the RuCym complexes (3 and 4, Fig. S37b†) showed similar affinity to the protein, based on the computed conditional binding constants (Table 4). Even though similar binding strengths were obtained for the four complexes, different binding modes were suggested based on our further studies. Probably, the RuCym complexes can only bind to HSA through intermolecular binding interactions due to the sterane backbone, while the RhCp* complexes showed coordinative binding as well. To support this suggestion, N-methyl-imidazole (MIM) was selected as the HSA binding model for further investigation. It was reported that half-sandwich RuCym and RhCp* complexes mostly preferred to bind to the His-imidazole residue of the protein.54–58
![[thin space (1/6-em)]](https://www.rsc.org/images/entities/char_2009.gif) K′Q) for site I of HSA, using the HypSpec program for calculations.46 {pH = 7.40, T = 25.0 °C}
K′Q) for site I of HSA, using the HypSpec program for calculations.46 {pH = 7.40, T = 25.0 °C}
| 1 | 2 | 3 | 4 | |
|---|---|---|---|---|
log![[thin space (1/6-em)]](https://www.rsc.org/images/entities/char_2009.gif) K′Q K′Q |
4.5 ± 0.1 | 4.5 ± 0.1 | 4.7 ± 0.1 | 4.6 ± 0.1 |
At first, UV-vis spectral changes of the complexes were followed over time in the presence of 10 equiv. MIM (Fig. S38†). It was found that the RuCym complexes showed no considerable binding to MIM, while the spectral changes for RhCp* complexes were similar to those in the presence of HSA. This assumption was also confirmed by 1H NMR spectroscopic measurements using 1![[thin space (1/6-em)]](https://www.rsc.org/images/entities/char_2009.gif) :
:![[thin space (1/6-em)]](https://www.rsc.org/images/entities/char_2009.gif) 1 and 1
1 and 1![[thin space (1/6-em)]](https://www.rsc.org/images/entities/char_2009.gif) :
:![[thin space (1/6-em)]](https://www.rsc.org/images/entities/char_2009.gif) 2 ratios of complex to MIM. The lack of appearance of a new set of peaks (aromatic region) associated with the ternary RuCym complex for 3 clearly indicates the lack of interaction with MIM, in contrast to the RhCp* complex (1), for which 1H NMR data enable the calculation of the conditional stability constant of log
2 ratios of complex to MIM. The lack of appearance of a new set of peaks (aromatic region) associated with the ternary RuCym complex for 3 clearly indicates the lack of interaction with MIM, in contrast to the RhCp* complex (1), for which 1H NMR data enable the calculation of the conditional stability constant of log![[thin space (1/6-em)]](https://www.rsc.org/images/entities/char_2009.gif) K′ = 3.1 ± 0.2 for the formation of the RhCp*–4-Me-bpy-St-OH–MIM ternary complex (Fig. S39†). Similar binding strengths were also confirmed by UV-vis and CD spectroscopy for 1 and 2, respectively, yielding log
K′ = 3.1 ± 0.2 for the formation of the RhCp*–4-Me-bpy-St-OH–MIM ternary complex (Fig. S39†). Similar binding strengths were also confirmed by UV-vis and CD spectroscopy for 1 and 2, respectively, yielding log![[thin space (1/6-em)]](https://www.rsc.org/images/entities/char_2009.gif) K′ = 3.04 ± 0.05 for the latter complex (Fig. S40†). It is noteworthy that the stability constant can be higher (log
K′ = 3.04 ± 0.05 for the latter complex (Fig. S40†). It is noteworthy that the stability constant can be higher (log![[thin space (1/6-em)]](https://www.rsc.org/images/entities/char_2009.gif) K′ = 4.25 ± 0.04 for 1) for incubation times longer than 24 h, since the reaction is barely completed after 24 h (Fig. S38†). In summary, it was concluded that both RuCym and RhCp* complexes of steroidal ligands containing the (N,N) donor sets were able to interact with HSA. However, the binding mechanisms are different; namely, in the case of the RuCym complexes, the interaction occurs exclusively through intermolecular forces, whereas for RhCp* complexes the coordination of HSA to the metal centre is also likely.
K′ = 4.25 ± 0.04 for 1) for incubation times longer than 24 h, since the reaction is barely completed after 24 h (Fig. S38†). In summary, it was concluded that both RuCym and RhCp* complexes of steroidal ligands containing the (N,N) donor sets were able to interact with HSA. However, the binding mechanisms are different; namely, in the case of the RuCym complexes, the interaction occurs exclusively through intermolecular forces, whereas for RhCp* complexes the coordination of HSA to the metal centre is also likely.
As the changes in the UV-vis spectra were minor and uncharacteristic, the direct reaction of the complexes with ct-DNA was further investigated by CD spectroscopy at various complex-to-ct-DNA ratios. ct-DNA can be characterized by a well-defined CD signal, involving a negative (∼247 nm) and a positive (∼281 nm) signal, caused by the helical B conformation and nucleobase stacking, respectively.61 Changes to the CD spectra were monitored by gradually increasing the concentration of the complex.
Addition of ca. 0.3 equiv. metal complexes 3 or 1 caused slight changes to the spectra; these are more significant in the negative band, indicating minor changes in the conformation of ct-DNA (Fig. S42†). It is noteworthy that due to the high absorbance of the solution, no reliable spectra could be obtained at ccomplex > 30 μM, and the spectra had to be corrected with the intrinsic ellipticity of the complexes at each point by external calibration.
The slope of this calibration spectrum was also slightly different from those of samples containing the complex together with ct-DNA (Fig. S36c and d†). This finding also suggests that the interaction indeed occurs between the complex and the biomolecule for both compounds 1 and 3. It is reported that the increasing ellipticity of the positive band and the appearance of a negative induced band at ca. 300 nm may indicate a change in nucleobase stacking interactions; these changes are often related to an intercalative binding mode of the investigated compound.62,63 In our case, none of them were observed; consequently, intercalation is unlikely and based on our findings on the interaction with guanine, binding via coordination mode is more probable.
Evaluation of the in vitro cytotoxic activity of the ligands and complexes 1–6
As previously reported, conjugation of estrone and 5α-androstane skeletons with pyridine- and quinoline-based ring systems resulted in compounds with remarkable anticancer activity in AR-positive prostate and breast cancer cells.37,38 On one hand, the ligands alone (Chart 1) exhibited 63–74% cell viability at a concentration of 20 μM in the AR-positive LNCaP cell lines, indicating moderate cytotoxic activity, with IC50 values significantly higher than 20 μM.37 Furthermore, they did not influence the viability of the AR-negative DU145 cells at the applied 20 μM concentration.37 Herein, the in vitro cytotoxicity of the six novel organometallic RhCp*, RuCym and Re(CO)3 complexes was assayed in prostate (androgen receptor (AR)-positive LNCaP and AR-negative PC3), breast (estrogen receptor (ER)-positive MCF-7 and ER-negative HTB-26) and colon (Colo-205) adenocarcinoma human cancer cell lines. The four related ligands were also tested for comparison. Complexes were also tested against the non-cancerous fibroblast cell line CCD-19Lu to investigate their selectivity for cancer cells. Doxorubicin was used as a positive control. The determined IC50 values are shown in Tables 5 and S1.† Analysing the obtained cytotoxicity data, we can conclude that the tested ligands demonstrate significant cytotoxicity with IC50 values ranging from 4 to 15 μM in the MCF-7 and Colo-205 cancer cell lines. However, the effect of the ligands is weak or insignificant in the prostate cancer cells (LNCaP, PC3) under the experimental conditions used, and we do not obtain low IC50 values even for the AR-positive cell line (LNCaP). At the same time, the organometallic complexes showed moderate-to-strong cytotoxic activity in prostate cancer cells, especially in the case of [RuCym(4-Ph-bpy-St-OH)Cl]Cl (4) (3–5 μM). The corresponding IC50 values of the complexes obtained in AR-positive and AR-negative prostate cancer cells do not differ significantly, which suggests an AR-independent mechanism of action. Complexation with RuCym resulted in compounds with significant anticancer activity in breast (MCF-7) cancer cells, although the IC50 values were comparable to those of the corresponding free ligands.| IC50 (μM) | LNCaP | PC3 | MCF-7 | HTB-26 | Colo-205 | CCD-19Lu |
|---|---|---|---|---|---|---|
| Ligands | ||||||
| 4-Me-bpy-St-OH | 22.19 ± 2.15 | 18.54 ± 1.04 | 6.1 ± 0.2 | — | 10.2 ± 0.7 | — |
| 4-Ph-bpy-St-OH | >100 | 43.30 ± 0.04 | 4.8 ± 0.6 | — | 12.1 ± 0.3 | — |
| RhCp* complexes of | ||||||
| 4-Me-bpy-St-OH (1) | 13.13 ± 0.51 | 12.79 ± 0.21 | >100 | — | 73 ± 2 | 3.30 ± 0.32 |
| 4-Ph-bpy-St-OH (2) | 10.91 ± 0.59 | 11.41 ± 0.17 | 46.1 ± 0.8 | — | 43.7 ± 0.3 | 1.49 ± 0.07 |
| RuCym complexes of | ||||||
| 4-Me-bpy-St-OH (3) | 6.07 ± 0.39 | 10.99 ± 0.48 | 6.66 ± 0.21 | 26.05 ± 0.32 | 9.5 ± 0.1 | 22.98 ± 1.18 |
| 4-Ph-bpy-St-OH (4) | 3.06 ± 0.43 | 4.90 ± 0.04 | 3.70 ± 0.14 | 9.14 ± 0.11 | 21 ± 1 | 8.70 ± 0.57 |
| Re(CO)3 complexes of | ||||||
| 4-Me-bpy-St-OH (5) | 12.05 ± 0.23 | 8.30 ± 0.09 | 45 ± 1 | — | 47.1 ± 0.7 | 6.72 ± 0.06 |
| 4-Ph-bpy-St-OH (6) | 26.24 ± 0.66 | 11.73 ± 0.81 | 18.89 ± 0.06 | — | 27 ± 1 | 4.39 ± 0.40 |
| Doxorubicin | 0.58 ± 0.01 | 0.25 ± 0.01 | 0.06 ± 0.01 | 0.48 ± 0.02 | 0.06 ± 0.01 | 0.82 ± 0.01 |
In contrast, the RhCp* and Re(CO)3 complexes were less active than the ligands alone in this cell line. Similar trends were obtained in the Colo-205 cells. It is worth noting that the RuCym complex of 4-Me-bpy-St-OH (3) is more active on the Colo-205 cell line than all RuCym compounds evaluated on the same cell line in our previous study, where various RuCym complexes of (N,O), (O,O) and (S,O) ligands were studied.64 As the most promising compounds, RuCym complexes (3, 4) were further tested in ER-negative HTB-26 cells, and interestingly somewhat higher IC50 values were obtained than in the ER-positive MCF-7 cells.
The IC50 values of the RuCym complexes obtained in the non-cancerous CCD-19Lu cell line revealed significant selectivity (obtained as quotients of IC50 (CCD-19Lu) and IC50 (cancerous cell line), Fig. 11) in almost all cases (S.I. = 1.8–3.8; except for HTB-26, where S.I. ∼ 1). The other complexes displayed no selectivity (S.I. < 1).
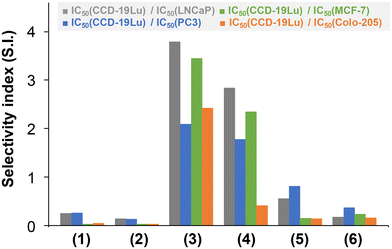 | ||
| Fig. 11 Selectivity index (S.I.) values obtained as quotients of IC50 (CCD-19Lu)/IC50 (cancerous cell line) for the studied organometallic complexes. The exact IC50 values are listed in Table 5. | ||
In contrast to initial expectations, the presumed increased lipophilicity of the phenyl-substituted compounds did not translate into greater cytotoxicity for the ligands, while their complexes were more cytotoxic than those of 4-Me-bpy-St-OH in almost all cases. Moreover, it was also observed that the higher the lipophilicity of the RuCym and RhCp* half-sandwich complexes, the stronger the cytotoxic activity in almost all cases (except for complex 4 in Colo-205 cells, where a higher pIC50 value was expected), as shown in the correlation plots in Fig. S43.†
Conclusions
In this work, six novel organometallic Ru(II), Rh(III) and Re(I) complexes bearing sterane-based (N,N) ligands were developed and characterized. The solution chemical properties and anticancer activity of both the ligands and their complexes were comprehensively investigated. The complexes prepared were [Rh(η5-C5Me5)(L)Cl]Cl (1, 2), [Ru(η6-p-cymene)(L)Cl]Cl (3, 4) and fac-[Re(CO)3(L)Cl] (5, 6), in which the 2,2-bipyridyl-type ligands (L) 4-Me-bpy-St-OH and 4-Ph-bpy-St-OH were coordinated via the (N,N) donor set. The structure of complex 5 was determined by single-crystal X-ray diffraction analysis, which revealed that the complex adopted octahedral geometry and the coordination sphere was saturated by the binding of a chlorido ligand.The ligands and their Re(CO)3 complexes are neutral and highly lipophilic (log![[thin space (1/6-em)]](https://www.rsc.org/images/entities/char_2009.gif) D7.40 > +3) at pH = 7.40, while the half-sandwich RuCym and RhCp* complexes are positively charged (+/2+) and possess significantly better aqueous solubility. The half-sandwich complexes are very stable in 30% (v/v) DMSO/H2O; the degree of dissociation is only ca. 2–5% at pH = 7.40 at 30 μM concentration. The half-sandwich complexes are fairly stable in PBS’ buffer, in blood serum and in cell culture medium for at least 72 h. In the absence of chloride ions, deprotonation of the coordinated aqua ligand is negligible at pH = 7.40 for the RhCp* complexes (1, 2), while the formation of mixed-hydroxido species is more significant (40–47%) in case of the RuCym complexes (3, 4). In the presence of chloride ions, this deprotonation process is further suppressed, resulting in a higher pKa (H2O) as well as a higher proportion of simply positively charged species, which has a great influence on lipophilicity. However, RhCp* complexes possess almost an order of magnitude higher affinity constant for chloride ions and are less lipophilic than the corresponding RuCym complexes. The Re(CO)3 complexes demonstrate high stability in solution and the chlorido form is the predominant species as well. For these complexes, no observable ligand exchange between Cl− and H2O was detected, while the chlorido co-ligand could undergo substitution by OH− in the alkaline pH range.
D7.40 > +3) at pH = 7.40, while the half-sandwich RuCym and RhCp* complexes are positively charged (+/2+) and possess significantly better aqueous solubility. The half-sandwich complexes are very stable in 30% (v/v) DMSO/H2O; the degree of dissociation is only ca. 2–5% at pH = 7.40 at 30 μM concentration. The half-sandwich complexes are fairly stable in PBS’ buffer, in blood serum and in cell culture medium for at least 72 h. In the absence of chloride ions, deprotonation of the coordinated aqua ligand is negligible at pH = 7.40 for the RhCp* complexes (1, 2), while the formation of mixed-hydroxido species is more significant (40–47%) in case of the RuCym complexes (3, 4). In the presence of chloride ions, this deprotonation process is further suppressed, resulting in a higher pKa (H2O) as well as a higher proportion of simply positively charged species, which has a great influence on lipophilicity. However, RhCp* complexes possess almost an order of magnitude higher affinity constant for chloride ions and are less lipophilic than the corresponding RuCym complexes. The Re(CO)3 complexes demonstrate high stability in solution and the chlorido form is the predominant species as well. For these complexes, no observable ligand exchange between Cl− and H2O was detected, while the chlorido co-ligand could undergo substitution by OH− in the alkaline pH range.
Among others, spectrofluorometric measurements revealed a moderate-to-strong HSA binding affinity with conditional stability constants log![[thin space (1/6-em)]](https://www.rsc.org/images/entities/char_2009.gif) K′ = 4.5–4.7 for the half-sandwich RuCym and RhCp* complexes. However, different binding mechanisms could be observed; namely, RuCym complexes interacted with the protein mainly through intermolecular forces, while RhCp* complexes could also establish interactions via coordinative binding involving the metal center and non-covalent binding of the sterane backbone. Half-sandwich complexes are also able to interact with ct-DNA, and according to our results, the coordination binding mode is the most probable, while intercalation is unlikely.
K′ = 4.5–4.7 for the half-sandwich RuCym and RhCp* complexes. However, different binding mechanisms could be observed; namely, RuCym complexes interacted with the protein mainly through intermolecular forces, while RhCp* complexes could also establish interactions via coordinative binding involving the metal center and non-covalent binding of the sterane backbone. Half-sandwich complexes are also able to interact with ct-DNA, and according to our results, the coordination binding mode is the most probable, while intercalation is unlikely.
Complexation resulted in stronger cytotoxic activity in both AR-positive LNCaP and AR-negative PC3 prostate cell lines, surpassing the activity of the ligands. The comparable cytotoxic effects shown in both types of cell line suggest that the mechanism of action of the complexes does not primarily depend on the interaction with the AR. Remarkably, the formation of RuCym and RhCp* complexes managed to overcome the poor aqueous solubility of the ligands, which had a potentially favourable impact on bioavailability. The ligands exhibited remarkable cytotoxicity (IC50 = 4–15 μM) in human colon adenocarcinoma (Colo-205) and breast adenocarcinoma (MCF-7) cancer cell lines, while complex formation decreased the activity in almost all cases except for the RuCym complexes in these cell lines, which displayed similar cytotoxicity to the free ligands. Moreover, the RuCym complexes showed remarkable selectivity towards cancer cell lines in almost all cases, while the other organometallic compounds tested displayed no selectivity. Overall, among the tested compounds, the Ru(II)(η6-p-cymene) complexes (3, 4) were identified as the most promising anticancer compounds.
Experimental
Chemicals
All solvents were of analytical grade and used without further purification. [Ru(η6-p-cymene)(μ-Cl)Cl]2, ReCl(CO)5, CDCl3, dichloromethane, toluene, n-hexane, were purchased from Strem Chemicals, Inc., Newburyport, MA, USA; Merck, Darmstadt, Germany; and Honeywell, Muskegon, MI, USA. [Rh(η5-C5Me5)(μ-Cl)Cl]2, KOH, HSA (A8763, essentially globulin free), D2O, tetrabutylammonium chloride, guanine, 1-methylimidazole, RPMI media, doxorubicin, ct-DNA and human serum (from human male AB plasma) were Sigma-Aldrich/Merck (St Louis, MO, USA) products and were used without further purification. DMSO, DMF, KCl, KNO3, HCl, NaH2PO4, Na2HPO4, KH2PO4, and n-octanol were Molar Chemicals (Halásztelek, Hungary) products. DMSO-d6 and ethanol were purchased from VWR Chemicals (Radnor, PA, USA).Stock solutions and sample preparation
Milli-Q water or DMSO were used for the preparation of stock and sample solutions. The aqueous [RhCp*(H2O)3](NO3)2 and [RuCym(H2O)3](NO3)2 stock solutions were obtained by dissolving an exact amount of the dimeric precursor in water followed by the addition of equivalent amounts of AgNO3, and AgCl precipitate was filtered off. Determination of the concentration of the precursor and ligand stock solutions was performed by pH-potentiometry using Hyperquad2013,46 as reported in our former works.15,40,65 Stock solutions of ligands were prepared by dissolving a known amount in DMSO. A stock solution of guanine was prepared by the dissolution of a known amount in KOH aqueous solution. MIM stock solution was made in water and its concentration was determined by pH-potentiometry.46 Stock solutions of half-sandwich and Re(CO)3 complexes were prepared in water and DMSO, respectively. HSA stock solutions were prepared in modified phosphate-buffered saline (PBS’), which contained 12 mM Na2HPO4, 3 mM KH2PO4, 1.5 mM KCl and 100.5 mM NaCl; the concentrations of K+, Na+ and Cl− ions corresponded to those in human blood serum. The residual citrate content of HSA was removed by repeated ultrafiltration of the protein stock solution, and its concentration was calculated from its UV absorption: λ280 nm (HSA) = 36![[thin space (1/6-em)]](https://www.rsc.org/images/entities/char_2009.gif) 850 M−1 cm−1.66 The ct-DNA stock solutions (ca. 1 mg mL−1) were made by hydrating solid ct-DNA in 20 mM phosphate buffer containing 4 mM KCl (pH = 7.40) and were left for 4 days at 4 °C. Concentrations of the ct-DNA stock solutions, expressed in nucleotide units, were determined by UV spectrophotometry using the molar absorption coefficient, 6600 M−1 cm−1, at 260 nm.67 The ratio of UV absorbances at 260 and 280 nm was checked, and a ratio of A260 nm/A280 nm ≥ 1.8 indicated that ct-DNA was free of proteins.67 Samples were prepared in buffer solutions to study the interaction with HSA (PBS’) and ct-DNA (20 mM phosphate buffer with 4 mM KCl) and were incubated for 24 h at 25 °C. A 4-fold dilution of human serum was carried out with PBS’ buffer for the stability measurements.
850 M−1 cm−1.66 The ct-DNA stock solutions (ca. 1 mg mL−1) were made by hydrating solid ct-DNA in 20 mM phosphate buffer containing 4 mM KCl (pH = 7.40) and were left for 4 days at 4 °C. Concentrations of the ct-DNA stock solutions, expressed in nucleotide units, were determined by UV spectrophotometry using the molar absorption coefficient, 6600 M−1 cm−1, at 260 nm.67 The ratio of UV absorbances at 260 and 280 nm was checked, and a ratio of A260 nm/A280 nm ≥ 1.8 indicated that ct-DNA was free of proteins.67 Samples were prepared in buffer solutions to study the interaction with HSA (PBS’) and ct-DNA (20 mM phosphate buffer with 4 mM KCl) and were incubated for 24 h at 25 °C. A 4-fold dilution of human serum was carried out with PBS’ buffer for the stability measurements.
Synthesis and characterization of the organometallic complexes
The complexes were characterized by NMR spectroscopy (Bruker Avance NEO 600 MHz NMR spectrometer) and high-resolution mass spectrometry (Agilent 6224 Accurate Mass TOF LC/MS). NMR and ESI-MS data determined for the complexes are found in the ESI.†pH-potentiometric measurements
pH-potentiometric measurements were carried out in water or in 30% (v/v) DMSO/H2O at 25.0 ± 0.1 °C over the pH range between 2.0 and 11.5 or 12.5, respectively, and at a constant ionic strength of 0.20 M KNO3 or 0.10 M KCl. The titrations were performed in a carbonate-free KOH solution (0.20 M or 0.10 M). The exact concentrations of HNO3, HCl and KOH solutions were determined by pH-potentiometric titrations. An Orion 710A pH meter equipped with a Metrohm combined electrode (type 6.0234.100) and a Metrohm 665 Dosimat burette were used for the pH-potentiometric measurements. The electrode system was calibrated according to the method suggested by Irving et al.68 The average water ionization constant, pKw, was determined to be 13.76 ± 0.01 (H2O) or 14.53 ± 0.05 (30% (v/v) DMSO/H2O), which was in good agreement with data reported in the literature.69 The initial volume of the samples was 10.0 mL. Samples were degassed by bubbling purified argon through them for about 10 min prior to the measurements, and the inert gas was also passed over the solutions during the titrations. The computer program Hyperquad201346 was utilized to establish the stoichiometry of the species and to calculate the equilibrium constants for the [RhCp*(4-Me-bpy-St-OH)Cl]Cl complex.UV-visible spectrophotometry
An Agilent Cary 8454 diode array spectrophotometer was utilized to obtain UV-vis spectra in the wavelength range of 190–1100 nm. The path length (![[small script l]](https://www.rsc.org/images/entities/i_char_e146.gif) ) was 1 cm in most cases (the actual
) was 1 cm in most cases (the actual ![[small script l]](https://www.rsc.org/images/entities/i_char_e146.gif) is always indicated in the legends of the figures). The concentrations of the ligands and complexes were between 30 and 200 μM. For HSA and ct-DNA containing samples, complex concentrations were 35 or 70 μM, and 0.5 and 1 equiv. biomolecule (or 10 equiv. MIM or 1 equiv. guanine) were added for kinetic studies, respectively. Individual samples contained 0–105 μM HSA or 0–781 μM MIM. Spectra were always background and baseline corrected. The computer program HypSpec46 was used to obtain stability constants.
is always indicated in the legends of the figures). The concentrations of the ligands and complexes were between 30 and 200 μM. For HSA and ct-DNA containing samples, complex concentrations were 35 or 70 μM, and 0.5 and 1 equiv. biomolecule (or 10 equiv. MIM or 1 equiv. guanine) were added for kinetic studies, respectively. Individual samples contained 0–105 μM HSA or 0–781 μM MIM. Spectra were always background and baseline corrected. The computer program HypSpec46 was used to obtain stability constants.
Circular dichroism spectroscopy
CD spectroscopy measurements were performed by using a JASCO-J-1500 (ABL&E–JASCO Hungary Ltd, Budapest, Hungary) spectrometer with 0.5 or 1 cm optical path lengths in the wavelength range from 220 to 500 nm. The scanning speed was 50 nm min−1. The analytical concentration of ct-DNA was 98 μM, and the concentration of the complexes was varied between 0 and 100 μM. When individual samples contained constant complex concentrations (87 or 71 μM), the HSA or MIM concentration was varied between 0 and 105 μM or 0 and 781 μM, respectively. Spectra were always background and baseline corrected. The computer program HypSpec47 was used to obtain stability constants.Determination of distribution coefficients
The traditional shake-flask method was used to obtain distribution coefficients of the ligands as well as of the complexes in n-octanol/buffered aqueous solution (20 mM phosphate, pH = 7.40) using UV-vis spectrophotometry (Agilent Cary 8454 diode array spectrophotometer, Santa Clara, CA, USA) for the analysis. The compounds were dissolved in the buffered aqueous solutions previously saturated with n-octanol. In the case of ligands and Re(CO)3 complexes, compounds were dissolved in the presaturated n-octanol phase due to high lipophilicity. Then the aqueous and n-octanol phases were gently mixed in different volume ratios (using 1![[thin space (1/6-em)]](https://www.rsc.org/images/entities/char_2009.gif) :
:![[thin space (1/6-em)]](https://www.rsc.org/images/entities/char_2009.gif) 50, 1
50, 1![[thin space (1/6-em)]](https://www.rsc.org/images/entities/char_2009.gif) :
:![[thin space (1/6-em)]](https://www.rsc.org/images/entities/char_2009.gif) 70 or 1
70 or 1![[thin space (1/6-em)]](https://www.rsc.org/images/entities/char_2009.gif) :
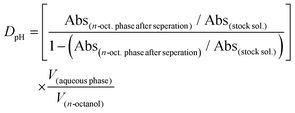
:![[thin space (1/6-em)]](https://www.rsc.org/images/entities/char_2009.gif) 140 ratios of n-octanol to buffered aqueous solution volumes for ligands and Re(CO)3 complexes) for 4 h, followed by phase separation. Three different chloride ion concentrations (4, 24 or 100 mM) were applied in the case of half-sandwich complexes. Then the UV-vis spectrum of the aqueous or n-octanol phase was recorded and compared to a reference spectrum. Distribution coefficients (DpH) were calculated by using the following equations:
140 ratios of n-octanol to buffered aqueous solution volumes for ligands and Re(CO)3 complexes) for 4 h, followed by phase separation. Three different chloride ion concentrations (4, 24 or 100 mM) were applied in the case of half-sandwich complexes. Then the UV-vis spectrum of the aqueous or n-octanol phase was recorded and compared to a reference spectrum. Distribution coefficients (DpH) were calculated by using the following equations:
If the stock solution was made in the aqueous phase:
If the stock solution was made in the n-octanol phase:
Solution studies applying NMR spectroscopy
A Bruker Avance III HD Ascend 500 Plus instrument (Billerica, MA, USA) was used for solution NMR studies. Spectra were recorded with the WATERGATE water suppression pulse scheme in the presence of 10% (v/v) D2O in most cases. DSS internal standard was added to the samples to obtain reference peaks. 1H NMR titrations were carried out in the presence of 0.20 M KNO3. With the MIM model, the measurements were performed at 0.5 mM complex concentration, and 1 and 2 equiv. of MIM was used. The computer program HypSpec47 was used to obtain equilibrium constants.X-ray data collection
Data from a single crystal of rhenium complex fac-[Re(CO)3(4-Me-bpy-St-OH)Cl] (5) were collected at 150 K on a SuperNova diffractometer with an Atlas detector using CrysAlis software with monochromated Mo Kα (0.71073 Å) (Oxford Diffraction Ltd, CrysAlis PRO, Yarnton, Oxfordshire, UK, 2011). The initial structural models were solved with direct methods implemented in SHELXT using the Olex2 graphical user interface.70 A full-matrix least-squares refinement on F2 magnitudes with anisotropic displacement parameters for all non-hydrogen atoms using Olex2 or SHELXL-2018/3 was performed.70,71 All non-hydrogen atoms were refined anisotropically, while hydrogen atoms were placed at calculated positions and treated as riding on their parent atoms. Details on crystal data, data acquisition and refinement are presented in Table S1.† Mercury72 was used for the preparation of the figures. CCDC 2302275† contains the supplementary crystallographic data for this paper.Spectrofluorometry
Fluorescence measurements were carried out on a Fluoromax (Horiba Jobin Yvon, Longjumeau, France) spectrofluorometer using a 1 cm × 1 cm quartz cuvette. Samples contained 1 or 0.5 μM HSA, and the complex concentration was varied between 0 and 53 μM. Spectroscopic measurements were carried out on individually prepared samples. The excitation wavelength was 295 nm for Trp-214 quenching. The calculated conditional stability constants for HSA–complex species (1![[thin space (1/6-em)]](https://www.rsc.org/images/entities/char_2009.gif) :
:![[thin space (1/6-em)]](https://www.rsc.org/images/entities/char_2009.gif) 1) were obtained using the computer program HypSpec.46 Calculations were always based on data obtained from at least two independent measurements. Self-absorbance and the inner filter effect had to be taken into account,73 and corrections were made as described in our former works.53,74
1) were obtained using the computer program HypSpec.46 Calculations were always based on data obtained from at least two independent measurements. Self-absorbance and the inner filter effect had to be taken into account,73 and corrections were made as described in our former works.53,74
Capillary zone electrophoresis
An Agilent 7100 capillary electrophoresis system equipped with diode-array UV-vis detector (200–600 nm) was utilized to obtain electropherograms. Fused silica capillaries of 48 cm total length with 75 μm inner diameter were used (Agilent Technologies, Santa Clara, CA, USA). The background electrolyte (BGE) was 20 mM phosphate or PBS’ buffer (pH = 7.40), in which the samples were also made. The conditioning processes for new capillaries and daily preparation were performed as described previously.74 In order to ensure a steady baseline, the capillary was flushed with BGE (2 min) before each run and rinsed with NaOH (0.1 M; 1.5 min), H2O (1.5 min), and then BGE (2 min) after each run. As post-conditioning, the capillary was also flushed with BGE for 1 min. The sample tray and the capillary cassette were kept at 25 °C. Hydrodynamic injection was used at 100 mbar for 5 s injection time. For separation, 140 μA current and 20 kV voltage were applied. The sample run time was set to 6 min. The computer program ChemStation (Agilent)75 was used to record electropherograms. Electropherograms and spectra of the corresponding peaks were also collected. Interaction of the half-sandwich complexes with HSA was studied at constant protein concentration (20 μM) in PBS’ buffer (pH = 7.40), and the HSA-to-complex ratio varied between 0.00 and 2.00.Membrane ultrafiltration
Milli-pore, Amicon Ultra-0.5 membrane filters (10 kDa) were used to separate samples containing 35 μM HSA and 70 μM complex (1![[thin space (1/6-em)]](https://www.rsc.org/images/entities/char_2009.gif) :
:![[thin space (1/6-em)]](https://www.rsc.org/images/entities/char_2009.gif) 2 protein-to-complex ratio) into low and high molecular mass (LMM and HMM) fractions, as described in our former work.76 UV-vis spectrophotometry was used to determine the concentration of the non-bound compounds in the LMM fractions by comparing spectra to that of a reference sample without the protein.
2 protein-to-complex ratio) into low and high molecular mass (LMM and HMM) fractions, as described in our former work.76 UV-vis spectrophotometry was used to determine the concentration of the non-bound compounds in the LMM fractions by comparing spectra to that of a reference sample without the protein.
In vitro cell culture studies
Conflicts of interest
There are no conflicts to declare.Acknowledgements
This work was supported by the National Research, Development and Innovation Office of Hungary (TKP-2021-EGA-32), ÚNKP-23-3-SZTE-496 New National Excellence program of the Ministry for Innovation and Technology, and the “Lendület” Programme (HUN-RES Hungarian Research Network, LP2019-6/2019). The authors also acknowledge support from the Centre for Research Infrastructure at the University of Ljubljana, Faculty of Chemistry and Chemical Technology, which is part of the Network of Research and Infrastructural Centres UL (MRIC UL) and is financially supported by the Slovenian Research and Innovation Agency (ARIS; Infrastructure programme No. I0-0022). This research was also funded by program grant P1-0175 of ARIS. We also thank the EN-FIST Centre of Excellence, Dunajska 156, SI-1000 Ljubljana, Slovenia for use of a SuperNova diffractometer. This article is also based upon work (Short Term Scientific Mission grant to T. Pivarcsik, from COST Action NECTAR (CA18202)) supported by COST (European Cooperation in Science and Technology). G. S. was supported by the János Bolyai Research Scholarship (BO/00158/22/5) of the Hungarian Academy of Sciences. The CCD-19Lu cell line was kindly given by Dr Domonkos Pap (HUN-REN – SU Pediatrics and Nephrology Research Group, Semmelweis University, Budapest, Hungary). We also thank Dr Márta Bozóki-Nové for her help in testing the cytotoxicity in non-cancerous cells. University of Szeged Open Access Fund (grant number: 6838) is also acknowledged (to É. A. E.).References
- C. S. Allardyce and P. J. Dyson, Dalton Trans., 2016, 45, 3201–3209, 10.1039/C5DT03919C.
- M. Patra and G. Gasser, ChemBioChem, 2012, 13, 1232–1252, DOI:10.1002/cbic.201200159.
- A. F. A. Peacock and P. J. Sadler, Chem. – Asian J., 2008, 3, 1890–1899, DOI:10.1002/asia.200800149.
- G. Gasser, I. Ott and N. Metzler-Nolte, J. Med. Chem., 2011, 54, 3–25, DOI:10.1021/jm100020w.
- C. G. Hartinger, N. Metzler-Nolte and P. J. Dyson, Organometallics, 2012, 31, 5677–5685, DOI:10.1021/om300373t.
- A. Alama, B. Tasso, F. Novelli and F. Sparatore, Drug Discovery Today, 2009, 14, 500–508, DOI:10.1016/j.drudis.2009.02.002.
- G. Gasser and N. Metzler-Nolte, Curr. Opin. Chem. Biol., 2012, 16, 84–91, DOI:10.1016/j.cbpa.2012.01.013.
- P. Zhang and P. J. Sadler, J. Organomet. Chem., 2017, 839, 5–14, DOI:10.1016/j.jorganchem.2017.03.038.
- S. M. Meier-Menches, C. Gerner, W. Barger, C. G. Hartinger and B. K. Keppler, Chem. Soc. Rev., 2018, 47, 909–928, 10.1039/C7CS00332C.
- A. Habtemariam, M. Melchart, R. Fernández, S. Parsons, I. D. H. Oswald, A. Parkin, F. P. A. Fabbiani, J. E. Davidson, A. Dawson, R. E. Aird, D. I. Jordell and P. J. Sadler, J. Med. Chem., 2006, 49, 6858–6868, DOI:10.1021/jm060596m.
- K. Máliková, L. Masaryk and P. Štraha, Inorganics, 2021, 9, 26, DOI:10.3390/inorganics9040026.
- T. S. Morais, A. Valente, A. I. Tomaz, F. Marques and M. H. Garcia, Future Med. Chem., 2016, 8, 527–544, DOI:10.4155/fmc.16.7.
- S. Seršen, J. Kljun, K. Kryeziu, R. Panchuk, B. Alte, W. Körner, P. Heffeter, W. Berger and I. Turel, J. Med. Chem., 2015, 58, 3984–3996, DOI:10.1021/acs.jmedchem.5b00288.
- J. Kladnik, J. P. C. Coverdale, J. Kljun, H. Burmeister, P. Lippman, F. G. Ellis, A. M. Jones, I. Ott, I. Romero-Canelón and I. Turel, Cancers, 2021, 13, 2493, DOI:10.3390/cancers13102493.
- J. P. Mészáros, V. F. S. Pape, G. Szakács, G. Németi, M. Dénes, T. Holczbauer, N. V. May and É. A. Enyedy, Dalton Trans., 2021, 50, 8218–8231, 10.1039/D1DT00808K.
- R. E. Morris, R. E. Aird, P. del S. Murdoch, H. Chen, J. Cummings, N. D. Hughes, S. Parsons, A. Parkin, G. Boyd, D. I. Jodrell and P. J. Sadler, J. Med. Chem., 2001, 44, 3616–3621, DOI:10.1021/jm010051m.
- A. Mitrovič, J. Kljun, I. Sosič, M. Uršič, A. Meden, S. Gobec, J. Kos and I. Turel, Inorg. Chem., 2019, 58, 12334–12347, DOI:10.1021/acs.inorgchem.9b01882.
- A. Leonidova and G. Gasser, ACS Chem. Biol., 2014, 9, 2180–2193, DOI:10.1021/cb500528c.
- H. S. Liew, C.-W. Mai, X. M. Zulkefeli, T. Madheswaran, L. V. Kiew, N. Delsuc and M. L. Low, Molecules, 2020, 25, 4176, DOI:10.3390/molecules25184176.
- C. C. Konkankit, A. P. King, K. M. Knopf, T. L. Southard and J. J. Wilson, ACS Med. Chem. Lett., 2019, 10, 822–827, DOI:10.1021/acsmedchemlett.9b00128.
- P. V. Simpson, M. Falasca and M. Massi, Chem. Commun., 2018, 54, 12429–12438, 10.1039/C8CC06596A.
- K. M. Knopf, B. L. Murphy, S. M. MacMillan, J. M. Baskin, M. P. Barr, E. Boros and J. J. Wilson, J. Am. Chem. Soc., 2017, 139, 14302–14314, DOI:10.1021/jacs.7b08640.
- M. S. Capper, H. Packman and M. Rehkämper, ChemBioChem, 2020, 21, 2111–2115, DOI:10.1002/cbic.202000117.
- J. Karges and S. M. Cohen, ChemBioChem, 2021, 22, 2600–2607, DOI:10.1002/cbic.202100186.
- J. Karges, M. Kalaj, M. Gembicky and S. M. Cohen, Angew. Chem., Int. Ed., 2021, 60, 10716–10723, DOI:10.1002/anie.202016768.
- T. V. Petrasheuskaya, F. Kovács, N. Igaz, A. Rónavári, B. Hajdu, L. Bereczki, N. V. May, G. Spengler, B. Gyurcsik, M. Kiricsi, É. Frank and É. A. Enyedy, Molecules, 2023, 28, 54, DOI:10.3390/molecules28010054.
- T. V. Petrasheuskaya, F. Kovács, G. Spengler, N. V. May, É. Frank and É. A. Enyedy, J. Mol. Struct., 2022, 1261, 132858, DOI:10.1016/j.molstruc.2022.132858.
- T. V. Petrasheuskaya, D. Wernitznig, M. A. Kiss, N. V. May, D. Wenisch, B. K. Keppler, É. Frank and É. A. Enyedy, J. Biol. Inorg. Chem., 2021, 26, 775–791, DOI:10.1007/s00775-021-01891-7.
- É. A. Enyedy, T. V. Petrasheuskaya, M. A. Kiss, D. Wernitznig, D. Wenisch, B. K. Keppler, G. Spengler, N. V. May, É. Frank and O. Dömötör, J. Inorg. Biochem., 2021, 220, 111468, DOI:10.1016/j.jinorgbio.2021.111468.
- T. V. Petrasheuskaya, M. A. Kiss, O. Dömötör, T. Holczbauer, N. V. May, G. Spengler, A. Kincses, A. Ĉ. Gašparović, É. Frank and É. A. Enyedy, New J. Chem., 2020, 44, 12154–12168, 10.1039/D0NJ01070G.
- J. P. Mészáros, H. Kovács, G. Spengler, F. Kovács, É. Frank and É. A. Enyedy, J. Inorg. Biochem., 2023, 244, 112223, DOI:10.1016/j.jinorgbio.2023.112223.
- V. A. Zolottsev, A. S. Latysheva, V. S. Pokrovsky, I. I. Khan and A. Y. Misharin, Eur. J. Med. Chem., 2021, 210, 113089, DOI:10.1016/j.ejmech.2020.113089.
- B. Molnár, N. I. Kinyua, G. Mótyán, P. Leits, I. Zupkó, R. Minorics, Gy. T. Balogh and É. Frank, J. Steroid Biochem. Mol. Biol., 2022, 219, 106064, DOI:10.1016/j.jsbmb.2022.106064.
- Q. Wan, Y. Deng, Y. Huang, Z. Yu, C. Wang, K. Wang, J. Dong and Y. Chen, ChemistryOpen, 2020, 9, 176–182, DOI:10.1002/open.201900228.
- R. Minorics and I. Zupkó, Anti-Cancer Agents Med. Chem., 2018, 18, 652–666, DOI:10.2174/1871520617666171114111721.
- É. Frank and Gy. Schneider, J. Steroid Biochem. Mol. Biol., 2013, 137, 301–315, DOI:10.1016/j.jsbmb.2013.02.018.
- M. A. Kiss, M. Peřina, L. Bereczki, Á. Baji, J. Bělíček, R. Jorda and É. Frank, J. Steroid Biochem. Mol. Biol., 2023, 231, 106315, DOI:10.1016/j.jsbmb.2023.106315.
- Á. Baji, A. Gyovai, J. Wölfling, R. Minorics, I. Ocsovszki, I. Zupkó and É. Frank, RSC Adv., 2016, 6, 27501–27516, 10.1039/C6RA03910C.
- M. Kubanik, H. Holtkamp, T. Söhnel, S. M. F. Jamieson and C. G. Hartinger, Organometallics, 2015, 34, 5658–5668, DOI:10.1021/acs.organomet.5b00868.
- W. D. J. Tremlett, K. K. H. Tong, T. R. Steel, S. Movassaghi, M. Hanif, S. M. F. Jamieson, T. Söhnel and C. G. Hartinger, J. Inorg. Biochem., 2019, 199, 110768, DOI:10.1016/j.jinorgbio.2019.110768.
- J. P. Mészáros, G. Németi, J. M. Poljarevic, T. Holczbauer, N. V. May and É. A. Enyedy, Eur. J. Inorg. Chem., 2021, 2021, 1858–1868, DOI:10.1002/ejic.202100122.
- K. Kim, J. Hyun, J. Kim and H. Kim, Asian J. Org. Chem., 2017, 6, 907–912, DOI:10.1002/ajoc.201700196.
- C. R. Turlington, J. Morris, P. S. White, W. W. Brennessel, W. D. Jones, M. Brookhart and J. L. Templeton, Organometallics, 2014, 33, 4442–4448, DOI:10.1021/om500660n.
- A. Garypidou, K. Ypsilantis, T. Tsolis, A. Kourtellaris, J. C. Plakatouras and A. Garoufis, Inorg. Chim. Acta, 2021, 518, 120254, DOI:10.1016/j.ica.2021.120254.
- C. A. Otter, D. A. Bardwell, S. M. Couchman, J. C. Jeffery, J. P. Maher and M. D. Ward, Polyhedron, 1998, 17, 211–220, DOI:10.1016/S0277-5387(97)00384-7.
- P. Grans, A. Sabatini and A. Vacca, Talanta, 1996, 43, 1739–1753, DOI:10.1016/0039-9140(96)01958-3.
- ChemAxon, Ltd. Instant J. Chem./MarwinSketch; ChemAxon Ltd.: Budapest, Hungary, 2012.
- É. A. Enyedy, J. P. Mészáros, O. Dömötör, C. M. Hackl, A. Roller, B. K. Keppler and W. Kandioller, J. Inorg. Biochem., 2015, 152, 93–103, DOI:10.1016/j.jinorgbio.2015.08.025.
- T. Pivarcsik, V. Pósa, H. Kovács, N. V. May, G. Spengler, Sz. Pósa, Sz. Tóth, Z. N. Yazdi, Cs. Özvegy-Laczka, I. Ugrai, I. Szatmári, G. Szakács and É. A. Enyedy, Int. J. Mol. Sci., 2023, 24, 593, DOI:10.3390/ijms24010593.
- T. Pivarcsik, O. Dömötör, J. P. Mészáros, N. V. May, G. Spengler, O. Csuvik, I. Szatmári and É. A. Enyedy, Int. J. Mol. Sci., 2021, 22, 11281, DOI:10.3390/ijms222011281.
- J. P. Mészáros, J. M. Poljarevic, I. Szatmári, O. Csuvik, F. Fülöp, N. Szoboszlai, G. Spengler and É. A. Enyedy, Dalton Trans., 2020, 49, 7977–7992, 10.1039/D0DT01256D.
- B. Elsadek and F. Kratz, J. Controlled Release, 2012, 157, 4–28, DOI:10.1016/j.jconrel.2011.09.069.
- O. Dömötör, T. Pivarcsik, J. P. Mészáros, I. Szatmári, F. Fülöp and É. A. Enyedy, Dalton Trans., 2021, 50, 11918–11930, 10.1039/D1DT01700D.
- F. Wang, J. Bella, J. A. Parkinson and P. J. Sadler, J. Biol. Inorg. Chem., 2005, 10, 147–155, DOI:10.1007/s00775-004-0621-5.
- W. Hu, Q. Luo, X. Ma, K. Wu, J. Liu, Y. Chen, S. Xiong, J. Wang, P. J. Sadler and F. Wang, Chem. – Eur. J., 2009, 15, 6568–6594, DOI:10.1002/chem.200900699.
- Z. Adhireksan, G. Palermo, T. Riedel, Z. Ma, R. Muhammad, U. Rothlisberger, P. J. Dyson and C. A. Davey, Nat. Commun., 2017, 8, 14860, DOI:10.1038/ncomms14860.
- D. Stanic-Vucinic, S. Nikolic, K. Vlajic, M. Radomirovic, J. Mihailovic, T. C. Velickovic and S. Grguric-Sipka, J. Biol. Inorg. Chem., 2020, 25, 253–265, DOI:10.1007/s00775-020-01758-3.
- A. A. Hassoon, A. Szorcsik, F. Bogár, I. Z. Papp, L. Fülöp, Z. Kele and T. Gajda, J. Inorg. Biochem., 2021, 216, 111330, DOI:10.1016/j.jinorgbio.2020.111330.
- H. Chen, J. A. Parkinson, S. Parsons, R. A. Coxall, R. O. Gould and P. J. Sadler, J. Am. Chem. Soc., 2002, 124, 3064–3082, DOI:10.1021/ja017482e.
- H. Chen, J. A. Parkinson, R. E. Morris and P. J. Sadler, J. Am. Chem. Soc., 2003, 125, 173–186, DOI:10.1021/ja027719m.
- W. C. Johnson, in Circular Dichroism: Principles and Applications, ed. N. Berova, K. Nakanishi and R. W. Woody, VCH Publishers, New York, NY, USA, 2nd edn, 2000, p. 523 Search PubMed.
- Y. Geldmacher, R. Rubbiani, P. Wefelmeier, A. Prokop, I. Ott and W. S. Sheldrick, J. Organomet. Chem., 2011, 696, 1023–1031, DOI:10.1016/j.jorganchem.2010.10.034.
- S. Schäfer, I. Ott, R. Gust and W. S. Sheldrick, Eur. J. Inorg. Chem., 2007, 2007, 3034–3046, DOI:10.1002/ejic.200700206.
- T. Pivarcsik, G. Tóth, N. Szemerédi, A. Bogdanov, G. Spengler, J. Kljun, J. Kladnik, I. Turel and É. A. Enyedy, Pharmaceuticals, 2021, 14, 518, DOI:10.3390/ph14060518.
- O. Dömötör, S. Aicher, M. Schmidlehner, M. S. Novak, A. Roller, M. A. Jakupec, W. Kandioller, C. G. Hartinger, B. K. Keppler and É. A. Enyedy, J. Inorg. Biochem., 2014, 134, 57–65, DOI:10.1016/j.jinorgbio.2014.01.020.
- G. H. Beaven and S.-H. Chen, A. D′albis and W. B. Gratzer, Eur. J. Biochem., 1974, 41, 539–546, DOI:10.1111/j.1432-1033.1974.tb03295.x.
- S. R. Gallagher, in Current protocols in molecular biology, ed. F. M. Ausubel, R. Brent, R. E. Kingston, D. D. Moore, J. G. Seidman, J. A. Smith and K. Struhl, Greene and Wiley-Interscience, New York, NY, USA, 1994, p. A-3D-1–14 Search PubMed.
- H. M. Irving, M. G. Miles and L. D. Pettit, Anal. Chim. Acta, 1967, 38, 475–488, DOI:10.1016/S0003-2670(01)80616-4.
- SCQuery, The IUPAC Stability Constants Database, Academic Software (Version 5.5), R. Soc. Chem., 1993–2005 Search PubMed.
- O. V. Dolomanov, L. J. Bourhis, R. J. Gildea, J. A. K. Howard and H. Puschmann, J. Appl. Crystallogr., 2009, 42, 339–341, DOI:10.1107/S0021889808042726.
- G. M. Sheldrick, Acta Crystallogr., Sect. A: Found. Adv., 2015, 71, 3–8, DOI:10.1107/S2053273314026370.
- C. F. Macrae, P. R. Edgington, P. McCabe, E. Pidcock, G. P. Shields, R. Taylor, M. Twoler and J. van de Streek, J. Appl. Crystallogr., 2006, 39, 453–457, DOI:10.1107/S002188980600731X.
- J. R. Lakowicz, Principles of fluorescence spectroscopy, Springer, New York, 3rd edn, 2006 Search PubMed.
- O. Dömötör and É. A. Enyedy, J. Biol. Inorg. Chem., 2019, 24, 703–719, DOI:10.1007/s00775-019-01683-0.
- ChemStation Agilent Technologies. (2018). OpenLab ChemStation (Version 01.09). Agilent Technologies. Available online: https://www.agilent.com (accessed on 23 January 2024).
- O. Dömötör, C. G. Hartinger, A. K. Byztek, T. Kiss, B. K. Keppler and É. A. Enyedy, J. Biol. Inorg. Chem., 2013, 18, 9–17, DOI:10.1007/s00775-012-0944-6.
- GraphPad Prism Version 7.00 for Windows, Graph Pad Software, La Jolla, California USA, 2018. Available online: https://www.graphpad.com (accessed on 23 January 2024) Search PubMed.
Footnote |
| † Electronic supplementary information (ESI) available: Additional 1H and 13C NMR, UV-visible and circular dichroism spectra for characterization, investigation of solution chemical processes, albumin and DNA binding and crystallographic data. CCDC 2302275. For ESI and crystallographic data in CIF or other electronic formats, see DOI: https://doi.org/10.1039/d3dt04138g |
| This journal is © The Royal Society of Chemistry 2024 |

