 Open Access Article
Computational study of the interactions of tetravalent actinides (An = Th–Pu) with the α-Fe13 Keggin cluster†
Ryan L.
Dempsey
 and
Nikolas
Kaltsoyannis
 *
*
Department of Chemistry, The University of Manchester, Manchester, M13 9PL, UK. E-mail: nikolas.kaltsoyannis@manchester.ac.uk
First published on 4th March 2024
Abstract
In recent years, evidence has emerged that actinide (An) uptake at the enhanced actinide removal plant (EARP) at the UK's Sellafield nuclear site occurs via An interactions with an α-Fe13 Keggin molecular cluster during ferrihydrite formation. We here study theoretically the substitution of aquo complexes of the actinides Th–Pu onto a Na-decorated α-Fe13 Keggin cluster using DFT at the PBE0 level. The optimised Pu–O and Pu–Fe distances are in good agreement with experiment and Na/An substitutions are significantly favourable energetically, becoming more so across the early 5f series, with the smallest and largest ΔrG° being for Th and Pu at −335.7 kJ mol−1 and −396.0 kJ mol−1 respectively. There is strong correlation between the substitution reaction energy and the ionic radii of the actinides (Δrε0R2 = 0.97 and ΔrG° R2 = 0.91), suggesting that the principal An-Keggin binding mode is ionic. Notwithstanding this result, Mulliken and natural population analyses reveal that covalency increases from Th–Pu in these systems, supported by analysis of the occupied Kohn–Sham molecular orbitals where enhanced An(5f)–O(2p) overlap is observed in the Np and Pu systems. By contrast, quantum theory of atoms in molecules analysis shows that U-Keggin binding is the most covalent among the five actinides, in keeping with previous studies.
Introduction
With the termination of the thermal oxide reprocessing plant (THORP) in 2018 followed by the Magnox reprocessing plant in 2022, the UK's Sellafield nuclear site completed its final batch of nuclear fuel reprocessing.1 The THORP and Magnox plants provided the main feed for the enhanced actinide removal plant (EARP) which processes primarily low and intermediate level waste. As the THORP and Magnox plants transition into post-operational clean-out (POCO) the EARP feed will diversify. It has become clear that our understanding of the mechanisms by which actinides such as U, Np and Pu are removed at the EARP is lacking, and we are currently seeking to address this through computational modelling of the fundamental inorganic chemistry believed to occur within the EARP. The EARP uses a base-induced hydrolysis mechanism to sequester actinides from a highly acidic aqueous waste stream. During this process, ferrihydrite (Fh) precipitates out of solution forming Fh–An adducts which can be separated from the aqueous stream through ultrafiltration processes. The mechanism by which actinides are sequestered during Fh formation is unknown and of significant interest.2–4Studies have shown that Fh formation can potentially occur through several competing pathways. One proposed route proceeds via polymerisation of small molecular Fe(III) species such as dimers and trimers.5,6 There is conflicting evidence for this route, however, as the mechanisms are complex and monitoring the reaction is difficult. Small Fe(III) molecules are detected but there is little structural consistency between them, and some are large enough to make the distinction between a molecule and low molecular weight Fh phase difficult.6 Recently, it has been shown that Fh can form via polyoxometalate (POM) nanoclusters, specifically α-Fe13 Keggin-types.2,7 Weatherill et al. used a combination of in situ small-angle X-Ray scattering (SAXS) and X-Ray diffraction (XRD) along with thermodynamic modelling to evidence Fe13 Keggin aggregation to Fh during the base induced hydrolysis, mimicking EARP conditions.2 Following on from this work, Smith et al. performed a similar experiment while spiking Pu(IV) into solution at low pH to monitor Pu(IV) uptake during the formation of Fh and subsequent transformation to more stable phases such as hematite and goethite.8 Stagg et al. also discuss such processes,9 and the surface complexation of other actinide species such as Th(IV), U(VI)O22+, Np(V)O2+ and Am(III) with Fh.3,9–15 Smith et al.'s study revealed that 85% of the Pu(IV) was removed simultaneously with Fe(III) at low pH (1.5–3.0) where Fe13 Keggin formation occurs. This is a surprising result, as one might expect Fh to form first followed by Pu(IV) adsorption in the form of PuO2 due to Fh's large surface area and affinity for contaminants. The simultaneous removal suggests that Pu(IV) first interacts with Fe13 at the molecular level and is retained throughout the transformation to Fh, and Pu(IV) L3-edge EXAFS analysis revealed shells of 8 Pu–O at 2.29 Å and 4 Pu–Fe at 3.34 Å indicating tetradentate surface complexation of Pu(IV) to Fh. Smith et al. also reported a further split-shell fitting with Pu–O distances of 2.22 Å and 2.39 Å and Pu–Fe of 3.27 Å and 3.44 Å. Due to its small X-ray scattering cross section it is difficult to locate H positions using XRD, so the split Pu–O shell could suggest Pu–O and Pu–OH binding. The Pu–O/Fe distances are consistent with the Bi analogues measured by Nyman and co-workers who reported the first synthesis and characterisation of the Fe13 Keggin in aqueous solution and later suggested Bi–O and Bi–OH coordination to the cluster.7,16,17
The α-Fe13 isomer forms in solution, and conversion to both Fh and magnetite phases is possible.2,7 Both Fh and magnetite contain Fe13 moieties in the δ- and ε-isomers respectively and so the clusters must undergo some rotational isomerism during aggregation to these nanocrystalline phases. More recently, Zheng and co-workers isolated the ε-Fe13 Keggin isomer using the trivalent lanthanides Gd, Pr and Dy as counter cation stabilisers18,19 and also showed that a lacunary Fe22 POM cluster containing the β-Fe13 moiety and capped with La(III) can convert to a La(III)-capped α-Fe13 Keggin in isopropanol and water.20 Much is still unknown about the formation of Fh, but in recent years efforts have shifted towards a pathway via molecular Fe13 nanoclusters. Zheng et al.'s work shows that heavier atoms such as lanthanides can stabilise isomers for the Fe13 Keggin and provides insight into potential mechanisms occurring during Fh formation.
Here, we focus on An(IV) (An = Th–Pu) substituted α-Fe13 Keggin clusters (An–Fe13). Reaction energies have been calculated showing thermodynamic feasibility for the substitution of An(IV) onto the “square-window” of the α-Fe13 Keggin. Although there is experimental evidence only for Pu(IV) binding, we explore the periodic trends of the early actinides in the tetravalent oxidation state in order to more broadly understand the driving force behind the uptake of actinides by the α-Fe13 Keggin. Insight into the actinide-Keggin binding mechanism and potential An–O covalency is gained through analysis of spin densities, quantum theory of atoms in molecules (QTAIM) properties, natural population analysis (NPA) and Mulliken analysis, overall supporting the idea that the α-Fe13 Keggin is responsible for the initial uptake of actinides in aqueous solution at the EARP.
Computational details
Fe(III) coordinated by weak field ligands such as O2− and OH− will most likely exist in a high-spin d5 configuration, and indeed this was found to be the case in an α-Fe13 cluster with F− bridges.21 The magnetic properties of this cluster were studied, and it was found that at 300 K the magnetic susceptibility was lower than that expected of non-interacting Fe(III) centres, indicating some antiferromagnetic interaction.22 That said, the magnetic arrangement(s) of the iron cluster(s) found at the EARP is unknown and, although the magnetic nature of these systems is interesting, the primary purpose of our present study is to compare periodic trends in structure and bonding across the actinide series. To this end, we focus on the simplest systems to simulate, i.e. those with the highest overall spin arrangement of the Fe(III) centres and the actinide substituents.All geometries were optimised using spin-unrestricted density functional theory without symmetry constraints, using the TURBOMOLE 7.3 program23 with the multipole accelerated resolution of identity (MARI-J) fast Coulomb approximations.24,25 The capping Na+ and An4+ are explicitly solvated by two and five water molecules respectively, and implicit solvation was included using the conductor-like screening model26 (COSMO, ε = 78.4). Harmonic vibrational frequency analysis was performed numerically to confirm all optimised geometries as energetic minima and to provide vibrational frequencies to obtain thermodynamic correction terms to the electronic energy using standard equations defined by the rigid-rotor harmonic oscillator (RRHO) model at 298.15 K and 0.1 MPa (further details are provided in the ESI†). The PBE,27 TPSS,28 PBE0![[thin space (1/6-em)]](https://www.rsc.org/images/entities/char_2009.gif) 29 and TPSSh30 functionals were used to optimise the geometries of [An(H2O)9]4+, however only PBE0 gave reasonable geometries without imaginary vibrational modes for the α-Fe13 Keggin and An–Fe13 Keggins. Attempts to remove the imaginary frequencies found using other functionals, by screwing along the imaginary modes and reoptimising the geometry, led only to other imaginary modes, most likely caused by numerical error in the calculation of solution phase vibrational frequencies. Note that the PBE0 functional has been used extensively in the computation of actinide complexes containing actinide–oxygen interactions.31–34 Dispersion corrections were applied using Grimme's D3 with Becke–Johnson damping.35,36 The non-actinides were treated with the Ahlrichs def2-SVP basis sets37,38 and associated auxiliary basis sets,39 and the actinides were treated with the Dolg quadruple-ζ quality basis set and corresponding 60-electron effective core potential, def-ECP, available in the TURBOMOLE library.40 The self-consistent field convergence was set to 10−8 a.u. for the electronic energy, and geometries were optimised at 10−6 a.u. for the energy with 10−4 a.u. for the maximum norm of the gradient, except for the Pa-substituted cluster where the geometry was optimised with the gradients converged to 10−3 a.u. Single point energy calculations were also performed using the series of functionals noted above, at the PBE0 optimised geometries with the def2-TZVP basis sets38 and associated auxiliary basis sets on non-actinides.41,42
29 and TPSSh30 functionals were used to optimise the geometries of [An(H2O)9]4+, however only PBE0 gave reasonable geometries without imaginary vibrational modes for the α-Fe13 Keggin and An–Fe13 Keggins. Attempts to remove the imaginary frequencies found using other functionals, by screwing along the imaginary modes and reoptimising the geometry, led only to other imaginary modes, most likely caused by numerical error in the calculation of solution phase vibrational frequencies. Note that the PBE0 functional has been used extensively in the computation of actinide complexes containing actinide–oxygen interactions.31–34 Dispersion corrections were applied using Grimme's D3 with Becke–Johnson damping.35,36 The non-actinides were treated with the Ahlrichs def2-SVP basis sets37,38 and associated auxiliary basis sets,39 and the actinides were treated with the Dolg quadruple-ζ quality basis set and corresponding 60-electron effective core potential, def-ECP, available in the TURBOMOLE library.40 The self-consistent field convergence was set to 10−8 a.u. for the electronic energy, and geometries were optimised at 10−6 a.u. for the energy with 10−4 a.u. for the maximum norm of the gradient, except for the Pa-substituted cluster where the geometry was optimised with the gradients converged to 10−3 a.u. Single point energy calculations were also performed using the series of functionals noted above, at the PBE0 optimised geometries with the def2-TZVP basis sets38 and associated auxiliary basis sets on non-actinides.41,42
All-electron single point calculations at the ECP-optimised geometries were also performed using Gaussian 16 (Revision C.01)43 with the second order DKH relativistic Hamiltonian (DKH2, int = (grid = ultrafine,dkh)) and all-electron scalar relativistic SARC-DKH2 basis sets on actinides44 and Def2TZVP on non-actinides,38 with the PBE0 functional. The energy was converged to 10−8 a.u. using settings similar to those used in TURBOMOLE. AIMAll 19.02.13![[thin space (1/6-em)]](https://www.rsc.org/images/entities/char_2009.gif) 45 was used to calculate QTAIM properties using .wfx files produced by Gaussian. NBO 7.0.8
45 was used to calculate QTAIM properties using .wfx files produced by Gaussian. NBO 7.0.8![[thin space (1/6-em)]](https://www.rsc.org/images/entities/char_2009.gif) 46 was used to perform natural population analysis and calculate Wiberg bond indices. Multiwfn47 was used to perform Mulliken population analysis using .fchk files produced by Gaussian. To assess the effects of spin–orbit coupling (SOC), these single point calculations were repeated using the fourth order DKH relativistic Hamiltonian (DKH4, int = (grid = ultrafine,dkhso)). The inclusion of SOC was found to have little effect on the results; a comparison between the all-electron and all-electron + SOC can be found in the ESI (Fig. S11†), but the data presented in the main text are from calculations without SOC.
46 was used to perform natural population analysis and calculate Wiberg bond indices. Multiwfn47 was used to perform Mulliken population analysis using .fchk files produced by Gaussian. To assess the effects of spin–orbit coupling (SOC), these single point calculations were repeated using the fourth order DKH relativistic Hamiltonian (DKH4, int = (grid = ultrafine,dkhso)). The inclusion of SOC was found to have little effect on the results; a comparison between the all-electron and all-electron + SOC can be found in the ESI (Fig. S11†), but the data presented in the main text are from calculations without SOC.
To summarise, the results presented in the following section regarding geometry are from the TURBOMOLE ECP calculations, while those on the energetics of reaction are derived from the Gaussian all-electron calculations without spin–orbit coupling and including RRHO thermodynamic corrections calculated using TURBOMOLE frequencies. All other properties are derived from the Gaussian all-electron calculations without spin–orbit coupling.
Results and discussion
Structural parameters and substitution of An onto α-Fe13
To stabilise the α-Fe13 experimentally as a single crystal, trichloro acetate (TCA) ligands and Bi3+ counter cations were used.7,16 As neither of these are present within the EARP, Weatherill et al. suggested that the increased stability of α-Fe13 within the EARP is due to the presence of H+ and Na+ ions. NaOH is used in the base induced hydrolysis process, and hence in our model we have replaced Bi3+ with Na+, noting their similar ionic radii (1.31 Å vs. 1.32 Å, respectively).48 Other work has shown that both Li+ and Cs+ can displace Bi3+ in these polyoxometalate structures.16 Displacement of Bi3+ by Cs+ resulted in slower precipitation than Li+ suggesting that larger alkali metals stabilise the Fe13 cluster more in solution. If indeed the cluster is capped with Na+ in solution at the EARP this could explain its transient nature at low pH and rapid conversion to Fh. In our model, the terminating TCA ligands were removed, and solvation was treated implicitly. As the capping cation charge has been reduced from +3 to +1, the charge was balanced by converting half of the μ2-O atoms in the cluster to μ2-OH. The OH sites were previously assigned based on bond distances, angles, and bond valence sum calculations.16 The Na+ cations are coordinated by two explicit water molecules bringing the overall Na–O coordination number to 6, thus preserving Na+ coordination between aquo ion and in the clusters. This results in a α-Fe(III)13 structure with chemical formula [{Na(H2O)2}6Fe13O28H12]+ (overall charge of −5 without the capping Na+) consisting of a central FeO4 tetrahedron surrounded by 12 FeO5 square-based pyramidal polyhedra. Four Fe are bridged by two μ2-O and two μ2-OH to form a “square-window” which is capped by Na+(H2O)2 (Fig. 1). Each Fe(III) has a high-spin 3d5 configuration resulting in an overall spin-multiplicity of 66 for the cluster (Table 1).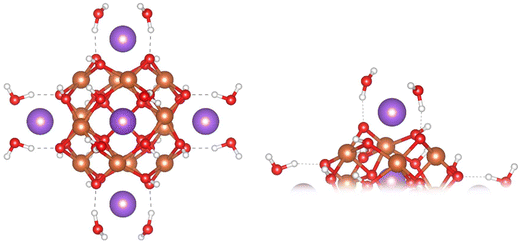 | ||
| Fig. 1 Ball and stick images of the optimised geometry of the Na+-capped Fe13 Keggin model (left), close up of the “square-window” (right). Colour scheme: Fe, orange; O, red; H, white; Na, purple. | ||
| An | Charge | Spin multiplicity | Expected S(S + 1) | Calculated S(S + 1) |
|---|---|---|---|---|
| Unsubstituted | +1 | 66 | 1088.75 | 1088.87 |
| Th | +4 | 66 | 1088.75 | 1088.87 |
| Pa | +4 | 67 | 1122.00 | 1122.12 |
| U | +4 | 68 | 1155.75 | 1155.88 |
| Np | +4 | 69 | 1190.00 | 1190.13 |
| Pu | +4 | 70 | 1224.75 | 1224.89 |
Smith et al.'s experiments suggest that Pu is present as Pu(IV), with 5–8% as PuO2 and the majority in the form of a tetradentate surface complex, potentially involving the “square window” of the Fe13 Keggin unit.8 We here calculate the latter complexes for all five An(IV) (An = Th–Pu), and the energetics of formation of these species from the hydrated aquo complex [An(H2O)9]4+. Such species form under acidic conditions.49 Our optimised average An–O distances in [An(H2O)9]4+ are closer to the experimental EXAFS data than previously reported MP2 calculations, though note we are comparing [An(H2O)9]4+ with [An(H2O)9]4+·H2O.49 This distance decreases linearly across the series following the 8 coordinate actinide 4+ ionic radii,50 with R2 = 0.99 at the PBE0 level (Fig. S1 and Table S1†). For all functionals surveyed, DFT underpredicts the An–O bond distances vs. MP2 calculations and EXAFS data (Fig. S2†). The choice of functional has little effect on the optimised distances, however it is notable that the hybrid functionals yield shorter An–O bond lengths than their non-hybrid counterparts. This effect is well known, and can be attributed to the improved treatment of exchange interactions by the hybrid functionals.51
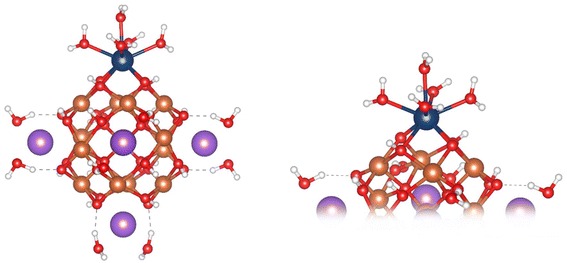
Table 2 shows the computed distances between the actinide and the “square-window” of the An–Fe13 Keggin cluster, and ball and stick images of the Pu system are shown in Fig. 2. While there is no experimental evidence for the coordination of the substituted An4+ in these clusters under EARP conditions, it is likely that their co-ordination number remains the same on going from aquo complexes to Keggin substitution. There are four oxygens in the square window of the Keggin, and hence 5 water molecules make up the rest of the actinides’ coordination sphere. The Pu–Fe13 cluster shows Pu–O and Pu–OH distances within ca. 0.04 Å of the experimentally obtained distances in Smith's split-shell fit. The average Pu–Fe distance of 3.49 Å is also in good agreement with the literature value of 3.44 Å, although the split-shell Pu–Fe fit also suggests a Pu–Fe distance of 3.27 Å in the Pu–Fh surface complex, which is not found in our Pu–Fe13 cluster. The similarity between the An coordination environment in Pu–Fe13 determined here and Pu–Fh determined experimentally supports the theory that Pu is interacting with Fe13 Keggin clusters at the molecular level in solution at the EARP prior to Fh formation and remains in a similar coordination environment during this transformation. From Th–Pu the An–Fe and An–OH2 distances generally decrease in line with the decreasing ionic radii of the actinide, whereas the An–O decreases from Th to Pa then stays constant to Pu and An–OH is constant from Th–U before decreasing at Np and Pu.
Thermodynamic trends of An(IV) substitution onto the α-Fe13 Keggin
Weatherill et al. showed that the α-Fe13 Keggin forms under EARP conditions without the presence of an actinide, and so we here assume that the α-Fe13 Keggin forms in solution, capped by Na+, and then the actinide substitutes for the Na+ in the “square-window”. The reaction energy for the substitution of Na+ with An4+ was studied using the following equation | (1) |
The Gibbs reaction energies are calculated according to
| ΔrG°(298.15 K) = ∑(ε0 + Gcorr)products − ∑(ε0 + Gcorr)reactants | (2) |
 | ||
| Fig. 3 PBE0/Def2TZVP/SARC-DKH2 reaction energy Δr according to eqn (2) relative to Th. | ||
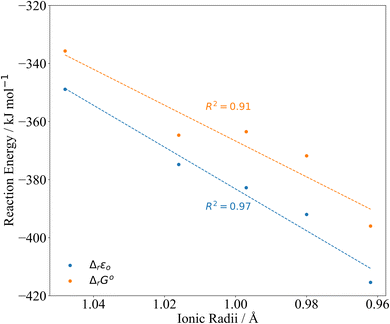 | ||
| Fig. 4 PBE0/Def2TZVP/SARC-DKH2 reaction energy Δr according to eqn (2) compared to 8-coordinate An(IV) ionic radii.45 | ||
| An | Ionic radii45 | Δ r ε 0 | Δ r G° |
|---|---|---|---|
| Th | 1.048 | −348.9 | −335.7 |
| Pa | 1.016 | −374.8 | −364.7 |
| U | 0.997 | −382.8 | −363.5 |
| Np | 0.980 | −392.0 | −371.8 |
| Pu | 0.962 | −415.4 | −396.0 |
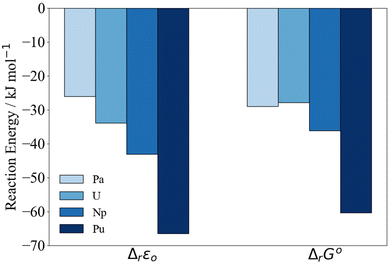
In Fig. 3, we have set Δr of the Th reaction to 0 and compare relative energies. At the ΔrG° level, the differences between the reaction energies in the middle of the series decrease such that Th < Pa ∼ U < Np < Pu. Due to the closeness in reaction energy of Pa–Np we tested to see if there was any functional dependence of the trend by performing a series of single point energy calculations on the PBE0 optimised geometries using the PBE, TPSS and TPSSh functionals. This set encompasses a range of functional quality from generalised gradient approximation (GGA), meta-generalised gradient approximation (mGGA), hybrid GGA and hybrid mGGA. The self-consistent electronic energies ε0 obtained using these functionals were combined with the PBE0 derived thermodynamic corrections. Regardless of the chosen functional, similar trends are observed (Fig. S3–S6 and Tables S2–S7†).
The reaction energies (Table 3) are plotted against the 8-coordinate An(IV) ionic radii45 in Fig. 4. The R2 values indicate strong correlation. Correlation is lower in the Gibbs energies, for which the reaction energy for Pa is more negative than might be expected on the basis of the trend line.‡Fig. 4 suggests that the interactions between the An(IV) and O atoms of the Keggin are predominantly ionic, and hence that the reaction energy trends are driven by the periodic increase in An(IV) charge density. That said, there may also be covalent contributions to the bonding, and we now turn to assessment of these effects.
Natural population, Mulliken, spin density and charge analysis of [{An(H2O)5}{Na(H2O)2}5FeO4Fe12(OH)12O12]4+
The actinide natural and Mulliken populations are given in Table 4. Both methods show that the nexcess(f) increases from Th–Pu; this has been taken before to be an indication of increasing covalency towards the middle of the actinide series55 with examples reported for high-coordinate tetravalent actinide systems with hard donor ligands (O and F) in line with the results reported here.34,56 The general increase of nexcess(f) from Th–Pu is indicative of greater mixing of the An(5f) with the O(2p)-based MOs across the series, as the 5f orbitals lower in energy and become closer in energy to the O(2p) orbitals.55 The distinction between energy-degeneracy and orbital overlap driven covalency in the actinide series has been discussed elsewhere.55,57,58| An | NPA | Mulliken | ||||
|---|---|---|---|---|---|---|
| n(d) | n(f) | n excess(f) | n(d) | n(f) | n excess(f) | |
| Th | 1.08 | 0.09 | 0.09 | 0.94 | 0.41 | 0.41 |
| Pa | 1.14 | 1.61 | 0.61 | 0.97 | 1.46 | 0.46 |
| U | 1.16 | 2.61 | 0.61 | 0.98 | 2.53 | 0.53 |
| Np | 1.19 | 3.63 | 0.63 | 1.01 | 3.56 | 0.56 |
| Pu | 1.19 | 4.71 | 0.71 | 1.04 | 4.61 | 0.61 |
The spin density (ρs) can be used similarly to nexcess(f) to probe covalency trends, and was calculated on the actinide centres using NPA, Mulliken and QTAIM analysis (Table 5). The NPA and QTAIM derived ρs are very similar and very close to the formal value expected for the tetravalent actinides, supporting ionic bonding. The Mulliken derived ρs show small deviations from the expected value with the excess ρs, indicating modest Keggin → An charge transfer increases across the series, while the NPA excess ρs peak at U. The partial charge on the actinide centre q(M) has also been calculated with the different methods (Table 5). Noting that partial charges rarely approach formal values, deviation of charge compared to the formal value is also used as a measure of An–ligand orbital mixing.34,56,59 The magnitude of q(M) calculated with QTAIM is higher than that of NPA analysis; such differences have been observed previously.59,60 The Mulliken and QTAIM charges are in good agreement, decreasing from Th–Pu, and follow nexcess(f) in suggesting increased covalency from Th–Pu. Another quantity we have considered is the difference between the atomic number (Z) and localisation index (λ) derived from the QTAIM. Because λ is a measure of the number of electrons localised on the actinide centre, the quantity Z − λ can be considered as a measure of the number of electrons donated by the actinide to the surrounding ligands, which is a measure of oxidation state.61,62 Although the absolute values of Z − λ are close to 4.5, that they change little across the series supports the conclusion that all the An are in the same oxidation state.
| An | NPA | Mulliken | QTAIM | ||||
|---|---|---|---|---|---|---|---|
| q(M) | ρ s(M) | q(M) | ρ s(M) | q(M) | ρ s(M) | Z − λ | |
| Th | 1.63 | 0.08 | 2.94 | 0.02 | 2.96 | 0.02 | 4.52 |
| Pa | 1.47 | 1.08 | 2.87 | 1.09 | 2.88 | 1.01 | 4.55 |
| U | 1.36 | 2.10 | 2.79 | 2.13 | 2.80 | 2.02 | 4.54 |
| Np | 1.27 | 3.06 | 2.70 | 3.12 | 2.75 | 3.02 | 4.51 |
| Pu | 1.23 | 4.03 | 2.62 | 4.15 | 2.69 | 4.04 | 4.48 |
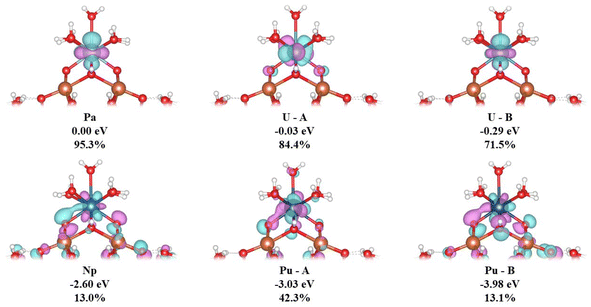
We now turn to an analysis of the Kohn–Sham molecular orbitals; details of selected orbitals are given in Table 6 and Fig. 5. The MOs labelled Pa, U–A and U–B are largely f-orbitals localised on the actinide centre. By contrast, the MOs labelled Np, Pu–A and Pu–B have much smaller, but still significant, 5f character and show spatial overlap with the Keggin O atoms in the “square-window”.
| An | ΔE/eV | %An(f) |
|---|---|---|
| Pa | 0.00 | 95.3 |
| U–A | −0.03 | 84.4 |
| U–B | −0.29 | 71.5 |
| Np | −2.60 | 13.0 |
| Pu–A | −3.03 | 42.3 |
| Pu–B | −3.98 | 13.1 |
The trends in nexcess(f) and q(M) suggest that covalency increases from Th–Pu. This is in agreement with Kohn–Sham MO population analysis; An(5f)–O(2p) overlap is observed in Np, Pu–A and Pu–B MOs and is not found in Th–U. The presence of overlap of Np(5f) and Pu(5f) with the “square-window” O(2p) in the valence bonding region MOs will likely contribute to the enhanced reaction energies involving these clusters.
QTAIM analysis of the An–O bonding in [{An(H2O)5}{Na(H2O)2}5FeO4Fe12(OH)12O12]4+
To further understand the trends in reaction energy and investigate potential An–O covalency, a variety of QTAIM properties were considered in addition to the charges and localisation indices presented above. These include the An–O delocalisation indices (δ), the electron density at the An–O bond critical points (ρBCP), the energy density at the BCP (HBCP) and the ratio of the kinetic (GBCP) and potential energy (VBCP) at the BCP, −(G/V)BCP. The values discussed (Tables S10–S12†) are taken as the average of similar An–O interactions in the cluster; there are two Pu–O, two Pu–OH and five Pu–OH2 BCPs (Fig. S10†) so the average of two, two and five is presented.We begin with the delocalisation indices (δ), and another measure of bond order, the Wiberg bond indices (WBI) (Fig. 6). If we assume that bond order is related to bond strength, both metrics indicate that the strength of the bonds follows the order An–OH2 < An–OH < An–O. The absolute values of the WBIs are slightly larger than those of the delocalisation indices, but both measures of bond order are in good agreement in predicting the same periodic trend for all bonds. An–OH and An–OH2 bonds get stronger traversing the series. However, the An–O bonds maximise after U, with δ suggesting that U is the most covalent actinide, in agreement with other QTAIM studies of the early actinides,63–66 and WBI suggesting Pu is the most covalent actinide, in agreement with the analysis in the previous section.
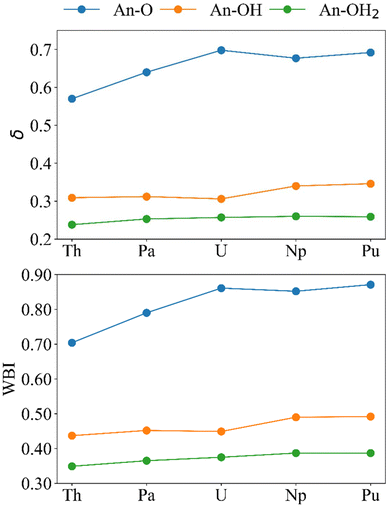 | ||
| Fig. 6 Bond order metrics for [{An(H2O)5}{Na(H2O)2}5Fe13O28H12]4+. Upper; delocalisation indices and lower; Wiberg bond indices (calculated at the PBE0/Def2TZVP/SARC-DKH2 level). | ||
The electron density at the BCP (Fig. 7) can also be used to analyse the interactions between the actinides and the cluster, although care must be taken when doing so as a buildup of electron density at the BCP does not necessarily mean that there is enhanced covalency in certain systems compared to others as, generally, when the distance between two atoms decreases the density between them increases. Herein, the values reported at the An–O BCPs are similar to those reported elsewhere.31–34 Generally, we consider ρBCP > 0.20 as a covalent interaction and ρBCP < 0.10 as closed-shell.67 The trends for r (Fig. 7 and Table 2) and ρBCP in the An–OH2 and An–OH bonds agree with what is expected of primarily ionic interactions; from Th–Pu r generally decreases and ρBCP generally increases, and all values are below 0.10. There is a significant decrease in r(An–OH) accompanied by an increase in ρBCP(An–OH) from U to Np and Pu. An–O does not follow the ionic trend; much like δ these metrics both peak at U, which has the shortest An–O bond and highest ρBCP despite its larger ionic radius compared with Np and Pu. For Pa–Pu we can see that 0.10 < ρBCP < 0.20 showing partial covalency in the An–O interactions. It is noteworthy that beyond Th the An–O distance is very similar, which could suggest that the space within the “square-window” between the two oxygen atoms (O–An–O) is limited, and the decrease in ionic size of the actinides does not allow them closer to the two oxygen atoms simultaneously.
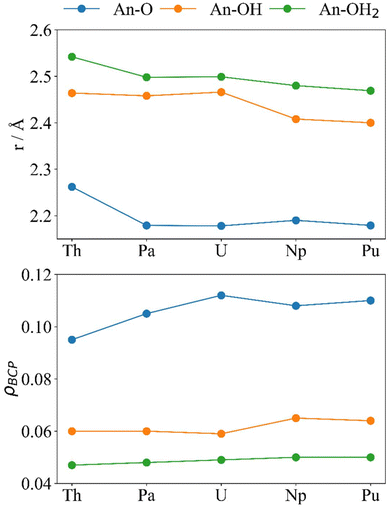 | ||
| Fig. 7 Optimised distances r (Å, upper) and ρBCP (a.u., lower) for [{An(H2O)5}{Na(H2O)2}5Fe13O28H12]4+ (calculated at the PBE0/Def2TZVP/SARC-DKH2 level). | ||
The Laplacian of the electron density, ∇2ρ, describes the extent to which the density is concentrated (∇2ρ < 0) or depleted (∇2ρ > 0) along the bond path. The Laplacian itself can be misleading, however, for highly polarised bonds such as An–O often have positive values, even if there is buildup of density along the path. This makes ∇2ρBCP a poor metric for discussing An–O interactions. However, we can turn to the virial theorem (eqn (3)) and definition of total energy density (HBCP) (eqn (4)) in terms of the sum of the kinetic (GBCP) and potential (VBCP) contributions:
| ¼∇2ρBCP = 2GBCP + VBCP | (3) |
| HBCP = GBCP + VBCP | (4) |
Because GBCP < |VBCP| < 2GBCP, ¼∇2ρBCP is positive and HBCP is negative. The ratio −(G/V)BCP has been shown to quantify the extent of covalency when between 0.5 and 1, where 0.5 is more covalent and 1 is less covalent.31–33,67–69 For all systems in this study HBCP is negative and −(G/V)BCP is between 0.5 and 1 (Fig. 8) indicating partial covalency in the bonds.
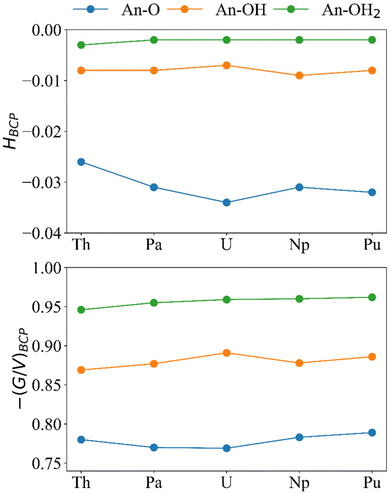 | ||
| Fig. 8 H BCP and −(G/V)BCP (a.u.) for the An–O, An–OH, and An–OH2 bonds in [{An(H2O)5}{Na(H2O)2}5Fe13O28H12]4+ (calculated at the PBE0/Def2TZVP/SARC-DKH2 level). | ||
The magnitude of HBCP generally increases in the order An–OH2 < An–OH < An–O and for −(G/V)BCP the reverse trend is observed. This result is in keeping with previous analysis of the bond order metrics and ρBCP showing An–OH2 and An–O as the least and most covalent bonds, respectively. If we focus on the An–O bonds, which are the shortest, most covalent, and likely to be the main driver of An-Keggin binding, we see that both HBCP and −(G/V)BCP again indicate that U is the most covalent actinide, albeit that the difference in −(G/V)BCP between Pa and U is small; we note that Pa–O bonds have previously been reported as more covalent than U–O according to −(G/V)BCP.32
Conclusions
At Sellafield's enhanced actinide removal plant it is likely that aquo actinide complexes substitute onto α-Fe13 Keggin clusters at low pH prior to ferrihydrite formation. We have calculated the geometries of these substituted complexes and find that the optimised Pu structure is in good agreement with previous EXAFS data. Substitution reaction energies have been calculated for tetravalent actinides (An = Th–Pu); all are significantly negative, with ΔrG° in the range −335.7 kJ mol−1 (Th) to −396.0 kJ mol−1 (Pu). There is strong correlation between the reaction energies and the ionic radii of the actinides suggesting that the reaction energy trends are driven primarily by the size decrease and charge density increase of the An(IV) cation. To probe possible covalent contributions, NPA, Mulliken and spin-density analyses have been used to show that covalency increases from Th–Pu. This is supported by analysis of the composition of the Kohn–Sham MOs; we find orbitals with An(5f)–O(2p) spatial overlap that increases in the later actinides studied. These interactions may also contribute to the stability of the substituted clusters.QTAIM analysis shows that all An–O interactions are partially covalent, with −(G/V)BCP in the range 0.5–1.0. The An–O bonds have the highest bond order (δ and WBI) and are the most covalent compared to An–OH and An–OH2, according to the ρBCP, HBCP and −(G/V)BCP metrics. The An–OH2 interactions are the least covalent and An–OH lies between An–O and An–OH2. This is also reflected in the bond distances. All An–O QTAIM metrics show increasing covalency from Th–U, which is in line with previously reported work in which U is considered the most covalent actinide according to the QTAIM.
Overall, the very favorable reaction energies suggest that the α-Fe13 Keggin is indeed capable of scavenging and stabilising tetravalent Th–Pu in aqueous solution. The interactions between actinides and Fe13 are primarily ionic, but with increasing covalency across the series. We hope that this work stimulates further experimental research into the low pH uptake of An(IV) under EARP conditions, and we are currently investigating the interactions of Pu(IV) with various ferrihydrite surfaces using periodic boundary condition DFT.
Conflicts of interest
There are no conflicts to declare.Acknowledgements
We are grateful for an EPSRC funded PhD studentship to R. L. D. We also thank the University of Manchester for its Computational Shared Facility (CSF3 and CSF4) and associated support services, Professor Steve Liddle for helpful discussions, and the reviewers for their helpful comments.References
- UK Government Press Release, https://www.gov.uk/government/news/job-done-sellafield-plant-safely-completes-its-mission (accessed 14/06/2023).
- J. S. Weatherill, K. Morris, P. Bots, T. M. Stawski, A. Janssen, L. Abrahamsen, R. Blackham and S. Shaw, Environ. Sci. Technol., 2016, 50, 9333–9342 CrossRef CAS PubMed.
- E. H. Winstanley, K. Morris, L. G. Abrahamsen-Mills, R. Blackham and S. Shaw, J. Hazard. Mater., 2019, 366, 98–104 CrossRef CAS PubMed.
- L. T. Townsend, K. F. Smith, E. H. Winstanely, K. Morris, O. Stagg, J. F. W. Mosselmans, F. R. Livens, L. Abrahamsen-Mills, R. Blackham and S. Shaw, Minerals, 2022, 12, 165 CrossRef CAS.
- M. Zhu, B. W. Puls, C. Freandsen, J. D. Kubicki, H. Zhang and G. A. Waychunas, Inorg. Chem., 2013, 52, 6788–6797 CrossRef CAS PubMed.
- M. Zhu, C. Frandsen, A. F. Wallace, B. Legg, S. Khalid, H. Zhang, S. Mørup, J. F. Banfield and G. A. Waychunas, Geochim. Cosmochim. Acta, 2016, 172, 247–264 CrossRef CAS.
- O. Sadeghi, L. N. Zakharov and M. Nyman, Science, 2015, 347, 1359–1362 CrossRef CAS PubMed.
- K. F. Smith, K. Morris, G. T. W. Law, E. H. Winstanely, F. R. Livens, J. S. Weatherill, L. G. Abrahamsen-Mills, N. D. Bryan, F. W. Mosselmans, G. Cibin, S. Parry, R. Blackham, K. A. Law and S. Shaw, ACS Earth Space Chem., 2019, 3, 2437–2442 CrossRef CAS PubMed.
- O. Stagg, K. Morris, L. T. Townsend, E. S. Ilton, L. Abrahamsen-Mills and S. Shaw, Appl. Geochem., 2023, 159, 105830 CrossRef CAS.
- S. Stumpf, T. Stumpf, K. Dardenne, C. Hennig, H. Foerstendorf, R. Klenze and T. Fanghänel, Environ. Sci. Technol., 2006, 40, 3522–3528 CrossRef CAS PubMed.
- F. Seco, C. Hennig, J. de Pablo, M. Rovira, I. Rojo, V. Martí, J. Giménez, L. Duro, M. Grivé and J. Bruno, Environ. Sci. Technol., 2009, 43, 2825–2830 CrossRef CAS PubMed.
- T. D. Waite, J. A. Davis, T. E. Payne, G. A. Waychunas and N. Xu, Geochim. Cosmochim. Acta, 1994, 58, 5465–5478 CrossRef CAS.
- Y. Wang, J. Wang, P. Li, H. Qin, J. Liang and Q. Fan, Environ. Technol. Innovation, 2021, 23, 101615–101624 CrossRef CAS.
- E. Krawczyk-Bärsch, A. C. Scheinost, A. Rossberg, K. Müller, F. Bok, L. Hallbeck, J. Lehrich and K. Schmeide, Environ. Sci. Pollut. Res., 2021, 28, 181342–118353 Search PubMed.
- P. Bots, S. Shaw, G. T. W. Law, T. A. Marshall, J. F. W. Mosselmans and K. Morris, Environ. Sci. Technol., 2016, 50, 3382–3390 CrossRef CAS PubMed.
- O. Sadeghi, C. Falaise, P. I. Molina, R. Hifschmid, C. F. Campana, B. C. Noll, N. D. Browning and M. Nyman, Inorg. Chem., 2016, 55, 11078–11088 CrossRef CAS PubMed.
- M. Amiri, N. P. Martin, O. Sadeghi and M. Nyman, Inorg. Chem., 2020, 59, 3471–3481 CrossRef CAS PubMed.
- M. Chen, X. Zheng, X. Kong, L. Long and L. Zheng, Inorg. Chem., 2023, 62(5), 1781–1785 CrossRef CAS PubMed.
- X. Zheng, M. Du, M. Amiri, M. Nyman, Q. Liu, T. Liu, X. Kong, L. Long and L. Zheng, Chem. – Eur. J., 2020, 26, 1388–1395 CrossRef CAS PubMed.
- X. Zheng, M. Chen, M. Du, R. Wei, X. Kong, L. Long and L. Zheng, Chem. – Eur. J., 2020, 26, 11985–11988 CrossRef CAS PubMed.
- A. Bino, M. Ardon, D. Lee, B. Spingler and S. J. Lippard, J. Am. Chem. Soc., 2002, 124, 4578–4579 CrossRef CAS PubMed.
- Y. V. Rakitin and J. van Slageren, Russ. J. Coord. Chem., 2004, 30, 810–812 CrossRef CAS.
- S. G. Balasubramani, G. P. Chen, S. Coriani, M. Diedenhofen, M. S. Frank, Y. J. Franzke, F. Furche, R. Grotjahn, M. E. Harding, C. Hättig, A. Hellweg, B. Helmich-Paris, C. Holzer, U. Huniar, M. Kaupp, A. M. Khah, S. K. Khani, T. Müller, F. Mack, B. D. Nguyen, S. M. Parker, E. Perlt, D. Rappoport, K. Reiter, S. Roy, M. Rückert, G. Schmitz, M. Sierka, E. Tapavicza, D. P. Tew, C. van Wüllen, V. K. Voora, F. Weigend, A. Wodyński and J. M. Yu, J. Chem. Phys., 2020, 152, 184107 CrossRef CAS PubMed.
- M. Sierka, A. Hogekamp and R. Alrichs, J. Chem. Phys., 2003, 118, 9136 CrossRef CAS.
- A. M. Burow, M. Sierka and F. Mohamed, J. Chem. Phys., 2009, 131, 214101 CrossRef PubMed.
- A. Klamt and G. Schüürmann, J. Chem. Soc., Perkin Trans. 2, 1993, 799–805 RSC.
- J. P. Perdew, K. Burke and M. Ernzerhof, Phys. Rev. Lett., 1996, 77, 3865 CrossRef CAS PubMed.
- J. Tao, J. P. Perdew, V. N. Staroverov and G. E. Scuseria, J. Chem. Phys., 2003, 91, 146401 Search PubMed.
- J. P. Perdew, M. Ernzenhof and K. Burke, J. Chem. Phys., 1996, 105, 9982 CrossRef CAS.
- V. N. Starverov, G. E. Scuseria, J. Tao and J. P. Perdew, J. Chem. Phys., 2003, 119, 12129–12137 CrossRef.
- V. E. J. Berryman, Z. J. Whalley, J. J. Shephard, T. Ochiai, A. N. Price, P. L. Arnold, S. Parsons and N. Kaltsoyannis, Dalton Trans., 2019, 48, 2939–2947 RSC.
- V. E. J. Berryman, J. J. Shephard, T. Ochiai, A. N. Price, P. L. Arnold, S. Parsons and N. Kaltsoyannis, Phys. Chem. Chem. Phys., 2020, 22, 16804–16812 RSC.
- J. J. Shephard, V. E. J. Berryman, T. Ochiai, O. Walter, A. N. Price, M. R. Warren, P. L. Arnold, N. Kaltsoyannis and S. Parsons, Nat. Commun., 2022, 13, 5923 CrossRef CAS PubMed.
- T. Radoske, R. Kloditz, S. Fichter, J. März, P. Kaden, M. Patzschke, M. Schmidt, T. Stumpf, O. Walter and A. Ikeda-Ohno, Dalton Trans., 2020, 49, 17559–17570 RSC.
- S. Grimme, J. Antony, S. Ehrlich and H. Kreih, J. Chem. Phys., 2010, 132, 154104 CrossRef PubMed.
- S. Grimme, S. Ehrlich and L. Goerigk, J. Comput. Chem., 2011, 32, 1456–1465 CrossRef CAS PubMed.
- A. Schäfer, H. Horn and R. Alrichs, J. Chem. Phys., 1992, 97, 2571 CrossRef.
- F. Weigend and R. Alrichs, Phys. Chem. Chem. Phys., 2005, 7, 3297–3305 RSC.
- K. Eichkorn, O. Treutler, H. Öhm, M. Häser and R. Alrichs, Chem. Phys. Lett., 1995, 242, 652 CrossRef CAS.
- X. Cao, M. Dolg and H. Stoll, J. Chem. Phys., 2003, 118, 487 CrossRef CAS.
- F. Weigend, M. Häser, H. Patzelt and R. Alrichs, Chem. Phys. Lett., 1998, 294, 143–152 CrossRef CAS.
- K. Eichkorn, F. Wigend, O. Treutler and R. Alrichs, Theor. Chem. Acc., 1997, 97, 119–124 Search PubMed.
- M. J. Frisch, G. W. Trucks, H. B. Schlegel, G. E. Scuseria, M. A. Robb, J. R. Cheeseman, G. Scalmani, V. Barone, G. A. Petersson, H. Nakatsuji, X. Li, M. Caricato, A. Marenich, J. Bloino, B. G. Janesko, R. Gomperts, B. Mennucci, H. P. Hratchian, J. V. Ortiz, A. F. Izmaylov, J. L. Sonnenberg, D. Williams-Young, F. Ding, F. Lipparini, F. Egidi, J. Goings, B. Peng, A. Petrone, T. Henderson, D. Ranasinghe, V. G. Zakrzewski, J. Gao, N. Rega, G. Zheng, W. Liang, M. Hada, M. Ehara, K. Toyota, R. Fukuda, J. Hasegawa, M. Ishida, T. Nakajima, Y. Honda, O. Kitao, H. Nakai, T. Vreven, K. Throssell, J. A. Montgomery Jr., J. E. Peralta, F. Ogliaro, M. J. Bearpark, J. J. Heyd, E. N. Brothers, K. N. Kudin, V. N. Staroverov, T. A. Keith, R. Kobayashi, J. Normand, K. Raghavachari, A. P. Rendell, J. C. Burant, S. S. Iyengar, J. Tomasi, M. Cossi, J. M. Millam, M. Klene, C. Adamo, R. Cammi, J. W. Ochterski, R. L. Martin, K. Morokuma, O. Farkas, J. B. Foresman and D. J. Fox, Gaussian 16 Revision C.01, Gaussian, Inc., Wallingford, CT, 2016 Search PubMed.
- D. A. Pantazis and F. Neese, J. Chem. Theory Comput., 2011, 7, 677–684 CrossRef CAS.
- T. A. Keith, AIMAll (Version 19.10.12), TK Gristmill Software, Overland Park KS, USA, 2019 Search PubMed.
- E. D. Glendening, J. K. Badenhoop, A. E. Reed, J. E. Carpenter, J. A. Bohmann, C. M. Morales, P. Karafiloglou, C. R. Landis and F. Weihold, NBO 7.0, Theoretical Chemistry Institute, University of Wisconsin, Madison, WI, 2018 Search PubMed.
- T. Lu and F. Chen, J. Comput. Chem., 2012, 33, 580–592 CrossRef CAS PubMed.
- R. D. Shannon, Acta Crystallogr., Sect. A, 1976, 32, 751–767 CrossRef.
- N. L. Banik, V. Vallet, F. Réal, R. M. Belmecheri, B. Schimmelpfennig, J. Rothe, R. Marsac, P. Lindqvist-Reis, C. Walther, M. A. Denecke and C. M. Marquardt, Dalton Trans., 2016, 45, 453 RSC.
- G. R. Choppin and E. N. Rizkalla, Lanthanides/Actinides: Chemistry, in Handbook on the Physics and Chemistry of Rare Earths, ed. K. A. Gscheidner Jr., L. Eyering, G. R. Choppin and G. H. Lander, Elsevier Science, Amsterdam, The Netherlands, 1994, vol. 18, ch. 128, p. 560 Search PubMed.
- C. Adamo and V. Barone, J. Chem. Phys., 1999, 110, 6158–6170 CrossRef CAS.
- T. Megyes, S. Bálint, T. Grósz, T. Radnai, I. Bakó and P. Sipos, J. Chem. Phys., 2008, 128, 44501 CrossRef PubMed.
- M. Soniat, D. M. Rogers and S. B. Rempe, J. Chem. Theory Comput., 2015, 11, 2958–2967 CrossRef CAS PubMed.
- M. Galib, M. D. Baer, L. B. Skinner, C. J. Mundy, T. Huthwelker, G. K. Schenter, C. J. Benmore, N. Govind and J. L. Fulton, J. Chem. Phys., 2017, 146, 084504 CrossRef CAS PubMed.
- N. Kaltsoyannis, Inorg. Chem., 2013, 52, 3407–3413 CrossRef CAS PubMed.
- B. Scheibe, M. Patzschke, J. März, M. Conrad and F. Kraus, Eur. J. Inorg. Chem., 2020, 39, 3753–3759 CrossRef.
- M. L. Neidig, D. L. Clark and R. L. Marting, Chem. Rev., 2013, 257, 394–406 CAS.
- J. Su, E. R. Batista, K. S. Boland, S. E. Bone, J. A. Bradley, S. K. Cary, D. L. Clark, S. D. Conradson, A. S. Ditter, N. Kaltsoyannis, J. M. Keith, A. Kerridge, S. A. Kozimor, M. W. Löble, R. L. Martin, S. G. Minasian, V. Mocko, H. S. la Pierre, G. T. Seidler, D. K. Shuh, M. P. Wilkerson, L. E. Wolfsberg and P. Yang, J. Am. Chem. Soc., 2018, 140, 17977–17984 CrossRef CAS PubMed.
- S. Cooper and N. Kaltsoyannis, Dalton Trans., 2022, 51, 5929–5937 RSC.
- L. Yang, S. Cooper and N. Kaltsoyannis, Phys. Chem. Chem. Phys., 2021, 23, 4167–4177 RSC.
- A. Kerridge, RSC Adv., 2014, 4, 12078–12086 RSC.
- A. Kerridge, Chem. Commun., 2017, 53, 6685–6695 RSC.
- D. D. Schnaars, A. J. Gaunt, T. W. Hayton, M. B. Jones, I. Kirker, N. Kaltsoyannis, I. May, S. D. Reilly, B. L. Scott and G. Wu, Inorg. Chem., 2021, 51, 8557–8566 CrossRef PubMed.
- A. C. Behrle, A. J. Myers, A. Kerridge and J. R. Walensky, Inorg. Chem., 2018, 57, 10518–10524 CrossRef CAS PubMed.
- I. Kirker and N. Kaltsoyannis, Dalton Trans., 2010, 40, 124–131 RSC.
- M. J. Tassell and N. Kaltsoyannis, Dalton Trans., 2010, 39, 6719–6725 RSC.
- C. F. Matta and R. J. Boyd, The Quantum Theory of Atoms in Molecules from Solid State to DNA and Drug Design, Wiley-VCH, Weinheim, 2007 Search PubMed.
- M. Ziółkowskim, S. J. Grabowski and J. Leszczynski, J. Chem. Phys. A, 2006, 110, 6514–6521 CrossRef PubMed.
- S. Cooper and N. Kaltsoyannis, Dalton Trans., 2021, 50, 1478–1485 RSC.
Footnotes |
| † Electronic supplementary information (ESI) available: XYZ coordinates optimised at the PBE0/def2-SVP/ECP level and corresponding energies calculated at the PBE0/def2-TZVP/ECP and PBE0/Def2TZVP/SARC-DKH2 levels with and without spin–orbit coupling. Populations, charges, spin densities, and MOs calculated with the inclusion of spin–orbit coupling. QTAIM datasets generated at the PBE0/Def2TZVP/SARC-DKH2 level with and without spin–orbit coupling. Discussion of thermodynamic corrections and sources of error in Gcorr. Discussion of Mulliken analysis and the source of nexcess(d). See DOI: https://doi.org/10.1039/d3dt03761d |
| ‡ This decrease in correlation must come from the Gcorr term in eqn (2). Further details on the calculation of Gcorr from harmonic frequencies using the RRHO model are included in the ESI (see Fig. S13, S14 and Tables S16–S19†). |
| This journal is © The Royal Society of Chemistry 2024 |

