
 Open Access Article
 This Open Access Article is licensed under a
 Creative Commons Attribution 3.0 Unported Licence
Scanning ion conductance microscopy revealed cisplatin-induced morphological changes related to apoptosis in single adenocarcinoma cells†
Yusuf
Muhammed
 and
Robert A.
Lazenby
*
and
Robert A.
Lazenby
*
Department of Chemistry and Biochemistry, Florida State University, Tallahassee, Florida 32306-4390, USA. E-mail: rlazenby@fsu.edu
First published on 20th December 2023
Abstract
The studies of drug-induced apoptosis play a vital role in the identification of potential drugs that could treat diseases such as cancer. Alterations in the native morphology of cancer cells following treatment with anticancer drugs serve as one of the indicators that reveal drug efficacy. Various techniques such as optical microscopy, electron microscopy (EM), and atomic force microscopy (AFM) have been used to map the three dimensional (3D) morphological changes in cells induced with drugs. However, caution should be exercised when interpreting morphological data from techniques that might alter the native morphology of cells, caused by phototoxicity, electron beam invasiveness, intrusive sample preparation, and cell membrane deformation. Herein, we have used scanning ion conductance microscopy (SICM) to study the 3D morphology and roughness of A549 adenocarcinoma cells under physiological conditions before and after cisplatin induced apoptosis, where we observed an increase in height, overall shrinkage of the cells, and irregular features form on the cell membrane. Tracking the morphology of the same single A549 cells exposed to cisplatin unveiled heterogeneity in response to the drug, formation of membrane blebs, and an increase in membrane roughness. We have also demonstrated the use of SICM for studying the effect of cisplatin on the dynamic changes in the volume of A549 cells over days. SICM is demonstrated as a technique for studying the effect of drug induced apoptosis in the same cells over time, and for multiple different single cells.
1. Introduction
An understanding of anticancer drug-induced apoptosis is valuable in the identification of potential drugs for cancer treatment.1 Morphological changes observed during apoptosis can guide the investigation of the molecular pathways through which anticancer drugs exert their effects.2,3 There are a number of methods used to study apoptosis-induced morphological changes of cells,4 including bright-field microscopy,5 phase-contrast microscopy,6 differential interference contrast microscopy,7 fluorescence microscopy,8 confocal microscopy,9 and electron microscopy (EM).10 Most of the light microscopy methods cannot provide three-dimensional (3D) topographical details, and studying small portions of the cell membrane at high resolution is not feasible.11,12 White light interferometry is a label-free optical technique with high axial resolution that uses coherent light waves to generate a 3D profile of a surface.13 However, imaging the complexity of cell surfaces such as microvilli is beyond the capability of this technique, and its potential applications in microbiology measurements remain unexplored.14,15 Although fluorescence microscopy has enabled the imaging of labelled structures on the cell membrane, the fluorophore used might be invasive.16–18 The 3D images of cells can be captured with a confocal microscope, but the technique is used in conjunction with fluorescence microcopy, which involves labelling and sometimes fixation of cells. Additionally, the use of an intense laser light source in confocal microscopy can cause photobleaching and phototoxicity, which is problematic for revealing the native morphology of healthy cells.19Scanning electron microscopy (SEM) is one of the gold standard methods for imaging the 3D topography of cells, including cell surface features such as microvilli, while transmission electron microscopy (TEM) is suitable for imaging subcellular structures such as organelles. However, the invasive nature of the electron beam makes EM not suitable for imaging live cells, while the lengthy sample preparation (which may involve primary and secondary fixation, dehydration, drying, and coating with conductive material) and imaging time, make high throughput studies impractical.20–23 Therefore, there is a need for non-invasive and label-free methods for studying live cell morphology over time.24,25 Also, the discovery of new methods for apoptosis studies will impact the understanding of apoptosis at cellular and tissue level.26
Atomic force microscopy (AFM) is a label-free and well-established scanning probe microscopy (SPM) technique that offers high resolution imaging of the 3D topography of single cells,27,28 but due to the likelihood of contact between the AFM tip and the cell membrane, imaging mammalian cell lines is challenging, as the cantilever tip can deform the cell membrane and only information about the cytoskeleton can be obtained.29,30 SICM is a non-contact, non-invasive, and label-free SPM technique that uses a sharp nanopipette for studying the 3D topography of live cells in aqueous cell culture media under physiological conditions and with nanometer resolution.31 After the adherence of cells to a Petri dish surface, there is no need for further sample preparation, such as staining or labelling, as the cells are imaged using SICM within a few minutes in cell culture media.32 These attributes have enabled SICM to be used for studying dynamic changes in the morphology of cells over time.33 The technique is also used to acquire topography maps of small regions of the cell membrane with high resolution, in order to study complex biological structures.34 SICM has been used to map a variety of cell lines to acquire biological information, such as the presence of endocytic pits,35 interactions of viral-like particles with the cell membrane,36 single particle interactions with lung cells,37 dynamic changes in the morphology of platelets,38 mechanical properties of cancer cells,39 granules containing insulin on the membrane of INS-1 cells,40 cilia on the membranes of RPE-1 and MDCK cells,34 effects of applied bioactive substances on the surface structure of cardiomyocytes cells,41,42 and the nanoscale structure of renal cells.43 However, to the best of the authors' knowledge, this technique has not been used for the study of drug-induced morphological changes in single cancer cells.
Herein, we have utilized the non-invasive and label-free features of the SICM technique to study cisplatin-induced morphological changes in single A549 cells, which are lung carcinoma epithelial cells that mediate the transport of electrolyte and water across the alveoli.44 Cisplatin is a widely used chemotherapy drug, that has been shown to be effective in the treatment of cancers of the bladder, lungs, testicles, and ovaries.45 The drug alters DNA synthesis in cancer cells, leading to apoptosis,46 and exerts various effects on the morphology of cancer cells, such as cell shrinkage (cellular components condensation), nuclear alteration (compact packaging of DNA), cytoplasmic changes (blebbing of cytoplasm), formation of apoptotic bodies (membrane fragmentation into smaller membrane bound vesicles), and loss of cellular adhesion (disconnection of cells from tumors).47–49 In this work, we demonstrate the effects of cisplatin on A549 cell height, width, volume and surface roughness, by recording SICM images at various time intervals before and after exposure to the drug. We believe this tool will be useful in tracking the effects of a range of drugs on single cells of various types.
2. Experimental
2.1 A549 cell culture
A549 human adenocarcinoma lung epithelial cells were originally obtained from ATCC, and received as a gift from the lab of Qing-Xiang Amy Sang at Florida State University. The cells were cultured in Dulbecco's modified Eagle medium (DMEM) (VWR, North America), supplemented with 10% fetal bovine serum (FBS) (VWR, North America), inside a 75 cm2 flask (VWR, North America). The cells were stored in a CO2 incubator (VWR, North America) at 37 °C and 5% CO2 level, and split when confluent by detaching them from the 75 cm2 flask using trypsin-Ethylenediaminetetraacetic acid (EDTA) solution (Fisher Scientific). For SICM experiments, cells were sub-cultured by splitting the 75 cm2 flask into a 3.5 cm diameter tissue culture treated Petri dish (VWR, North America) in 3 mL media, and allowed 24 h for attachment. All cells used in SICM were in cell culture media that mimics physiological conditions, without staining or further sample preparation.2.2 Treatment of A549 cells with cisplatin
Cisplatin, the anticancer drug, was purchased in powder form from Fisher Scientific and dissolved in phosphate-buffered saline (PBS) solution (pH = 7.4) to make a stock solution of 500 μM. Our stock solution was prepared in PBS solution rather than dimethyl sulfoxide (DMSO), which has a nucleophilic sulfur that can coordinate with platinum complexes and lead to the inactivation of cisplatin.50 The stock solution was added to cell culture media to give a final cisplatin concentration of 25 μM for all studies,51 except in the case where we used 100 μM to examine the effect of elevated concentration. Typically, the concentration of cisplatin used in mammalian cell culture is in the range of 2 μM–100 μM.52 In our work we used 25 μM cisplatin, as also used in studies by Xu et al., Arany et al., and Mortensen et al.53–55A549 cells (at densities ranging from 9 × 10³ to 5 × 10⁴ mL−1) were treated with 25 μM of cisplatin for drug studies, and control A549 cells were treated with the vehicle (PBS solution used to dissolve cisplatin) only. We have used low density A549 cells in our SICM imaging studies to enable the selection of an isolated single cell. The effect of the drug was studied using both optical microscopy and SICM over various time periods, up to 3 days. After imaging using SICM, cells not treated with cisplatin had the media replaced with fresh media containing the drug, and the treated cells were imaged again using SICM at various time intervals. The choice of the control experiments and the imaging time interval were guided by the work of Brandhagen et al.56
2.3 SICM
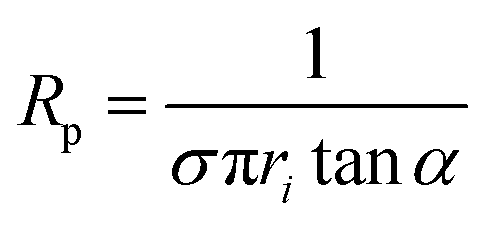
Nanopipettes were fabricated from quartz capillaries with an inner diameter (ID) of either 0.7 or 0.5 mm, and an outer diameter (OD) of 1.0 mm (Sutter instruments), using a laser-based pipette puller (P-2000, Sutter instrument Co.). Two different sets of parameters were used, which were: heat = 475, filament = 1, velocity = 30, delay = 145, pull = 175 for the capillaries with I.D. of 0.7 mm and O.D. of 1.0 mm, and heat = 465, filament = 1, velocity = 30, delay = 145, and pull = 175 for the capillaries with I.D. of 0.5 mm and O.D. of 1.0 mm. The size of the nanopipettes used was determined to be between 30 and 100 nm inner radius, by performing a cyclic voltammogram (CV) between −0.5 and 0.5 V vs. Ag/AgCl in a 1.0 M KCl solution (see ESI Fig. S1a†), in order to determine the nanopipette resistance, Rp using| V = IRp | (1) |
 | (2) |
For SICM imaging, a custom-built set up was used (Scheme 1). The nanopipettes were backfilled with 0.1 M KCl solution, and then a silver chloride coated silver wire (Ag/AgCl) was inserted into the nanopipette, which served as a quasi-reference counter electrode (QRCE). The AgCl layer was formed by immersing a clean silver wire into sodium hypochlorite solution (i.e. bleach) for 5 minutes, then washing with distilled water. A second Ag/AgCl QRCE was placed into the external bathing solution. After locating and selecting a single cell using an inverted microscope (Axio Vert.A1, ZEISS), the nanopipette was then attached to a tip-holder mounted directly to the z-piezoelectric positioner (P621.ZCD, Physik Instrumente, PI) which was controlled by the z-piezo controller (E-709.CRG, PI). The tip of the nanopipette was immersed into the DMEM media, while positioning it in the vicinity of the membrane of the selected single cell, that was on the Petri dish that was mounted on the x and y piezoelectric positioners (Nano-BioS300, Mad City Labs Inc., MCL), which were controlled by an xy-piezo controller (Nano-Drive, MCL). The topography of the cell was scanned using the hopping mode, which involves first running an ion current approach curve to locate the surface, followed by repetitive approach and retracts while scanning the sample in the x and y directions in a raster manner after each retract. The ion current used for imaging was generated by applying a voltage of 0.5 V vs. Ag/AgCl using a potentiostat (CHEM-CLAMP 5-MEG, Dagan Corporation).
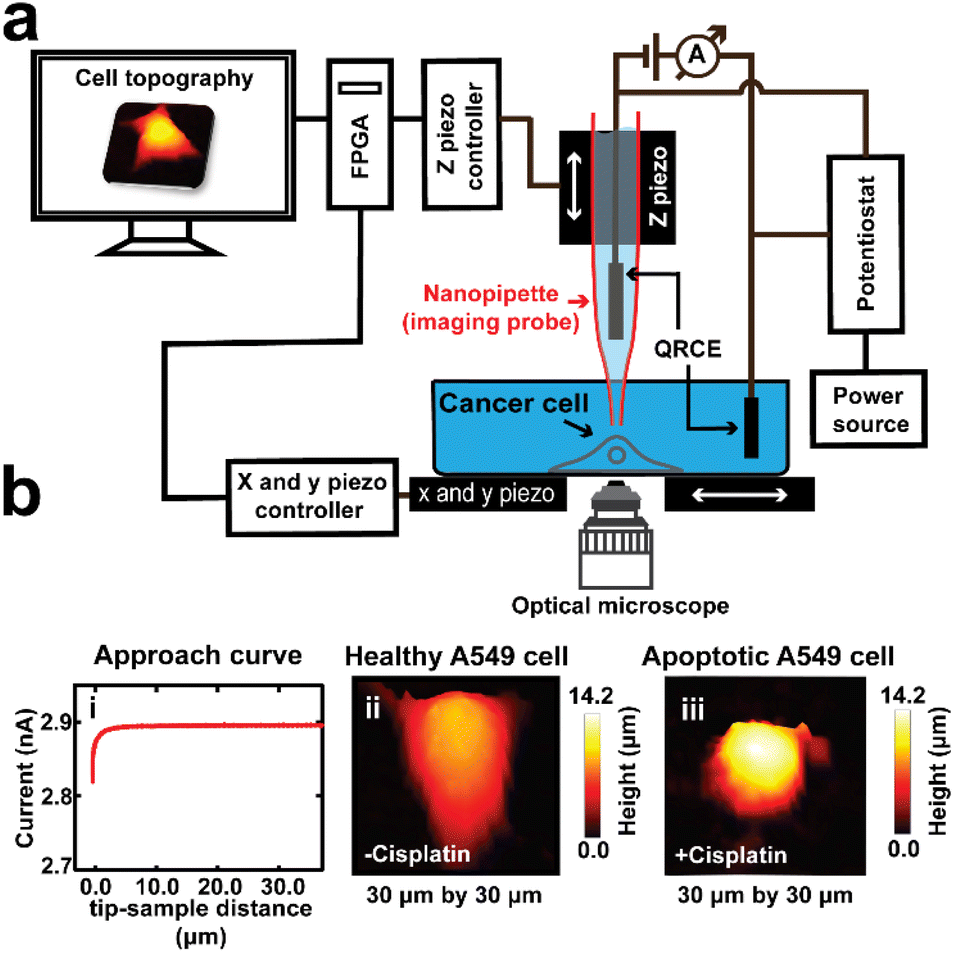 | ||
| Scheme 1 The use of SICM as a label-free tool for studying the 3D topography of A549 cells, treated and untreated with cisplatin. (a) Our custom built SICM set up comprises of: the z piezo to which the imaging probe was mounted, and controls the vertical movement of the imaging probe, which was controlled by a z piezo controller; an xy piezo that holds the Petri dish containing cultured cells and media, and controls the movement of the sample, controlled by an xy piezo controller; and an inverted optical microscope used for selection of a single cell and aid in tip positioning. A potentiostat was used to apply a bias (0.5 V) between the Ag/AgCl electrode inside the nanopipette and the second electrode in the bathing solution, which generates a current due to ion flow. This ion current was used as the feedback signal to prevent the nanopipette from touching the cell surface. (b(i)) An ion current approach curve is generated as the probe is translated towards the substrate. (b(ii)) SICM topography mapping shows a cell grown in PBS and DMEM. (b(iii)) The 3D SICM topography map of a drug-treated cell. | ||
In this study, the topography of the whole cell was mapped using lower spatial resolution parameters (1000 nm lateral resolution), while the topography of the small portion of the cell was mapped using higher spatial resolution parameters (200–500 nm lateral resolution). Therefore, this 1 μm hopping distance dictated the accuracy (resolution) of our width measurement. Scan dimensions used were between 20 × 20 μm and 40 × 40 μm for the measurement of the topography of whole cells, 10 × 10 μm for mapping the roughness of the cell membrane, and 15 × 15 μm for mapping the edge of the cell. An approach rate of 20–50 μm s−1 (that gives imaging time of 11 min) and a retract rate of 50–100 μm s−1 (that gives imaging time of 6 min) were used throughout the studies. The whole imaging process was controlled from LabVIEW software, on a computer equipped with a field programmable gate array (FPGA) card (PCIe-7852R, National Instruments, NI). All data were analyzed, and images were plotted using MATLAB (R2021a, Mathworks), and interpolation was used to improve the image quality, although non-interpolated images were used to verify apparent features.
2.4 Statistical analysis
T-tests (paired and unpaired) and one-way analysis of variance (ANOVA) were performed using Prism 6.0 (GraphPad Software) to compare the mean heights, widths, and volumes of A549 cells that were treated with cisplatin, against cells that were not treated. All statistical data are represented as the mean ± standard deviation (SD).3. Results and discussion
3.1 Cisplatin affects the morphology of A549 cells observed using optical microscopy and SICM
Apoptosis, also known as programmed cell death, is a homeostatic mechanism essential for maintaining cell growth and development. Pathological apoptosis also exists, where cells either exert excessive (as seen in autoimmune disease) or insufficient (as seen in cancer) apoptosis.59 However, apoptosis can also be triggered by anticancer drugs, which can lead to DNA damage and cell death through the p53 pathway.5,10,59 Briefly, DNA harm by a drug (cisplatin), will trigger the activation of ataxia telangiectasia mutated (ATM) protein and ataxia telangiectasia and Rad3-related (ATR) protein, and then they trigger the activation of tumor protein p53, that stimulates p53 upregulated modulator of apoptosis (PUMA). This results in the inhibition of B-cell lymphoma 2 (Bcl-2) and activation of Bcl-2-associated X (Bax) protein and Bcl-2 homologous antagonist/killer (Bak). The overall effect is the activation of caspase 7 and 3 that allow apoptosis to proceed (Fig. 1a).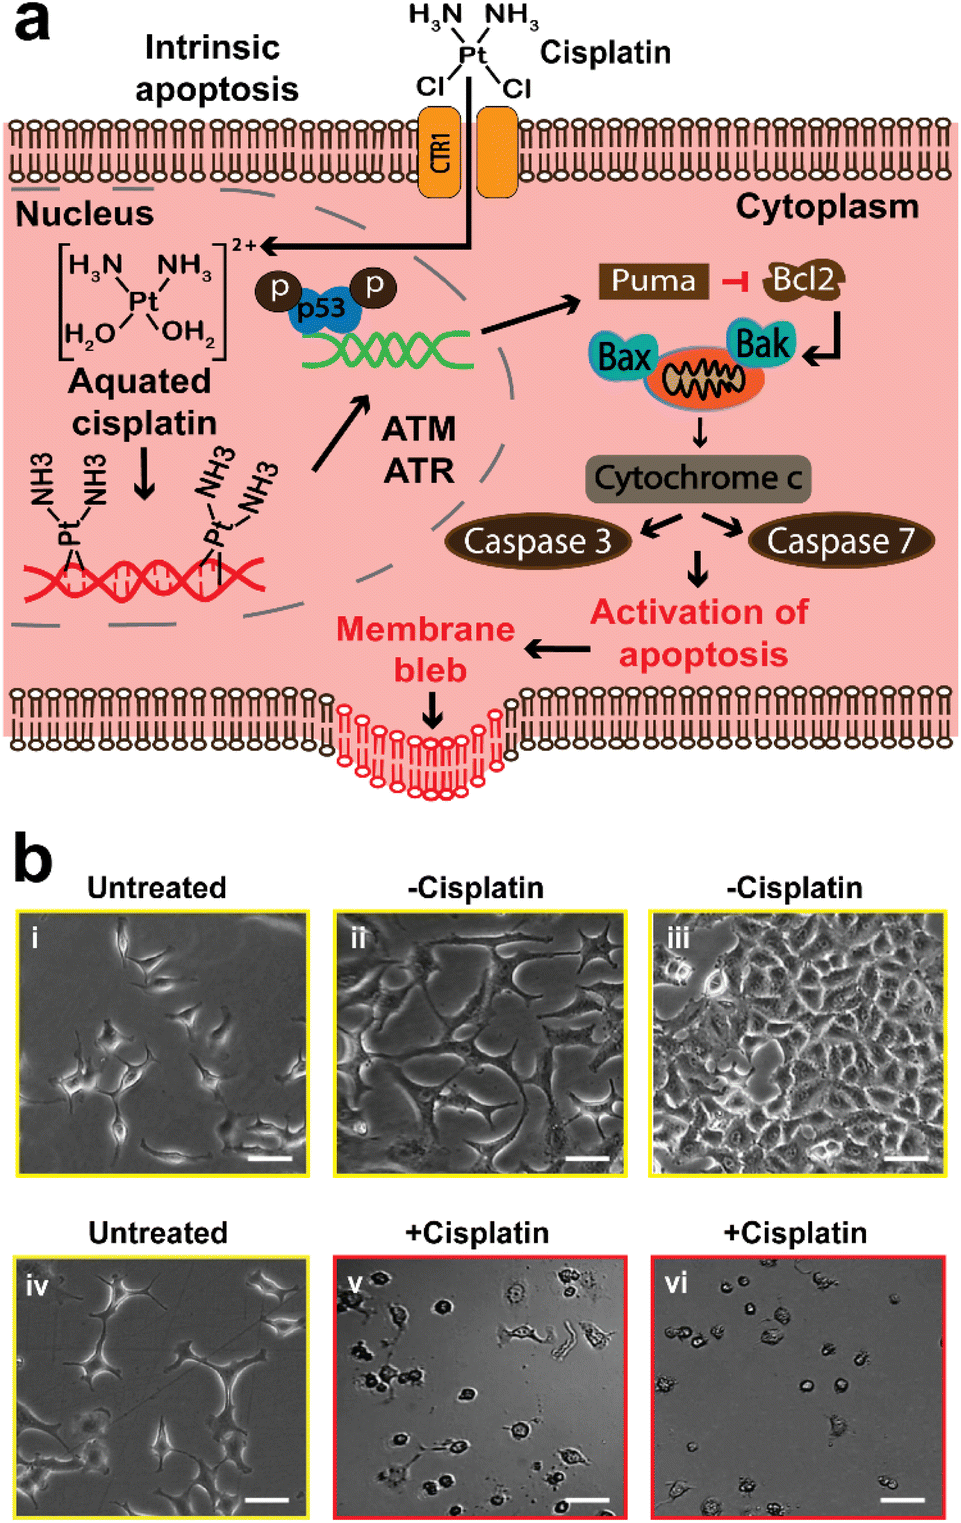 | ||
| Fig. 1 The effect of cisplatin on the morphology of A549 cells observed using optical microscopy. Untreated represents A549 cells not treated with the PBS or cisplatin. (a) Schematic showing the mechanism of cisplatin triggering intrinsic apoptosis. (b(i)) Cells allowed to adhere to the surface of a Petri dish for 24 h. (b(ii) and (iii)) The treatment of A549 cells with PBS after 24 and 48 h did not alter the native morphology of A549 cells. (b(iv)) Another group of cells allowed to adhere to a Petri dish surface for 24 h. (b(v) and (vi)) Cells treated with cisplatin, which have shown significant changes in their morphology after 24 and 48 h. All scale bars are 25 μm. | ||
Optical microscopy has been widely used in previous studies to observe the morphological changes of cells during anticancer induced apoptosis. We first used optical microscopy as a conventional method to study the effects of cisplatin on the morphology of A549 cells (Fig. 1), and to establish the appropriate conditions for the SICM experiments. Cooper et al., have reported that the epithelial cells of the alveolar (such as A549 cells) are known to have a flattened squamous appearance.44 A549 cells that were neither treated with cisplatin or PBS (denoted as untreated) did not show altered morphology (Fig. 1b(i) and (iv)), and the same observation was made in cells treated with PBS only (denoted as −cisplatin) after 24 and 48 h (Fig. 1b(ii) and (iii)). The confluency of the PBS treated cells increases, with 48 h having the highest confluency of ∼80% (Fig. 1b(iii)), whereas treatment with cisplatin (denoted as +cisplatin) after 24 and 48 h has resulted in altered morphology and decrease in confluency (Fig. 1b(v) and (vi)).
The observations made using optical microscopy serve to demonstrate the information that can be obtained using this conventional method, to understand the effect of cisplatin on the morphology of A549 cells. The studies of the mediation of apoptosis of cancer cells by cisplatin are well established,60 making it a good framework for validating the potential of SICM for application in the understanding of drugs that induce apoptosis in cancer cells.
We have used SICM to measure the topography of a number of different individual A549 cells in DMEM, treated with PBS solution only (−cisplatin) and another group of A549 cells treated with PBS containing cisplatin (+cisplatin) after 24 h (Fig. 2). A549 cells that were not treated with cisplatin maintained their normal squamous appearance after 24 h growth (Fig. 2a), while 24 h after treatment with cisplatin have resulted in morphology alteration (Fig. 2b).
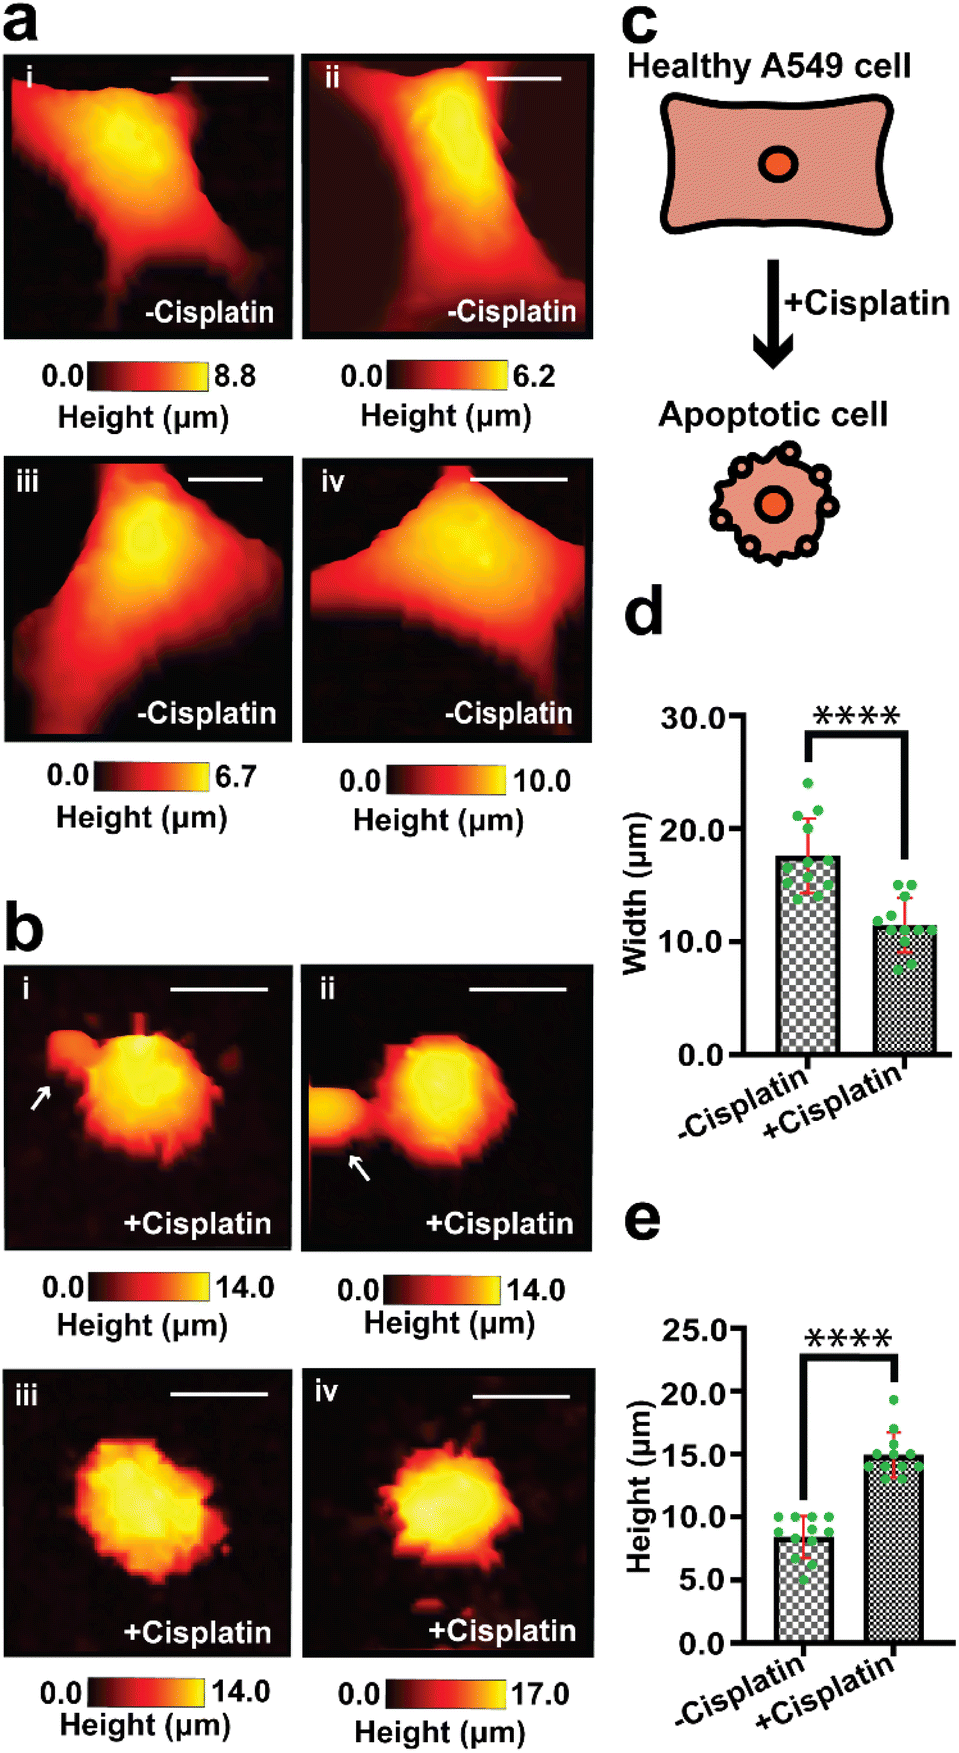 | ||
| Fig. 2 Mapping of the topography of different single A549 cells treated with PBS vehicle only (−cisplatin) and with cisplatin (+cisplatin) after 24 h. (a(i)–(iv)) Treatment of A549 cells with vehicle did not show any changes in morphology. (b(i)–(iv)) Cells treated with cisplatin have shown decrease in width, and presence of blebs which are marked with white arrows. (c) A schematic of the morphological change of a cell, that is caused by exposure to cisplatin. (d) The width and (e) height of cells treated with the vehicle and cisplatin are significantly different, using an unpaired t test (****P < 0.0001, n = 12). Scale bar: 10 μm. | ||
Fig. 2c shows schematically how cisplatin causes alteration of shape in single A549 cells, and our SICM results have shown a significant difference (P < 0.001) in width between cells that were not treated with cisplatin and the treated ones (Fig. 2d).
Some of these morphological changes are associated with blebbing of the membrane in some single cells (Fig. 2b(i) and (ii), marked with white arrows) and rounded/oval appearance (Fig. 2), as seen in optical microscopy. This is consistent with previously reported studies that apoptotic cells appear rounded or irregular after treatment with cisplatin.61,62 Povea-Cabello et al., have reported that the rounded and irregular appearance is due to the kinetics of the cytoskeleton reorganization when apoptosis is initiated.63
The width measurement in our study is defined as the shortest distance across the cell body. Specifically, we identified the approximate region across the cell to record the width, then found the pixel at each side of the cell that deviated by more than 100 nm above the Petri dish. The noise level of the measurement based on imaging a flat Petri dish surface is 100 nm, as shown in Fig. S7.† This definition allowed us to capture a consistent and representative portion of the cell. We acknowledge that other methods of defining cell width include using the full width at half maximum (FWHM) across a line over the cell, as reported by Cao et al., Steifert et al., and Bednarska et al.,27,64–66 while using the longest distance of a cell for length measurement has been described by Yoda et al. (2022).28 We have chosen not to use FWHM method to avoid potential loss of information in the cell body, especially given our interest in comparing specific parts of the cell body before and after apoptosis. The width measurement adopted in our studies has been demonstrated by Osiro et al. (2012).67 Our definition of width provides a normalized measure of width, taking into account variations in cell size and shape.
There is also a significant difference (P < 0.0001) in height between cells that were treated with PBS and those treated with cisplatin (Fig. 2e), this effect cannot be determined using optical microscopy that gives 2D information about cells. The effect of the drug on the height of A549 cells has not yet been reported and is open for future investigation. We propose that part of the contribution to the increase in height of the cells might be due to the formation of bulges on the membrane, which is known for cancer cells during apoptosis.68 Additional topographical maps are shown in the ESI,† for different single cells treated with PBS (Fig. S2a†) or cisplatin (Fig. S2b†) after 24 h.
As an additional control experiment to show that the vehicle had no effect on the cell morphology, we scanned the topography of untreated and PBS treated single A549 cells (Fig. S2c†). To further confirm the effect of the drug on the width and height of single A549 cells, and another different group of untreated and cisplatin treated A549 cells were also imaged (Fig. S2d†).
3.2 Longitudinal mapping of A549 cells treated with cisplatin to monitor dynamic morphological changes
An understanding of the response of the same A549 cells to cisplatin over time is necessary for studying dynamic morphological changes. SICM allows for continuous topography measurement over several days, and has been reported for the studies of stem cells during osteogenic differentiation,69 where individual images can be recorded relatively quickly, in the course of a few minutes.70 We first performed a 24 h control measurement to confirm that the SICM imaging environment does not alter the native morphology of a single cancer cell over time, where we observed no changes in morphology (Fig. S3†). Tracking the topography of the same live single cancer cells (untreated with anticancer drugs) is challenging due to cell division, migration/motility, and as well as change in cell shape as part of physiological processes of live cells, resulting in an increase in cell confluency over time.71,72After confirming that SICM is non-invasive to live cells, we then used the technique to follow the topography of the same single A549 cells (before and after cisplatin apoptosis) and scan their morphology over 3 days at 12 h intervals (Fig. 3). The data presented in Fig. 3 is a single day measurement because a significant change in morphology was observed after 24 h treatment with cisplatin, that was attributed to apoptosis. The continuation of some of the 3 days measurement is presented in the ESI (Fig. S4†). Prior to treatment with cisplatin, single A549 cells exhibited their native morphology (Fig. 3a(i), b(i) and c(i)), and 12 h after treatment with cisplatin one of the single cells studied did not show significant changes in its morphology (Fig. 3a(ii)), while the other single cells studied have shown an increase in height and decrease in width (Fig. 3b(ii) and c(ii)). This discrepancy might be explained by the heterogeneity of single cells in responding to drugs. Reported studies have shown that tumor cells are heterogeneous, and much variation occurs at the single cell level, which may affect the therapeutic response.73,74 After 24 h cisplatin treatment, all of the single cells exhibited a reduction in width and an increase in height (Fig. 3a(iii), b(iii) and c(iii)), followed by a decrease in height after 72 h. The decrease in height might be associated with late stage apoptosis, characterized by extensive remodeling of the membrane.75Fig. 3d and e show the comparison (using one way ANOVA) of width and height from the same A549 cells before and 24 h after treatment with cisplatin.
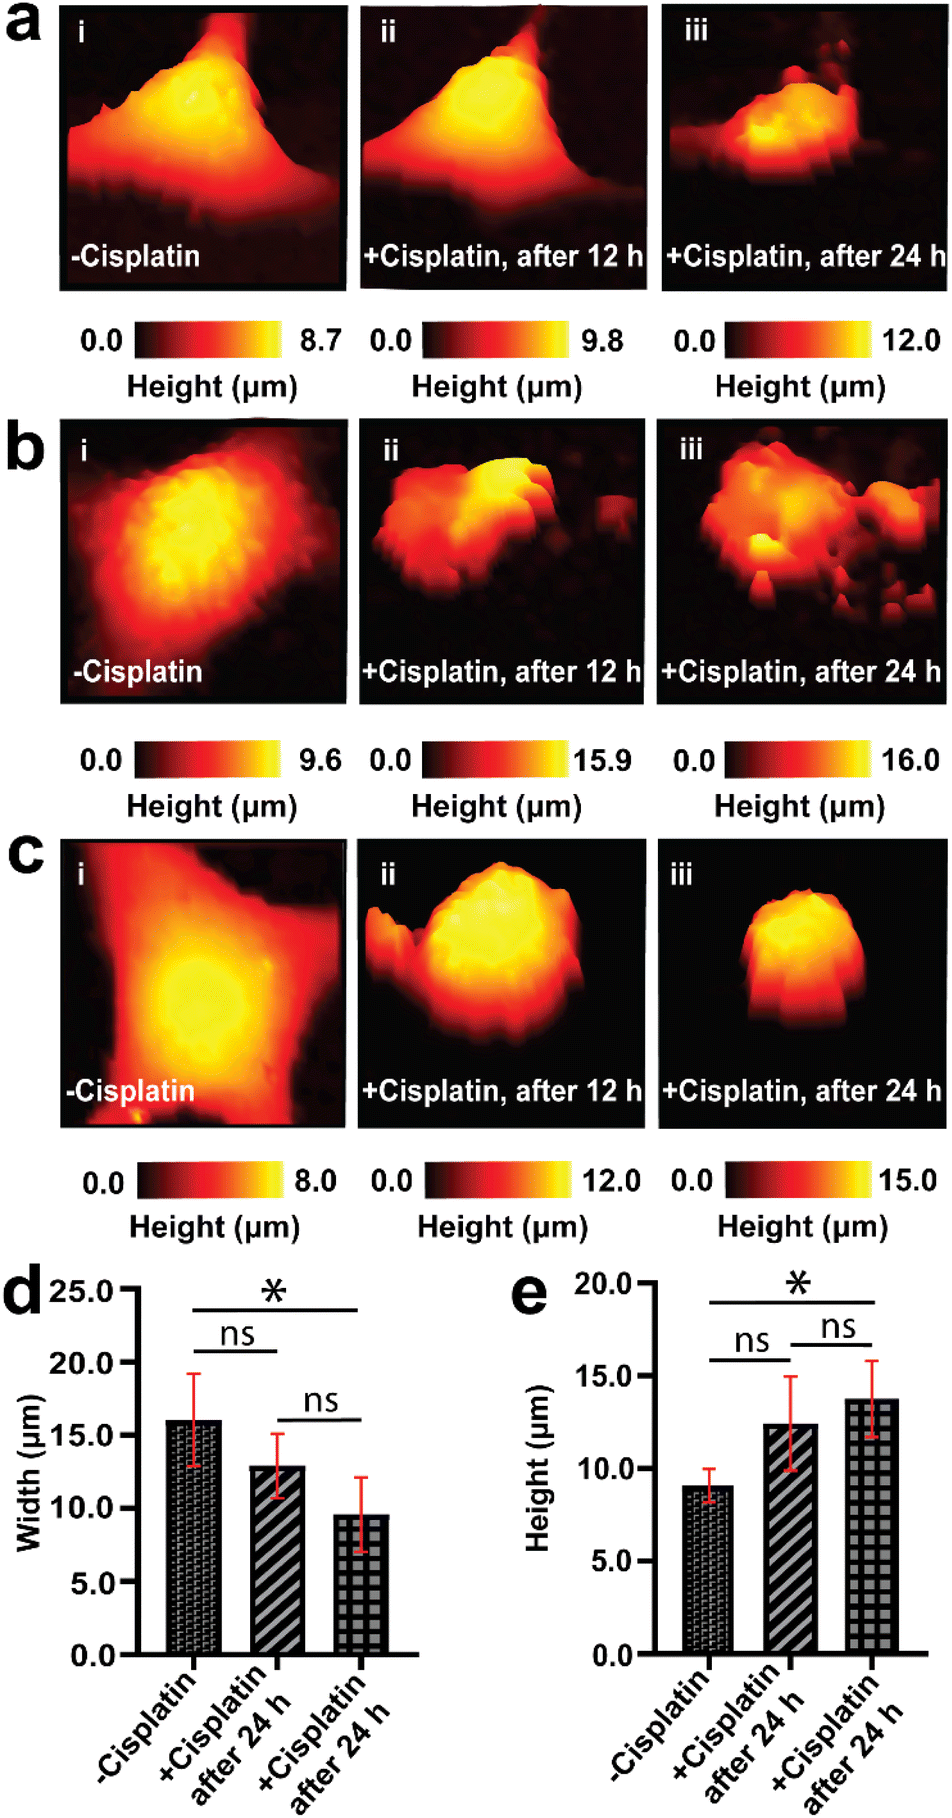 | ||
| Fig. 3 Dynamic changes in the morphology of A549 cells before and during apoptosis over 24 hours. (a–c) The dynamic changes in the morphology of some selected single A549 cells over 24 h, prior to the addition of cisplatin (i, −cisplatin), 12 h after the addition of cisplatin (ii, +cisplatin), and 24 h after cisplatin was added (iii, +cisplatin). There was a significant difference in the width (d) and height (e) of A549 cells after 24 h treatment with cisplatin. All images were captured using 30 × 30 μm in the x and y dimensions. *P < 0.05, n = 4, and ns = not significant. | ||
The pronounced alteration in the morphology of A549 cells after 24 h signifies the effect of cisplatin on inducing apoptosis. We have achieved this feat of continuous measurement in the same single cells because after the initial SICM imaging of a single A549 cell, we were able to return back to the selected single cell by marking the Petri dish with identifiable features used to locate the exact same cell. A typical single cell was imaged for a duration of 11 min, and returned to the incubator between scans. Mapping the same single cell over multiple days is challenging, due to migration of cells,76,77 and cells require being returned to the incubator between experiments, to maintain appropriate temperature and CO2 levels. Treatment of cells with cisplatin does not only result in the alteration of morphology, but also results in the inhibition of migration of single cells. Fig. 3, S3 and S4† all show that we can successfully select a single cell and scan it using SICM over many days when the cells remained in their exact position. In a situation where cells became completely detached from the Petri dish, further imaging by SICM was not possible. Therefore, SICM mapping at 12 h intervals for 3 days captured the topography of the same single A549 cells prior to treatment with cisplatin, and after treatment with cisplatin. This was used to elucidate the temporal dynamics in the morphological changes of single A549 cells, and we revealed differing responses of the cells to cisplatin associated with cell heterogeneity.
We have also mapped the topography the same single A549 cells using higher concentration of cisplatin (100 μM), where we observed decreased in the height of the same A549 cells after 8 h treatment with the drug, resulting to decrease in volume (Fig. S5†). This might be associated with accelerated apoptosis in A549 cells. The higher the concentration of cisplatin, the higher the number of non-viable cells.55 Studying the effect of different concentration of anticancer drug on the apoptosis of single cancer cells is a new area of research.
Our findings of mapping the same A549 cells treated with cisplatin have revealed that drug treated cells have displayed the presence of irregularities and fragmentation on their cell membranes (Fig. 3a(iii), b(ii), (iii) and c(ii)). These irregularities might be blebs that form apoptotic bodies. In these lower resolution whole cell images, the topography maps suggest we captured the process of bleb formation. Membrane blebbing was observed after 12 h exposure to cisplatin, which was associated with an increase in the height of cell and protrusion formation (Fig. 3b(ii)), followed by the initiation of budding or fragmentation (formation of apoptotic bodies) after 24 h exposure to cisplatin (Fig. 3b(iii)). Wickman et al. reported that during the progression of apoptosis, the cell body forms blebs, which then break from the membrane and form apoptotic bodies.78 The formation of blebs on the membrane is mediated by the delamination of the cortical cytoskeleton from the membrane, resulting in the formation of bulges, which are subsequently expanded by hydrostatic pressure as a result of cellular contraction, facilitated by actomyosin. The blebbing of the membrane is regarded as one of the hallmarks of apoptosis triggered by cisplatin.79,80 This apparent observation of blebbing motivated us to perform a higher resolution mapping over the cell membrane (vide infra).
3.3 Higher resolution topography mapping of the membrane of A549 cells
Membrane structures such as filopodia and lamellipodia are crucial in adhesion, migration, cell-to-cell contact, and signaling of cells.81 We have used SICM to scan the edges of single cells where filopodia and lamellipodia projections occur. Our data have shown that A549 cells not treated with cisplatin have their filopodia and lamellipodia projecting out from the cell body, (Fig. 4a and S6†), compared to 24 h drug treated A549 cells which show the loss of filopodia and lamellipodia, and in which the edge of the cell is characterized by spherical appearance (Fig. 4b). Fig. 4c shows the line scans over cells without (4c(i)) and with membrane blebbing (4c(ii)). Also, there is a significant difference (P < 0.0001) between the height of PBS and cisplatin treated cells from mapping of the edge of single A549 cells (Fig. 4d). Cisplatin-induced alteration of filopodia and lamellipodia further suggest the negative effect of the drug on the adhesion and motility of A549 cells. | ||
| Fig. 4 The SICM topography of the edge of the membrane regions of single A549 cells. (a(i) and (ii)) −Cisplatin cells have their processes (which form lamellipodia) displayed on their membrane, (b(i) and (ii)) while drug-treated cells have shown loss of lamellipodia as well as displaying an increase in height after 24 h treatment with cisplatin. (c) The line scan of the SICM image of the side of the cell before and after cisplatin treatment, and the corresponding SICM images are in Fig. S6.† (c(i)) Shows the absence of membrane bulges before treatment and (c(ii)) the appearance of a membrane bulge after drug treatment. The height of the bulge formed on the membrane is greater than the membrane roughness of the untreated cell. (d) The heights of healthy single A549 cells are significantly different from the heights of cells treated with cisplatin (****P < 0.0001, n = 5). (e) The mean ± SD of the height and width of membrane bulges after treatment with cisplatin (n = 5). Scale bars in the optical images are 25 μm. | ||
Fig. 4e shows the mean ± SD of the heights and widths (1.8 ± 0.7 μm and 2.6 ± 0.5 μm) of blebs on the membrane of A549 cells. The heights of the bulges were determined by taking the difference of the cell height adjacent to the bulge and the cell height on the bulge, while the width was determined by measuring the shortest distance across the bulge (in a similar definition to the whole cell width determination).
We have also used SICM for the high-resolution mapping of the topography of a small membrane region within the cell body. Fig. 5 shows the high-resolution mapping of the membrane of single A549 cells over 12 h aiming to unravel the complexity of the changes occurring in the membrane features. Prior to treatment with cisplatin, the membrane appeared smooth (Fig. 5a(i), b(i), c(i) and d(i)). After treatment with cisplatin for 12 h (Fig. 5a(ii), b(ii), c(ii) and d(ii)), there was a significant change in morphology, and the membrane also appeared to form a bleb as well as showing an increase in height, as vividly captured by SICM. The sizes of blebs captured in our studies match well with a study by Kakarla et al., that showed bulges that form apoptotic bodies have diameters in the range of 0.05 to 5 μm.82 However, our hopping distance of 200 nm limits our ability to measure bulges that are less than 200 nm in diameter. Fig. S7† shows the roughness of the Petri dish, illustrating the low noise level of our instrument, and validating the surface roughness observed on the cell membranes.
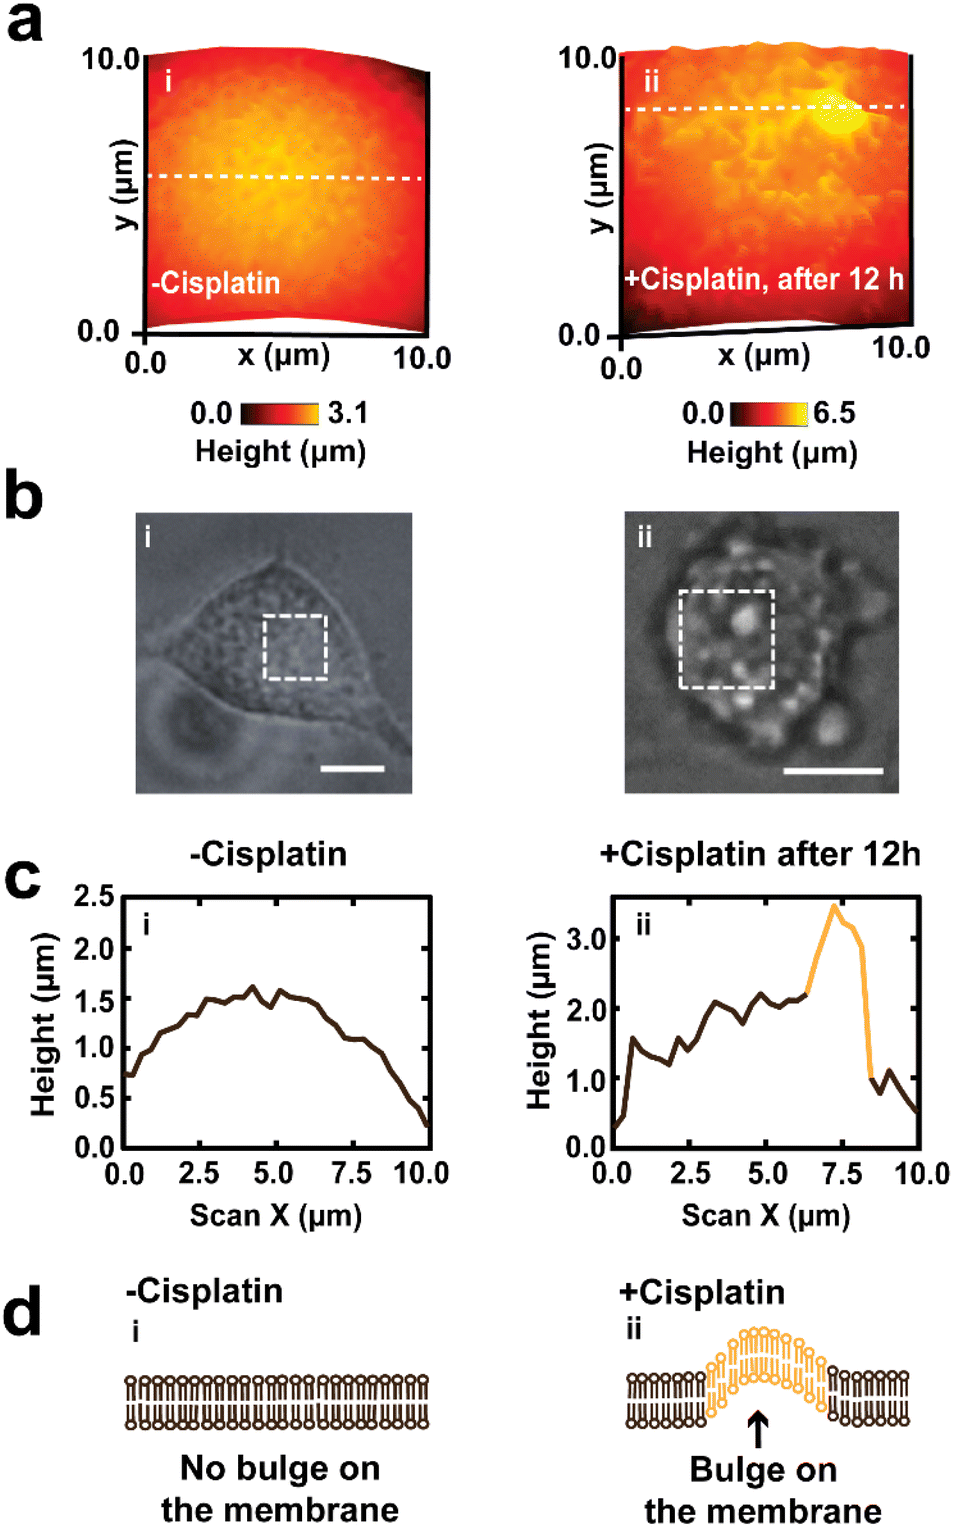 | ||
| Fig. 5 Mapping of the roughness of the cell membrane of a single A549 cell, before and 12 h after treatment with cisplatin. High resolution SICM image of the membrane of live A549 cells prior to treatment with anticancer drug (a(i)), then showing the roughness of the membrane increased following treatment with cisplatin after 12 h (a(ii)). (b(i) and (ii)) Optical microscope images showing the corresponding region of the membrane scan before and after 12 h treatment with cisplatin, where all scale bars are 10 μm. (c) Line scans of the cell membranes, that correspond to the dashed white lines in part a, for a cell not treated with cisplatin (i), where a membrane forms a bulge after 12 h (ii). (d) Schematic showing the effect of cisplatin on the membrane of A549 cell. | ||
The nanoscale resolution of SICM, as well as its non-invasive nature, enabled us to study the organization of the membranes of live cells and compare them with drug treated cells undergoing apoptosis mediated by cisplatin, and we determined the heights and widths of the bulges formed on the membrane (Fig. 4e). While our findings have revealed the potential of using SICM for 3D topographical mapping of single live cells before and after triggering apoptosis with anticancer drug, various avenues for future research are still open. For example, the use of SICM to explore the correlation between membrane roughness and different concentrations of anticancer drugs could be used in the discovery process of new anticancer drugs.
3.4 Estimation of the volume changes of A549 cells due to cisplatin
Cell volume is a crucial parameter in studying biological processes such as cell death.83 According to Korchev et al., “the investigation of the pathological and physiological processes associated with volume regulation requires the use of an appropriate technique that allows quantitative, high resolution characterization of cell volume while retaining the cell functionality.”84 To the best of our knowledge, the effect of cisplatin on the volume of single A549 cells has not yet been reported. However, studies by Xie et al. have revealed the effect of cisplatin on the volume of tumor xenografts generated from the treatment of mice with a suspension of A549 cells, where the xenograft volume decreased significantly over 20 days compared to mice treated with saline only.85 We have used SICM for volume calculations of the A549 cells (Fig. 6a), where to calculate the volume, the height of the Petri dish substrate (z(x, y))substrate is defined as zero , while the height of pixels on the cell membrane (z(x, y)cell) are greater than zero. Hence, the volume of the cell can be calculated using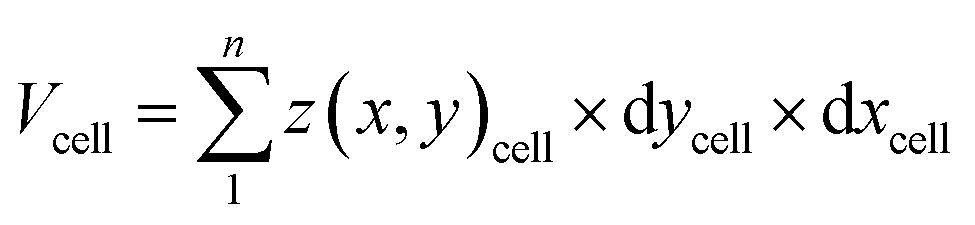 | (3) |
 | ||
| Fig. 6 The measurement of the volume of A549 cells using SICM. (a) The concept of using SICM for the calculation of volume of cancer cells. The red dashed line represents the distance of closest approach of the nanopipette, which is used for the height at each pixel (z(x, y)). The pixels over the Petri dish (substrate) are defined as zero, so non-zero heights are recorded over the cell membrane. (b) Dynamic changes in the volume of the same single A549 cells over 3 days (n = 4 from −cisplatin to 24 h after treatment with cisplatin, and n = 3 from after 36 h treatment with cisplatin to after 72 h treatment with cisplatin). (c) Changes in the volume of A549 cells after 24 h treatment with PBS/cisplatin. (ns = not significant, n = 10). | ||
Our data have shown time dependent alteration of the volume of the same A549 cells mapped over 3 days. Using one-way ANOVA, we compared the mean volume of −cisplatin cells with the mean volume of +cisplatin cells over 3 days at 12 h intervals (Fig. 6b). The volume before treatment is not significantly different (P > 0.05) from the volume after 12 treatment with cisplatin, and the change in volume becomes greater over time. After 72 h treatment with cisplatin it is significantly different (P < 0.0001).
This decrease in volume is due to the shrinkage of cells associated with the disintegration of the cell membrane from the cell body into smaller fragments after treatment with cisplatin, as well as a decrease in the height of the cell (Fig. S4 ESI†). During the membrane disintegration, the fragments of the membrane detach from the cell body and move into the cell culture media (Fig. S4†). The volume of A549 cells fluctuates during apoptosis, due to the formation of bulges on the membrane (which increases the cell height), disintegration of the bulges from the membrane (which decreases the cell height) to form an apoptotic body, and further formation of new membrane bulges. According to Model, cells undergoing apoptosis can lose their volume either through apoptotic body formation or loss of water.86 The Na+/K+-ATPase participate in the decrease in volume during apoptosis, characterized by increased efflux of K+, Cl− and organic anions, resulting in the loss of water by cells.87
In addition to tracking the same single cells over 72 hours, we also revisited the two groups of A549 cells presented in Fig. 2, to compare the volume of cells treated with PBS to those treated with cisplatin. For these two different groups of cells, the volume was recorded by SICM after 24 h (Fig. 6c), and interestingly, even after a decrease in width of the drug treated cells (Fig. 2), there was no significant change in the volume after 24 h. Given the heterogeneity of single cells, it is important to track the same single cells over time (as in Fig. 6b) rather than groups of different cells (as in Fig. 6c). Our findings are consistent with the studies of Pan et al., where they revealed the impact of cisplatin on tumor volume, in which tumors treated with cisplatin have shown significant decrease in volume over 5 days.88
Some studies have reported that cell shrinkage is associated with loss of water by the cell, tightly packed organelles and dense cytoplasm,89 and decrease in volume known as apoptotic volume decrease (AVD).90 However, other studies conclude that when there are changes in the morphology of single cells, especially a decrease in the overall size, then there is cell shrinkage. For example, Van der Mereen et al.,79 Pal Singh et al.,91 and Elmore89 have reported that cell shrinkage in cancer cells treated with anticancer drugs is associated with changes in the morphology of cells, characterize by decrease in the length and width of a cell, without showing volume change. Our findings have shown that a cell can display decrease in size (decrease in width and length) after apoptosis, but the height might increase as well, which might not result in a significant change in volume. A higher significant change in volume is seen when the height and the size of the cell decrease. We recommend that cell height should be monitored during apoptosis to distinguish between different stages of apoptosis that leads to effective volume decrease. However, we have found that despite the decrease in overall size of cells in our studies as shown in Fig. 2 and 3, the height of the cells increases, which doesn't necessarily mean that volume decreases. We have revealed that a decrease in the overall width of the cell as well as decrease in height leads to overall shrinkage of cell and a volume decrease.
This highlights the benefit of using a non-invasive and label-free technique for the 3D studies of cell volume during apoptosis, as the height of a cell can be obtained. Scanning laser confocal microscopy (SLCM) is considered as one of the standard ways of measuring cell volume.92 However, photodynamic damage poses a serious challenge in this technique for cell volume measurement,92 especially for a long duration study of the same cell. The use of SICM for volume measurement will offer several advantages such as ensuring the physiological state of the cell is minimally disturbed. We have shown the use of a label-free technique for the acquisition of data for use in the calculation of volume of single A549 cells induced with cisplatin, which contributes to a better understanding of the mechanism of cisplatin on A549 cells.
Finally, we have demonstrated the use of SICM for the mapping of the topography of drug treated cells, to gain more insight into the potential of SICM to study apoptosis. Future studies on the effect of anticancer drugs on the dynamic changes in the morphology of filopodia and lamellipodia using SICM and other complementary techniques is recommended. The label free and noninvasive nature of SICM offers the advantage of longitudinal tracking of the morphology of single cells in physiological conditions, without damaging them as well as capturing the real height of live cells before and after treatment with the drug. SICM could be useful in the understanding of the heterogeneity of cells in response to anticancer drugs, with its ability to map individual single cells from a population in a few minutes. The use of SICM for mapping mechanical properties has also been reported,39 and future studies to examine the effect of cisplatin on the stiffness of the cell membrane of A549 cells are suggested. Nanopipettes for sensing have been reported to be used for intracellular measurements.93,94 The effect of the drug induced stiffness of the membrane on the insertion of a nanopipette for intracellular measurement can also be investigated.
4. Conclusions
We have studied the 3D morphological changes in the topography of cisplatin treated single A549 cells using SICM, to explore the potential of the technique in drug efficacy studies in cancer cells. Studies of the morphological changes induced by cisplatin have revealed cell shrinkage, formation of membrane blebs, and membrane disintegration, which are all regarded as hallmarks of apoptosis. We have also found that the height of cisplatin treated A549 cells increased during apoptosis, followed by a decrease after 48 h of cisplatin treatment, which has not previously been reported. Over three days, dynamic studies in the same single cells were achieved due to the label-free and non-invasive nature of SICM, where 3D images are captured in the physiological environment of the cells. High resolution (200 nm lateral resolution) mapping of a small membrane region within the cell body of A549 cells has revealed the presence of membrane bulges, which are known to form apoptotic bodies. We have also used SICM for the first time to study the dynamic and static changes in the volume of single A549 cells before and after treatment with cisplatin, where we found that decrease in size of cells together with an increase in height does not increase the volume of A549 cells, while size decrease associated with decrease in height has drastically decreased the volume of A549 cells. Using SICM, the dynamic changes in the morphology of cells before and after treatment with drug can be followed with minimal perturbation to the physiological environment of the cell.Conflicts of interest
The authors have declared no conflict of interest.Acknowledgements
RAL thanks the Department of Chemistry and Biochemistry at the Florida State University for start-up funds. The authors thank Dr Gwimoon Seo, the director of the protein expression facility at the institute of molecular biophysics (IMB) at FSU, for support with mammalian cell culture. The authors would also like to thank Prof. Qing-Xiang Amy Sang for gifting a frozen pellet of A549 cells. The authors also acknowledge the Warwick electrochemistry and interfaces group for use of the LabVIEW based software interface, used to control our home-built SICM.References
- T. Bezabeh, M. R. A. Mowat, L. Jarolim, A. H. Greenberg and I. C. P. Smith, Cell Death Differ., 2001, 8, 219–224 CrossRef CAS PubMed.
- L. Bosserman, K. Rogers, C. Willis, D. Davidson, P. Whitworth, M. Karimi, G. Upadhyaya, J. Rutledge, A. Hallquist, M. Perree and C. A. Presant, PLoS One, 2015, 10, 1–14 CrossRef.
- O. Jonas, J. W. Kang, S. P. Singh, A. Lammers, F. T. Nguyen, R. R. Dasari, P. T. C. So, R. Langer and M. J. Cima, Analyst, 2018, 143, 4836–4839 RSC.
- G. Banfalvi, Apoptosis, 2017, 22, 306–323 CrossRef CAS PubMed.
- M. Ölander, N. Handin and P. Artursson, Anal. Chem., 2019, 91, 5548–5552 CrossRef.
- A. Mobiny, H. Lu, H. V. Nguyen, B. Roysam and N. Varadarajan, IEEE Trans. Med. Imaging, 2020, 39, 1–10 Search PubMed.
- K. Okamoto, M. Mizuno, N. Nakahara, A. Natsume, J. Yoshida, T. Mori, S. Hori and H. Kobayashi, Apoptosis, 2002, 7, 77–86 CrossRef CAS PubMed.
- F. Heraud, A. Heraud and M. F. Harmand, Ann. Rheum. Dis., 2000, 59, 959–965 CrossRef CAS PubMed.
- R. M. Zucker, E. S. Hunter and J. M. Rogers, Methods, 1999, 18, 473–480 CrossRef CAS PubMed.
- M. G. Sun, J. Williams, C. Munoz-Pinedo, G. A. Perkins, J. M. Brown, M. H. Ellisman, D. R. Green and T. G. Frey, Nat. Cell Biol., 2007, 9, 1057–1065 CrossRef CAS.
- D. J. Stephens and V. J. Allan, Science, 2003, 300, 82–86 CrossRef CAS PubMed.
- M. Küppers, D. Albrecht, A. D. Kashkanova, J. Lühr and V. Sandoghdar, Nat. Commun., 2023, 14, 1–12 Search PubMed.
- J. C. Wyant, in, Holography: A Tribute to Yuri Denisyuk and Emmett Leith, SPIE, 2002, vol. 4737, pp. 98–107 Search PubMed.
- J. Schmit, A. G. Olszak, in, interferometry XI: Techniques and Analysis, SPIE, 2002, vol. 4777, pp. 118–127 Search PubMed.
- C. Larimer, M. R. Brann, J. D. Powell, M. J. Marshall, J. D. Suter and R. S. Addleman, Sci. Rep., 2019, 9, 1–14 CrossRef CAS.
- K. Thorn, Mol. Biol. Cell, 2016, 27, 219–222 CrossRef CAS PubMed.
- J. Icha, M. Weber, J. C. Waters and C. Norden, BioEssays, 2017, 39, 1–15 CrossRef.
- A. L. Robson, P. C. Dastoor, J. Flynn, W. Palmer, A. Martin, D. W. Smith, A. Woldu and S. Hua, Front. Pharmacol, 2018, 9, 1–8 CrossRef.
- C. M. St Croix, S. H. Shand and S. C. Watkins, Biotechniques, 2005, 39, S2–S5 CrossRef PubMed.
- N. De Jonge and D. B. Peckys, ACS Nano, 2016, 10, 9061–9063 CrossRef CAS PubMed.
- L. Graham and J. M. Orenstein, Nat. Protoc., 2007, 2, 2439–2450 CrossRef CAS PubMed.
- S. Thiberge, A. Nechushtan, D. Sprinzak, O. Gileadi, V. Behar, O. Zik, Y. Chowers, S. Michaeli, J. Schlessinger and E. Moses, Proc. Natl. Acad. Sci. U. S. A., 2004, 101, 3346–3351 CrossRef CAS PubMed.
- N. De Jonge and F. M. Ross, Nat. Nanotechnol., 2011, 6, 695–704 CrossRef CAS PubMed.
- A. Kerstens, N. Corthout, B. Pavie, Z. Huang, F. Vernaillen, G. Vande Velde and S. Munck, BMC Biol., 2019, 17, 1–17 CrossRef PubMed.
- L. Hu, S. Morganti, U. Nguyen, O. R. Benavides and A. J. Walsh, Curr. Opin. Biomed. Eng., 2023, 25, 1–16 Search PubMed.
- M. M. Martinez, R. D. Reif and D. Pappas, Anal. Methods, 2010, 2, 996–1004 RSC.
- J. Seifert, J. Rheinlaender, P. Novak, Y. E. Korchev and T. E. Schäffer, Langmuir, 2015, 31, 6807–6813 CrossRef CAS.
- R. B. Hargreaves, S. Duwé, A. M. Rozario, A. M. Funston, R. F. Tabor, P. Dedecker, D. R. Whelan and T. D. M. Bell, ACS Bio Med Chem Au, 2022, 3, 261–269 CrossRef.
- J. Rheinlaender, N. A. Geisse, R. Proksch and T. E. Schäffer, Langmuir, 2011, 27, 697–704 CrossRef CAS PubMed.
- S. M. Leitao, B. Drake, K. Pinjusic, X. Pierrat, V. Navikas, A. P. Nievergelt, C. Brillard, D. Djekic, A. Radenovic, A. Persat, D. B. Constam, J. Anders and G. E. Fantner, ACS Nano, 2021, 15, 17613–17622 CrossRef CAS PubMed.
- S. M. Leitao, B. Drake, K. Pinjusic, X. Pierrat, V. Navikas, A. P. Nievergelt, C. Brillard, D. Djekic, A. Radenovic, A. Persat, D. B. Constam, J. Anders and G. E. Fantner, ACS Nano, 2021, 15, 17613–17622 CrossRef CAS PubMed.
- Y. Zhang, Y. Takahashi, S. P. Hong, F. Liu, J. Bednarska, P. S. Goff, P. Novak, A. Shevchuk, S. Gopal, I. Barozzi, L. Magnani, H. Sakai, Y. Suguru, T. Fujii, A. Erofeev, P. Gorelkin, A. Majouga, D. J. Weiss, C. Edwards, A. P. Ivanov, D. Klenerman, E. V. Sviderskaya, J. B. Edel and Y. Korchev, Nat. Commun., 2019, 10, 5610 CrossRef CAS PubMed.
- N. Schierbaum, M. Hack, O. Betz and T. E. Schäffer, Anal. Chem., 2018, 90, 5048–5054 CrossRef CAS.
- Y. Zhou, M. Saito, T. Miyamoto, P. Novak, A. I. Shevchuk, Y. E. Korchev, T. Fukuma and Y. Takahashi, Anal. Chem., 2018, 90, 2891–2895 CrossRef CAS PubMed.
- T. Ali, J. Bednarska, S. Vassilopoulos, M. Tran, I. A. Diakonov, A. Ziyadeh-Isleem, P. Guicheney, J. Gorelik, Y. E. Korchev, M. M. Reilly, M. Bitoun and A. Shevchuk, FASEB J., 2019, 33, 8504–8518 CrossRef CAS PubMed.
- A. I. Shevchuk, P. Hobson, M. J. Lab, D. Klenerman, N. Krauzewicz and Y. E. Korchev, Biophys. J., 2008, 94, 4089–4094 CrossRef CAS PubMed.
- P. Novak, A. Shevchuk, P. Ruenraroengsak, M. Miragoli, A. J. Thorley, D. Klenerman, M. J. Lab, T. D. Tetley, J. Gorelik and Y. E. Korchev, Nano Lett., 2014, 14, 1202–1207 CrossRef CAS PubMed.
- J. Seifert, J. Rheinlaender, F. Lang, M. Gawaz and T. E. Schäffer, Sci. Rep., 2017, 7, 1–11 CrossRef CAS PubMed.
- V. S. Kolmogorov, A. S. Erofeev, E. Woodcock, Y. M. Efremov, A. P. Iakovlev, N. A. Savin, A. V. Alova, S. V. Lavrushkina, I. I. Kireev, A. O. Prelovskaya, E. V. Sviderskaya, D. Scaini, N. L. Klyachko, P. S. Timashev, Y. Takahashi, S. V. Salikhov, Y. N. Parkhomenko, A. G. Majouga, C. R. W. Edwards, P. Novak, Y. E. Korchev and P. V. Gorelkin, Nanoscale, 2021, 13, 6558–6568 RSC.
- J. Bednarska, P. Novak, Y. Korchev, P. Rorsman, A. I. Tarasov and A. Shevchuk, J. Microsc., 2021, 282, 21–29 CrossRef CAS PubMed.
- A. I. Shevchuk, J. Gorelik, S. E. Harding, M. J. Lab, D. Klenerman and Y. E. Korchev, Biophys. J., 2001, 81, 1759–1764 CrossRef CAS.
- S. Schobesberger, P. Jönsson, A. Buzuk, Y. Korchev, J. Siggers and J. Gorelik, Biophys. J., 2016, 110, 141–146 CrossRef CAS PubMed.
- Y. Zhang, J. Gorelik, D. Sanchez, A. Shevchuk, M. Lab, I. Vodyanoy, D. Klenerman, C. Edwards and Y. Korchev, Kidney Int., 2005, 68, 1071–1077 CrossRef CAS PubMed.
- J. R. Cooper, M. B. Abdullatif, E. C. Burnett, K. E. Kempsell, F. Conforti, H. Tolley, J. E. Collins and D. E. Davies, PLoS One, 2016, 11, 1–20 Search PubMed.
- S. Dasari and P. Bernard Tchounwou, Eur. J. Pharmacol., 2014, 740, 364–378 CrossRef CAS PubMed.
- M. Cai, S. Xu, Y. Jin, J. Yu, S. Dai, X. J. Shi and R. Guo, Cell Death Discovery, 2023, 9, 179 CrossRef CAS PubMed.
- I. W. Achkar, N. Abdulrahman, H. Al-Sulaiti, J. M. Joseph, S. Uddin and F. Mraiche, J. Transl. Med., 2018, 16, 1–12 CrossRef PubMed.
- E. V. Sazonova, G. S. Kopeina, E. N. Imyanitov and B. Zhivotovsky, Cell Death Discovery, 2021, 7, 1–10 CrossRef PubMed.
- N. H. Nicolay, R. L. Perez, A. Rühle, T. Trinh, S. Sisombath, K. J. Weber, A. D. Ho, J. Debus, R. Saffrich and P. E. Huber, Sci. Rep., 2016, 6, 1–11 CrossRef.
- M. D. Hall, K. A. Telma, K. E. Chang, T. D. Lee, J. P. Madigan, J. R. Lloyd, I. S. Goldlust, J. D. Hoeschele and M. M. Gottesman, Cancer Res., 2014, 74, 3913–3922 CrossRef CAS PubMed.
- T. F. Tsai, J. F. Lin, Y. C. Lin, K. Y. Chou, H. E. Chen, C. Y. Ho, P. C. Chen and T. I. S. Hwang, Biosci. Rep., 2019, 39, 1–10 CrossRef.
- F. X. Wang, I. Prokes, L. Song, H. Shi and P. J. Sadler, J. Biol. Inorg. Chem., 2022, 27, 695–704 CrossRef CAS PubMed.
- T. Xu, J. A. Junge, A. Delfarah, Y. T. Lu, C. Arnesano, M. Iqbal, K. Delijani, T. C. Hsieh, E. Hodara, H. H. Mehta, P. Cohen, N. A. Graham, S. E. Fraser and A. Goldkorn, Sci. Rep., 2022, 12, 1–10 CrossRef.
- I. Arany, J. K. Megyesi, H. Kaneto, P. M. Price and R. L. Safirstein, Am. J. Physiol.: Renal Physiol., 2004, 287, 543–549 CrossRef PubMed.
- A. C. L. Mortensen, T. Mohajershojai, M. Hariri, M. Pettersson and D. Spiegelberg, Front. Oncol., 2020, 10, 532285 CrossRef PubMed.
- B. A. N. Brandhagen, C. R. Tieszen, T. M. Ulmer, M. S. Tracy, A. A. Goyeneche and C. M. Telleria, BMC Cancer, 2013, 13, 1–15 CrossRef PubMed.
- J. Rheinlaender and T. E. Schäffer, J. Appl. Phys., 2009, 105, 094905 CrossRef.
- J. Rheinlaender and T. E. Schäffer, Anal. Chem., 2015, 87, 7117–7124 CrossRef CAS PubMed.
- B. J. Aubrey, G. L. Kelly, A. Janic, M. J. Herold and A. Strasser, Cell Death Differ., 2018, 25, 104–113 CrossRef CAS PubMed.
- A. Brown, S. Kumar and P. B. Tchounwou, J. Cancer Sci. Ther., 2019, 11, 97 Search PubMed.
- C. J. Kim, A. L. Gonye, K. Truskowski, C. F. Lee, Y. K. Cho, R. H. Austin, K. J. Pienta and S. R. Amend, Neoplasia, 2023, 42, 100906 CrossRef CAS PubMed.
- L. Zhang, Y. Li, L. Qiao, Y. Zhao, Y. Wei and Y. Li, Int. J. Oncol., 2015, 47, 632–640 CrossRef CAS PubMed.
- S. Povea-Cabello, M. Oropesa-Ávila, P. de la Cruz-Ojeda, M. Villanueva-Paz, M. De La Mata, J. M. Suárez-Rivero, M. Álvarez-Córdoba, I. Villalón-García, D. Cotán, P. Ybot-González and J. A. Sánchez-Alcázar, Int. J. Mol. Sci., 2017, 18, 2393 CrossRef PubMed.
- R. Cao, W. Xiao, X. Wu, L. Sun and F. Pan, Biomed. Opt. Express, 2018, 9, 72 CrossRef CAS PubMed.
- J. Bednarska, A. Pelchen-Matthews, P. Novak, J. J. Burden, P. A. Summers, M. K. Kuimova, Y. Korchev, M. Marsh and A. Shevchuk, Proc. Natl. Acad. Sci. U. S. A., 2020, 117, 21637–21646 CrossRef CAS PubMed.
- T. Yoda, Processes, 2022, 10, 2396 CrossRef.
- D. Osiro, R. B. Filho, O. B. G. Assis, L. A. de C. Jorge and L. A. Colnago, Braz. J. Microbiol., 2012, 43, 341–347 CrossRef CAS PubMed.
- M. Battistelli and E. Falcieri, Biol., 2020, 9, 21 CAS.
- K. Nozawa, X. Zhang, T. Nakamura, Y. Nashimoto, Y. Takahashi, K. Ino and H. Shiku, Electrochim. Acta, 2023, 449, 142192 CrossRef CAS.
- J. Gorelik, A. I. Shevchuk, G. I. Frolenkov, I. A. Diakonov, M. J. Lab, C. J. Kros, G. P. Richardson, I. Vodyanoy, C. R. W. Edwards, D. Klenerman and Y. E. Korchev, Proc. Natl. Acad. Sci. U. S. A., 2003, 100, 5819–5822 CrossRef CAS PubMed.
- P. Happel, D. Thatenhorst and I. D. Dietzel, Sens., 2012, 12, 14983–15008 CrossRef CAS PubMed.
- J. Pijuan, C. Barceló, D. F. Moreno, O. Maiques, P. Sisó, R. M. Marti, A. Macià and A. Panosa, Front. Cell Dev. Biol., 2019, 7, 1–16 CrossRef PubMed.
- M. C. W. Lee, F. J. Lopez-Diaz, S. Y. Khan, M. A. Tariq, Y. Dayn, C. J. Vaske, A. J. Radenbaugh, H. J. Kim, B. M. Emerson and N. Pourm, Proc. Natl. Acad. Sci. U. S. A., 2014, 111, E4726–E4735 CAS.
- G. Gambardella, G. Viscido, B. Tumaini, A. Isacchi, R. Bosotti and D. di Bernardo, Nat. Commun., 2022, 13, 1714 CrossRef CAS PubMed.
- R. A. Chaurio, C. Janko, L. E. Muñoz, B. Frey, M. Herrmann and U. S. Gaipl, Molecules, 2009, 14, 4892–4914 CrossRef CAS PubMed.
- D.-H. Kim and D. Wirtz, Cell Adhes. Migr., 2013, 7, 293–296 CrossRef PubMed.
- M. K. Driscoll, C. McCann, R. Kopace, T. Homan, J. T. Fourkas, C. Parent and W. Losert, PLoS Comput. Biol., 2012, 8, e1002392 CrossRef CAS PubMed.
- G. R. Wickman, L. Julian, K. Mardilovich, S. Schumacher, J. Munro, N. Rath, S. Al Zander, A. Mleczak, D. Sumpton, N. Morrice, W. V. Bienvenut and M. F. Olson, Cell Death Differ., 2013, 20, 1293–1305 CrossRef CAS PubMed.
- L. Van der Meeren, J. Verduijn, D. V. Krysko and A. G. Skirtach, iScience, 2020, 23, 101816 CrossRef CAS PubMed.
- D. C. Wang, K. Y. Chen, C. H. Tsai, G. Y. Chen and C. H. Chen, J. Biomech., 2011, 44, 2790–2794 CrossRef PubMed.
- A. Arjonen, R. Kaukonen and J. Ivaska, Cell Adhes. Migr., 2011, 5, 421–430 CrossRef PubMed.
- R. Kakarla, J. Hur, Y. J. Kim, J. Kim and Y. J. Chwae, Exp. Mol. Med., 2020, 52, 1–6 CrossRef CAS PubMed.
- M. A. Model, Curr. Protoc. Cytom., 2019, 90, 1–9 CrossRef PubMed.
- Y. E. Korchev, J. Gorelik, M. J. Lab, E. V. Sviderskaya, C. L. Johnston, C. R. Coombes, I. Vodyanoy and C. R. W. Edwards, Biophys. J., 2000, 78, 451–457 CrossRef CAS PubMed.
- N. Xie, Y. R. Liu, Y. M. Li, Y. N. Yang, L. Pan, Y. B. Wei, P. Y. Wang, Y. J. Li and S. Y. Xie, Mol. Med. Rep., 2019, 20, 3355–3362 CAS.
- M. A. Model, Am. J. Physiol.: Cell Physiol., 2014, 306, C417–C424 CrossRef CAS PubMed.
- C. D. Bortner and J. A. Cidlowski, Front. Cell Dev. Biol., 2020, 8, 1–16 CrossRef PubMed.
- C. H. Pan, Y. F. Chang, M. S. Lee, B. C. Wen, J. C. Ko, S. K. Liang and M. C. Liang, BMC Cancer, 2016, 16, 1–11 CrossRef PubMed.
- S. Elmore, Toxicol. Pathol., 2007, 35, 495–516 CrossRef CAS PubMed.
- C. D. Bortner and J. A. Cidlowski, Cell Death Differ., 2002, 9, 1307–1310 CrossRef CAS PubMed.
- M. P. Singh, T. P. Khaket, V. K. Bajpai, S. Alfarraj, S. G. Kim, L. Chen, Y. S. Huh, Y. K. Han and S. C. Kang, Int. J. Mol. Sci., 2020, 21, 1–24 Search PubMed.
- T. Saito, N. A. Hartell, H. Muguruma, S. Hotta, S. Sasaki, M. Ito and I. Karube, Photochem. Photobiol., 1998, 68, 745–748 CrossRef CAS PubMed.
- K. Jayant, M. Wenzel, Y. Bando, J. P. Hamm, N. Mandriota, J. H. Rabinowitz, I. J. La Plante, J. S. Owen, O. Sahin, K. L. Shepard and R. Yuste, Cell Rep., 2019, 26, 266–278.e5 CrossRef CAS PubMed.
- R. E. Ozel, G. Bulbul, J. Perez and N. Pourmand, ACS Sens., 2018, 3, 1316–1321 CrossRef CAS PubMed.
Footnote |
| † Electronic supplementary information (ESI) available: Information about nanopipette characterization, control measurements, imaging untreated A549 cell over 24 h, continuous topography mapping, mapping edge of the cell, and imaging Petri dish surface is provided. See DOI: https://doi.org/10.1039/d3ay01827j |
| This journal is © The Royal Society of Chemistry 2024 |