
 Open Access Article
 This Open Access Article is licensed under a
 Creative Commons Attribution 3.0 Unported Licence
Enhanced uranium extraction selectivity from seawater using dopant engineered layered double hydroxides†
Muhammad
Zubair
 a,
Hayden
Ou
a,
Yuwei
Yang
a,
Daniel T.
Oldfield
b,
Lars
Thomsen
c,
Bijil
Subhash
a,
Jessica L.
Hamilton
c,
Joshua T.
Wright
d,
Nicholas M.
Bedford
*a and
Jessica Veliscek
Carolan
*b
a,
Hayden
Ou
a,
Yuwei
Yang
a,
Daniel T.
Oldfield
b,
Lars
Thomsen
c,
Bijil
Subhash
a,
Jessica L.
Hamilton
c,
Joshua T.
Wright
d,
Nicholas M.
Bedford
*a and
Jessica Veliscek
Carolan
*b
aSchool of Chemical Engineering, The University of New South Wales, Sydney, NSW 2052, Australia. E-mail: n.bedford@unsw.edu.au
bANSTO, Locked Bag 2001, Kirrawee DC, NSW 2232, Australia. E-mail: jvc@ansto.gov.au
cAustralian Synchrotron, ANSTO, 800 Blackburn Road, Clayton, VIC 3168, Australia
dDepartment of Physics, Illinois Institute of Technology, Chicago, IL 60616, USA
First published on 20th June 2023
Abstract
Although the concentration of uranium (U) in seawater is extremely low (3.3 μg L−1), the total amount of U in Earth's oceans is more than one thousand times greater than the amount in terrestrial ores. To extract useable quantities of U from seawater, highly selective adsorbent materials are needed since competing elements (e.g. sodium, calcium) are present at orders of magnitude higher concentrations. Layered double hydroxide (LDH) materials are an intriguing adsorbent material for U seawater extraction, as they are simple to prepare and can incorporate multiple metal chemistries to modulate structure and properties. Herein, X-ray absorption spectroscopy (XAS) is used to provide fundamental insight into the adsorption mechanism of U extraction from seawater and how doping of trivalent lanthanides into MgAl LDH materials can enhance their selectivity. It is revealed that the mechanism of U sorption from U-spiked seawater is primarily surface complexation with abundant Mg/Al–OH sites, along with the ion exchange mechanism whereby interlayer nitrate is replaced by anionic species (carbonate, hydroxyl and uranyl carbonate). Further, lanthanide doping increased the ionic character of bonding within the LDH and hence the selectivity for binding U via surface sorption. Neodymium doped LDH exhibited superior U selectivity to state-of-the-art amidoxime functionalised polymers, as well as adsorption capacity and kinetics comparable to these state-of-the-art adsorbents. These findings indicate that dopant engineering of LDHs provides a simple, effective method for controlling selectivity and producing adsorbents capable of challenging separations such as U extraction from seawater.
Introduction
Nuclear power provides an effective source of baseline carbon-free energy1 and in 2017 contributed approximately 10% of global energy production.2 As demand for low-carbon energy increases in future, so too will demand for uranium (U) as nuclear fuel. Traditional terrestrial U mineral deposits are predominantly located in only a handful of countries (notably Australia and Kazakhstan)3 and U supply is also an issue of energy security for many countries.4 Therefore, there is considerable interest in recovery of U from unconventional sources such as seawater and spent nuclear fuel.5–7 Since the total amount of U within the oceans is estimated at 4.5 billion tonnes, economic extraction of U from seawater could sustain nuclear power generation across the globe for thousands of years.5 The challenge is that the concentration of U in seawater is extremely low, approximately 3.3 μg L−1, while other competing ions are present at orders of magnitude higher concentrations (400–20![[thin space (1/6-em)]](https://www.rsc.org/images/entities/char_2009.gif) 000 mg L−1 of Na, Cl, Mg, Ca and K).5,8 Thus, selectivity is of paramount importance for any technology aiming to extract U from seawater.
000 mg L−1 of Na, Cl, Mg, Ca and K).5,8 Thus, selectivity is of paramount importance for any technology aiming to extract U from seawater.
There has been interest in adsorption of U from seawater since the 1960s9 and many adsorbent materials have been investigated, including organic, inorganic, composites, and biological materials.5,10–12 The advantages of inorganic materials include high surface areas, low cost and ease of synthesis.13 To date however, metal oxide, hydroxide and sulfide based inorganic adsorbents investigated for U extraction from seawater showed poor selectivity relative to organic materials such as functionalised polymers.5 In particular, amidoxime functionalised polymers are now considered state of the art, but suffer from slow adsorption kinetics.14–16 Amidoxime functionalised carbon, silica and metal–organic frameworks (MOFs) have also been studied due to the effectiveness of this functional group for U coordination.10,14,17 However, all materials developed for U recovery from seawater still face significant challenges including physical deployment as well as selectivity for U over other trace metals present in seawater, in particular Fe and V.5,18 Without this selectivity, the capacity of adsorbent materials remains limited.
Layered double hydroxides (LDHs) have recently generated interest as adsorbent materials for removal of metals from aqueous solutions, including U removal from seawater.19–21 Their structure consists of positively charged hydroxide layers and negatively charged guest interlayer anions, such as nitrate and carbonate, with general molecular formula [M2+1−xM3+x(OH)2]x+[An−]x/n·mH2O, where M2+, M3+ and An− represent the divalent cation, trivalent cation and interlayer anion, respectively.22 Advantages of LDHs include ease of preparation and highly tailorable properties.19,20,23–25 The versatility in the chemistry in LDHs thus enables property/structure manipulation that could be tuned to target adsorbates of interest. Indeed, LDHs with varying chemistries (MgAl, MgFe, CaAl and others, with different interlayer anions) have previously demonstrated fast and efficient adsorption of U from wastewater and seawater solutions.20,26–28 Although selectivity for U over Na, K and Mg appears readily achievable by LDHs, selectivity over other elements present in seawater such as Ca, Fe and V has proven more challenging.26,29,30 Further, the mechanism of U adsorption to LDHs, be it ion exchange or inner-sphere coordination via surface oxygen and hydroxide groups, is still not well understood. Previous work has suggested that both these mechanisms occur,23,29,31–33 but these investigations have typically examined materials loaded with U from pH 5–7 nitric acid solutions such that U is present as cationic UO22+, (UO2)3(OH)5+ or (UO2)4(OH)7+.34 LDH materials loaded with U under conditions relevant to seawater, in which the predominant U species are anionic UO2(CO3)34−,5 have yet to be characterised.
In this work, we investigate MgAl-based LDHs with various dopant elements (Fe, Ce, Nd, Eu and Tb) incorporated into the structure to modulate U uptake properties. The impact of the dopant elements on the structure and adsorption performance of the LDHs was observed, with adsorption performance encompassing selectivity for U, adsorption kinetics and capacity as well as LDH chemical stability. Extensive X-ray absorption spectroscopy (XAS) experiments were used to characterise the binding mechanism of U to LDHs under conditions relevant to seawater (pH 8 sodium carbonate solution), which enabled the understanding of selectivity and adsorption efficiency as a function of doping chemistry. It was found that Nd doping had the strongest influence in distorting Mg and Al octahedra post U adsorption due to the manipulation of M–OH covalency, facilitating more selective surface U sorption. This detailed mechanistic comprehension of U adsorption from seawater, as a function of LDH doping chemistry, is envisioned to be beneficial to design of new materials that are selective, efficient and economically suitable for U removal from seawater.
Experimental section
Synthesis
MgAl based LDHs were synthesized using established co-precipitation method.24,25 To synthesize LDH with M2+:M3+ cation ratio 3:1, first 4.5 mmol Mg2+ (magnesium nitrate hexahydrate) and 1.5 mmol Al3+ (aluminium nitrate nonahydrate) were dissolved in 5 ml deionised water. Then, 50 ml of 0.3 M NaOH solution was added slowly into the metal precursor solution while stirring, keeping pH in the range of 10–14. After one hour of co-precipitation reaction, the solution was centrifuged and washed three times with deionised water and ethanol to collect the product. The collected product was vacuum dried at 60 °C overnight. The doped samples were synthesized in the similar fashion by substituting 10 mol% aluminium nitrate nonahydrate with metal (Fe3+, Ce3+, Nd3+, Eu3+, Tb3+) nitrate hydrates while keeping magnesium precursor concentration fixed. The total metal precursors concentration was kept at 6 mM.
Adsorption
Adsorption experiments were undertaken via the batch method with 10 mg LDH and 2 mL solution (volume to mass ratio, V m−1 = 200 mL g−1), shaken on a vertical mixer at 30 rpm for 24 h and all samples were tested in triplicate, unless otherwise specified. Post adsorption, the solutions were filtered (0.45 μm) and prepared for inductively coupled mass spectrometry (ICP MS) analysis via dilution in 3% nitric acid.A 1 L simulated seawater solution was created for sorption experiments to test the selectivity of U removal. Competing elements Na, Mg and Ca, K and V were included based on the composition of seawater provided by Abney et al.,5 details in Table S1 (ESI†). For addition of U, 1 mL 800 ppm U solution (5 M nitric acid) was added to the 1 L simulated seawater solution. The pH was then adjusted to 8.0 via addition of 9 mL 2 M sodium carbonate solution.
For testing of capacity and kinetics, a 3 ppm U solution was created via addition of 8 mL 700 ppm U solution (pH 4 nitric acid) to 2 L deionised water and adjustment of pH to 8.5 via addition of 3 mL 2 M sodium carbonate solution. For capacity measurements 5, 10, 20, 50 and 100 mL of the 3 ppm U solution was added to 10 mg samples, so V m−1 ranged from 500 to 10000 mL g−1. For kinetics measurements, undertaken in duplicate with V m−1 1000 mL g−1 (10 mg LDH, 10 mL solution), samples and solutions were shaken for 30 minutes, 1 h, 2 h, 4 h or 8 h.
For real seawater adsorption experiments, 1.6 L of Coogee Beach seawater was collected then decanted to remove sediments and organisms. A 2.3 mL 700 ppm U spike (pH 4 nitric acid) was added to the seawater to produce a measurable U concentration. The V concentration in the real seawater solution was too low to be measured. The pH of the seawater was unchanged by addition of the U spike, remaining pH 8.3.
Separation factors (SF) were calculated based on the ratio of partition coefficients (D. mL g−1):
Characterization
:10 in 3% HNO3 was performed using a Varian 820-MS instrument equipped with nickel cones, Micromist low flow nebuliser, double-glass Scott spray chamber, and SPS3 autosampler. Quantitative analysis was achieved by measurement of a nine-point calibration curve from 0 to 1000 ppb for each element to be analysed, using commercially available multi-element standard solutions. Internal standards of Sc, Y, In, Tb and Bi at a concentration of 5 ppb each were used. Reported error values on all ICP-MS data were calculated by assuming at least 5% error in the average of duplicate or triplicate values, unless standard deviation was higher than 5%, in which case the standard deviation was used.
Results and discussion
Layered double hydroxide materials with an MgAl base structure have demonstrated promise for removal of U from seawater.26,31 Hence, MgAl LDHs were chosen as templates for dopant inclusion in this work. Dopants were chosen based on previous U adsorption studies and/or similarity to U electronic structure. For example, the previous use of LDH/Fe3O4 composites for adsorption of U showcase Fe–U interactions as a potentially important interaction.20 Nd was chosen as a dopant due to its equivalent electronic structure to U. Samples doped with lighter and heavier lanthanides (Ce, Eu, Tb) were also synthesised for comparison.Material characterisation
All LDHs were first characterised to confirm structure and chemistry prior to U adsorption testing. XRD patterns of the as-made LDH samples (Fig. S1, ESI†) showcase broad peaks due to the layered structure of LDH, along with sharper peaks due to the presence of sodium nitrate (ICSD 01-079-2056). These peaks are in accordance with the typical patterns of MgAl LDHs41 and indicate a basal spacing of 7.7 Å, similar to previously observed spacings for LDHs with interlayer nitrate anions.23,33 The elemental composition of the LDH samples was quantitatively measured by ICP-MS (Table S3, ESI†) and was approximately as expected; Mg0.75Al0.15X0.10(OH)2(NO3)0.25 for LDH samples containing dopant X. Incorporation of the dopant elements was typically 5–8 mol%, less than the expected 10 mol%, potentially due to cation size mismatch issues upon hydroxide sheet precipitation. A substantial amount of sodium nitrate was also present in the samples, consistent with the XRD (SI). FTIR-ATR spectra were also collected (Fig. S2, ESI†), and indicate the presence of Mg–O(H), Al–O(H), water, OH and nitrate anions, but no substantial differences were observed in the spectra upon addition of dopants. Both SEM/EDS (SI) and TEM/EDS (Fig. 1) of the LDHs indicated an aggregated platelet-like particle morphology. The platelet size in these samples was small, approximately 30–40 nm in diameter. Size of platelets varies widely in previously synthesised LDH materials, from <100 nm diameter32 to approximately 5 μm diameter.26,42 The EDS maps (Fig. 1) indicate that Mg and Al were evenly distributed throughout the LDH particles. The distribution of Nd within the LDH particles was also mostly homogeneous but Nd appeared more concentrated in some localised regions. Similarly, Mg and Al were evenly distributed but dopants showed slightly localised distributions for the other LDH samples containing dopants (Fe, Ce, Eu, Tb, see ESI†). This could indicate the formation of a small amount of the hydroxides/oxides from the dopant elements, although these were not detected above the limits of sensitivity for XRD and XAS. The only exception is in Ce-doped MgAl, where CeO2 is observable by XRD (Fig. S1, ESI†). | ||
| Fig. 1 TEM/EDS images of MgAl (top) and MgAlNd (bottom). | ||
The physicochemical data of the LDH materials along with the adsorption–desorption isotherms and pore size distributions are provided in the Table S4 and Fig. S9 (ESI†). The MgAl and MgAlFe samples had low BET surface areas of less than 10 m2 g−1. This was attributed to inaccessibility of the interlayer structure of the samples to the N2 molecules42 and is consistent with the morphologies seen via SEM (SI). The lanthanide doped LDHs showed higher BET surface areas of 15–40 m2 g−1. This was attributed to the difference in ionic radii of the lanthanides (87–98 pm) relative to Al3+ (53 pm), whereas the ionic radius of Fe3+ (55 pm) more closely matched that of Al3+.43 The BET surface areas and pore sizes were generally comparable to previously synthesised MgAl LDH materials.27,44
The XAS spectra for MgAl based LDHs are depicted in Fig. 2. In Mg K-edge X-ray absorption near edge structure (XANES), the characteristic peaks labelled (a)–(d) in all LDH samples can be clearly observed (Fig. 2a). Peak (a) is attributed to the electronic transition of 1s electrons to an unoccupied 3p state, while peaks (b) and (c) are assigned to the electronic transitions from 2s and 2p orbitals.45 Peaks (b)–(d) further arise from transition associated with MgO6 octahedral coordination.46 The K-edge energy position (E0) is indicative of coordination environment, unlike transition 3D metals where absorption edge position refers to the oxidation or reduction due to their flexible redox states. Hence, the change in peak (b) position is most likely associated with the distortion of the MgO6 octahedron.47 The degree of distortion in MgO6 octahedron follows the trend MgAlNd < MgAlFe < MgAlTb < MgAlCe < MgAlEu. The commensurate change in the white line intensity further suggests that these distortions impart comparative bond polarization back toward the Mg atoms due to unoccupied 2p orbital states.
 | ||
| Fig. 2 Normalized XAS Spectra for LDHs before adsorption (a) Mg K-edge (b) Al K-edge (c) O K-edge and (d) N K-edge. | ||
The Al K-edge XANES (Fig. 2b) shows two peaks, labelled (a) and (b), above the absorption edge. These two peaks are characteristic of octahedral coordinated Al(OH)3 and are similar to the spectra obtained for MgAl based LDH structure reported previously.48 The shift in peak position indicating octahedral distortion amongst the LDH samples was greatest for MgAlEu and MgAlTb, strongly indicating that M3+ doping can be used to create distortions in the LDH structure. Contrary to Mg K-edge NEXAFS, the peak (a) position shifts to a lower energy ∼1569.4 eV for MgAlNd while it remains nearly identical ∼1569.9 eV for all other LDH samples. This observation indicates Nd helps preserve the local ordering of oxo-bridges, which help to align AlO6 octahedra. The trend in white line intensity is strongly related to the unoccupied electronic states at Al 2p orbitals. The white line intensity decreases following the trend MgAlNd < MgAlFe ∼ MgAlCe < MgAlTb ∼ MgAlEu, indicating more occupied electronic states in Al 2p. Furthermore, the octahedral distortion could be related to the mismatch of the ionic radii between doped and substituted cations. The octahedral distortion may cause a decrease in white line intensity because of reduced multiple scattering.49
The O K-edge NEXAFS in Fig. 2c shows four peaks; main peak (a) at ∼534 eV, due to the O(1s) to O(2p) orbitals mixed with Mg/Al (3s)3p,50 small peak (b) at ∼536 eV, likely related to O(π*) of NO3−, and peaks (c) and (d) between 538eV and 550eV, resulting from dominant near edge transitions from the water molecules present in the interlayers of LDH.51 The change in pre-edge peak (a) absorption energy positions reflects different coordination environments for the undoped and doped samples. The intensity of peak (a) is likely related to the unoccupied states at O(2p) and M–O covalency.52 A stronger covalent character of M–O would include more p-type orbitals into the unoccupied states that leads to more intense pre-edge peaks.53 The intensity of pre-edge peak (a) and hence the covalency of the M–O bonding decreased in order MgAl > MgAlFe > MgAlTb > MgAlCe > MgAlEu > MgAlNd.
The N K-edge NEXAFS in Fig. 2d shows four peaks; peak (a) is assigned to N(1s) to N(π*) LUMO orbital of NO2− (nitrite), sharp intense peak (b) is due to the 1s to π* transition in NO3− (nitrate) while the broader peaks (c) and (d) represent 1s–σ* transitions consistent with the previous studies on NO3−.54 Hence, all the LDH samples contained nitrate and a small amount of nitrite, with differences observed in peak (b) intensities upon addition of dopants, which is expected given that dopant positive charge is likely to influence the concentration and covalency of nitrate anions to keep the charge balance in LDHs.55
In addition, XANES spectra for dopant metals were also measured to investigate the local structure around the dopants (see ESI†). The Fe K-edge XANES for MgAlFe showed similarity to the ferrihydrite standard (Fig. S10, ESI†), revealing that iron exists as Fe3+ in pristine MgAlFe. The Ce L3-edge XANES appears consistent with the Ce(IV) oxide standard, indicating cerium is present as the Ce4+ oxidation state in the MgAlCe sample. The other lanthanide dopant metals (Nd, Eu and Tb) appear to exist in an M3+ oxidation state, based on comparison to L3-edge XANES in similar study.56
Adsorption
 | ||
| Fig. 3 Adsorption of U, V and Ca from simulated seawater (a). Equilibrium adsorption isotherms (b) and adsorption kinetics (c) from 3 ppm U in pH 8 Na2CO3. Markers = experimental data, lines = fitted Freundlich isotherm model. | ||
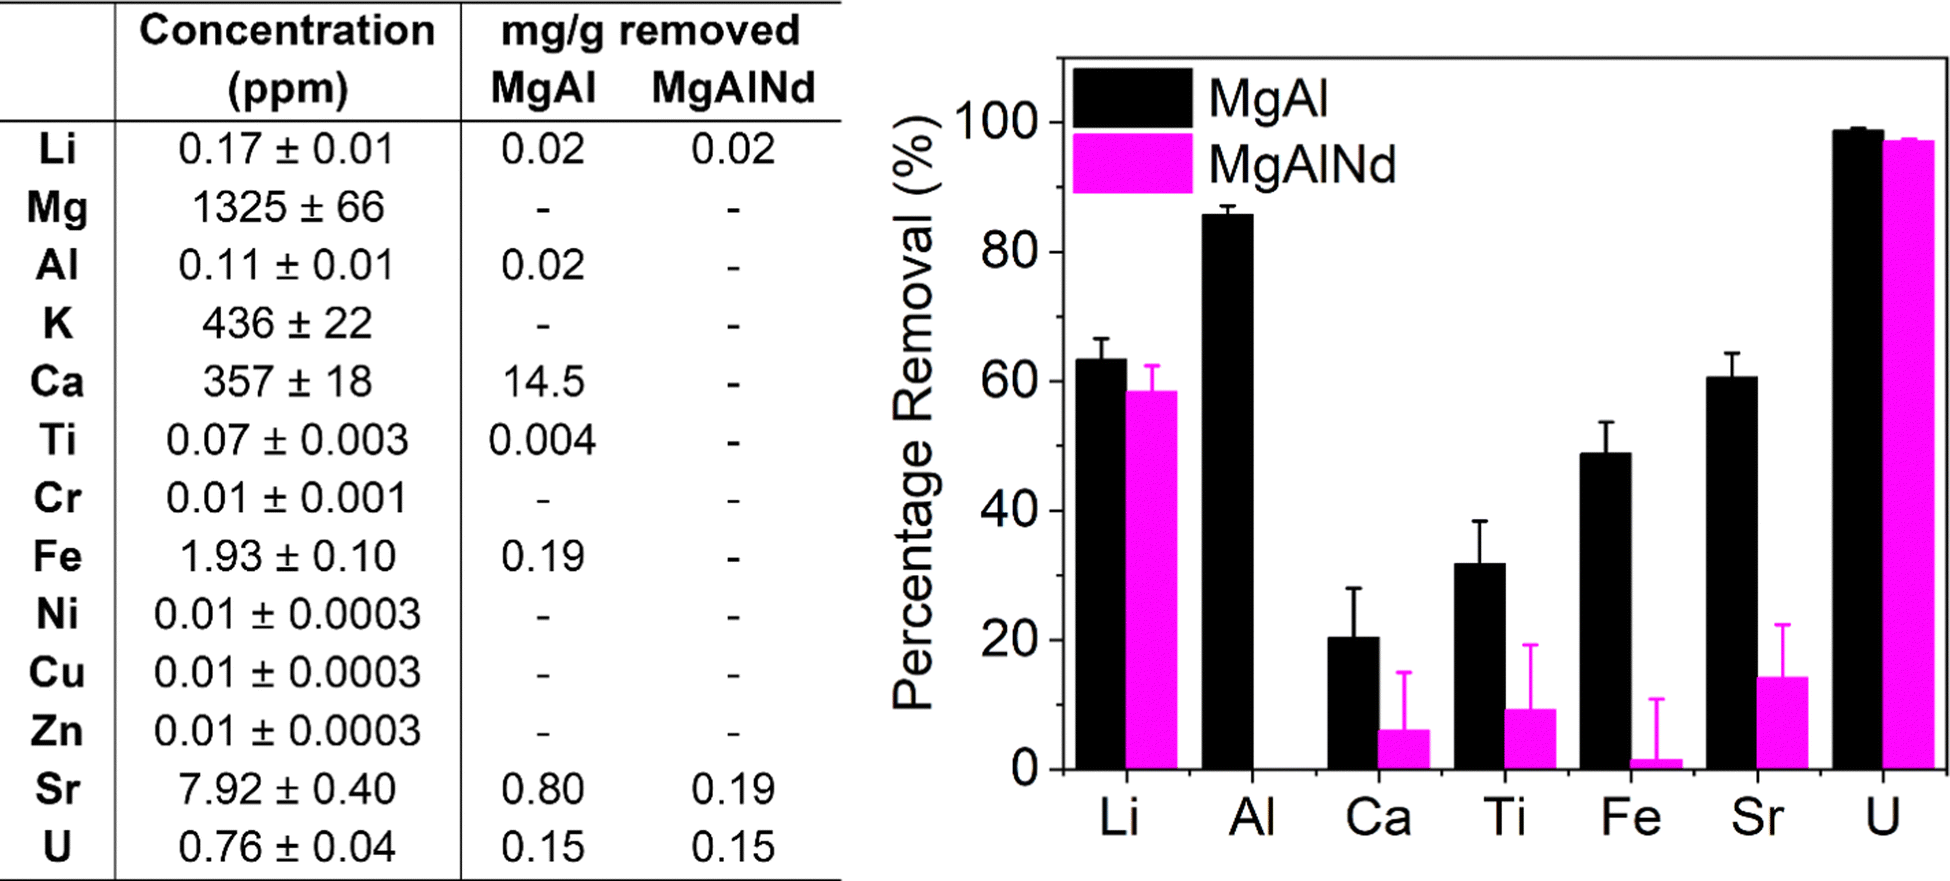
Adsorption of Ca was highly variable and ranged from zero (MgAlNd and MgAlEu) to 75% (MgAl). Interestingly, the amount of Ca adsorbed by the LDH samples was correlated with the degree of covalency of their M–O bonding, according to the O K-edge NEXAFS in Fig. 2. The LDH samples with the greatest covalency, MgAl and MgAlFe, show the most Ca adsorption while the LDH samples with most ionic M–O bonding character, MgAlNd and MgAlEu, did not adsorb Ca at all. Since Ca was present at a much higher concentration than U, it is reasonable to assume that Ca adsorption would significantly diminish the U capacity of an LDH, even if the percentage extraction of Ca was less than that of U. For example, Mg–Al adsorbed 0.1 mg U g−1 and 33.8 mg Ca per g, even though the percentage removal of U was higher. As such, any LDH that showed significant Ca adsorption was considered inappropriate for U removal from seawater. Both MgAlNd and MgAlEu showed equally high selectivity for U over Ca, but MgAlNd was considered the optimal LDH composition for U removal from seawater, as this sample adsorbed U with a higher efficiency than MgAlEu. In addition, Nd is considerably less expensive than Eu making it a more attractive dopant from an economic standpoint.
Other LDH materials have previously been investigated for selective adsorption of U in the presence of Na, K, Mg and Ca, and in a few cases other elements also. Selectivity over Na, K and Mg appears readily achievable, while Ca is commonly adsorbed by LDH materials and causes reduced U adsorption.19,26,32 It should also be noted that previous selectivity experiments were performed in the absence of carbonate, so the speciation and behaviour of U did not reflect seawater conditions. This is exemplified by the work of Chen et al. (2021)31 which showed that although addition of Na, K, Mg and Ca did not cause a decrease in U adsorption by a MgAl layered double oxide (LDO), addition of carbonate did. Adsorption of V was also measured for the MgAl LDH samples in this work and the undoped MgAl sample showed the greatest selectivity for U over V (SFU/V = 36). This selectivity factor is higher than has been achieved previously with an LDH adsorbent (SFU/V 4–8),57–59 although not as high as has been achieved using other extractants such as a DNAzyme hydrogel (SFU/V ∼ 104).60 The U/V selectivity of the lanthanide doped LDH samples in this work (SFU/V ∼ 2–5) is comparable to that of other LDH adsorbents explored for U extraction from seawater. However, the selectivity of the U adsorption over Ca exhibited by MgAlNd and MgAlEu in this work, at pH 8 with carbonate present, is quite remarkable for this class of material.
Visual inspection of the results in Fig. 3b show that MgAl had the highest U capacity, which was still increasing above 20 mg g−1. On the other hand, MgAlNd showed U capacity of approximately 8 mg g−1. The substantially higher U capacity of MgAl relative to MgAlNd could be due to its higher ratio of divalent to trivalent ions (2+/3+, 4.0 for MgAl versus 2.6 for MgAlNd), which leads to lower surface charge and hence increased anion mobility and capacity.63 Langmuir and Freundlich models were fit to the experimental data (Table S5 and Fig. S11, ESI†), indicating the Freundlich isotherm provided a superior fit and hence a multilayer adsorption mechanism was present. It is difficult to compare the capacities in Fig. 3b, which were measured using 3 ppm U in pH 8.5 sodium carbonate solution and V m−1 up to 10000, with the capacities of previously synthesised LDH materials, which have typically been measured under conditions irrelevant to seawater, namely pH 5–6 nitric acid and U concentrations 30–500 mg L−1.30–32,64 Under these conditions, U would be expected to be present as (UO2)2(OH)22+ and (UO2)3(OH)5+.34 These cationic hydroxide complexes cannot be expected to behave the same as the anionic carbonate complexes present in seawater. Thus, although high capacities of up to 890 mg g−1 have been measured for LDH materials at pH 6 using 500 ppm U,31 this does not reflect the capacity of these materials under seawater conditions. Comparable conditions of adsorption to those in Fig. 3b, namely 10 ppm U at pH 8–9 and V m−1 5000, have been measured for ternary MgFeAl and NiFeAl LDHs, although no carbonate was added in this previous experiment so the predominant U species were (UO2)3(OH)7−.23 In that case the amount of U adsorbed was 25–40 mg g−1, which is comparable to the capacity of MgAl in this work.
Using real seawater, the maximum adsorption capacity that has been achieved with any adsorbent material is approximately 5 mg g−1.5,65 The amidoxime functionalised polymer fibres that achieved this maximum adsorption capacity from real seawater also demonstrated 175 mg U g−1 adsorption under laboratory conditions similar to those used in the current work; 6 ppm U in pH 8 solution with sodium bicarbonate and sodium chloride and V m−1 50000.65 Thus, the U adsorption capacities of the LDH materials synthesised in this work are within the same order of magnitude as the polymer material with the highest reported U capacity from seawater.
Some loss of Mg and Al from the LDH materials was also observed during the adsorption capacity measurements (see Fig. S12, ESI†). Loss of Mg was the most significant, with 2–4% Mg loss observed using V m−1 500, while losses of Al and Nd were much smaller. No Mg loss was observed during adsorption experiments in real or simulated seawater. Future development of LDH materials for U extraction from seawater should explore whether there is any impact on the recyclability of these materials.
The results of kinetics measurements undertaken with MgAl and MgAlNd are shown in Fig. 3c. Both samples showed similar kinetics, with >90% U removed within 8 h. The kinetics results in Fig. 3c are presented as a percentage of the total U extracted in 24 h, since equilibrium has been reached after 24 h. So, although MgAl had a higher sorption capacity than MgAlNd, their relative rates of adsorption were similar. For example, both materials sorbed approximately 60% of the total final amount sorbed within 4h. The pseudo-second order kinetics model66 provided the best fit to the experimental data (SI) with calculated rate constants of were k2 = 0.003 (R2 = 0.99) for MgAl and k2 = 0.005 (R2 = 0.99) for MgAlNd. Hence, MgAlNd showed slightly faster adsorption kinetics than MgAl. Most previously reported LDH materials for U removal have also reported pseudo-second order kinetics and similar rates of adsorption, reaching equilibrium within 4–8 h.23,33,64 However, previous kinetics experiments have been undertaken using varying U concentrations (10–300 ppm), V m−1 ratios (2000–10000) and pH 5–6, making direct comparison between results difficult. Similar adsorption conditions to the present work are reported by Li et al. (2020), in which a MgFe LDH adsorbed 3 ppm U with V m−1 3000 within 30 min.28 However, these kinetics experiments were undertaken at pH 3. The kinetics of LDH adsorption under seawater conditions of pH 8 sodium carbonate solution have not been reported until now, but the presence of carbonate is known to slow kinetics for polymer fibre adsorbents.67 Thus, the fact that MgAl and MgAlNd reached equilibrium within 8 h at pH 8 in the presence of carbonate makes it likely that their kinetics are superior to amidoxime functionalised polymer fibres, which showed adsorption still increasing beyond 40 days in seawater.65
 | ||
| Fig. 4 Composition of spiked seawater and adsorption of trace elements from spiked seawater with MgAl and MgAlNd LDH samples. | ||
In terms of selectivity, both LDH samples showed preferential extraction of U over all other elements measured. However, MgAl did adsorb several other elements from seawater as well as U, namely Li, Al, Ca, Ti, Fe and Sr. The adsorption of Ca by MgAl was also observed in the simulated seawater adsorption results (Fig. 3a). However, the amount of Ca adsorbed from the real seawater (14.5 mg g−1) was less than from the simulated seawater solution (33.8 mg g−1), which could be due to differences in carbonate concentration, pH, salinity, the presence of other metal cations and/or organic compounds. Consistent with the simulated seawater experiments, MgAlNd was more selective than MgAl, although MgAlNd did show some adsorption of Li and Sr, as well as U. From this, it is clear the chemistry of LDH materials can be used to control their selectivity, as incorporation of the Nd dopant increased the selectivity of U adsorption over Al, Ca, Ti, Fe and Sr.
LDH materials with different chemistries also demonstrate varying selectivity in the literature. For example, competitive sorption experiments performed with a MgCo LDH under simulated seawater conditions with similar elements to those measured in Fig. 4 showed adsorption of Cu, Fe, Sr, Zn and Al, but no adsorption of Mg, K or Ca.29 The MgAl LDH in this work also adsorbed Fe, Sr and Al, but did not adsorb Cu or Zn, and did show adsorption of Ca. Other NiAl and NiMn LDH composite materials have also been shown to adsorb Cu, Fe, Al, Sr, Ca and V, as well as U, under seawater conditions.30,58 Therefore, the selectivity of MgAlNd in this work is substantially greater than previously synthesised LDH materials. Given comparable V uptake in non-simulated seawater (Fig. 3) and the uptake results for U, we would expect similar V uptake as well. Further, the selectivity of MgAlNd is comparable to the ‘state of the art’ amidoxime functionalised polymer fibre material, which adsorbed Na, Mg, Ca, V, Zn, Cu and Fe as well as U.65 Indeed, amidoxime functionalised polymers are generally known to adsorb Na, Mg, Ca, V, Cu and Fe.5 Given the percentage sorption of U from simulated and real seawater was similar, it is reasonable to assume that the capacities would also be similar. Further experiments to measure the sorption capacity from real seawater should be investigated in future, using both spiked and non-spiked seawater.
Adsorption mechanism
The mechanism of U adsorption to LDH materials remains unclear, but likely depends on the chemistry of the LDH and the U species present in solution. Previous studies that have investigated the adsorption of U to LDHs via XRD, FTIR, XPS and EXAFS have suggested U binds to LDHs via (1) complexation of the uranyl cation with interlayer anions (hydroxide, carbonate, nitrate, sulfonate, polysulfide),19,28,29 (2) complexation with metal–oxygen and metal-hydroxide groups on the LDH surface,23,31–33 or (3) ion exchange.23,58 In some cases, a combination of these mechanisms is suggested. However, none of these studies have characterised LDH materials after adsorption of U from seawater or solutions containing carbonate. Therefore, the U species adsorbed is either UO22+, (UO2)3(OH)5+ or (UO2)3(OH)7−, whereas in the presence of carbonate the U species UO2(CO3)34− and UO2(CO3)22− are more likely to be present.To gain insight into the mechanism of U adsorption from seawater, characterisation of MgAl(X) LDH samples post-adsorption of U from pH 8 sodium carbonate solution was undertaken. The post adsorption U L3-edge XANES and EXAFS spectra were collected for all MgAl(X) samples to probe local structure around U (Fig. 5a and b). The XANES spectra (Fig. 5a) for MgAl(X) samples along with the uranyl carbonate and nitrate solution standards reveal common features with negligible differences in absorption edge position and white line intensity. It is to be noted that U L3-edge XANES spectra are not ideal to determine oxidation state of U due to the dipole selection rules. The U L3-edge XANES spectra reflect electronic transitions from 2p3/2 core level to the unoccupied U 6d states, whereas U valence state depends on the electronic density in U 5f orbital.68,69 The presence of shoulder at higher energy side of white line ∼17.18 keV in all spectra suggests multiple scattering in the di-oxo uranyl ligand UO22+.70 The primary difference in XAS spectra is energy position shift for first EXAFS oscillation ∼17.21 keV for UO2(NO3)2 standard. This phase shift can also be observed in k2 weighted EXAFS spectra (Fig. S13, ESI†). The oscillatory structures of sinusoidal wave functions are similar for all MgAl(X) samples and uranyl carbonate standard up to 7 Å−1 while slight variations could be observed at higher wavenumbers (Fig. S13, ESI†). All the wavenumbers deteriorate in data quality beyond 11 Å−1 due to the low concentration of U in the samples. These observations suggest that U adsorbs on all MgAl(X) samples as uranyl carbonate species which is expected under carbonate solution. The Fourier transformed U L3-edge radial plot (Fig. 5b) for all MgAl(X) samples and U standards shows two distinct coordination shells each defined by unique reduced distance (not phase corrected) with U–Oax shell (R ∼ 1.4 Å), U–Oeq shell (R ∼ 2 Å). The presence of U–Oax and U–Oeq shells verifies the U(VI) oxidation state. The visible difference could be observed for higher R coordination shells (R = 2.5–4 Å) as depicted in Fig. 5b. The coordination shell ∼2.5 Å (not phase corrected) in all MgAl(X) samples is assigned to U–C contribution after comparing it with the uranyl carbonate standard. To elucidate the differences between coordination shells between 2.6–4 Å we performed wavelet transformation (WT) analysis (see ESI†) as depicted in Fig. 5(c–f) and Fig. S14, S15 (ESI†). The magnified high-R WT reveals two maxima which are assigned to the multiple scattering shells in uranyl carbonate standard (Fig. 5d). Contrary to the uranyl carbonate standard, visible differences could be seen in magnified high-R WT for post U-adsorption MgAl LDH (Fig. 5f), this trend is consistent in other doped MgAl samples (Fig. S15, ESI†). Based on the WT analysis, we conducted EXAFS modelling using combination of FEFF pathways generated employing bayleyite [Mg2(UO2(CO3)3) ·18H2O]38 and magnesium orthouranate [Mg(UO2)2]39 structures. The EXAFS fitting parameters along with simulation errors are given in the Table S6 (ESI†). The U–Oax bond distance was refined at ∼1.80–1.83 Å with fixed CN U–Oax = 2 for all MgAl(X) samples. The next U–Oeq pathway was refined at ∼2.43–2.46 Å with CN U–Oeq ∼ 4 for all MgAl(X) samples considering EXAFS modelling errors. The subsequent C scatterer was fitted at ∼2.93–2.95 Å with CN U–C = 3 or 2 in case of MgAlEu and MgAlTb consistent with either UO2(CO3)34−, or UO2(CO3)22−. For higher-R (2.6–4 Å) shells, magnesium orthouranate structure was used to generate U–U and U–Mg/Al pathways. A U scatterer was fitted at 3.48 ± 0.04 Å in MgAl, MgAlNd and 3.53 ± 0.06 Å in MgAlTb. The CN for U–U shell was 1.4–1.8. A subsequent Mg/Al distance was also fitted at ∼3.93–3.97 Å with CN U–Mg ∼ 4–5. The EXAFS modelling suggests, U uptake by all MgAl(X) LDH samples was through formation of surface sorbed uranyl carbonate phase along with mixing of some magnesium orthouranate character. The similar mechanism is also reported elsewhere,71 where MgAl hydrotalcite in cement minerals was used to immobilize U(VI).
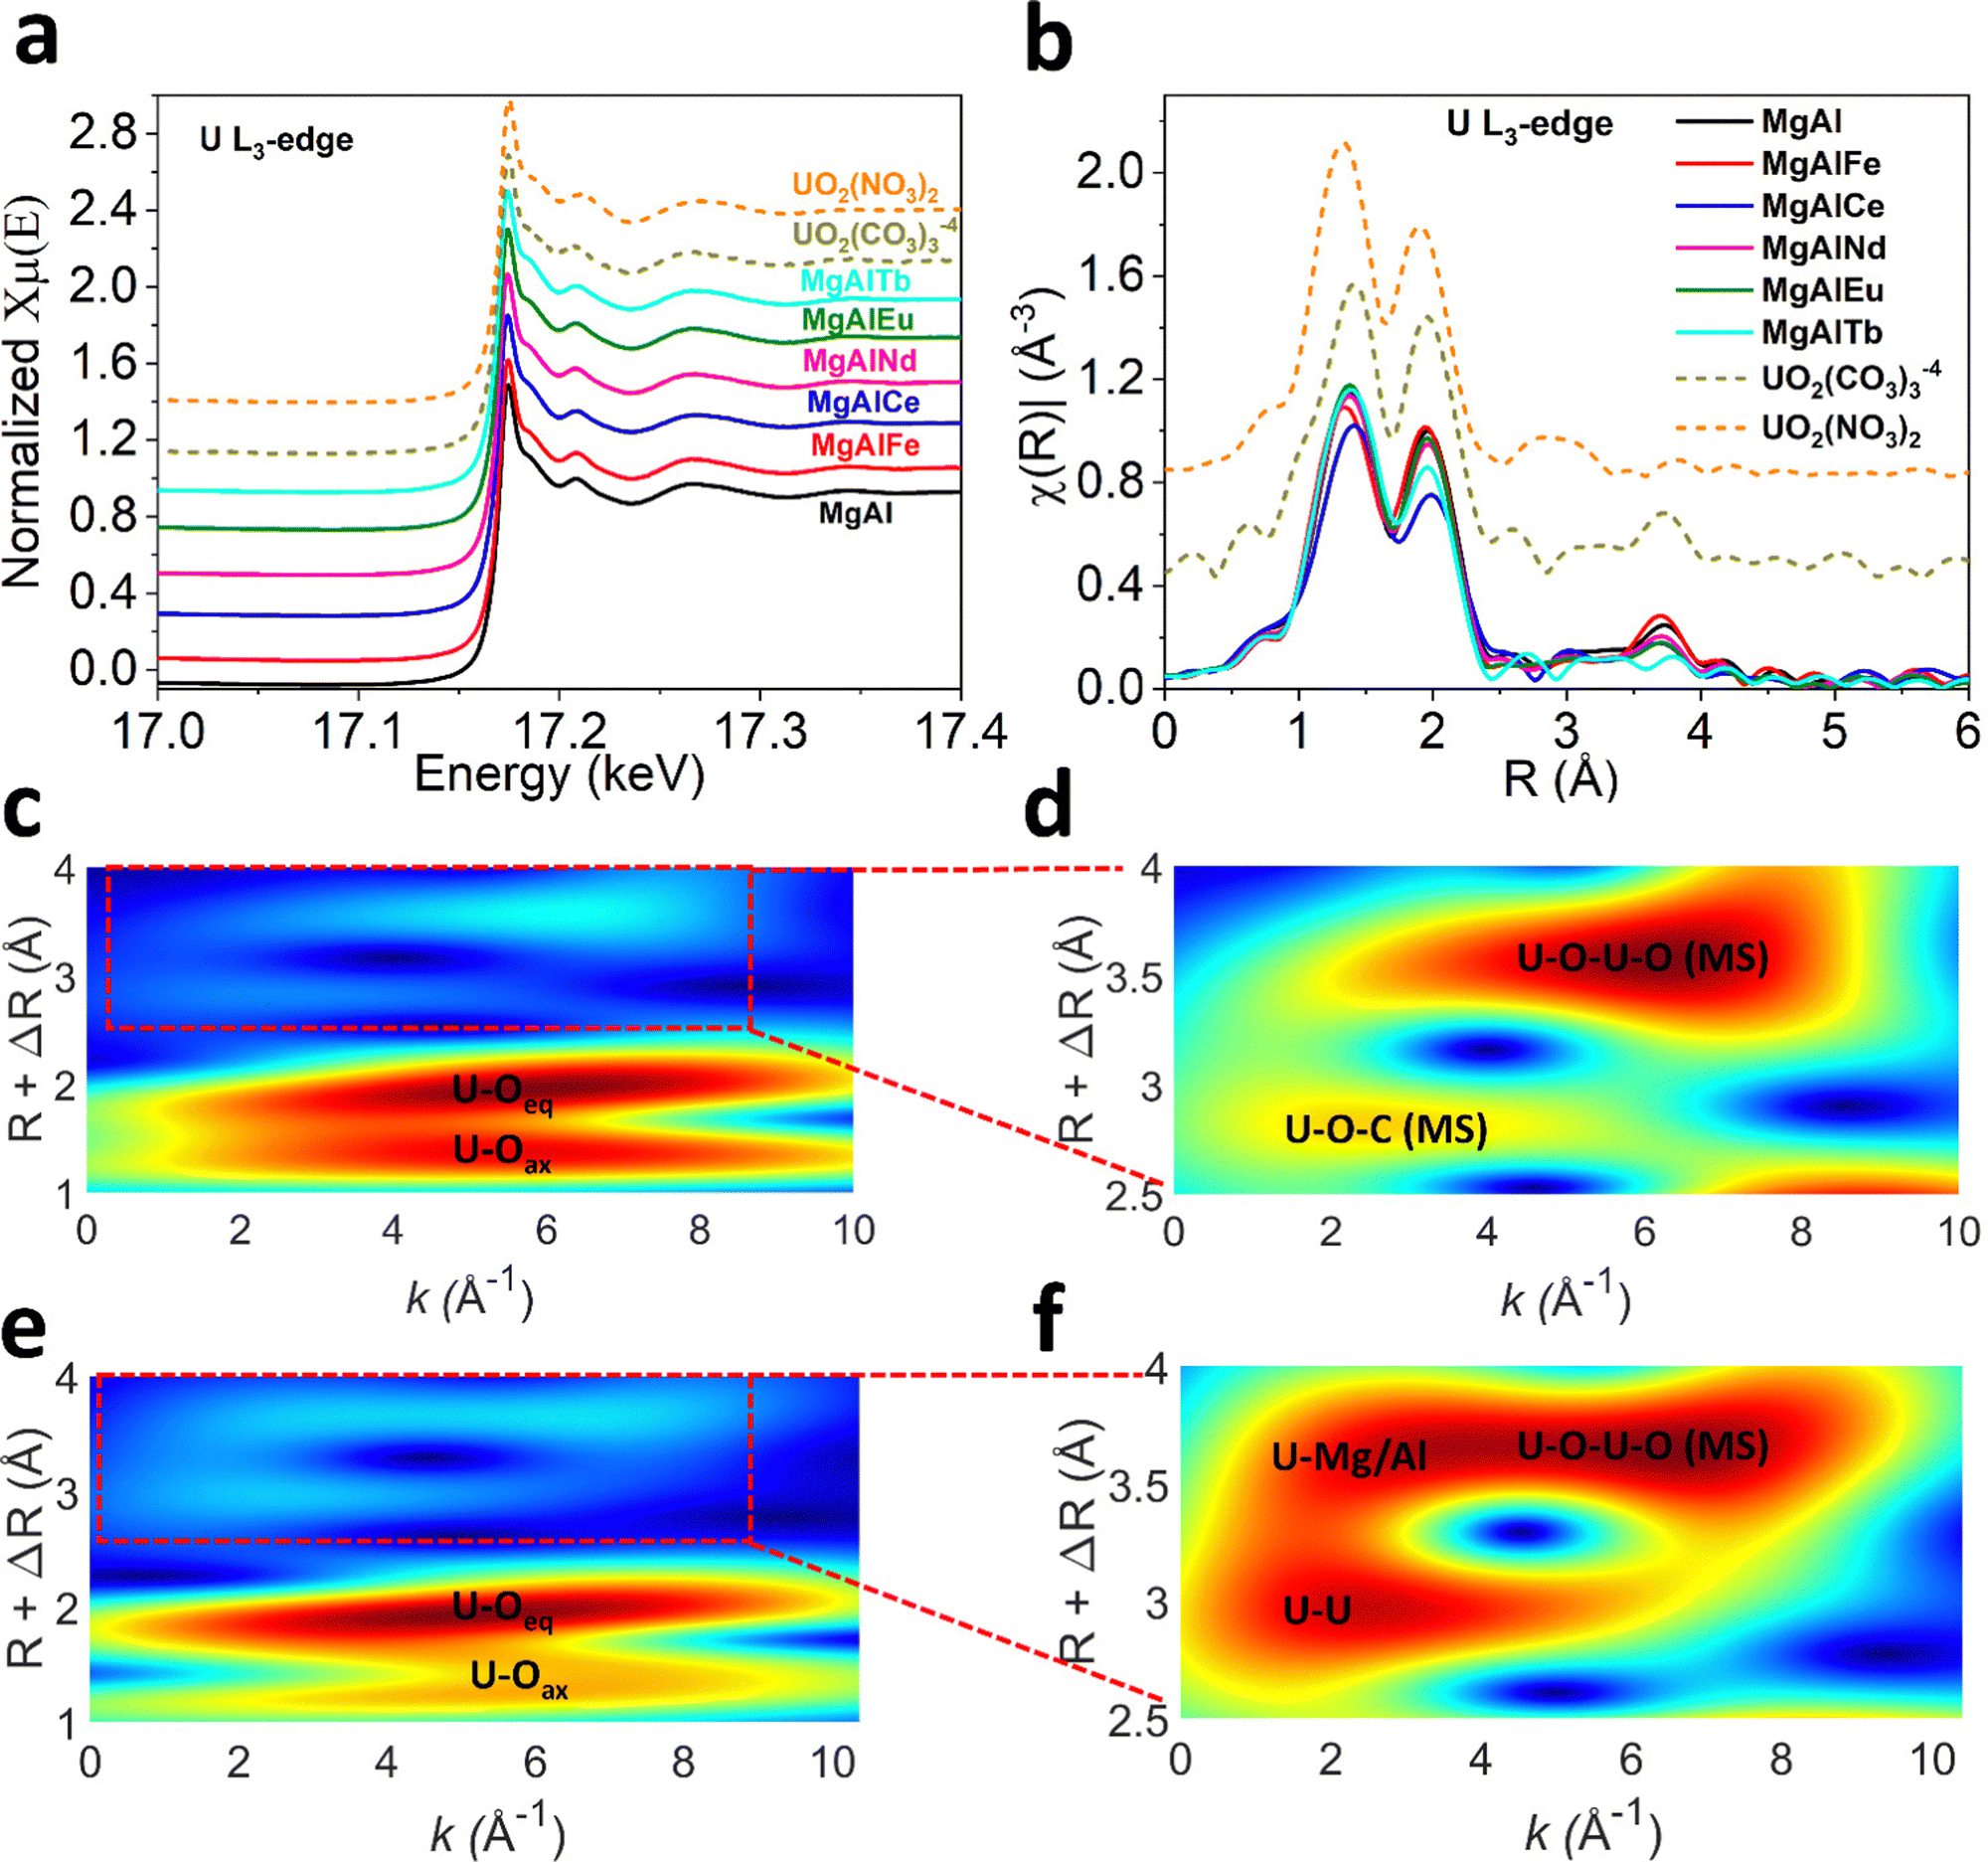 | ||
| Fig. 5 U L3-edge XAS (a) XANES spectra (b) Fourier transformed radial plot. (c) Full-range WT representation of the EXAFS signal for UO2CO3 standard (1–4 Å and k2 = 0–10) (d) Magnified high-R WT region for UO2CO3 standard (2.5–4 Å and k2 = 0–10) (e) full-range WT for MgAl (1–4 Å and k2 = 0–10) (f) Magnified high-R WT region for MgAl (2.5–4 Å and k2 = 0–10). | ||
Furthermore, XAS measurements were performed at the Mg, Al, O and N K-edges for U adsorbed MgAl and MgAlNd (Fig. 6) and all other doped LDHs (SI). The N K-edge NEXAFS shows suppression of all spectral intensities of nitrate anion after adsorption, which strongly suggests that interlayer nitrate anions were displaced (Fig. 6a and Fig. S18, ESI†). A plausible explanation for displacement of nitrate anion would be ligand exchange with UO2(CO3)34−, CO32− and OH− anions present in the carbonate solution. The ligand exchange with interlayer anions is important to support surface complexation during U sorption.23 Consistent with previous studies,29,58,72,73 uranium adsorption proceeds via both surface complexation and ion-exchange with interlayer nitrate anions. The lanthanide series dopants tune surface energy of MgAl LDH by influencing Mg/Al–OH bond covalency which results in higher selectivity of U adsorption especially in Nd doped MgAl LDH.
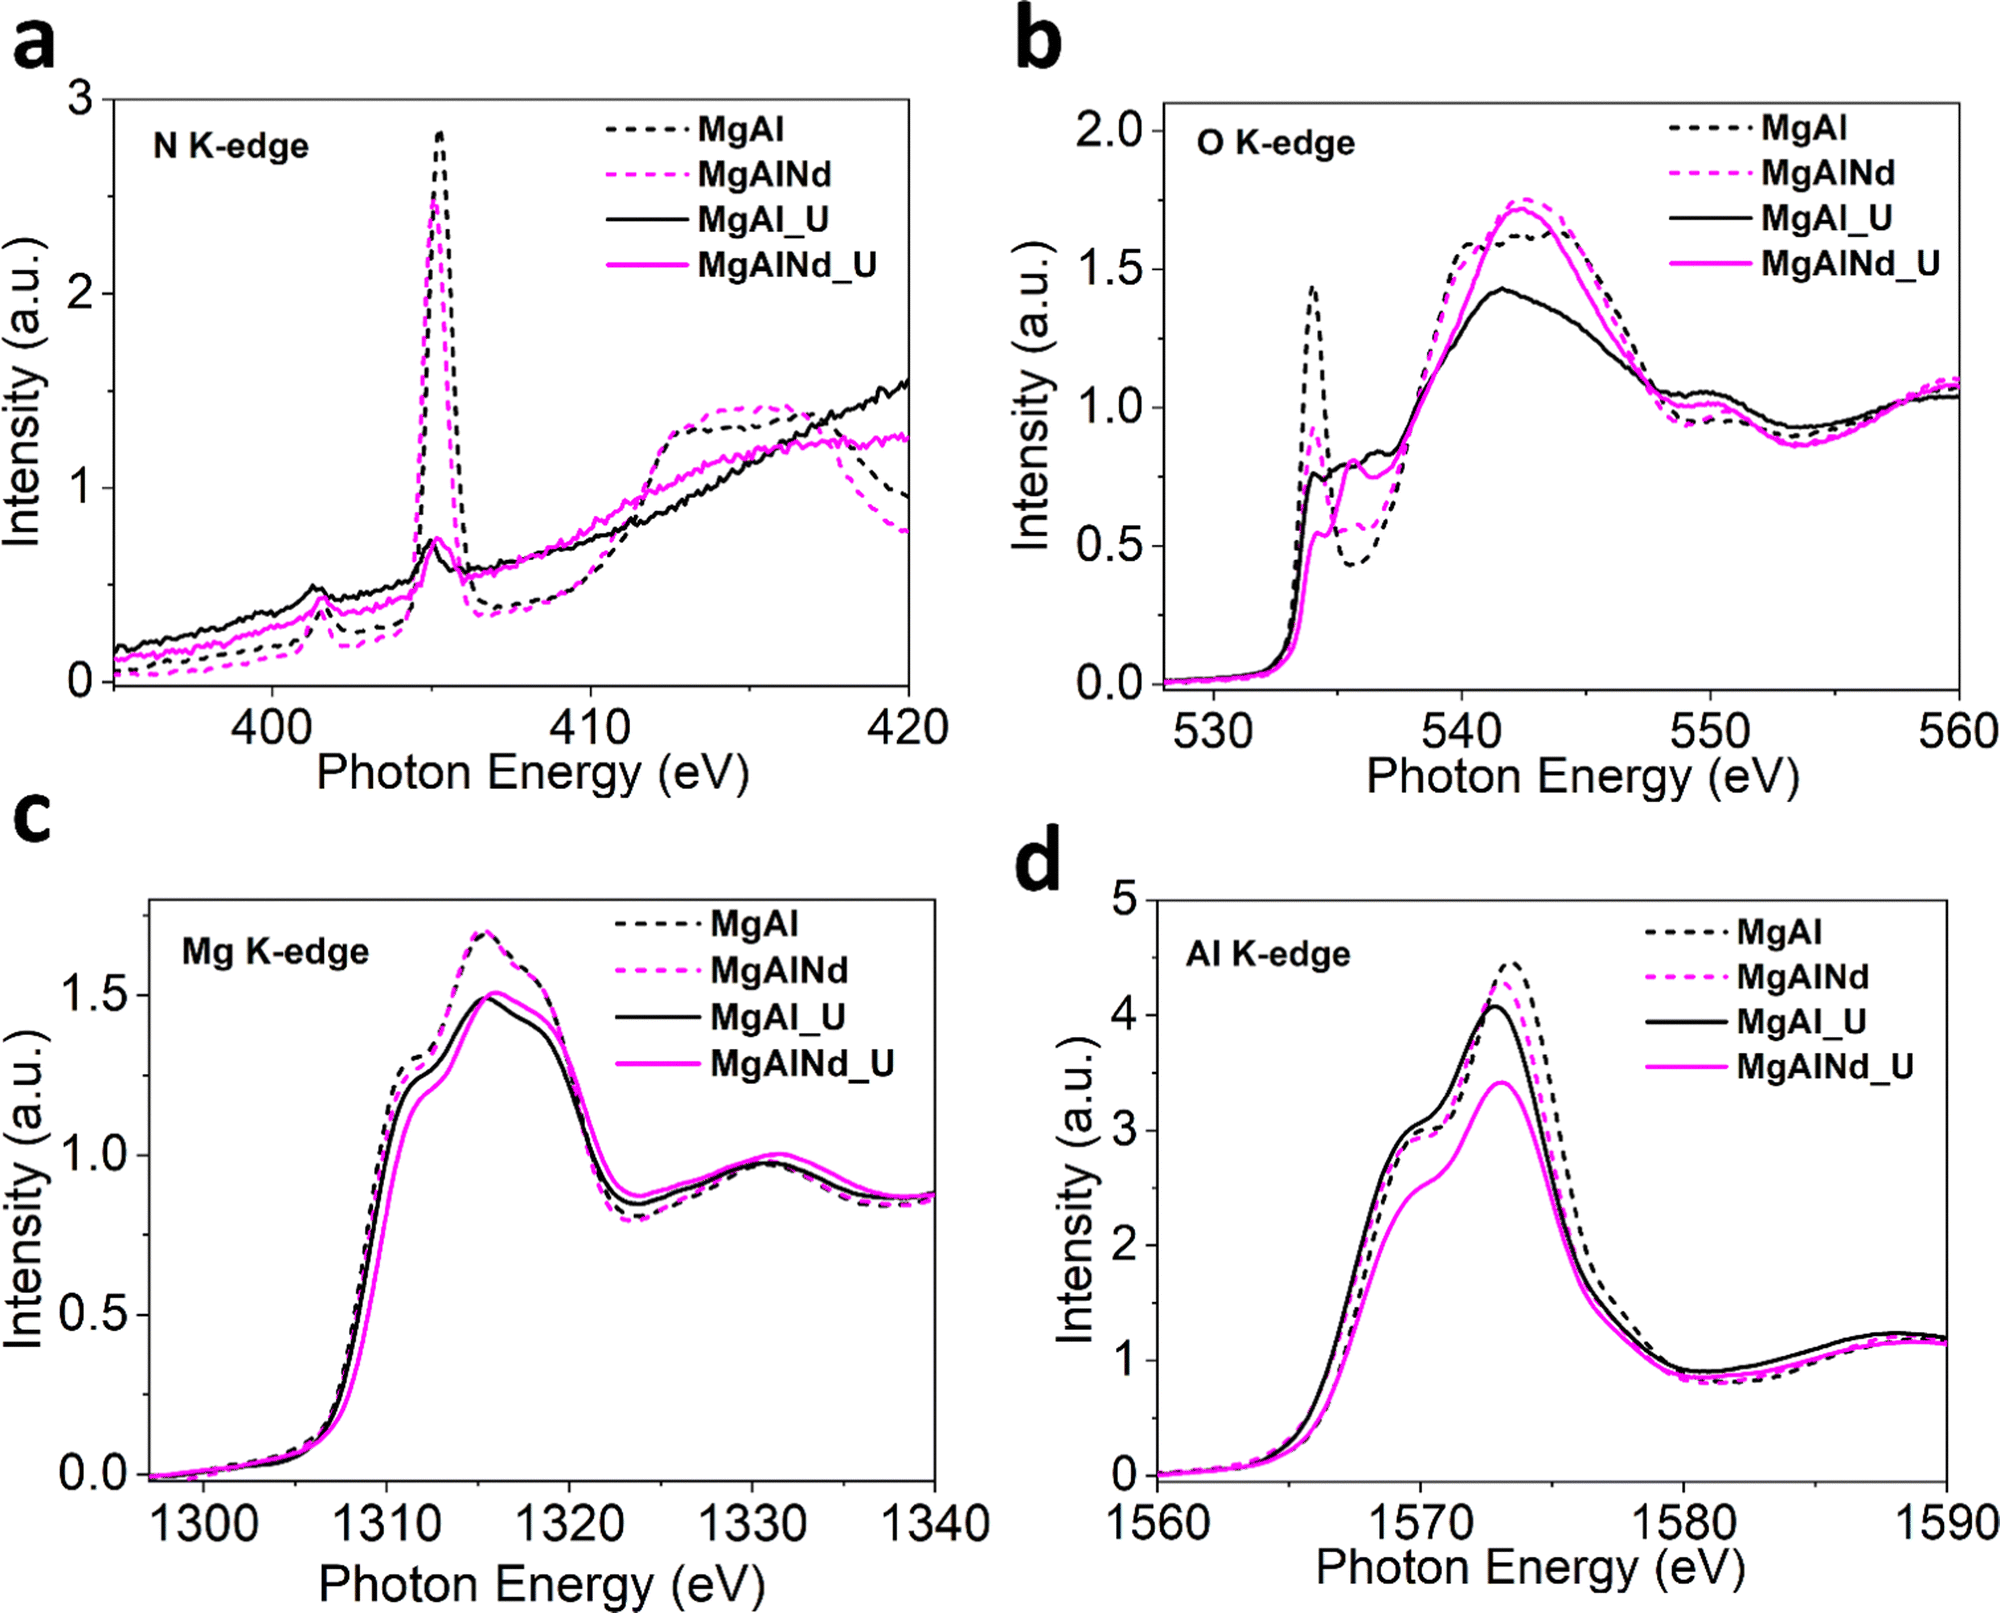 | ||
| Fig. 6 Normalized NEXAFS for (a) O K-edge (b) N K-edge (c) Mg K-edge and (d) Al K-edge (dashed lines = before adsorption, solid lines = after adsorption). | ||
The O K-edge spectra for Nd doped and undoped samples is shown in Fig. 6b and other doped LDHs in Fig. S18 (ESI†). The intensity of first peak at ∼534 eV drastically drops after adsorption, consistent in all samples, which indicates the increase in electronic density and filling of O 2p states mixed with Mg/Al 3s and 3p orbitals after U binding. This increase in occupied electronic states may be explained by the fact that uranyl species attached to the surface through deprotonation of Mg–OH and Al–OH. The new small peaks between 535–540 eV after adsorption is likely be related to the π* transitions in the carbonate and uranyl species.74
The Mg K-edge XANES spectra for MgAl and MgAlNd (Fig. 6c) show decreased white line intensity post U-adsorption. The reduced white line intensity was also observed in post-adsorption for MgAlFe, MgAlCe and MgAlTb, but not for MgAlEu which already exhibited a relatively low white line intensity (Fig. S18, ESI†). The decrease in white line intensity indicates increased electron density being donated onto the metal within the LDH, likely through M–O distortions due to surface complexation with uranyl carbonate species. In addition, there is a shift to higher edge energy in the Mg K edge data for MgAlNd vs. MgAl post U-adsorption, indicating greater distortion in the Nd doped sample. Minimal shifts for edge energy position in the Mg K edge were observed upon U adsorption for the other LDH samples (Fig. S18, ESI†). The higher octahedral distortion in MgAlNd upon U adsorption is indicative of altered Mg–O bonds symmetry due to the deprotonation Mg–OH and possible surface complex with U species. This is likely linked to the increased ionic character of M-O bonds in MgAlNd, resulting in greater distortion of the lattice upon surface complexation with uranyl carbonate.
The Al K-edge NEXAFS spectra in Fig. 6d notably show a positive shift in edge energy for MgAlNd while the edge position shifted to slightly lower energy for MgAl. Furthermore, the Al K-edge for other doped LDHs after adsorption (Fig. S18, ESI†) shifted to a slightly lower energy as well. This suggests a more distorted AlO6 octahedron in MgAlNd LDH post U adsorption. The distortion in octahedral symmetry is strongly related to the bonded oxygen and electronegativity of the central metal atom. The U adsorption under aqueous conditions is likely to dissociate less covalent M–O bonds to facilitate M–OH deprotonation thus making surface favourable for U sorption, leading to the distortions around the Al–O networks within the LDH. Note that the MgAlNd LDH is the only material tested that showcases a distortion of Mg and Al local structure upon U adsorption, further showcasing the more ionic character of M–OH caused by the inclusion of Nd, which influences M–O distortions beyond Nd–O–Mg localized clusters as evident by Al K-edge measurements. This is further reflected in the decrease in white line intensity as compared to the pristine MgAl LDH and remaining doped materials, where distortions/dislocations of M–O bonds are strongest with Nd doping.
The XAS data confirms that the mechanism of U binding to MgAl(X) LDH under seawater conditions is via surface complexation with Mg/Al–OH networks while NO3− in the interlayer gallery trigger ligand exchange with CO32− and OH−, modulated via metal doping into the MgAl structure. Further, since lanthanide doping of the LDH samples increased the ionic character of the M–O bonding while distorting local M–O octahedra, where Nd has the largest impact, the lanthanide doped LDH samples and especially MgAlNd favoured the U sorption through surface complexation with M–OH. Previous studies revealed that by optimizing excited state electronic distribution and manipulating electron–hole pair generation enhance the selectivity of U(VI) extraction.75,76 Nd, due to its favourable f-orbital electronic configuration, tunes electronic structure and surface energy of MgAl LDH to selectively bind U(IV) carbonate.
The SEM/EDS of MgAlNd post-adsorption of U (Fig. S19, ESI†) was also consistent with the surface complexation as indicated by EXAFS. The SEM images showed MgAlNd maintained a layered morphology. Specifically, EDS indicated a chemical composition of 10.8 mol% Mg, 3.0 mol% Al, 1.1 mol% Nd and 0.1 mol% U, consistent (within 0.7 mol%). The measured U content of the sample equates to 0.9 wt%, consistent with the U loading measured via ICP MS of solutions pre- and post-contact, namely 5 mg U g−1.
Moreover, our analysis showcases a means to prospectively tune U selectivity through dopant engineering, potentially enabling new materials with improved separation properties. The developed dopant engineered MgAl LDHs are not only suitable for seawater U extraction but also shows great potential to be used in U remediation from radioactive wastewater near nuclear power plants. The reusability and low cost of MgAl based LDH make it economically attractive for large scale deployment to extract U.
Conclusions
Doping of lanthanide elements into MgAl LDH structures improves their selectivity for removal of U from seawater to levels comparable to ‘state of the art’ amidoxime functionalised polymers, while also maintaining the advantages of inorganic sorbents such as low cost and ease of synthesis. In particular, Nd doped LDH (MgAlNd) demonstrated complete selectivity for U over 10 elements present in real seawater samples, including Na, Mg, Ca and K which are present at concentrations >400 times greater than U. Further, Nd doping enhanced selectivity over Al, Ca, Ti, Fe and Sr relative to the undoped structure. The capacity and kinetics of MgAlNd are also comparable to ‘state of the art’ adsorbents for U removal from seawater. XAS measurements reveal the mechanism of U removal under seawater conditions to be surface complexation through M–OH deprotonation and interlayer ion exchange, whereby nitrate anions in the interlayer space are displaced by anionic uranyl carbonate and hydroxyl species from solution. Inclusion of lanthanide dopants, especially Nd, into the MgAl LDH structure increased the ionic character of M–O bonding in the LDH. This in turn enhanced the selectivity for binding U via surface species. Hence, lanthanide doping is a simple and effective method to produce LDH adsorbents for selective and efficient removal of U from seawater.Author contributions
N. M. B and J. V. C conceptualised and designed the methodology. M. Z. prepared LDH materials, undertook nitrogen porosimetry. H. O. and J. V. C collected and analysed XRD, ICP-MS, FTIR and adsorption data. Y. Y and D. T. O undertook electron microscopy. L. T., B. S., J. H, J. W. and J. V. C undertook XAS (XANES, EXAFS, NEXAFS) experiments and contributed to analysis. M. Z. and N. M. B. analysed the XAS data and performed EXAFS modelling. M. Z., N. M. B. and J. V. C. wrote the manuscript, including data visualisation. All authors contributed to editing of the manuscript.Conflicts of interest
The authors declare no conflicts of interests.Acknowledgements
M. Z. acknowledges scholarship support from the Scientia PhD Scholarship from UNSW. Y. Y. acknowledges partial scholarship support from the Faculty of Engineering at UNSW, while B. S., acknowledges scholarship support through the Research Training Program from the Australian Department of Education and from the Australian Institute of Nuclear Science and Engineering (AINSE) Program. U L3-edge XAS experiments were performed at the XAS beamline, while Mg, Al, N, O K-edge XAS experiments were performed at the SXR beamline, (Australian Synchrotron, ANSTO) funded by the Australian Government. Fe K-edge and Ln L3-edge XAS measurements were performed at the 10-ID-B beamline of the Advanced Photon Source, a US DOE Office of Science User Facility operated for the DOE Office of Science by Argonne National Laboratory under contract DE-AC02-06CH11357. The 10-ID-B beamline is further supported by the Materials Research Collaborative Access Team and its member institutions. Tim Palmer is acknowledged for metallography support.References
- H. Nifenecker, Rep. Prog. Phys., 2011, 74, 022801 CrossRef.
- I. A. E. Agency, Energy, Electricity and Nuclear Power Estimates for the Period up to 2050, 2018, 1–139 Search PubMed.
- A. Monnet, S. Gabriel and J. Percebois, Resour. Policy, 2017, 53, 394–407 CrossRef.
- H. Lindner and E. Schneider, Energy Econ., 2015, 49, 9–22 CrossRef.
- C. W. Abney, R. T. Mayes, T. Saito and S. Dai, Chem. Rev., 2017, 117, 13935–14013 CrossRef CAS PubMed.
- K. L. Nash and G. J. Lumetta, Advanced Separation Techniques for Nuclear Fuel Reprocessing and Radioactive Waste Treatment, 2011, 492 Search PubMed.
- M. Hao, Y. Liu, W. Wu, S. Wang, X. Yang, Z. Chen, Z. Tang, Q. Huang, S. Wang, H. Yang and X. Wang, EnergyChem, 2023, 100101 CrossRef.
- G. A. Gill, L. J. Kuo, C. J. Janke, J. Park, R. T. Jeters, G. T. Bonheyo, H. Bin Pan, C. Wai, T. Khangaonkar, L. Bianucci, J. R. Wood, M. G. Warner, S. Peterson, D. G. Abrecht, R. T. Mayes, C. Tsouris, Y. Oyola, J. E. Strivens, N. J. Schlafer, R. S. Addleman, W. Chouyyok, S. Das, J. Kim, K. Buesseler, C. Breier and E. D’Alessandro, Ind. Eng. Chem. Res., 2016, 55, 4264–4277 CrossRef CAS.
- R. V. Davies, J. Kennedy, R. W. McIlroy, R. Spence and K. M. Hill, Nature, 1964, 203, 1110–1115 CrossRef.
- N. Tang, J. Liang, C. Niu, H. Wang, Y. Luo, W. Xing, S. Ye, C. Liang, H. Guo, J. Guo, Y. Zhang and G. Zeng, J. Mater. Chem. A, 2020, 8, 7588–7625 RSC.
- F. Wang, H. Li, Q. Liu, Z. Li, R. Li, H. Zhang, L. Liu, G. A. Emelchenko and J. Wang, Sci. Rep., 2016, 6, 1–8 CrossRef CAS PubMed.
- Y. Wu, Y. Xie, X. Liu, Y. Li, J. Wang, Z. Chen, H. Yang, B. Hu, C. Shen, Z. Tang, Q. Huang and X. Wang, Coord. Chem. Rev., 2023, 483, 215097 CrossRef CAS.
- M. Kanno, J. Nucl. Sci. Technol., 1984, 21, 1–9 CrossRef CAS.
- L. Chen, Z. Bai, L. Zhu, L. Zhang, Y. Cai, Y. Li, W. Liu, Y. Wang, L. Chen, J. Diwu, J. Wang, Z. Chai and S. Wang, ACS Appl. Mater. Interfaces, 2017, 9, 32446–32451 CrossRef CAS PubMed.
- Q. Sun, B. Aguila, J. Perman, A. S. Ivanov, V. S. Bryantsev, L. D. Earl, C. W. Abney, L. Wojtas and S. Ma, Nat. Commun., 2018, 9, 1–9 CrossRef PubMed.
- H. Yang, Y. Liu, Z. Chen, G. I. N. Waterhouse, S. Ma and X. Wang, Sci. China: Chem., 2022, 65, 2335–2337 CrossRef CAS.
- C. Gunathilake, J. Górka, S. Dai and M. Jaroniec, J. Mater. Chem. A, 2015, 3, 11650–11659 RSC.
- S. Das, Y. Oyola, R. T. Mayes, C. J. Janke, L. J. Kuo, G. Gill, J. R. Wood and S. Dai, Ind. Eng. Chem. Res., 2016, 55, 4103–4109 CrossRef CAS.
- H. Asiabi, Y. Yamini and M. Shamsayei, Chem. Eng. J., 2018, 337, 609–615 CrossRef CAS.
- P. Gu, S. Zhang, X. Li, X. Wang, T. Wen, R. Jehan, A. Alsaedi, T. Hayat and X. Wang, Environ. Pollut., 2018, 240, 493–505 CrossRef CAS PubMed.
- L. Ma, Q. Wang, S. M. Islam, Y. Liu, S. Ma and M. G. Kanatzidis, J. Am. Chem. Soc., 2016, 138, 2858–2866 CrossRef CAS.
- G. Mishra, B. Dash and S. Pandey, Appl. Clay Sci., 2018, 153, 172–186 CrossRef CAS.
- S. Song, L. Yin, X. Wang, L. Liu, S. Huang, R. Zhang, T. Wen, S. Yu, D. Fu, T. Hayat and X. Wang, Chem. Eng. J., 2018, 338, 579–590 CrossRef CAS.
- M. J. Young, T. Kiryutina, N. M. Bedford, T. J. Woehl and C. U. Segre, Sci. Rep., 2019, 9, 1–12 CrossRef PubMed.
- M. Zubair, P. Kumar, M. Klingenhof, B. Subhash, J. A. Yuwono, S. Cheong, Y. Yao, L. Thomsen, P. Strasser, R. D. Tilley and N. M. Bedford, ACS Catal., 2023, 13, 4799–4810 CrossRef CAS.
- S. Ma, L. Huang, L. Ma, Y. Shim, S. M. Islam, P. Wang, L. D. Zhao, S. Wang, G. Sun, X. Yang and M. G. Kanatzidis, J. Am. Chem. Soc., 2015, 137, 3670–3677 CrossRef CAS PubMed.
- Y. Zou, X. Wang, F. Wu, S. Yu, Y. Hu, W. Song, Y. Liu, H. Wang, T. Hayat and X. Wang, ACS Sustainable Chem. Eng., 2017, 5, 1173–1185 CrossRef CAS.
- P. Li, P. Chen, Z. Liu, S. Nie, X. Wang, G. Wang, W. Zhang, H. Chen and L. Wang, Ann. Nucl. Energy, 2020, 140, 107140 CrossRef CAS.
- R. Li, R. Che, Q. Liu, S. Su, Z. Li, H. Zhang, J. Liu, L. Liu and J. Wang, J. Hazard. Mater., 2017, 338, 167–176 CrossRef CAS PubMed.
- C. Zhong, S. Su, L. Xu, Q. Liu, H. Zhang, P. Yang, M. Zhang, X. Bai and J. Wang, Colloids Surf., A, 2019, 562, 329–335 CrossRef CAS.
- M. Chen, S. Li, L. Li, L. Jiang, Z. Ahmed, Z. Dang and P. Wu, J. Hazard. Mater., 2021, 401, 123447 CrossRef CAS PubMed.
- J. Tu, X. Peng, S. Wang, C. Tian, H. Deng, Z. Dang, G. Lu, Z. Shi and Z. Lin, Sci. Total Environ., 2019, 677, 556–563 CrossRef CAS PubMed.
- Y. Zou, Y. Liu, X. Wang, G. Sheng, S. Wang, Y. Ai, Y. Ji, Y. Liu, T. Hayat and X. Wang, ACS Sustainable Chem. Eng., 2017, 5, 3583–3595 CrossRef CAS.
- C. F. Baes and R. S. Mesmer, The Hydrolysis of Cations, John Wiley & Sons, Ltd, 1st edn, 1976, vol. 81 Search PubMed.
- B. C. C. Cowie, A. Tadich and L. Thomsen, AIP Conf. Proc., 2010, 1234, 307 CrossRef.
- E. Gann, C. R. McNeill, A. Tadich, B. C. C. Cowie and L. Thomsen, J. Synchrotron Radiat., 2016, 23, 374–380 CrossRef CAS PubMed.
- B. Ravel and M. Newville, J. Synchrotron Radiat., 2005, 12, 537–541 CrossRef CAS PubMed.
- H. Mayer and K. Mereiter, TMPM, Tschermaks Mineral. Petrogr. Mitt., 1986, 35, 133–146 CrossRef CAS.
- W. H. Zachariasen, Acta Crystallogr., 1954, 7, 788–791 CrossRef CAS.
- L. M. Moreau, A. Herve, M. D. Straub, D. R. Russo, R. J. Abergel, S. Alayoglu, J. Arnold, A. Braun, G. J. P. Deblonde, Y. Liu, T. D. Lohrey, D. T. Olive, Y. Qiao, J. A. Rees, D. K. Shuh, S. J. Teat, C. H. Booth and S. G. Minasian, Chem. Sci., 2020, 11, 4648–4668 RSC.
- S. Ishihara, P. Sahoo, K. Deguchi, S. Ohki, M. Tansho, T. Shimizu, J. Labuta, J. P. Hill, K. Ariga, K. Watanabe, Y. Yamauchi, S. Suehara and N. Iyi, J. Am. Chem. Soc., 2013, 135, 18040–18043 CrossRef CAS PubMed.
- P. Gonzalez Rodriguez, M. De Ruiter, T. Wijnands and J. E. Ten Elshof, Sci. Rep., 2017, 7, 1–9 CrossRef CAS PubMed.
- N. N. Greenwood and A. Earnshaw, Chemistry of the Elements, Reed Educational and Professional Publishing Ltd, Oxford, 2nd edn, 1997 Search PubMed.
- R. Benhiti, A. Ait Ichou, A. Zaghloul, R. Aziam, G. Carja, M. Zerbet, F. Sinan and M. Chiban, Environ. Sci. Pollut. Res. Int., 2020, 27, 45767–45774 CrossRef CAS.
- D. Li, M. Peng and T. Murata, Can. Mineral., 1999, 37, 199–206 CAS.
- T. Yoshida, T. Tanaka, H. Yoshida, T. Funabiki, S. Yoshida and T. Murata, J. Phys. Chem., 1995, 99, 10890–10896 CrossRef CAS.
- N. Trcera, D. Cabaret, S. Rossano, F. Farges, A. M. Flank and P. Lagarde, Phys. Chem. Miner., 2009, 36, 241–257 CrossRef CAS.
- J. A. van Bokhoven, J. C. A. A. Roelofs, K. P. de Jong and D. C. Koningsberger, Chem. – Eur. J., 2001, 7, 1258–1265 CrossRef CAS PubMed.
- K. I. Pandya, R. W. Hoffman, J. McBreen and W. E. O’Grady, J. Electrochem. Soc., 1990, 137, 383 CrossRef CAS.
- S. Köstlmeier and C. Elsässer, Phys. Rev. B: Condens. Matter Mater. Phys., 1999, 60, 14025 CrossRef.
- D. Drevon, M. Görlin, P. Chernev, L. Xi, H. Dau and K. M. Lange, Sci. Rep., 2019, 9, 1–11 CrossRef CAS PubMed.
- F. M. F. De Groot, M. Grioni, J. C. Fuggle, J. Ghijsen, G. A. Sawatzky and H. Petersen, Phys. Rev. B: Condens. Matter Mater. Phys., 1989, 40, 5715 CrossRef CAS PubMed.
- W. S. Yoon, M. Balasubramanian, K. Y. Chung, X. Q. Yang, J. McBreen, C. P. Grey and D. A. Fischer, J. Am. Chem. Soc., 2005, 127, 17479–17487 CrossRef CAS PubMed.
- G. Marcotte, P. Ayotte, A. Bendounan, F. Sirotti, C. Laffon and P. Parent, J. Phys. Chem. Lett., 2013, 4, 2643–2648 CrossRef CAS.
- T. Hibino, Eur. J. Inorg. Chem., 2018, 722–730 CrossRef CAS.
- A. M. Borst, A. A. Finch, H. Friis, N. J. Horsburgh, P. N. Gamaletsos, J. Goettlicher, R. Steininger and K. Geraki, Mineral. Mag., 2020, 84, 19–34 CrossRef CAS.
- H. Wang, H. Yao, L. Chen, Z. Yu, L. Yang, C. Li, K. Shi, C. Li and S. Ma, Sci. Total Environ., 2021, 759, 143483 CrossRef CAS PubMed.
- J. Zhu, Q. Liu, J. Liu, R. Chen, H. Zhang, R. Li and J. Wang, Environ. Sci.: Nano, 2018, 5, 467–475 RSC.
- Y. Yuan, Q. Yu, J. Wen, C. Li, Z. Guo, X. Wang, N. Wang, D. Yuan, Q. Yu, C. Li, N. Wang, D. Wen, X. Wang and Z. Guo, Angew. Chem., Int. Ed., 2019, 58, 11785–11790 CrossRef CAS PubMed.
- Y. Yuan, T. Liu, J. Xiao, Q. Yu, L. Feng, B. Niu, S. Feng, J. Zhang and N. Wang, Nat. Commun., 2020, 11, 1–8 CrossRef PubMed.
- F. Endrizzi, C. J. Leggett and L. Rao, Ind. Eng. Chem. Res., 2016, 55, 4249–4256 CrossRef CAS.
- E. L. Mühr-Ebert, F. Wagner and C. Walther, Appl. Geochem., 2019, 100, 213–222 CrossRef.
- A. L. Johnston, E. Lester, O. Williams and R. L. Gomes, J. Environ. Chem. Eng., 2021, 9, 105197 CrossRef CAS.
- X. Yuan, C. Yin, Y. Zhang, Z. Chen, Y. Xu and J. Wang, Sci. Rep., 2019, 9, 1–13 CrossRef CAS PubMed.
- S. Brown, Y. Yue, L. J. Kuo, N. Mehio, M. Li, G. Gill, C. Tsouris, R. T. Mayes, T. Saito and S. Dai, Ind. Eng. Chem. Res., 2016, 55, 4139–4148 CrossRef CAS.
- Y. S. Ho and G. McKay, Adsorpt. Sci. Technol., 2002, 20, 797–815 CrossRef CAS.
- A. P. Ladshaw, S. Das, W. P. Liao, S. Yiacoumi, C. J. Janke, R. T. Mayes, S. Dai and C. Tsouris, Ind. Eng. Chem. Res., 2015, 55, 4241–4248 CrossRef.
- G. Leinders, R. Bes, K. O. Kvashnina and M. Verwerft, Inorg. Chem., 2020, 59, 4576–4587 CrossRef CAS PubMed.
- K. O. Kvashnina, Y. O. Kvashnin and S. M. Butorin, J. Electron. Spectrosc. Relat. Phenom., 2014, 194, 27–36 CrossRef CAS.
- C. Den Auwer, E. Simoni, S. Conradson and C. Madic, Eur. J. Inorg. Chem., 2003, 3843–3859 CrossRef CAS.
- A. S. Yorkshire, M. C. Stennett, B. Walkley, S. E. O’Sullivan, L. M. Mottram, D. J. Bailey, J. L. Provis, N. C. Hyatt and C. L. Corkhill, J. Synchrotron Radiat., 2022, 29, 89–102 CrossRef CAS PubMed.
- Y. Ouyang, Y. Xu, L. Zhao, M. Deng, P. Yang, G. Peng and G. Ke, Sci. Rep., 2021, 11, 1–15 CrossRef PubMed.
- P. Lyu, G. Wang, B. Wang, Q. Yin, Y. Li and N. Deng, Appl. Clay Sci., 2021, 209, 106146 CrossRef.
- J. D. Ward, M. Bowden, C. T. Resch, S. Smith, B. K. Mcnamara, E. C. Buck, G. C. Eiden and A. M. Duffin, Geostand. Geoanal. Res., 2016, 40, 135–148 CrossRef CAS.
- M. Hao, Y. Xie, X. Liu, Z. Chen, H. Yang, G. I. N. Waterhouse, S. Ma and X. Wang, JACS Au, 2023, 3, 239–251 CrossRef CAS PubMed.
- Z. Chen, J. Wang, M. Hao, Y. Xie, X. Liu, H. Yang, G. I. N. Waterhouse, X. Wang and S. Ma, Nat. Commun., 2023, 14, 1–12 Search PubMed.
Footnote |
| † Electronic supplementary information (ESI) available. See DOI: https://doi.org/10.1039/d3ya00154g |
| This journal is © The Royal Society of Chemistry 2023 |