 Open Access Article
Creative Commons Attribution 3.0 Unported Licence
Effect of Ti1−xFexO2 photoanodes on the performance of dye-sensitized solar cells utilizing natural betalain pigments extracted from Beta vulgaris (BV)
Abhishek
Srivastava
 a,
Jena Akash Kumar
Satrughna
 b,
Manish Kumar
Tiwari
 a,
Archana
Kanwade
 a,
Subhash Chand
Yadav
 a,
Kiran
Bala
c and
Parasharam M.
Shirage
*a
aDepartment of Metallurgy Engineering and Materials Science, Indian Institute of Technology, Indore, 453552, India. E-mail: pmshirage@iiti.ac.in; paras.shirage@gmail.com
bDepartment of Physics, Indian Institute of Technology, Indore, 453552, India
cDepartment of Biosciences & Biomedical Engineering, Indian Institute of Technology, Indore, 453552, India
First published on 2nd December 2022
Abstract
In order to enhance the performance and stability of the naturally occurring dye-based DSSCs, various engineered photoanodes were employed. In this study, Fe-doped TiO2 nanorod (NR) based photoanodes were synthesized on transparent conducting fluorine doped tin oxide (FTO) electrodes with the different concentrations of Fe (Ti1−xFexO2, x = 0–0.1) by a simple and economical hydrothermal method. The impact of Fe doping on the physicochemical and electrical characteristics of Ti1−xFexO2 photoanodes was investigated. The effect of Ti1−xFexO2 photoanodes in a dye-sensitized solar cell (DSSC) setup utilizing a natural dye extracted from Beta vulgaris (BV) was analyzed. The photovoltaic performance of the fabricated device using Ti1−xFexO2 NRs is tested by current density–voltage (J–V) and incident photon-to-electron conversion efficiency (IPCE) characteristics to estimate the power conversion efficiency (PCE). The maximum photocurrent density of the DSSC device increased from 80 to 129.758 μA cm−2, whereas the PCE enhanced nearly twice from 0.26% to 0.52% with the insertion of 5 at% Fe in TiO2 NRs. The experimental result demonstrates that the charge injection and separation are significantly improved by the Ti1−xFexO2 interlayer. We predict that Ti1−xFexO2 photoanodes with improved responsiveness can replace the pure TiO2 nanostructures for promising photovoltaic applications. In addition to photovoltaics, these Ti1−xFexO2 photoanodes may serve as an encouraging approach for photocatalysis and photo sensors.
1. Introduction
In 1991, the first DSSC was developed by O’Regan and Gratzel at UC Berkeley and since then intensive investigations have been made to improve the device's performance.1 It also grabs the attention of researchers because of its low production cost and very low environmental and health impact. Production of DSSCs is very fast, easy, and economical as compared to other emerging and conventional photovoltaics, while its performance crossed over 14%.2 Moreover, DSSCs based on natural dyes such as extracts of leaves, flowers, and fruit peels, are also attracting researchers’ attention. However, the performance of such DSSCs is directly influenced by the charge collection efficiency, photo-scattering ability, and recombination rates.3,4 Apart from this, the effective operation of natural dye-based DSSCs is still under investigation and is lower than that of conventional photovoltaic technology such as silicon solar cells, which hinders their wide applications. To achieve better and high PCE, the design of photoanodes having optimum dye loading, better sunlight scattering, effective transportation of charge carriers, and reduced charge carrier recombination is the most crucial thing to look into.5 In general, metal oxides are preferred for the photoanodes and mesoporous nanostructures of TiO2, ZnO, SnO2, Nb2O5, etc., are widely investigated.6–8 In all metal oxide-based photoanodes, TiO2 gained the most popularity because of its high surface area, higher chemical stability, less toxicity, significantly high catalyst band edge, very low charge recombination, etc.9 The efficiency of the DSSC depends heavily on the transport and charge separation processes that take place inside the photoanode and, correspondingly, at the photoanode/electrolyte interface, which is substantially morphology and structure-dependent. In contrast, due to large surface site availability in the mesoporous structures, the recombination rate shoots up.10 To overcome this, 1D nanostructures such as nanowires,11 nanorods,12 and nanotubes13 have been explored for photoanodes, which effectively shortened the charge transport path. Previous studies suggested that transition metal doping alters the electronic dimensions, provides structural stability, and tunes the light absorption.14–17In most of the previously reported works on the BV dye-based DSSCs, generally photoanode structures were examined to investigate the device performance and stability. Although many nanostructured photoanodes were investigated it was impossible to significantly enhance the DSSC performance due to the insufficient charge collection efficiency, low photo-scattering, and higher interfacial charge recombination. Therefore, in addition to the dimension of the nanostructures, doping is an interesting trend to tune the absorption edge in the visible spectrum for better photo-charge scattering and collection along with reduced recombination rates. Here this tuning of the absorption edge is driven by the transition of charge carriers in between the d electrons of the doped transition metal (Fe3+) and the TiO2 NRs.18 A new electron state is created within the TiO2 electronic structure due to Fe doping and this will help in reducing the charge recombination via capturing photo generated electrons in the valence band of TiO2.19,20 Fe(III) doping in TiO2 photoanodes is an attractive perspective since (i) Fe3+ doping will empower the TiO2 crystal structure and comfortably accommodate within the TiO2 lattice because of their nearly similar ionic radii,21 (ii) Fe3+ doped TiO2 will also assist the improved interfacial charge transportation mediated by shallow charge trapping sites originating deep inside and on the surface of the grown nanostructures as well,22,23 (iii) Fe3+ doping will also allow for photonic excitation with a low energy level because of new energy state formation in the TiO2 bandgap,24 and (iv) surface adsorption is also improved by Fe3+ doping, which gives rise to surface hydroxyl groups and OH− radicals, which is ascribed to the extra oxygen vacancies within the lattice and on the surface.25
In general, the VBs of TiO2 are composed of hybrid O(2p) and Ti(3d) orbitals, while CBs consist of Ti(3d) orbitals, and transition metal doping will significantly alter the electronic and optical properties. Metal ion dopants can change TiO2 electron transport characteristics, enhancing the separation of photo generated charge carriers and shifting the absorption edge of the material to the visible spectrum. Because the dopant energy level lies deep inside the CB of TiO2, more carriers were moving to the surface which can be acting as electron or hole entrapment centers. The absorption spectra of TiO2 shift to higher wavelength as a result of the transition metal doping, which alters the material's electrical energy levels and shrinks the energy band gap.26
Fig. 1(a) illustrates the typical charge transport reactions involved in Fe-doped TiO2 photoanodes for DSSC applications. In addition, Fe3+ ions in TiO2 can serve as electron and hole trapping centers to prevent electron–hole pair recombination and to increase the production of reactive oxygen species. This leads to the absorption redshift and therefore enhances photovoltaic activity. When the doping concentration is raised to 5 mM, the bandgap decreases for two important reasons. The first is the doping of TiO2 with Fe3+, which produces surface states and oxygen-vacancy sites. The second aspect is the crystallization of haematite Fe2O3, whose particles have a narrower energy band gap as compared to TiO2, and reducing the bandgap by forming a heterojunction between Fe2O3 and TiO2.27 This will further increase visible light absorption. According to the mechanistic theory, produced electrons following light absorption are confined in the Ti3+ state below the conduction band minimum, which makes it easier to separate the charges using the heterojunction. With the synthesis of Ti–O2− and its subsequent binding as peroxide, those trapped electrons are relocated to O2 species. During the chemical pathway, surface Fe3+ sites contribute to the stability of –OH through hydrogen bonding. Even at higher Fe concentrations, the crystal structure of Ti1−xFexO2 is not dramatically affected, but the local structure around the Fe atoms can be severely deformed, particularly when oxygen vacancies are present.28
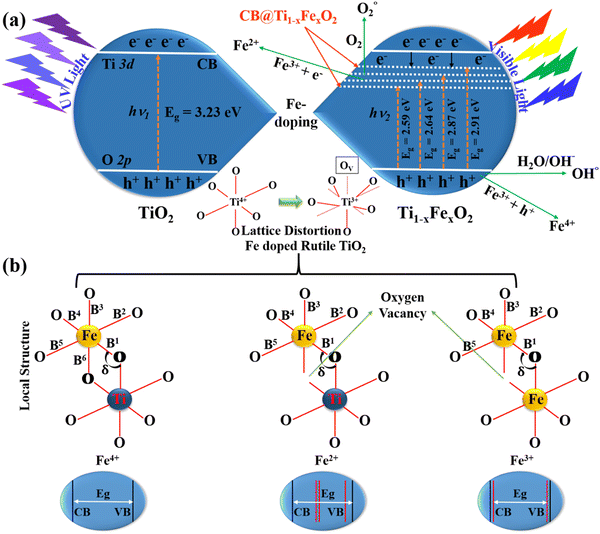 | ||
| Fig. 1 (a) The process of charge transport involving elevated electrons and VBs of the TiO2 nanorods with Fe3+ ions of Ti1−xFexO2 (x = 0–0.1), and (b) schematics of the local topologies of Fe-dopants in the different Fe4+, Fe2+, and Fe3+ doped TiO2 models respectively. B1–6 are the bond lengths of Fe–O bonds and δ is the bond angle between Fe–O–Ti and Fe–O–Fe. | ||
Fig. 1(b) represents three distinguished Fe dopant models to explain the Fe2+, 3+, and 4+ occupation in the rutile TiO2 lattice. It is found from the literature that the configuration of Fe3+ is the most stable energy structure in which two adjacent Ti-atoms are replaced by Fe and will create an O-vacancy in between. Due to this reason, Fe doping midgap states are introduced and the band gap is drastically reduced. In all the possible arrangements of the Fe dopants, the most stable structure prefers an antiferromagnetic ordering. Also, the haematite and rutile hybrid crystal for Fe–TiO2 formation is energetically not favoured for all modes explained here. Only, we can say that the production of the pure metal oxide spontaneously in an oxygen environment is very challenging. Although, it is difficult to predict whether these phases could be synthesized or not.29
Li et al. demonstrated the detailed atomistic investigation and concluded that for Fe4+ doping, the formation energy was 1.23 eV per Fe-atom, which further lowered with the increase in the Fe concentration. One O-atom acts as a bridge between two Fe dopants in the lowest energy form. With the lowest formation energy of approximately 3 eV per Fe, the integration of Fe2+ into the TiO2 matrix is even less stable. In this case, Fe prefers to be integrated into the TiO2 crystal lattice adjacent to the O vacancy. The most likely Ti substituent in the rutile phase is Fe3+, with a formation energy of roughly 1 eV per Fe-atom. Similar to Fe2+, the lowest-energy arrangement in this instance has two nearest neighbours which are Fe substituents that are situated close to the O-vacancy.30
The lattice angles are essentially unaltered in either situation. However, the neighbourhood architecture near the Fe dopants might change considerably. The most noticeable structural modification is the expansion of the Fe–O–Ti or Fe–O–Fe bond angle (δ), which is a frequent outcome when an O vacancy is present. B2 and B5 (apex) Ti–O bond lengths vary from B1, B3, B4, and B6 (basal). The Fe–O bond lengths B2 and B5 increase for Fe-interstitial doping, whereas the basal ones decrease. Due to the induced O-vacancy, the dopant atom only forms bonds with five O-atoms in the Fe2+ and Fe3+ models. It's crucial to remember that the O-vacancy tends to pop up near the Fe-octahedron basal. Only B2 and B5 of these five Fe–O bond lengths remain comparable to one another, with the other three turning inequivalent. These findings demonstrate that the O-vacancy distorts the TiO6 octahedra more significantly than the dopant atom alone.30
The first DSSC was fabricated by using a Pt counter electrode (CE), while the nanocrystals of TiO2 were used as the photo-anode, which showed a PCE of 7.9%. Rawling et al. fabricated a DSSC using ruthenium-based dyes (N719) and reported a significant PCE of ∼12%.31 Recently in 2019, Gratzel reported 12.3% PCE with a DSSC having cobalt(II/III)-based electrolyte, platinum (Pt) CE, and TiO2 photo-anode. However, the corrosive degradation of Pt by electrolytes having I−/I3− ions and very high prices hinder its applicability.32 Record 14.2% PCE is achieved with a novel thieno[3,2-b]indole-type organic dye having a suitable porphyrin sensitizer, where the used redox electrolyte is [Co(bpy)3]2+/3+.33 To add a modified layer over the FTO, different types of advanced coating techniques such as chemical vapor deposition,34 sputtering,35 spray pyrolysis36 and dip coating37 are preferred.
In this work, we preferred the easy and suitable spin-coating deposition method to make DSSCs cheaper and more efficient. An ideal dye for DSSCs will have a large light absorption range, a large number of oxygen functional groups, a large molar extinction coefficient, and high stability. Also, for effective photo-electron injection, the energy level of the dyes should meet the conduction band of the photoanode.38–41 However, disadvantages associated with inorganic dyes, such as low yield, hazardous nature, and long extraction process, hinder their applicability.42 To overcome this, natural dyes are generally preferred because of their cost-effectiveness, easy biodegradation, and wide availability. Natural dyes are generally extracted from the various parts of the plants, like fruits, flower petals, peels, leaves, etc.43 Continuous progress in the field of natural and metal complex dye-based DSSCs revealed a significant performance ∼ 0.1–10.3%.44–46 The most common pigments that are found in these dyes are (i) betalains, (ii) flavonoids, (iii) chlorophyll, and (iv) carotenoids. DSSCs support the development of photovoltaic components with high conversion efficiency and low costs in a system for converting pure and non-conventional solar radiation into electricity. When assessing the performance of DSSCs, the dyes role as a sensitizer is very crucial. Due to their low cost, high availability, and biodegradability, natural dyes (organic dyes) have become a worthwhile alternative to the typical and expensive inorganic sensitizers.
Herein, we used betalain pigments as a natural photosensitizer to perform the DSSC investigation. The group of red-violet (betacyanins) and yellow (betaxanthins) pigments known as betalains is found in the Caryophyllales plants. Red beetroot is one of the propitious sources of the betalain pigments, which belongs to the subfamily Betoideae of the family Amaranthaceae. Red beetroot altogether contains two major soluble pigments, betanin (red) and vulgaxanthine I (yellow). Depending on the cultivar, red beetroots betacyanin and betaxanthin contents vary between 0.04 and 0.21% and 0.02 and 0.14%, respectively. However, certain new varieties generate higher betalain amounts. Recently many researchers have investigated betalain pigments for DSSC applications and reported that the device performance is directly associated with the dye's adaptability. Betalain pigments typically absorb visible light ranging from 476 to 600 nm, with maximum absorption at 537 nm at pH 5.0. Since the red beetroot's betalain spectrum is primarily restricted to betanin, colour variation is minimal. Moreover, the chemical stability of betalain pigments is also a concern for highly efficient DSSCs. pH variation, higher oxygen level storage, light intensity, water activity, and high-temperature exposure will significantly degrade the betalain pigments. To avoid any degradation, we have immediately used the extracted dyes and kept them at 4 °C throughout the dye loading process. In addition, considering the non-toxicity, low cost, and ease of synthesis of TiO2 photoanodes, we aimed to develop a very economical, efficient, and stable DSSC utilizing BV dyes and Ti1−xFexO2 photoanodes. After carefully investigating the properties of hydrothermally grown novel Ti1−xFexO2 nanobrushes, this study aims to reveal the performance enhancement of the DSSC utilizing natural betalain pigments extracted from BV. Physicochemical characterization of the synthesized Ti1−xFexO2 photo-anodes has been done by XRD, XPS, FESEM, HRTEM, EIS, UV-Visible Spectroscopy, FT-IR analysis, and Raman analysis, and later the device characterization is done by J–V analysis. The results of this work assisted us in extending our investigation further for natural DSSCs and other photovoltaic technologies comprising such types of novel nanostructured photoanodes. We believe that this work potentially contributes to the available literature and has enormous capabilities to cater to small and generic energy needs such as in wearables and thermochromic applications.
2. Experimental details
2.1. Materials
The materials used are as follows: transparent and conducting fluorine doped tin oxide (FTO) (Sigma Aldrich), Ti(acac)2OiPr2 (75% in isopropanol, Sigma Aldrich), 1-butanol (≥99.4%, Sigma Aldrich), Ti(OBu)4 (≥97%, Sigma Aldrich), iron nitrate nano-hydrate (≥98%, Sigma Aldrich), DI water, Beta vulgaris dye, HCl (35% w/w), ethylene glycol (≥99%, Sigma Aldrich), ethanol (Sigma Aldrich), Ni-based CE, KI (≥99%, Sigma Aldrich), and I2 (≥99.8%, Sigma Aldrich). All chemical compounds were utilized as purchased without any additional purification.2.2. TiO2 compact layer (c-TiO2) synthesis
Initially, 0.1 and 0.2 M solutions of TiO2 were prepared separately for compact layer synthesis by using respective amounts of Ti(acac)2OiPr2 in a 1-butanol solvent. For dissolving the precursor and obtaining a homogeneous solution, the mixture was stirred for 30 minutes at 27 °C. After preparing the desired solution, 0.1 M solutions was spin-coated once on the FTO substrate of 1.5 × 1.5 cm2 batch size, followed by heating at 120 °C. Prior to spin coating, all the FTO substrates were cleaned in an ultra-sonicator using DI water, acetone, and ethanol for 15 minutes each, and then finally dried in air at 27 °C. Once the 0.1 M coating and heating for 30 minutes were completed, 0.2 M solution was spin-coated twice following the same process of 0.1 M coating. All the samples were annealed in an oven at ∼500 °C for 30 minutes after coating and c-TiO2 was formed, which was later used to grow Fe-doped TiO2 NRs.2.3. Photoanode preparation
Self-organized and vertically grown bare and Fe-doped TiO2 NRs were prepared directly on the FTO via a simple hydrothermal method. HCl (37%) and de-ionized water were mixed together in a 1![[thin space (1/6-em)]](https://www.rsc.org/images/entities/char_2009.gif) :
:![[thin space (1/6-em)]](https://www.rsc.org/images/entities/char_2009.gif) 1 volume ratio and stirred on a magnetic stirrer at 27 °C for nearly 5 minutes and then 0.8 ml of Ti(OBu)4 precursor was added. This solution was further stirred for 1 hour after mixing the different amounts of Fe3+ ions (Ti1−xFexO2, x = 0–0.1) and then the homogeneous solution was transferred into a 90 ml Teflon liner and packed in a stainless-steel autoclave. Vertically aligned Ti1−xFexO2 NRs were synthesized on the c-TiO2 layer coated FTO by direct immersion into the prepared solution and heat treated for 8 hours at 150 °C. After taking out the samples from the autoclave, they were washed with DI water and dried in air. Further to enhance the crystallinity and eliminate the residual organics, the samples were annealed at 450 °C for 30 minutes.
1 volume ratio and stirred on a magnetic stirrer at 27 °C for nearly 5 minutes and then 0.8 ml of Ti(OBu)4 precursor was added. This solution was further stirred for 1 hour after mixing the different amounts of Fe3+ ions (Ti1−xFexO2, x = 0–0.1) and then the homogeneous solution was transferred into a 90 ml Teflon liner and packed in a stainless-steel autoclave. Vertically aligned Ti1−xFexO2 NRs were synthesized on the c-TiO2 layer coated FTO by direct immersion into the prepared solution and heat treated for 8 hours at 150 °C. After taking out the samples from the autoclave, they were washed with DI water and dried in air. Further to enhance the crystallinity and eliminate the residual organics, the samples were annealed at 450 °C for 30 minutes.
2.4. Dye extraction
Peeled-out BVs were taken to extract the natural dye for DSSC testing. The core of the BV was washed separately with DI water and ethanol and sonicated for 5 minutes each. Then it was dried in air at room temperature and cut down into small pieces, which were crushed later and mixed with lab-grade extra pure ethanol. The mixture was centrifuged to separate out the solid parts that remain in the mixture and filtered. The extracted liquid dye is again heated to evaporate the solvent and to get the appropriate viscous liquid dye.2.5. Preparation of the electrolyte
A 5 mM solution of potassium iodide and iodine crystal was prepared in 5 ml of ethylene glycol solvent. The solution was suitably stirred for 1 hour at room temperature in a dark room and kept covered with aluminum foil to prevent direct exposure to solar radiation.2.6. DSSC fabrication
The fabricated bare and Fe-doped TiO2 photo-anodes and nickel (Ni) CE were sandwiched together to form a DSSC module. All the photo-anodes were dipped overnight in the extracted liquid from red BV for dye sensitization and little change in colour from milky white to reddish has been seen. Ni-foam is pressed with a hydraulic press, sonicated in DI water for 5 minutes, and then dried in air at room temperature. The DSSC is assembled with the dye-sensitized photo-anode and Ni-CE one above each other in such a way that only coated part of the substrates was covered with the CE so that there will be some space left for the outer circuit connection. In between the photo-anode and Ni-CE, two drops of the prepared electrolyte were dropped. This assembly of the photo-anode and CE was fixed by two binder clips to hold the device gently. Negative and positive terminals of the fabricated device are the dye-sensitized Ti1−xFexO2 (photoanode) and Ni-CEs, respectively, which are used to connect the outer circuit.2.7. Characterization
The structure and composition of the bare and Fe-doped TiO2 NRS were studied with an X-ray diffractometer (XRD, Empyrean, Malvern Panalytical X-ray diffractometer) with Cu Kα radiation (λ = 1.5404 Å). XRD studies were performed between 2θ = 20° and 70°. Absorption and band edge evaluation of the bare, Fe-doped TiO2, and extracted dye was performed using a UV-Visible spectrophotometer (Shimadzu, UV-2600). Field Emission Scanning Electron Microscopy (FESEM, JEOL, JSM-7610 F plus) was used to determine the surface morphology and size of grown nanorods. Transmission electron microscopy (TEM) images of synthesized Fe-doped TiO2 NRS were obtained using a JEOL JEM-F200 TEM operating at an accelerating voltage of 80 kV. X-ray photoelectron spectroscopy (XPS) of Ti1−xFexO2 (x = 0–0.1) NRs was performed using a Kratos AXIS spectrometer with an Al Kα source (hν = 1486.6 eV). FTIR spectra of the extracted red beetroot dye in the range of 4000–400 cm−1 were observed using a BRUKER TENSOR 27 spectrometer. Raman analysis was performed by using a H J Y micro-Raman spectrometer equipped with a He–Ne laser of 633 nm, and Raman spectra were recorded. Lastly, the photocurrent–voltage (I–V) characteristic curves were simulated using a solar simulator (#SS50AAA: PET Photo Emission Tech., INC) under standard 1 sun (AM 1.5G) illumination.3. Results and discussion
3.1. X-Ray diffraction (XRD)
Fig. 2 displays the XRD patterns of Ti1−xFexO2 (x = 0–0.1) NRs grown on the FTO substrate. XRD results of bare TiO2 NRs match with the JCPDS card no. 21-1276, designated as the tetragonal rutile phase. Diffraction peaks observed at 26.69°, 27.61°, 36.25°, 37.90°, 41.41°, 54.60°, and 61.66°are assigned to (110), (121), (101), (200), (111), (211), and (002) planes, respectively, in pure TiO2 NRs, showing crystalline nature.47 There is no extra diffraction peak for Fe, which suggests that Fe content is below the detection limit and has nearly equal ionic radii. The Fe3+ ions are well substituted in the TiO2 crystal lattice and interstitials or Ti4+ lattice sites. This indicates that Fe3+ ions were strongly integrated homogeneously in the NR matrix and no Fe-oxide is present on the top of the surface, also discussed in the literature.48,49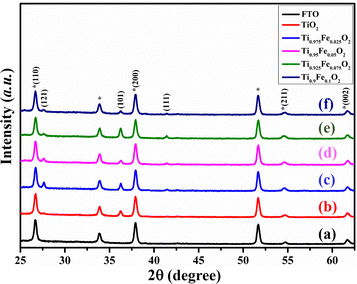 | ||
| Fig. 2 XRD patterns of the (a) FTO, (b) bare TiO2, (c) Ti0.975Fe0.025O2, (d) Ti0.95Fe0.05O2, (e) Ti0.925Fe0.075O2, and (f) Ti0.9Fe0.1O2 TiO2 NRs, respectively. * represents FTO peaks. | ||
The (100) and (200) plane domination over other planes indicates the preferential growth of NRs along the other direction perpendicular to the substrate. The lattice constant for undoped TiO2 NRs is a = b = 4.864 ± 0.003 Å and c = 3.078 ± 0.005 Å, in good agreement with the available literature. Table 1 comprises the lattice constants for Fe-doped TiO2 NRs and clear variations have been seen. A very small lower angle peak shift at 61.66° with increasing Fe3+ ion concentration has been observed; that is, substitutional sites of Ti4+ in the TiO2 crystal were occupied by Fe3+ions. This is in good agreement with the lattice expansion as 2θ angle increases, ascribed to the larger ionic radius of Fe3+ (0.79 Å) than the Ti4+ (0.75 Å).50
| Composition | a = b (Å) | c (Å) |
|---|---|---|
| TiO2 | 4.864 ± 0.003 | 3.078 ± 0.005 |
| Ti0.975Fe0.025O2 | 4.87 ± 0.007 | 3.08 ± 0.004 |
| Ti0.95Fe0.05O2 | 4.874 ± 0.004 | 3.084 ± 0.002 |
| Ti0.925Fe0.075O2 | 4.881 ± 0.006 | 3.085 ± 0.001 |
| Ti0.9Fe0.1O2 | 4.890 ± 0.002 | 3.086 ± 0.003 |
3.2. Surface morphology
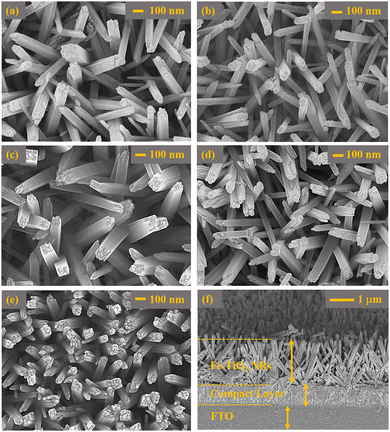
Fig. 3 represents the FESEM images of Ti1−xFexO2 (x = 0–0.1) NRs prepared at 150 °C for 8 h. On the top of the FTO substrate, a uniform compact-TiO2 layer was coated and then Ti1−xFexO2 NRs were grown vertically on the FTO substrate. Fig. 3(a) shows the top view of bare TiO2 NRs, where the sides of the NRs are very smooth but there were few step edges mounted on the top. The growth of TiO2 NRs may be due to additional Ti nucleation sites at the top step edges.51 As expected, the obtained NRs have a tetragonal crystal structure with square facets as shown in Fig. 3(a). Also Fig. 3(a)–(e) validates the porous structure formation with interlinked TiO2 NRs. Different concentrations of Fe-doping will change the morphology drastically as shown in Fig. 3(b)–(e).As obtained, there is a hierarchical nano-dot-like structure grown on the top of the TiO2 NRs. These nano-dot-like structures on the top of NRs will increase the surface area significantly and boost the change transfer ability. The average calculated length and diameter of the Ti1−xFexO2 NRs from Fig. 3(a)–(e) are in the range of 350 ± 10 to 370 ± 10 nm and 80 ± 10 to 90 ± 10 nm, respectively, for x = 0–0.1. In Fig. 3(f), a cross-sectional view of the photoanode is shown and the average widths of Ti1−xFexO2 NRs and c-TiO2 layer are found to be nearly 1.4–1.9 μm and 250 nm, respectively. Reports are well suited and already explained the advantages of the semiconducting nanoscale NRs, such as (i) high surface-to-volume ratio,52 (ii) very low grain boundaries, which directly alter the charge carrier trapping and scattering,53 and (iii) suitable charge carrier transportation.54 To escalate the dye loading, amply packed, large, and lean NRs-like dye scaffolds by maintaining enough charge carrier collection are required.53 With Fe doping the rod-like morphology altered to a highly porous surface consisting of nanorod cum dot-like morphology, which indicated the increase in surface area, which may significantly change the charge conversion/extraction efficiency.
Transmission electron microscopy (TEM) investigation was performed to analyze the crystal structure of TiO2 NRs. Low-resolution TEM images of single TiO2 NRs are represented in Fig. 4(a). It is surprising that there are numerous step edges present on the top facet of each NR as shown in Fig. 4(a). These step edges act as nucleation sites and results in the axial growth of TiO2 NRs with different growth rates. Further, such step edges may act as substrates for the secondary growth of TiO2 NRs. The relative HRTEM image of a single TiO2 NR is depicted in Fig. 4(b), which confirms the single crystalline behaviour of these TiO2 NRs having a lattice spacing of 0.32 nm along (101) planes of tetragonal rutile TiO2 NRs. Additionally, the growth direction of TiO2 NRs was parallel to the normal of the (001) plane. Therefore, the rutile TiO2 NR arrays grow predominantly along the [001] plane, showing good agreement with the XRD pattern.
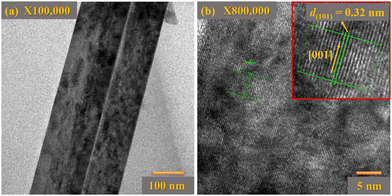 | ||
| Fig. 4 (a) TEM images of a single TiO2 NR, and (b) the corresponding HRTEM image of a single TiO2 NR. The inset image of (b) displays the lattice spacing between (101) planes of rutile phase TiO2. | ||
3.3. X-ray photoelectron spectroscopy (XPS)
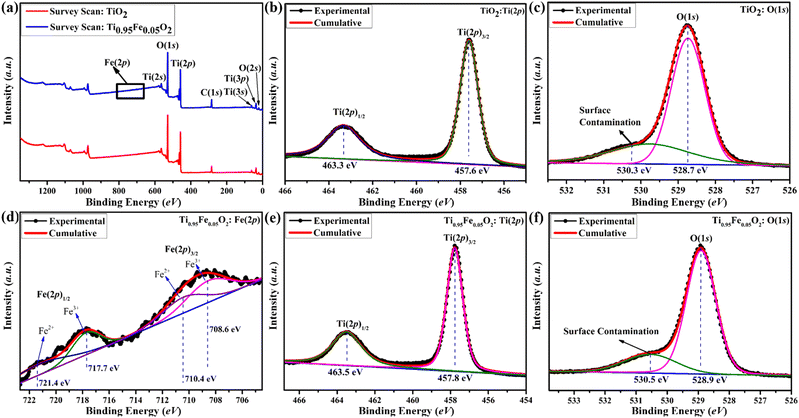
TiO2 has garnered a lot of interest across the globe since it is a well proven and excellent photoanode for DSSCs. On the other hand, TiO2 is a wide-bandgap (3.2 eV) semiconductor and can absorb UV light very easily. Numerous researchers claim that metal cations and non-metal anions can successfully dope titanium dioxide to prevent this UV sensitization. In this work, simple and inexpensive hydrothermal fabrication of Fe-doped TiO2 produced excellent photo-anodic characteristics for DSSC implementations. X-ray Photoelectron Spectroscopy (XPS) was employed to fully understand the doping processes. Basically, XPS is a technique that was used to investigate the elemental composition, chemical state, and ionic states of iron in Ti1−xFexO2(x = 0–0.1) photoanodes.Survey spectra of bare TiO2 and Ti0.95Fe0.05O2 photoanodes are displayed in Fig. 5(a). From the survey scan, the presence of Ti, O, C, and Fe elements were identified, whereas no Fe content was detected in bare TiO2 photoanodes. Here C is present in the survey scan, which is only because of the background, not present in the synthesized samples. Further high-resolution XPS spectra of Ti(2p) and O(1s) core levels from bare TiO2 and Ti0.95Fe0.05O2 photoanodes are shown in Fig. 5(b), (c) and (e), (f), respectively.
Fig. 5(b) and (e) reveals that the XPS spectrum of the Ti(2p) core consists of two major peaks, namely, Ti(2p)3/2 and Ti(2p)1/2, whereas the Ti(2p) spectrum mostly presents in Ti4+ oxidation with the minor composition of Ti3+ (because of O-inadequacy in the TiO2 lattice) for both bare TiO2 and Ti0.95Fe0.05O2 photoanodes, respectively. In bare TiO2 photoanodes, the binding energies of dominant Ti(2p)3/2 and minor Ti(2p)1/2 were observed at 457.8 and 463.3 eV (Fig. 5(b)). However, both these Ti(2p) spectrum peaks were shifted positively by 0.2 eV in Ti0.95Fe0.05O2 photoanodes (Fig. 5(e)). This peak shift is ascribed to reduced Ti-coordination, lowering of the Ti–O bonds; that is, the Ti4+ content is decreased. Additionally, this peak shift led to the formation of Fe–O–Ti bonds attributed to TiO2/Fe2O3 binary oxide formation.
High-resolution XPS spectra of O(1s) for bare TiO2 and Ti0.95Fe0.05O2 photoanodes are shown in Fig. 5(c) and (f), respectively. Here in the case of bare TiO2, the binding energy of the ruling O(1s) peak is 528.7 eV, which later shows a minor positive shift of 0.2 eV in Ti0.95Fe0.05O2 derivatives, ascribed to the oxygen signals in the TiO2 lattice. Moreover, O(1s) peaks are decreased in Ti0.95Fe0.05O2 photoanodes as the Fe–O bond formation takes place on the TiO2 surface. At both 530.3 and 530.5 eV binding energies in both cases another peak is observed, which is due to surface contamination, i.e., OH− adsorption on the TiO2 surface.
Lastly, XPS spectra of Fe(2p) were investigated to understanding the electronic behaviour of Fe in Ti0.95Fe0.05O2 photoanodes and the core spectrum of Fe(2p) can be seen in Fig. 5(d). The binding energy of two dominant Fe(2p)3/2 and Fe(2p)1/2 doubled peaks were found at 708.6 and 717.7 eV, respectively, which is associated with Fe3+ oxides. Along with these main peaks, there are some shake-up satellite peaks, and weak peaks are also observed at 710.4 and 721.4 eV, respectively, which are identified as a minor portion of Fe2+ oxidation states. However, these Fe2+ ions present on the TiO2 surface may lose their changeability to Fe3+ ionic state and lead to the formation of Ti3+ defect states. The collected information will be very helpful for transition metal-based TiO2 doping processes in the future.
3.4. UV-Visible characterization
Below 400 nm, absorption spectra (Fig. 6(a)) of Ti1−xFexO2 (x = 0–0.1) NRs show a sudden increase in absorption, assigned to stable rutile TiO2 with the bandgap of 3.2 eV (x = 0, TiO2 NRs).55 In the visible region, a nearly non-zero baseline is depicted, which matches with the previously reported work of Zhao et al.56 This may happen due to the low film thickness or pinholes present in the film. The absorbance of iron ions is present in the spectra of Fe-doped TiO2 NRs.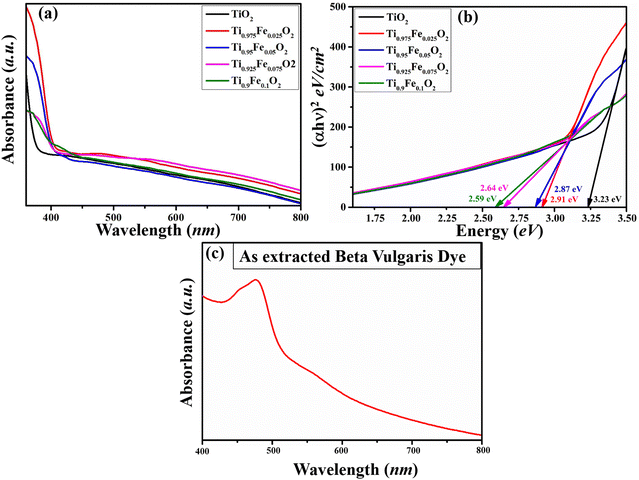 | ||
| Fig. 6 Absorption spectra of (a) Ti1−xFexO2 (x = 0–0.1) NRs, (b) Tauc plot of the Ti1−xFexO2 (x = 0–0.1) NRs and (c) UV-Visible spectra of the extracted BV dye. | ||
In Fig. 6(b), optical bandgap estimation is shown from the Tauc plot, and observed bandgaps for Ti1−xFexO2 (x = 0–0.1) NRs are 3.23, 2.91, 2.87, 2.64, and 2.59 eV, respectively. From the Tauc plot, there is a red shift in all Fe-doped samples. This red shift can be attributed to Fe 3d electron excitation to the TiO2 conduction band. Shallow trap formation between the conduction and valence bands of TiO2 NRs by Fe doping was confirmed in the literature, which may be responsible for the increasing bandgap with increasing Fe concentration.57 The UV-Visible analysis of the prepared dye from BV is represented in Fig. 6(c). In fact, dyes have control over the photo charge generation and transportation simultaneously and on the resulting device performance as well. To investigate the light capture ability of the used dye, UV-Vis spectroscopy was performed. A broad absorption band at 427–523 nm is observed and the maximum absorption is found at ∼457 nm. The maximum absorption peak (∼457 nm) is attributed to the purple-red betanin presence, while a small hump observed at ∼451 nm confirms the presence of yellow betaxanthin pigments, showing good agreement with the available literature. Functional groups that are present in the dye, mainly –O![[double bond, length as m-dash]](https://www.rsc.org/images/entities/char_e001.gif) H and –C(
H and –C(![[double bond, length as m-dash]](https://www.rsc.org/images/entities/char_e001.gif) O)OH, will boost the charge transfer at the dye and photoanode interface. Approximately 3.79 eV photon energy is required to excite the electron from the HOMO to the LUMO states of the BV dye.
O)OH, will boost the charge transfer at the dye and photoanode interface. Approximately 3.79 eV photon energy is required to excite the electron from the HOMO to the LUMO states of the BV dye.
3.5. FT-IR spectroscopy
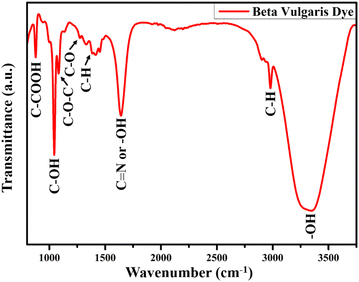
The presence of functional groups in the dye extracted from natural resources is necessary for the dye adsorption over the TiO2 NR photoanode. The FTIR spectrum of the dye extracted from BV is shown in Fig. 7, which confirms the presence of betalain pigments. Optimized FT-IR results have shown a sharp peak at 3346 cm−1 because of stretching vibration, whereas the peak at 2978 cm−1 is assigned to the C–H stretching vibration of alkanes. At 1637 cm−1, the amide bond carbonyl stretching mode absorption band is found. The peak at 1376 cm−1 is attributed to either the C–N stretching or –OH vibrational bonds, while the C–O bond is assigned at 1272 cm−1 for carboxylic acid stretching vibration mode. Other than these modes, symmetric stretching vibration (C–O–C), C–H bond deformation, and C–COOH bond stretching vibration absorption bands are found at 1086, 1042, and 876 cm−1, respectively. All these observed vibrational and stretching modes corresponding to the different functional groups are associated with the red-purple betanin pigments and effectively bound with the photoanode surface.583.6. Raman spectroscopy
Generally, Raman spectroscopy (Fig. 8) is preferred to investigate the structural properties of the hydrothermally grown Ti1−xFexO2 (x = 0–0.1) NRs. All the first-order three active Raman modes A1g (609.18 cm−1), B1g (143.65 cm−1), and most prominent second-order scattering mode Eg (446.37 cm−1) validate the formation of rutile phase TiO2 NRs. At near 140 cm−1, a sharp peak occurs because of O–Ti–O symmetric bending vibration causing B1g mode. Another intense characteristic peak at 446 cm−1 was observed, which may be attributed to symmetric O–Ti–O stretching vibration. All the results are in good agreement with previously reported literature.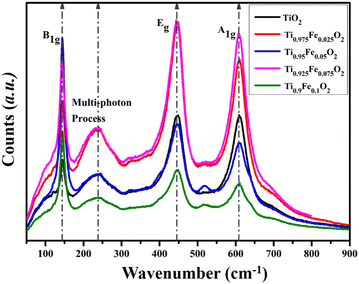 | ||
| Fig. 8 Raman spectra for tetragonal rutile phase Ti1−xFexO2 (x = 0–0.1) NRs grown hydrothermally on the FTO substrate. | ||
4. Working mechanism
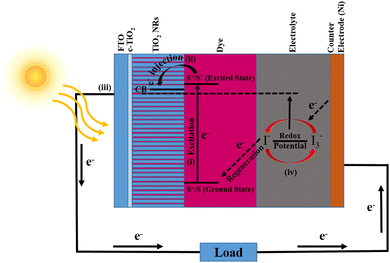
The working mechanism of a DSSC is mainly attributed to four pillars: photo-absorption, electron injection, charge carrier transportation, and current collection. The schematic shown in Fig. 9 addressed these attributes and represents the photoconversion of light into current. First, photons are absorbed by betalain pigments used as the photosensitizer and this will lead to electron excitation from the valence state (S+/S) to the conduction state (S+/S*) of the dye. Fig. 6(c) shows the highest absorption peak of the dye near 457 nm, while the minimum photo energy required for electron excitation is nearly 3.79 eV. The excited electrons having lifetimes in the range of nanoseconds were injected into the TiO2 NR conduction band, which is generally lower than the excited state of the dye. There is also a little absorption of photons by TiO2 NRs in the UV region as reported in the literature.59 This will result in oxidation of the dye and can be represented by the equation is given below,| S+/S + hν → S+/S* | (1) |
| S+/S* → S+/S + e−(TiO2 NRs) | (2) |
Now, these injected charge carriers (electrons) were transported via TiO2 NRs and diffused to the transparent conducting electrode (FTO). Later, the electrons reached the CE via external circuitry. At the CE, the electrons were reduced from I3− to I− and due to the electron acceptance from the I− ion redox mediator, dye regeneration takes place. Subsequently, the oxidation of I− into I3− (oxidized state) takes place (eqn (3)).
| S+/S* + e− → S+/S | (3) |
| I3− + 2e− → 3I− | (4) |
Further, diffusion of the I3− oxidation mediator at the CE takes place and reduces into I ions (eqn (4)). Hence, as explained, dye sensitization happens when the sunlight is illuminated and the formation of the HOMO and LUMO will take place. If the sunlight radiation has sufficiently large energy, then the e− charges are excited and injected into the CB of Ti1−xFexO2 (x = 0–0.1) NRs, and simultaneously the dye will oxidize. Outer circuitry helps these injected charges reach the CE. The electrolyte having I− and I3− redox ions gets reduced by the injected electrons, which will lead to the regeneration of the dye molecules.
5. Photovoltaic performance
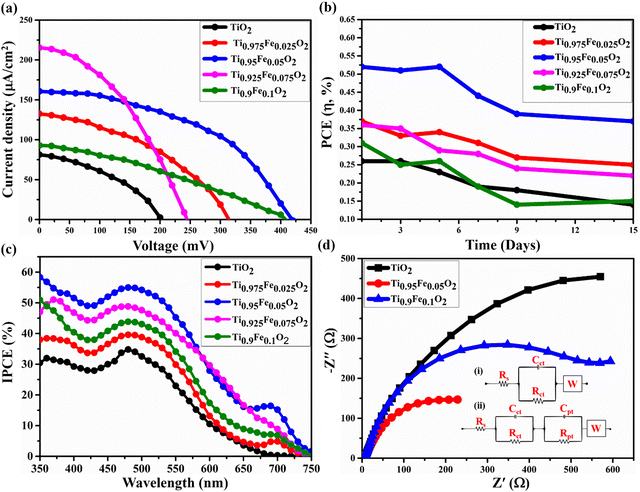
The photovoltaic properties of the DSSC device prepared using Ti1−xFexO2 (x = 0–0.1) NRs grown on the FTO substrate having a TiO2 blocking layer sandwiched in between are shown in Fig. 10(a). Betalain pigments extracted from BV (red beetroot) were used as photosensitizers. For its real-world applications, the device's stability is a priority in addition to performance. After 300 hours of testing, 70% PCE retention was found in the DSSCs composed of the most effective Ti0.95Fe0.05O2 photoanodes and BV dyes. Further, the PCE retention of the DSSCs having TiO2, Ti0.975Fe0.025O2, Ti0.925Fe0.075O2, and Ti0.9Fe0.1O2 photoanodes was 50, 67, 60, and 45%, respectively, after 300 hours under the standard 1 sun (AM 1.5G) illumination as shown in Fig. 10(b).The incident photon conversion efficiency (IPCE) investigation of the corresponding DSSCs is depicted in Fig. 10(c) in the wavelength range from 350 to 750 nm. The greatest IPCE value, 54.6% of the Ti0.95Fe0.05O2 photoanodes, was reported at ∼560 nm. However, for the Ti0.925Fe0.075O2, Ti0.9Fe0.1O2, Ti0.975Fe0.025O2, and pure TiO2 photoanodes, the maximum obtained IPCE peak values are 48.3, 43.5, 39.9, and 34.6%. The IPCE value and JSC had a favourable correlation. Consequently, the results of the J–V study and the overall IPCE investigation were consistent. The absorbance of the betalain dye occurred between 400 and 600 nm, where the IPCE value was maximum. On the other hand, absorption of Ti1−xFexO2 (x = 0–0.1) photoanodes varied between 350 and 450 nm related to the bandgap of 2.59–3.23 eV, which were properly compatible with the IPCE study findings.
The large IPCE values for the Ti0.95Fe0.05O2 photoanode-based DSSCs over a huge spectrum will increase the light-harvesting capacity, which is ascribed to the massive dye loading and maximum reflectance. Additionally, it is discovered from IPCE analysis that the Ti0.95Fe0.05O2 photoanode-based DSSCs exhibit a clear red-shift to a higher wavelength in comparison to others due to the efficient light scattering properties.
The Electron Impedance Spectroscopy (EIS) investigation of the Ti1−xFexO2 (x = 0–0.1) photoanode-based DSSC in the frequency range 0.1 Hz to 100 kHz is shown in Fig. 10(d). EIS evaluates the charge transfer mechanisms in DSSCs, such as series resistance Rs, related to the resistance offered by FTO and CE, high-frequency impedance responses Rct and Cpt associated with the events happening at the Ni/electrolyte interface, mean frequency responses Rpt and Cpt related to the electron transport and recombination at the TiO2/electrolyte interface, and low-frequency response W designated as electrolyte diffusion impedance.
As depicted in Fig. 10(d), in the mean frequency region, the Nyquist plots contain a semicircle, which is ascribed to the TiO2/electrolyte interfacial electron transport resistance and recombination. However, a very small straight line at low frequency is associated with diffusion mechanics. The diameter of different semicircles featured in the Nyquist plot of Ti1−xFexO2 (x = 0–0.1) photoanodes changed with the varying concentration of Fe. Equivalent circuits for bare TiO2 and Ti0.9Fe0.1O2 photoanodes are represented in the inset circuit (i) drawn. However, the equivalent circuit for the Ti0.95Fe0.05O2 photoanode is represented in the inset circuit (ii). All the values of Rs, Rct, Cct, Rpt, Cpt, and W for Ti1−xFexO2 (x = 0–0.1) photoanode-based DSSCs are summarized in Table 3. Finally, the Ti0.95Fe0.05O2 photoanode has two impedance components with smaller amounts of electron transport resistance, such as Rct = 660 Ω, which indicates a decrease in electron recombination and an effective enhanced electron transport, leading to higher conductivity, compatible with the previous findings.
In this study, we investigated the role of Ti1−xFexO2 (x = 0–0.1) photoanodes on the DSSC performance. Various solar cell performance parameters such as power conversion efficiency (η%), open circuit voltage (VOC), short circuit current density (JSC), and fill factor (FF) for the Ti1−xFexO2 (x = 0–0.1) based DSSC are given in Table 2. Performance improvement directly depends on (i) a large contact area between FTO and c-TiO2 and (ii) the blocking ability of the c-TiO2. A large contact area will significantly shrink the charge transport resistance and simultaneously increase the charge collection efficiency, while the blocking ability of c-TiO2 will help to reduce the charge recombination.60 The choice of CEs also plays an important role in the device performance.61
| Composition | J SC (mA cm−2) | V OC (mV) | FF | η (%) |
|---|---|---|---|---|
| TiO2 | 0.080 | 203 | 0.97 | 0.26 |
| Ti0.975Fe0.025O2 | 0.151 | 420 | 0.36 | 0.37 |
| Ti0.95Fe0.05O2 | 0.130 | 312.3 | 0.79 | 0.52 |
| Ti0.925Fe0.075O2 | 0.210 | 246 | 0.43 | 0.36 |
| Ti0.9Fe0.1O2 | 0.092 | 419 | 0.50 | 0.31 |
| Composition | R s (Ω) | R ct (Ω) | C ct (mF) | R pt (Ω) | C pt (mF) | W (mMho) |
|---|---|---|---|---|---|---|
| TiO2 | 21.27 | 1376 | 37.69 | — | — | — |
| Ti0.95Fe0.05O2 | 3.653 | 659.3 | 21.86 | 96.05 | 27.74 | 27.82 |
| Ti0.9Fe0.1O2 | 9.236 | 991 | 42.98 | — | — | 22.43 |
Here in this study, we preferred a Ni-based CE for its cost effectiveness, easy processing and significant performance. However, Ni has a lower conductivity of 1.43 × 10⁷ S m−1 as compared to conventional CEs such as gold (4.10 × 10⁷ S m−1), silver (6.30 × 10⁷ S m−1), copper (5.96 × 10⁷ S m−1), etc., resulting in the lower performance (as compared to some reports given in Table 4) of the Fe-doped TiO2 NR photoanode and Ni-CE based DSSC, where the BV dye has been used as the photosensitzer. Apart from the lower conductivity of Ni-CE, the photo generated charge recombination at the FTO and c-TiO2 interface will lead to a significant but lower efficiency of 0.52% only. However, the cost effectiveness and comparable PCE of the Ni-CE based DSSC make it an eco-friendly and affordable solar cell.
| Dye | CE | Photoanode | J SC (mA cm−2) | V OC (mV) | FF (%) | η (%) | Ref. |
|---|---|---|---|---|---|---|---|
| BV | Carbon | ZnO | 0.72 | 460 | 0.54 | 0.1788 | 64 |
| Purple cabbage and BV | Carbon | ZnO | 1.12 | 560 | 0.60 | 0.3824 | |
| BV | Carbon | TiCl4 treated TiO2 | 2.23 | 407.6 | 0.54 | 0.49 | 65 |
| 80% BV + 20% spinach | Carbon | TiCl4 treated TiO2 | 4.65 | 386.7 | 0.55 | 0.99 | |
| BV | — | TiO2 | — | — | 0.469 | 0.467 | 66 |
Orange Bougainvillea + BV (1![[thin space (1/6-em)]](https://www.rsc.org/images/entities/char_2009.gif) : :![[thin space (1/6-em)]](https://www.rsc.org/images/entities/char_2009.gif) 1) 1) |
— | TiO2 | — | — | 0.56 | 0.274 | |
| BV | Au | TiO2 | 223 | 0.66 | 0.096 | 67 | |
| BV | TiO2 | 2.71 | 576 | 0.57 | 0.89 | 68 | |
| BV + Tetraethylorthosilicate | Carbon | TiO2 | 2.08 | 609 | 0.54 | 0.68 | |
| BV | Pt | TiO2 | 1.295 | 380 | 0.32 | 0.15 | 69 |
| BV | Graphite | TiO2 | 1.7 | 0.46 | — | 1.3 | 70 |
| BV | Pt | TiO2 | 0.055 | 470 | — | 0.03 | 71 |
| BV | Nickel | TiO2 NRs | 0.080 | 203 | 0.97 | 0.26 | This work |
| BV | Nickel | Ti0.975Fe0.025O2 NRs | 0.151 | 420 | 0.36 | 0.37 | This work |
| BV | Nickel | Ti0.95Fe0.05O2 NRs | 0.130 | 312.3 | 0.79 | 0.52 | This work |
| BV | Nickel | Ti0.925Fe0.075O2 NRs | 0.210 | 246 | 0.43 | 0.36 | This work |
| BV | Nickel | Ti0.9Fe0.1O2 NRs | 0.092 | 419 | 0.50 | 0.31 | This work |
Table 2 confirms the considerable change from sample to sample, particularly in JSC. J–V results show that there is a significant increase in JSC accompanied by enhanced VOC. Undoped samples have shown lower JSC because of fast photo-charge recombination, which is well explained in the available literature.62 As the Fe concentration increases, the JSC values also increase simultaneously. This may have happened due to absorption enhancement and energy transport from the Fe3+ energy band to the conduction band of the TiO2 NRs. The PCE and JSC were nevertheless inhibited when too much Fe content was introduced because potential barriers stopped the electrons from flowing to the external circuit. Also, because of reduced grain boundary resistance, the recombination losses are greatly reduced during charge transportation.63 Hence, based on the realized photovoltaic properties, increased η with the Fe-doping can be acknowledged.
A comparative study of BV dye-based DSSCs is discussed in Table 4. Herein, we also reported the performance of the Ti1−xFexO2 NR-based DSSC by using betalain pigments extracted from BV. BV dyes were examined by Sinha et al. for DSSCs with the combination of carbon and ZnO electrodes and the obtained PCE was 0.17%. In the same report, a mixed dye (chlorophyll and betalains) successfully boosted the device performance by 0.38%.64 In another report, Bashar et al. used TiCl4-treated TiO2 photoanodes for the DSSC having a BV photosensitizer and achieved 0.49% PCE, whereas by mixing red and green dyes (4![[thin space (1/6-em)]](https://www.rsc.org/images/entities/char_2009.gif) :
:![[thin space (1/6-em)]](https://www.rsc.org/images/entities/char_2009.gif) 1), the performance was notably improved up to 0.99%.65 Salinas et al. investigated combined BV and orange Bougainvillea extracts with a TiO2 photoanode for DSSCs and obtained 0.274% PCE, while a bare BV dye showed a better PCE of 0.467%. This lowering of PCE with the mixed dye was ascribed to the lowering of photo-absorption.66 Increased lifetime and a little lower PCE (0.89–0.68%) have been reported with mixed BV dye and tetraethylorthosilicate.68
1), the performance was notably improved up to 0.99%.65 Salinas et al. investigated combined BV and orange Bougainvillea extracts with a TiO2 photoanode for DSSCs and obtained 0.274% PCE, while a bare BV dye showed a better PCE of 0.467%. This lowering of PCE with the mixed dye was ascribed to the lowering of photo-absorption.66 Increased lifetime and a little lower PCE (0.89–0.68%) have been reported with mixed BV dye and tetraethylorthosilicate.68
Accumulatively, it was seen that the limited charge transfer capability and surface area coverage of TiO2 photoanodes in combination with conventional CEs need to be modified for better performance. To acknowledge these gaps, we doped TiO2 NRs with Fe, which tuned the absorption edges in the visible region and reduced the charge recombination at the FTO/c-TiO2 interface. Having nearly equal ionic radii, Fe doping will maintain the crystal's structure. Enhanced surface adsorption and low energy level photonic excitation will be achieved with Fe doping.18–24 Moreover, we replaced the costly conventional CE with Ni, which exhibited notable performance despite having lower conductivity.
6. Conclusions
In conclusion, we have prepared a very economical DSSC using Ti1−xFexO2 nanorods and BV dyes. To understand the role of Fe-doped TiO2 photoanodes and BV dyes in DSSC performance, various physicochemical characterization studies and photovoltaic analysis were performed. This Fe-doping will reduce the photo-charge recombination, while c-TiO2 helps in minimizing the interfacial charge transfer resistance, which is a very effective approach to resolve the low PCE of the DSSCs. On the other hand, the cheaply prepared Ni-CEs will enhance the charge collection. Herein, this combination of photoanodes, dyes, and CEs were explored for the very first time and a notable PCE was reported. However, pinholes present on the photoanode surface, and dye degradation may lead to device failure in later stages. Furthermore, ease of fabrication, cost-effectiveness, eco-friendly nature, and remarkable performance of the DSSC having Fe-doped TiO2 NRs photoanodes, Ni-CEs, and betalain pigment-based photosensitizers make it an effective and possible approach for commercial fabrication. In addition, such DSSCs may become the game changer for some novel applications such as in wearables, thermochromics, and laser drilling.Data availability statement
The data that support the findings of this study are available from the corresponding author upon reasonable request.Author contributions
Abhishek Srivastava: conceptualization, validation, methodology, investigation, formal analysis, and writing-original draft. Jena Akash Kumar Satrughna: formal analysis. Manish Kumar Tiwari: formal analysis and editing. Archana Kanwade: writing-original draft. Subhash Chand Yadav: editing. Kiran Bala: formal analysis, writing-original draft and editing, and supervision. Parasharam M. Shirage: conceptualization, funding acquisition, resources, supervision, and writing- review& editing.Conflicts of interest
The authors declare no competing financial interests.Acknowledgements
AS, AK, and JAKS acknowledge the Department of Science and Technology (DST) Inspire for fellowship, the sanction numbers “DST/INSPIRE/2021/IF200232, IF200271, and DST/INSPIRE/2019/IF190546”, respectively. The authors are thankful to Prof. Suhas Joshi, Director, the SIC and MEMS department, IIT Indore, for providing a research facility. PMS is thankful to MSME, Govt. of India, through “Support for Entrepreneurial and Managerial Development of MSMEs through Incubators”, F. No. 3(10)/Inc/5th PAMC/2020-21 for incubation on “Sustainable, Engineered Sodium-ion Batteries for Renewable Energy Storage”.References
- B. O’Regan and M. Gratzel, Nature, 1991, 353, 737–740 CrossRef.
- K. Kakiage, Y. Aoyama, T. Yano, K. Oya, J. Fujisawab and M. Hanaya, Chem. Commun., 2015, 51, 15894–15897 RSC.
- L. Song, P. Du, J. Xiong, F. Ko and C. Cui, Electrochim. Acta, 2015, 163, 330–337 CrossRef CAS.
- C. T. Wu, W. P. Liao and J. J. Wu, J. Mater. Chem., 2011, 21, 2871–2876 RSC.
- A. S. Teja, A. Srivastava, J. A. K. Satrughna, M. K. Tiwari, A. Kanwade, S. C. Yadav and P. M. Shirage, Dyes and Pigments, 2022, 110997 CrossRef.
- C.-P. Lee, C.-T. Li and K.-C. Ho, Mater. Today, 2017, 20, 267–283 CrossRef CAS.
- S. C. Yadav, A. Srivastava, V. Manjunath, A. Kanwade, R. S. Devan and P. M. Shirage, Mater. Today Phys., 2022, 100731 CrossRef.
- A. Kanwade, S. Gupta, A. Kankane, A. Srivastava, S. C. Yadav and P. M. Shirage, Sustainable Energy Fuels, 2022, 6, 3114–3147 RSC.
- L. Song, P. Du, J. Xiong, F. Ko and C. Cui, Electrochim. Acta, 2015, 163, 330–337 CrossRef CAS.
- S. C. Yadav, V. Manjunath, A. Srivastava, R. S. Devan and P. M. Shirage, Opt. Mater., 2022, 132, 112676 CrossRef.
- X. Feng, K. Shankar, O. K. Varghese, M. Paulose, T. J. Latempa and C. A. Grimes, Nano Lett., 2008, 8, 3781–3786 CrossRef CAS PubMed.
- B. Liu and E. S. Aydil, J. Am. Chem. Soc., 2009, 131, 3985–3990 CrossRef CAS PubMed.
- Q. Kang, J. Cao, Y. Zhang, L. Liu, H. Xu and J. Ye, J. Mater. Chem. A, 2013, 1, 5766–5775 RSC.
- Y. Zhang, X. Xiong, Y. Han, X. Zhang, F. Shen, S. Deng, H. Xiao, X. Yang, G. Yang and H. Peng, Chemosphere, 2012, 88, 145–154 CrossRef CAS PubMed.
- D. Zhang, F. Zeng and J. Russ, J. Phys. Chem. A, 2011, 85, 1077–1083 CAS.
- A. Kanwade, S. Gupta, A. Kankane, M. K. Tiwari, A. Srivastava, J. A. K. Satrughna, S. C. Yadav and P. M. Shirage, RSC Adv., 2022, 12, 23284–23310 RSC.
- M. K. Tiwari, S. C. Yadav, A. Srivastava, A. Kanwade, J. A. K. Satrughna, S. S. Mali, J. V. Patil, C. K. Hong and P. M. Shirage, RSC Adv., 2022, 12, 32249–32261 RSC.
- C. M. Teh and A. R. Mohamed, J. Alloys Compd., 2011, 509, 1648–1660 CrossRef CAS.
- S. Kment, H. K. Mentova, P. Kluson, J. Krysa, Z. Hubicka, V. Cirkva, I. Gregora, O. Solcova and L. Jastrabik, J. Colloid Interface Sci., 2010, 348, 198–205 CrossRef CAS PubMed.
- A. D. Paola, E. Garcia-Lopez, S. Ikeda, G. Marc, B. Ohtani and L. Palmisano, Catal. Today, 2002, 75, 87–93 CrossRef.
- M. Asilturk, F. Sayılkan and E. Arpac, J. Photochem. Photobiol., A, 2009, 203, 64–71 CrossRef.
- M. Litter and J. Navio, J. Photochem. Photobiol., A, 1996, 98, 171–181 CrossRef CAS.
- B. Wang, Q. B. Li, W. Wang, Y. Li and J. Zhai, Appl. Surf. Sci., 2011, 257, 3473–3479 CrossRef CAS.
- A. Zaleska, Recent Pat. Eng., 2008, 2, 157–164 CrossRef CAS.
- N. A. Ökte and Ş. Akalın, React. Kinet., Mech. Catal., 2010, 100, 55–70 Search PubMed.
- Y. Hu, Y. Pan, Z. Wang, T. Lin, Y. Gao, B. Luo, H. Hu, F. Fan, G. Liu and L. Wang, Nat. Commun., 2020, 11, 1–10 CrossRef PubMed.
- Y. Kim, S. Yang, E. H. Jeon, J. Baik, N. Kim, H. S. Kim and H. Lee, Nanoscale Res. Lett., 2016, 11, 1–8 CrossRef CAS PubMed.
- S. George, S. Pokhrel, Z. Ji, B. L. Henderson, T. Xia, L. J. Li, J. I. Zink, A. E. Nel and L. Mädler, J. Am. Chem. Soc., 2011, 133, 11270–11278 CrossRef CAS PubMed.
- W. Li, A. Kuc, C. F. J. Walther and T. Heine, J. Phys. Chem. A, 2015, 119, 5742–5748 CrossRef CAS PubMed.
- Y. Wang, R. Zhang, J. Li, L. Li and S. Lin, Nanoscale Res. Lett., 2014, 9, 1–8 CrossRef PubMed.
- T. Rawling, F. Buchholz and A. M. McDonagh, Aust. J. Chem., 2008, 61, 405–408 CrossRef CAS.
- S. Zhang, J. Jin, D. Li, Z. Fu, S. Gao, S. Cheng, X. Yu and Y. Xiong, RSC Adv., 2019, 9, 22092–22100 RSC.
- J.-M. Ji, H. Zhou, Y. K. Eom, C. H. Kim and H. K. Kim, Adv. Energy Mater., 2020, 10, 2000124 CrossRef CAS.
- M. Thelakkat, C. Schmitz and H. W. Schmidt, Adv. Mater., 2002, 14, 577–581 CrossRef CAS.
- S. Ito, P. Liska, P. Comte, R. Charvet, P. Pechy, U. Bach, L. S. Mende, A. K. Zakeeruddin, M. K. Nazeeruddin and M. Grätzel, Chem. Commun., 2005, 4351–4353 RSC.
- B. Peng, G. Jungmann, C. Jager, D. Haarer, H. W. Schmidt and M. Thelakkat, Coord. Chem. Rev., 2004, 248, 1479–1489 CrossRef CAS.
- W. Y. Gan, S. W. Lam, K. Chiang, R. Amal, H. Zhao and M. P. Brungs, J. Mater. Chem., 2017, 17, 952–954 RSC.
- M.-E. Ragoussi and T. Torres, Chem. Commun., 2015, 51, 3957–3972 RSC.
- N. Sekar and V. Y. Gehlot, Resonance, 2010, 15, 819–831 CrossRef CAS.
- T. Horiuchi, H. Miura, K. Sumioka and S. Uchida, J. Am. Chem. Soc., 2004, 126, 12218–12219 CrossRef CAS PubMed.
- F. Bella, N. V. lachopoulos, K. Nonomura, S. M. Zakeeruddin, M. Gratzel, C. Gerbaldi and A. Hagfeldt, Chem. Commun., 2015, 51, 16308–16311 RSC.
- D. Ganta, J. Jara and R. Villanueva, Chem. Phys. Lett., 2017, 679, 97–101 CrossRef CAS.
- H. Zhou, L. Wu, Y. Gao and T. Ma, J. Photochem. Photobiol., A, 2011, 219, 188–194 CrossRef CAS.
- F. Kabir, M. M. H. Bhuiyan, M. S. Manir, M. S. Rahaman and M. A. Khan, Results Phys., 2019, 14, 102474 CrossRef.
- T. Jalali, P. Arkian, M. Golshan, M. Jalali and S. Osfouri, Opt. Mater., 2020, 110, 110441 CrossRef CAS.
- L. Xu, C. Aumaitre, Y. Kervella, G. Lapertot, C. Rodríguez-Seco, E. Palomares and P. Reiss, Adv. Funct. Mater., 2018, 28, 1706291 CrossRef.
- N. S. Allen, N. Mahdjoub, V. Vishnyakov, P. J. Kelly and R. J. Kriek, Polym. Degrad. Stab., 2018, 150, 31–36 CrossRef CAS.
- M. Ismael, J. Environ. Chem. Eng., 2020, 8, 103676 CrossRef CAS.
- M. A. Khan, S. I. Woo and O. B. Yang, Int. J. Hydrogen Energy, 2008, 33, 5345–5351 CrossRef CAS.
- B. Santara, P. K. Giri, S. Dhara, K. Imakita and M. Fujii, J. Phys. D: Appl. Phys., 2014, 47, 235304 CrossRef.
- A. Pottier, C. Chaneac, E. Tronc, L. Mazerollesb and J.-P. Jolivet, J. Mater. Chem., 2001, 11, 1116–1121 RSC.
- A. I. Hochbaum and P. Yang, Chem. Rev., 2010, 110, 527–546 CrossRef CAS PubMed.
- M. Law, L. E. Greene, J. C. Johnson, R. Saykally and P. Yang, Nat. Mater., 2005, 4, 455–459 CrossRef CAS PubMed.
- S. Li, Y. Wang, C. Gao, S. Ge, J. Yu and M. Yan, J. Electroanal. Chem., 2015, 759, 38–45 CrossRef CAS.
- P. Soundarrajan, K. Sankarasubramanian, T. Logu, K. Sethuraman and K. Ramamurthi, Mater. Lett., 2014, 116, 191–194 CrossRef CAS.
- Z. Weirong, Li Yajun, Z. Meng, Ch Jinsheng, X. Lihong, Sh Qiaomeng and Z. Xi, Chem. Eng. J., 2016, 283, 105–113 CrossRef.
- A. P. Singh, S. Kumari, R. Shrivastav, S. Dass and V. R. Satsangi, Int. J. Hydrogen Energy, 2008, 33, 5363–5368 CrossRef CAS.
- D. Devadiga and T. N. Ahipa, Chem. Technol. Nat. Synth. Dyes Pigm., 2020, 5772, 88939 Search PubMed.
- K. Hitoshi, H. Orita and H. Sugihara, Langmuir, 2008, 24, 4411–4419 CrossRef PubMed.
- A. I. Hochbaum and P. Yang, Chem. Rev., 2010, 110, 527–546 CrossRef CAS PubMed.
- A. Srivastava, B. S. Chauhan, S. C. Yadav, M. K. Tiwari, J. A. K. Satrughna, A. Kanwade, K. Bala and P. M. Shirage, Chem. Phys. Lett., 2022, 807, 140087 CrossRef CAS.
- M. Asiltürk, F. Sayılkan and E. Arpaç, J. Photochem. Photobiol., A, 2009, 203, 64–71 CrossRef.
- L. Long, L. Wu, X. Yang and X. Li, J. Mater. Sci. Technol., 2014, 30, 765–769 CrossRef CAS.
- D. Sinha, D. De, D. Goswami and A. Ayaz, Mater. Today: Proc., 2018, 5, 2056–2063 CAS.
- H. Bashar, M. M. H. Bhuiyan, M. R. Hossain, F. Kabir, M. S. Rahaman, M. S. Manir and T. Ikegami, Optik, 2019, 185, 620–625 CrossRef CAS.
- G. Salinas, M. José and M. J. Ariza, Appl. Sci., 2019, 9, 2515 CrossRef.
- A. R. Samanchandra, D. Tharanga and G. A. Sewvandi, Moratuwa Eng. Res. Con., 2017, 390–394 Search PubMed.
- H. Martínez, A. Ramon, M. Estévez, S. Vargas and R. Rodriguez, Int. J. Mol. Sci., 2013, 14, 4081–4093 CrossRef PubMed.
- M. A. Almutairi, W. A. Farooq and M. S. AlSalhi, Curr. Appl. Phys., 2021, 40, 119–125 CrossRef.
- S. Sathyajothi, R. Jayavel and A. C. Dhanemozhi, Mater. Today: Proc., 2017, 4, 668–676 Search PubMed.
- C. Pathak, K. Surana, V. K. Shukla and P. K. Singh, Mater. Today: Proc., 2019, 665–670 CAS.
| This journal is © The Royal Society of Chemistry 2023 |

