
A biodegradable injectable fluorescent polyurethane-oxidized dextran hydrogel for non-invasive monitoring†
Xiao
Wang
,
Yangcen
Ou
,
Xiaofei
Wang
,
Lei
Yuan
,
Nan
He
,
Zhen
Li
,
Feng
Luo
 *,
Jiehua
Li
and
Hong
Tan
*,
Jiehua
Li
and
Hong
Tan
College of Polymer Science and Engineering, State Key Laboratory of Polymer Materials Engineering, Sichuan University, Chengdu 610065, China. E-mail: fengluo@scu.edu.cn
First published on 8th August 2023
Abstract
Hydrogels have been extensively used in the field of biomedical engineering. In order to achieve non-invasive and real-time visualization of the in vivo status of hydrogels, we designed a fluorescent polyurethane-oxidized dextran (PU-OD) hydrogel with good injectability and self-healing properties, which was cross-linked from a tetraphenyl ethylene (TPE)-containing fluorescent polyurethane emulsion with oxidized dextran by dynamic acylhydrazone bonds. The hydrogel can be used as a visual platform for drug delivery as well as monitoring its own degradation. The network structure of the hydrogel gave it drug-loading capability, and the acylhydrazone bond enabled its pH-responsive drug release. Meanwhile, the PU-OD hydrogel could undergo fluorescence resonance transfer with doxorubicin hydrochloride, showing its potential application in monitoring drug release. In addition, fluorometric and weighing methods were performed to monitor the degradation behavior of the hydrogels in vivo and in vitro, respectively, showing that the non-invasive fluorometric method can be consistent with the invasive weighing method. This work highlights that the introduction of aggregation-induced emission molecules into polyurethanes provides a visual platform that allows for non-invasive monitoring of the material without affecting its own function, which is convenient and less damaging to the body or animals. Consequently, it possesses excellent and promising potential in biomedical materials technologies.
1. Introduction
Hydrogels are widely used as biomaterials for in vivo implantation due to their good biocompatibility based on their stereochemical network structure and high-water content.1–3 When used as a biological implant material, the degradation rate of the hydrogels should match the tissue regeneration rate to avoid tissue collapse or excessive regeneration due to premature degradation or cellular inflammation,4,5 so tracking and monitoring their degradation behavior in vivo is one of the important aspects. Anatomical observation is a commonly used method to track hydrogel degradation.6 However, this invasive approach has several disadvantages as follows. Firstly, it may require a large number of animals, thus compromising the welfare of experimental animals.7,8 Moreover, in vivo, the degradation behavior is continuous and dynamic, whereas the anatomical observation method is a discontinuous process.9 Additionally, hydrogels may have a certain adhesion to tissues in vivo, forcible peeling may damage the morphology of hydrogels,10 and inaccurate weighing data may be obtained, thus causing misjudgment of experimental results. In summary, the traditional weighing method has serious limitations to reflect the degradation of hydrogels in vivo, so there is an urgent need for developing novel ways to non-invasively monitor the degradation of hydrogels expediently.Currently, there are many reliable and effective techniques for non-invasive imaging, for example magnetic resonance imaging (MRI),11–13 X-ray, ultrasound,14,15 and so on, that can reflect the degradation process of hydrogels in vivo. The application of conventional methods might be limited due to the long acquisition time, radiation risk, complicated and expensive equipment and difficulty of reaching targeted locations in special cases.16 In contrast the methods of fluorescence visualization are gradually catching people's great attention due to their great benefits such as low cost, sensitivity, and non-intrusive and convenient operation.17–21 Conventional organic fluorescent reagents used for imaging typically exhibit aggregation-induced quenching (AIQ) effects,22 while non-organic fluorescent materials possess high biotoxicity like quantum dots, and proteins with stable fluorescence are known as complex structures and have an unacceptable price, which significantly limits their biological and clinic applications. Hence fluorescent materials with excellent biocompatibility and a high signal-background ratio are crucially needed.23
In the last decade, fluorescent reagents with the unique aggregation-induced emission (AIE)-phenomenon have made great progress in in vivo tracing and monitoring, and fluorescence imaging applications.24–28 They are different from the conventional organic pigments as AIE luminogens (AIEgens) exhibit enhanced fluorescence intensity with increasing concentration. The non-radiative decay energy of their excited state is clearly reduced by the inhibited inter-molecular rotation when AIE molecules aggregate resulting in higher quantum yields and intense fluorescence.29 This property makes them well suited for use in hydrogels. It was fully proven that AIEgens do have some features such as excellent photostability, a significant Stokes shift, and great resistance to photobleaching,30 which are crucial for persistent monitoring and tracing in vitro and in vivo. Recently, Tang et al.31 showed the entire gelation process of the chitosan LiOH urea aqueous solution system by AIE fluorescence imaging, which inspired us in turn to use AIEgens to monitor the degradation of hydrogels. During degradation, the fluorescence intensity of the hydrogel varies with the degree of hydrogel degradation.32,33 Meanwhile, in combination with other characterizations, we can infer the approximate degree of degradation of the hydrogel and visualize the degradation behavior of the hydrogel. In addition, hydrogels can be applied as drug carriers due to their own characteristics,34,35 and some drugs with fluorescence are loaded on AIE hydrogels, and the release of drugs can be monitored more conveniently by fluorescence changes through the fluorescence resonance transfer effect.36–38
Polyurethane (PU) is known as a promising biodegradable biomaterial with good biocompatibility.39–41 Therefore, polyurethane-based hydrogels have been widely used in the biomedical field.42–47 In this work, in order to achieve non-invasive monitoring of biodegradable hydrogels, we prepared an injectable fluorescent PU-OD hydrogel by dynamic cross-linking fluorescent PU emulsion with oxidized dextran (ODex), where the fluorescent PU emulsion was synthesized by using TPE-NH2 as a chain extender and adipic dihydrazide (ADH) as an end-capping agent. The hydrogel can effectively be loaded with doxorubicin hydrochloride, and the drug release can be monitored by fluorescence changes. In addition, the fluorescence intensity of PU-OD hydrogels was investigated in vitro and in vivo with the degree of degradation, and the results showed that the trend of fluorescence intensity was similar to that of weight change during degradation, indicating the potential of this fluorescent hydrogel as a visual platform for non-invasive monitoring.
2. Experimental sections
2.1. Materials
Polycaprolactone (PCL, Mw = 2000 g mol−1) was purchased from Dow Chemical and L-lysine ester diisocyanate was obtained from the same company. The chain extender 2,2-bis(hydroxymethyl)propionic acid (DMPA) was sourced from GEO (USA). Adipic dihydrazide (ADH) and ethylene glycol were obtained from Aladin. Dextran (Dex) and sodium periodate were bought from Shanghai Macklin Co., Ltd. Doxorubicin hydrochloride (Dox·HCl) was purchased from Dalian Meilun Biotech Co., Ltd. Mouse fibroblast cells (L929) were provided by the Internal Medicine Laboratory of HuaXi Medicinal Center, Sichuan University (China). BALB/c mice (6–8 weeks) were offered by the Laboratory Animal Center of Sichuan University.2.2. The method of TPE-NH2 synthesis
TPE-NH2 was synthesized as in our previous report.48 Briefly, 0.3 mol zinc powder and 100 mL tetrahydrofuran were added to a three-necked flask in an ice-salt bath. After cooling down to −20 °C, TiCl4 (0.15 mol) was added slowly and stirred. The temperature of the liquid phase was gradually increased to 65 °C and subsequently maintained for 2 h. 0.1 mol 4-aminobenzophenone was added and refluxed for another 20 h. 10 wt% solution of aqueous potassium carbonate was added rapidly to obtain precipitation. The mixture was filtrated to obtain the filtrate and extracted 3 times with ethyl acetate, evaporated to remove ethyl acetate subsequently, and a yellow oil-like product was yielded at last. The final product was further refined through a silica gel column to obtain a yellow solid of TPE-NH2.2.3. Synthesis of fluorescent polyurethane emulsion
PU emulsions were synthesized as shown in Fig. S1 (ESI†) and described below. PCL-2000 (20 g) was dehydrated at 100 °C for 90 min, then cooled down to 80 °C and pre-polymerized with LDI (6.1 g) under nitrogen for 2 h. Before the addition of TPE-NH2 (0.18 g), 1.34 g DMPA was added rapidly and reacted for 1 h. Chain extender TPE-NH2 underwent reaction at 60 °C for 3 h. After that, acetone and TEA were added for neutralization reaction at 37 °C. Finally, ADH (1.74 g) was fully dissolved in water (100 mL) and emulsified with PU prepolymer under high-speed stirring for 50 min to obtain PU emulsion with an ADH capped end.2.4. Synthesis of the oxidized dextran (ODex)
The synthesis of ODex was through oxidation of dextran by sodium periodate (Fig. S2, ESI†). Firstly, dextran (5 g) and water (100 mL) were added into a flask and completely dissolved. Next, aqueous sodium periodate (6.6 g) was dropped into the flask and reacted at room temperature for 12 h, avoiding light throughout. The oxidation reaction was terminated by ethylene glycol (2 mL). The oxidized dextran solution purified by dialysis (cut-off MW = 3000) and then freeze-dried to obtain dry oxidized dextran (ODex) at last.2.5. Oxidation titration of the ODex
The aldehyde group content of ODex was titrated by hydroxylamine hydrochloride. The ODex (0.5 g) was dissolved completely in 25 mL hydroxylamine hydrochloride aqueous solution (0.25 mol L−1). Next, an appropriate amount of methyl orange was added as an indicator and left for 3 h. Then the titration was carried out with standard NaOH solution until the color of the liquid changed from red to yellow. The volume of NaOH solution used during the titration was recorded. The oxidation degree of ODex was calculated using the following equation:Va: volume of sodium hydroxide consumed by ODex (L); Vb: volume of sodium hydroxide consumed by the control sample (L); M: molar concentration of sodium hydroxide (0.1 mol L−1); W: weight of oxidized dextran (g).
2.6. Preparation of the PU-OD hydrogel
The solid content of the ODex aqueous solution and PU emulsion was separately adjusted to 5 wt% at 20 wt%. ODex and PU were mixed in different volume ratios and then a series of hydrogels were formed at room temperature, named PU-OD.2.7. Structural characterization
2.8. Sol–gel phase change
The tube inversion method was used to observe and record the time of sol–gel transition for different PU-OD hydrogels. Different proportions of ODex solution and PU emulsion were separately added into the centrifuge tube, and the two components were mixed well with a vortexer. When the mixture did not flow after turning the tube upside down, the mixture was considered to have undergone a sol–gel transition.2.9. Hydrogel porosity test
The porosity of the hydrogel was determined using the specific gravity method. Firstly, the prepared hydrogel was freeze-dried, and the volume after lyophilizing was recorded as Va and the weight as Wa. Then the dry hydrogel was put into water. The weight of the hydrogel was recorded as Wb after the pores were filled with water completely. The porosity was calculated using the following equation:
2.10. Rheological test
Rheological properties are one of the most important properties of hydrogels. The rheological properties of PU-OD hydrogels were investigated by means of a rotational rheometer (DHR-2, TA). PU-OD hydrogels of 25 mm diameter and 3 mm thickness were prepared and placed between the corresponding PP plates. Firstly, the temporal stability was studied. The energy storage modulus (G′) and loss modulus (G′′) of the hydrogel were measured at a certain frequency and strain for 5 min. Next, an angular frequency scan (1–100 rad s−1, constant 1% strain) was performed to determine the frequency stability of the sample. Then a strain scan was performed from 0.1% to 150% at 1 Hz frequency. Next, the self-healing behavior was tested using a three-times alternating strains scan. The fracture and healing strains were 200% and 0.1%, respectively. Finally, the viscosity behavior of the hydrogel at different shear rates (0.1–1000 s−1) was evaluated to further evaluate its injectability.2.11. Drug release in vitro
Dox·HCl was chosen as the encapsulated drug for the hydrogel. PBS at pH 7.4 and pH 5 were used as the release medium, respectively. The standard curves of Dox·HCl in the two PBS were firstly established. The method was as follows: First, Dox·HCl (20 μg) was put into a 10 mL volumetric flask. Then, PBS was added to the scale line and dissolved uniformly to obtain a standard solution of 2 μg mL−1. The standard solution was diluted to concentrations of 2, 1, 0.5, 0.25 and 0.125 μg mL−1, and its absorbance at 488 nm was measured. A linear fit of concentration-absorbance was performed to obtain the standard curve.Subsequently, 600 μL ODex, 400 μL PU emulsion, and 50 μL Dox·HCl solution were added into a 10 mL centrifuge tube and mixed well to form a gel. After that, the hydrogel was placed in a centrifuge tube with 2 mL of release solution and placed in a water bath (100 rpm) at a constant temperature of 37 °C for release experiments. 1 mL of the release solution was removed at the set time and then replenished with an equal amount of fresh release solution. The samples were immediately centrifuged at 3000 rpm for 5 min, and the supernatant was then used to measure the fluorescence intensity at 488 nm excitation. After the drug concentration was obtained by standardization, the drug release rate was calculated according to the formula:

2.12. Degradation in vitro
The prepared PU-OD hydrogel samples were lyophilized and then weighed to determine their original weight (W1). Then the samples were immersed in 5 mL of PBS (pH = 7.4 and 5) and placed in a shaker (37 °C, 90 rpm), respectively. After degradation for 1, 3, 7, and 14 days, the soaked PU-OD samples were taken out, freeze-dried for 48 h, and subsequently weighed to obtain the final weight (W2). The residual mass ratio was calculated by the following equation:Additionally, fluorescence changes in the degraded hydrogel samples were observed and quantified using a fluorescence imaging system (IVIS Lumina III, PerkinElmer, USA).

2.13. Cytotoxicity
Sterilized PU-OD hydrogel (0.1 g) was immersed in 1 mL of DMEM medium and placed in a 37 °C incubator for 24 h. After the immersion, the extract was diluted with serum-containing DMEM at 10, 100, and 1000 times, and DMEM was set as the control. 200 μL of different concentrations of the extracts were added to L929 cells and cultured in 96 well plates for 1 and 3 days, respectively. After incubation, the medium was removed and MTT (20 μL, 5 mg mL−1) was added and incubated at 37 °C for 4 h. Then the supernatant was fully discarded and 150 μL DMSO was added to fully dissolve the formed formazan. The optical density (OD) at 490 nm was evaluated by the microplate reader (BioTek SYNERGY LX, US). The cell survival rate was calculated according to the following formula:Well-incubated cells of L929 were placed in Petri dishes with 30
![[thin space (1/6-em)]](https://www.rsc.org/images/entities/char_2009.gif) 000 cells each. The hydrogel extracts were added carefully and co-cultured at 37 °C for 3 days. The cells were stained separately by using calcein-AM and PI. Stained cells were monitored subsequently using a laser scanning confocal microscope (Nikon N-SIM, Japan).
000 cells each. The hydrogel extracts were added carefully and co-cultured at 37 °C for 3 days. The cells were stained separately by using calcein-AM and PI. Stained cells were monitored subsequently using a laser scanning confocal microscope (Nikon N-SIM, Japan).
2.14. Hydrogel degradation experiments in vivo
6–8 week old BALB/c mice were used for in vivo gel degradation experiments. The animal experiments were carried out with the permission of the Experimental Animal Welfare and Ethics Committee of Sichuan University (no. 2019070A). 200 μL of PU-OD hydrogel was injected subcutaneously on the backs of mice using a 26 G (0.45 mm) needle. The mice were then euthanized at 0, 6, 12, 24, 48, and 96 h post-injection for in vivo imaging. The changes in fluorescence signal range and fluorescence intensity at the injection site were observed using an imaging system (Maestro EX). The mice were also observed by direct visual photography using a UV flashlight at the setting time after injection. The inflammation in the skin areas with hydrogel injected was observed by H & E staining 3 days later.3. Result and discussion
3.1. Characterization of ODex, PU, and PU-OD hydrogels
To confirm the successful oxidation of dextran, the structures of dextran before and after oxidation were investigated using 1H NMR. The signals from Hb to Hf of Dex were attributed to broad peaks between δ 3.3–4.0 ppm. The peak of Ha was around δ 4.9 ppm. Compared to the unoxidized dextran, between δ 5.8–4.2 ppm, some new peaks appeared in the ODex spectrum, which were attributed to the hemiacetal moieties.49 This is probably due to the reaction of the aldehyde group on the oxidized dextran ring with the neighboring unoxidized hydroxyl group after oxidation, resulting in a more stable hemiacetal structure than the free aldehyde group (Fig. 1a). The aldehyde group content of ODex was calculated to be about 58% after titration.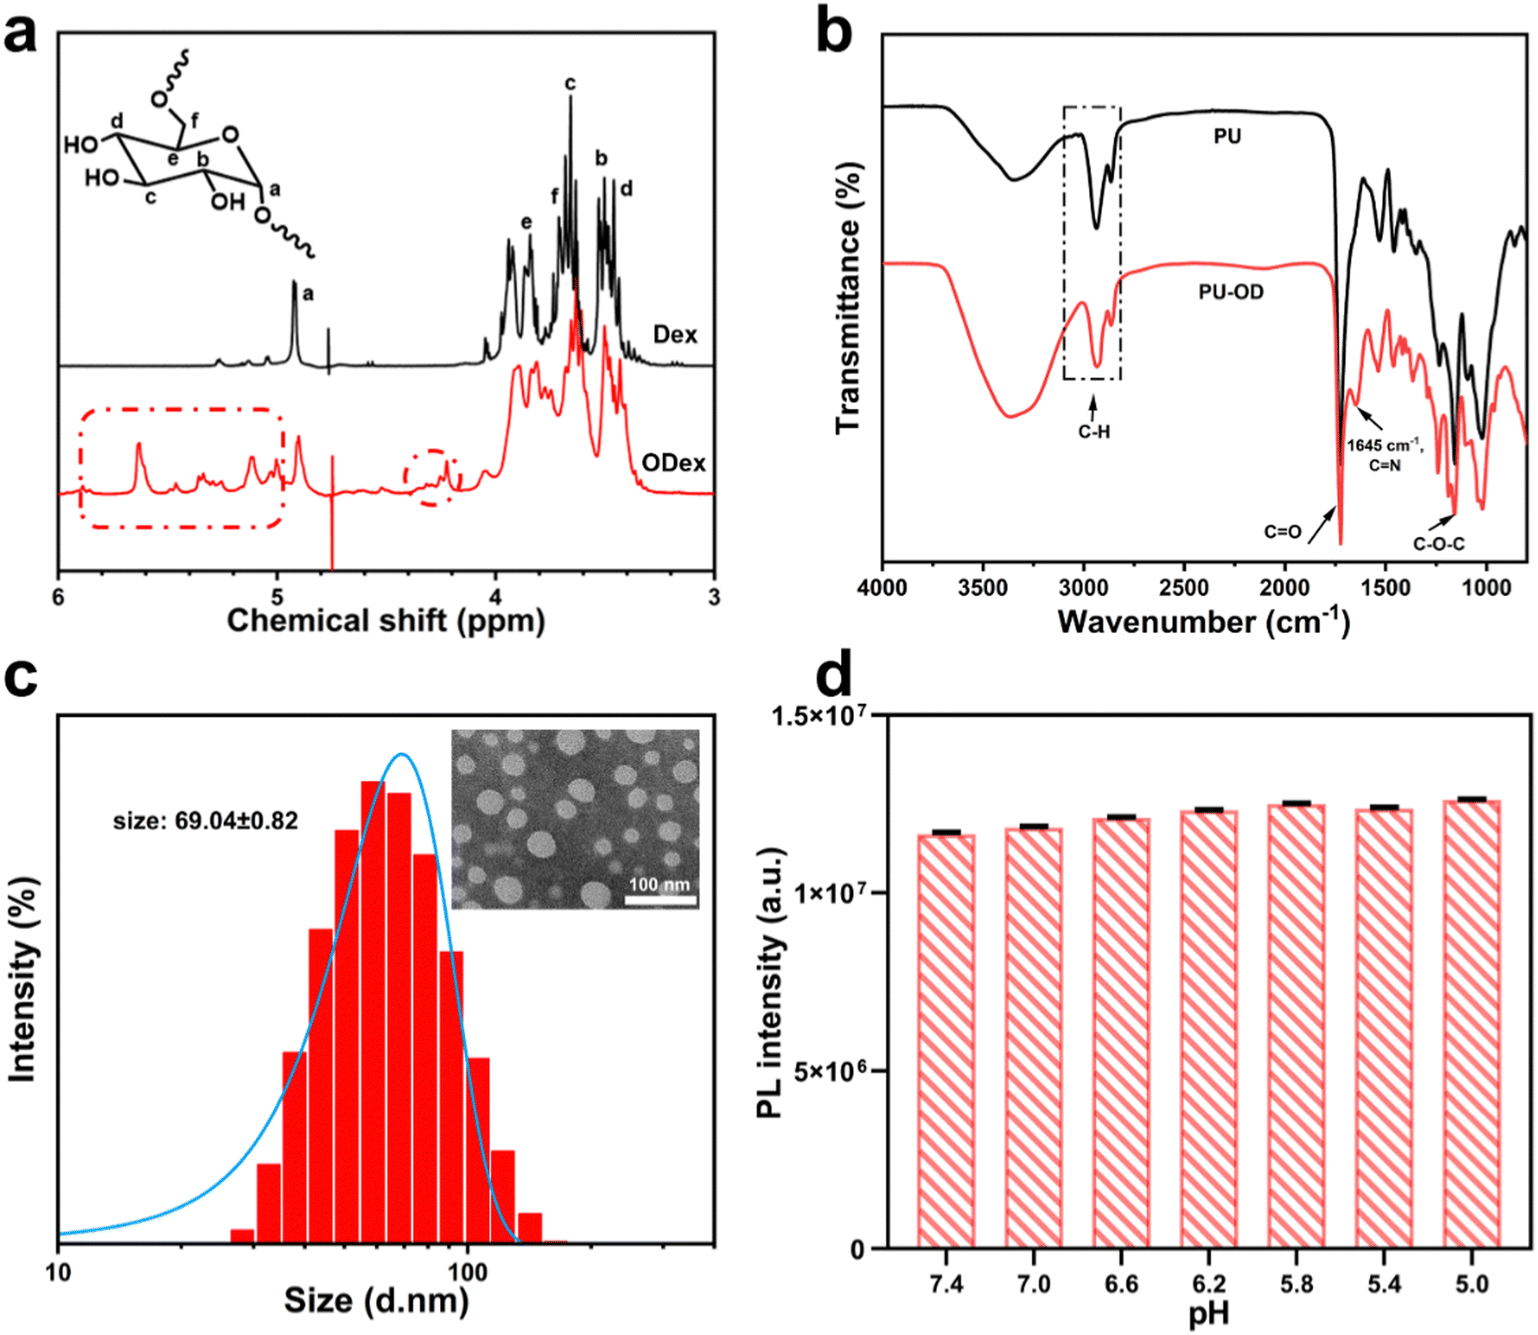 | ||
| Fig. 1 (a) 1H NMR spectra of dextran and oxidized dextran. (b) FTIR spectra of PU and PU-OD hydrogel. (c) Diagram of particle size distribution of PU emulsion and the TEM image of PU. (d) Maximum value of the fluorescence emission intensity of PU emulsion (200 μg mL−1) at different pH (n, repeated value, n = 3). | ||
As shown in Fig. 1b, in the FT-IR spectrum of PU, there was no obvious characteristic peak of the NCO group around 2200 cm−1, indicating that NCO has been completely consumed. Meanwhile, the C–H peak near 3000 cm−1, the C![[double bond, length as m-dash]](https://www.rsc.org/images/entities/char_e001.gif) O characteristic peak at 1710 cm−1 and the C–O–C absorption peak between 1150–1200 cm−1 proved the successful synthesis of PU. Compared to PU, a new characteristic peak located at 1645 cm−1 appeared in the spectrum of PU-OD, indicating the formation of an acylhydrazone bond (–CN–) in the hydrogel and the successful preparation of the designed hydrogel.
O characteristic peak at 1710 cm−1 and the C–O–C absorption peak between 1150–1200 cm−1 proved the successful synthesis of PU. Compared to PU, a new characteristic peak located at 1645 cm−1 appeared in the spectrum of PU-OD, indicating the formation of an acylhydrazone bond (–CN–) in the hydrogel and the successful preparation of the designed hydrogel.
In addition, the particle size, molecular weight, polydispersity and fluorescence intensity of PU emulsions at different pH were all investigated. The particle size of PU emulsions was about 69.04 nm with uniform particle size distribution (Fig. 1c and Table 1). The maximum emission intensity of fluorescent PU emulsion was measured at different pH and under 390 nm excitation light. The fluorescence of PU emulsions hardly changed in the range of pH 7.4 to pH 5.0, indicating excellent pH stability under different pH values (Fig. 1d and Fig. S3, ESI†).
| Sample | Size (nm) | M n (×104) | M w (×104) | M w/Mn |
|---|---|---|---|---|
| PU | 69.04 ± 0.82 | 2.67 | 4.40 | 1.65 |
3.2. Preparation and properties of PU-OD hydrogels
As shown in Fig. 2a and b, we prepared a series of PU-OD hydrogels by mixing different volumes of ODex (5 wt%) solution and PU emulsion (20 wt%), which can emit bright green fluorescence under UV light. In order to obtain hydrogels with optimal performance, several different volume ratios of the contents were prepared and their gelation was observed in Table 2. The gel time was also recorded using the inversion method. It can be observed from the table that gelling was easier when the volume ratio of ODex solution was slightly higher than that of PU emulsion, but too much difference between the two ratios will also result in non-gelation. When a smaller amount of ODex solution was added, the cross-linked network density of the formed gel decreased, resulting in a softer gel. On the other hand, with a higher content of ODex solution, the cross-linked network in the gel became denser, leading to a more brittle gel. Additionally, within a certain range, adding more ODex solution resulted in a decrease in gelation time. We believe that more aldehyde groups can promote the formation of acylhydrazone bonds which are more stable than Schiff-base bonds resulting in a reduction of gelation time.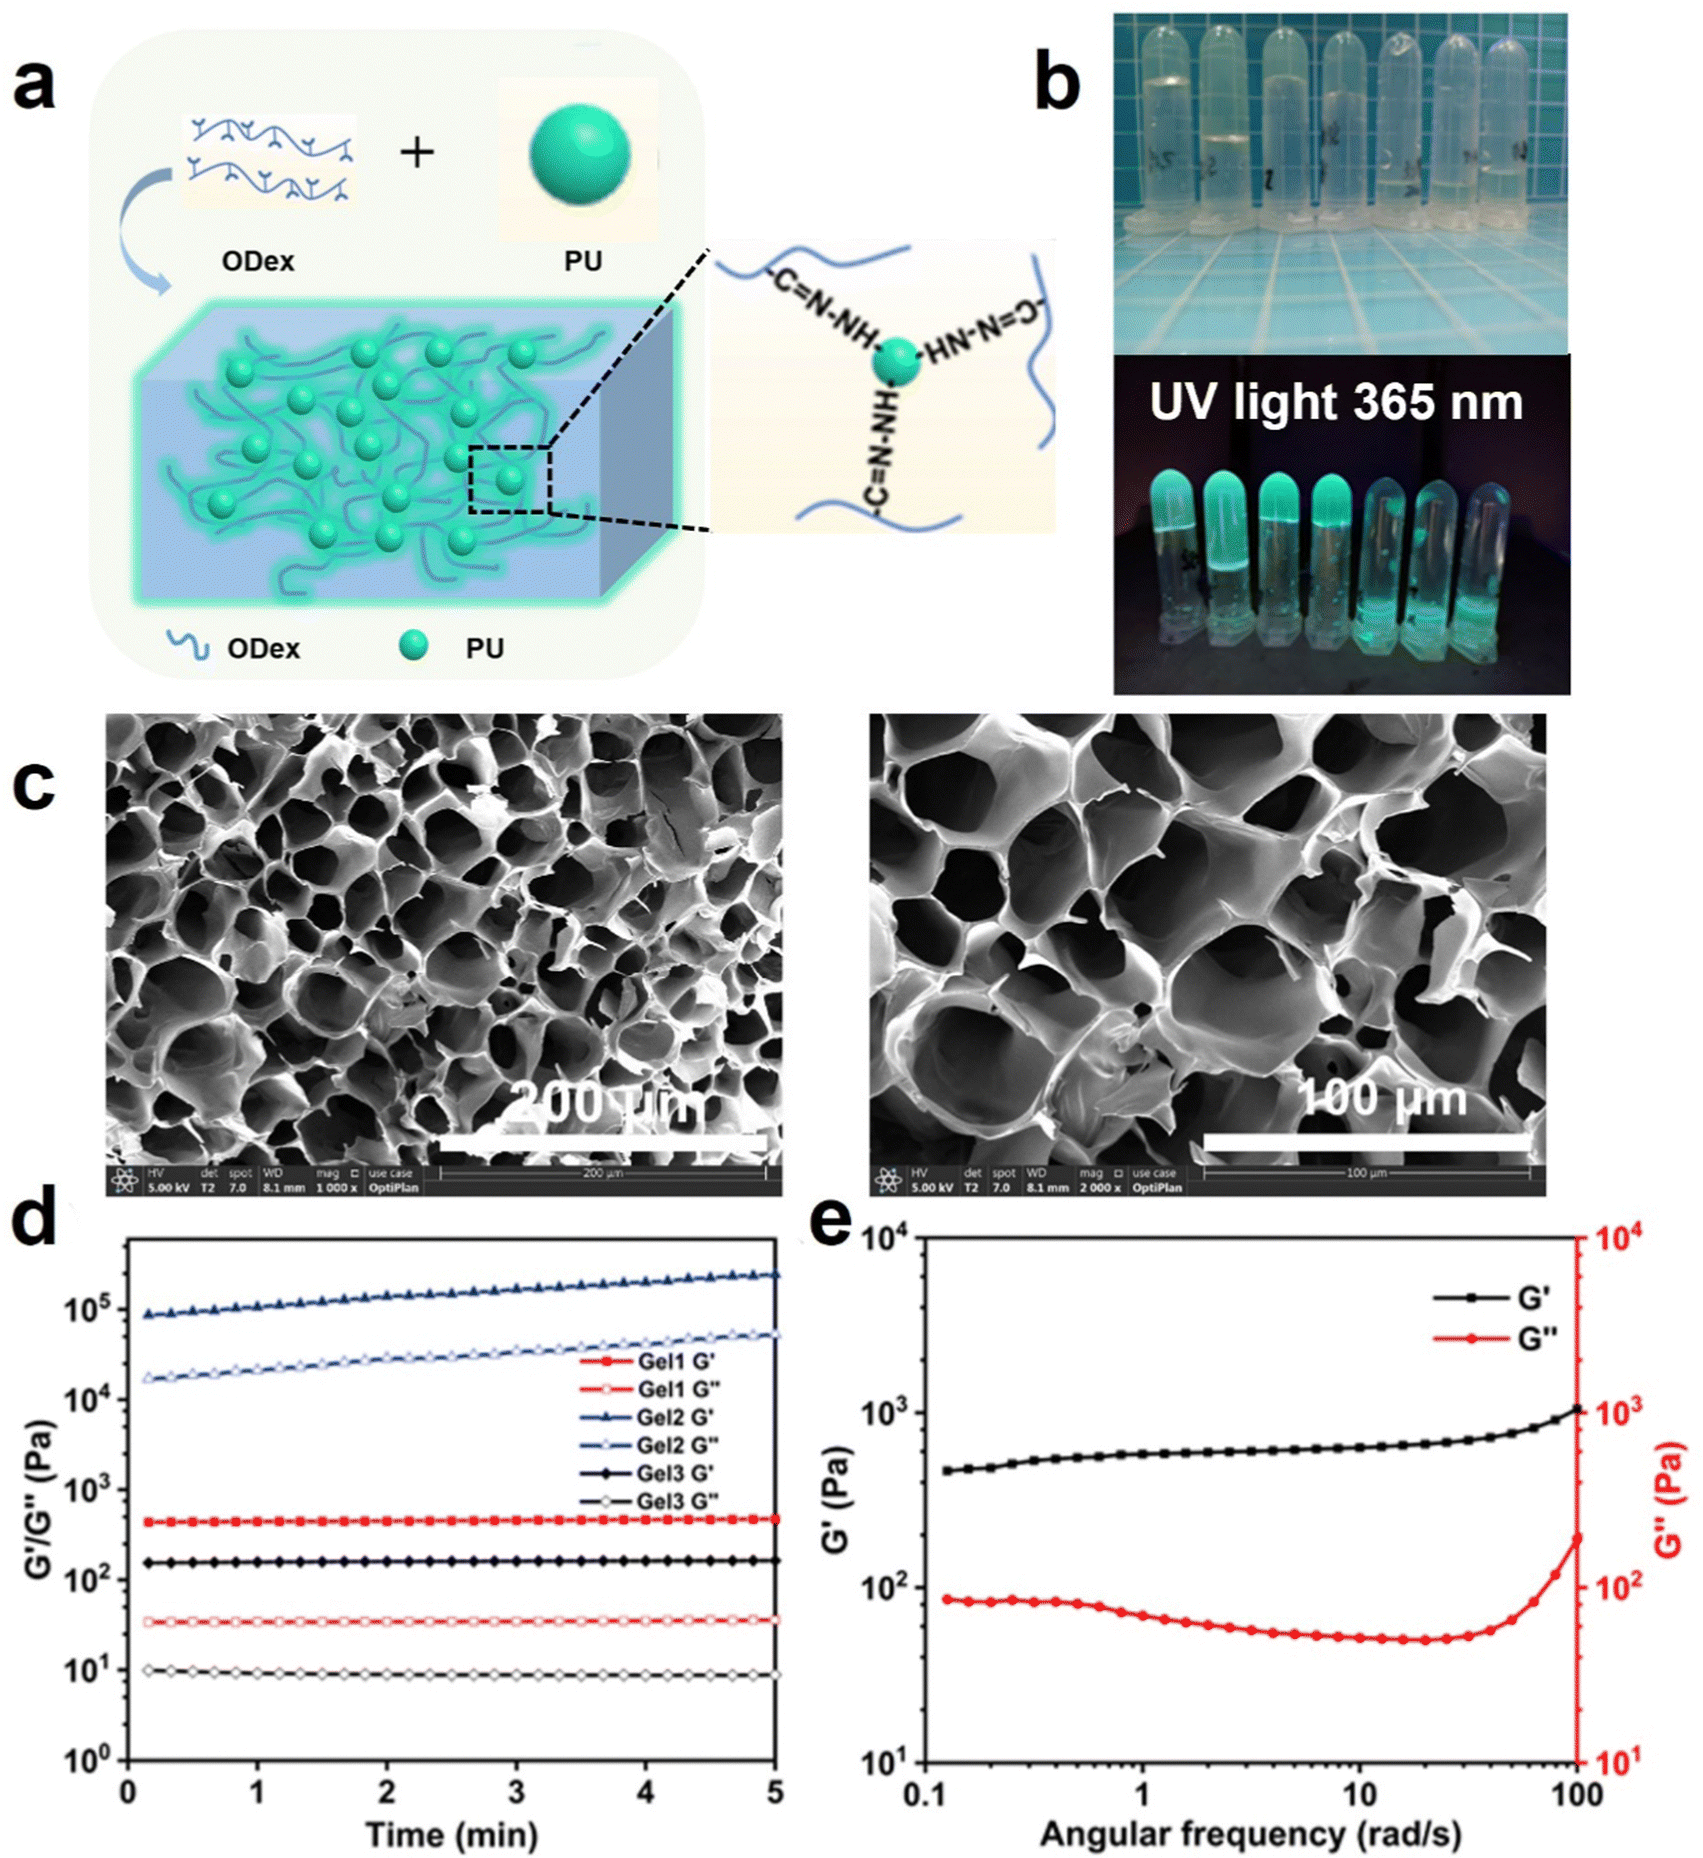 | ||
| Fig. 2 (a) Schematic diagram of the preparation of PU-OD hydrogels and (b) digital photographs of the mixture with different volume ratios of ODex solution and PU emulsion. (c) SEM images of PU-OD hydrogel (Gel 1 indicated in Table 2) with different magnifications. (d) Time scanning of various PU-OD hydrogels, the serial number of gels is consistent with Table 2. (e) Frequency sweep of Gel1 at 0.1–100 rad/s. | ||
| Number | Mixing volume | Solid content (wt%) | Status | Mechanical property | Gel time (min) |
|---|---|---|---|---|---|
| 1 | ODex 300 μL/PU 200 μL | 11.0 | Gel | Excellent | 30 |
| 2 | ODex 400 μL/PU 100 μL | 8.0 | Gel | Brittle | 20 |
| 3 | ODex 200 μL/PU 200 μL | 12.5 | Gel | Soft | 60 |
| 4 | ODex 600 μL/PU 100 μL | 7.1 | Sol | — | — |
| 5 | ODex 200 μL/PU 400 μL | 15.0 | Sol | — | — |
SEM was used to observe the porous structure inside the hydrogel. From Fig. 2c, the PU-OD hydrogel composed of group number 1 (indicated in Table 2) has a uniform porous structure and the pores were closely connected with each other to form a three-dimensional network structure. The pore size was about 50 μm and the porosity was about 50%. The regular microporous structure of hydrogel provided an ideal space for it to be utilized as a drug carrier, which was conducive to drug delivery, cell migration and proliferation. Therefore, it has a broad application prospect in the biomedical field. As shown in Fig. S4 (ESI†), the hydrogel composed of group 2 did not form a distinct three-dimensional network structure, and the pores formed were irregular. It was believed that the insufficient PU resulted in fewer acylhydrazone bonds, which led to an incomplete cross-linking network and the inability to form a complete three-dimensional network structure. On the contrary, PU-OD hydrogel with composition 3 can form a three-dimensional network structure with relatively obvious pores but still exhibited significant differences in pore size ranging from 100–300 μm. Excessive acylhydrazine groups from PU resulted in inadequate cross-linking density, leading to an uneven pore structure and soft mechanical nature.
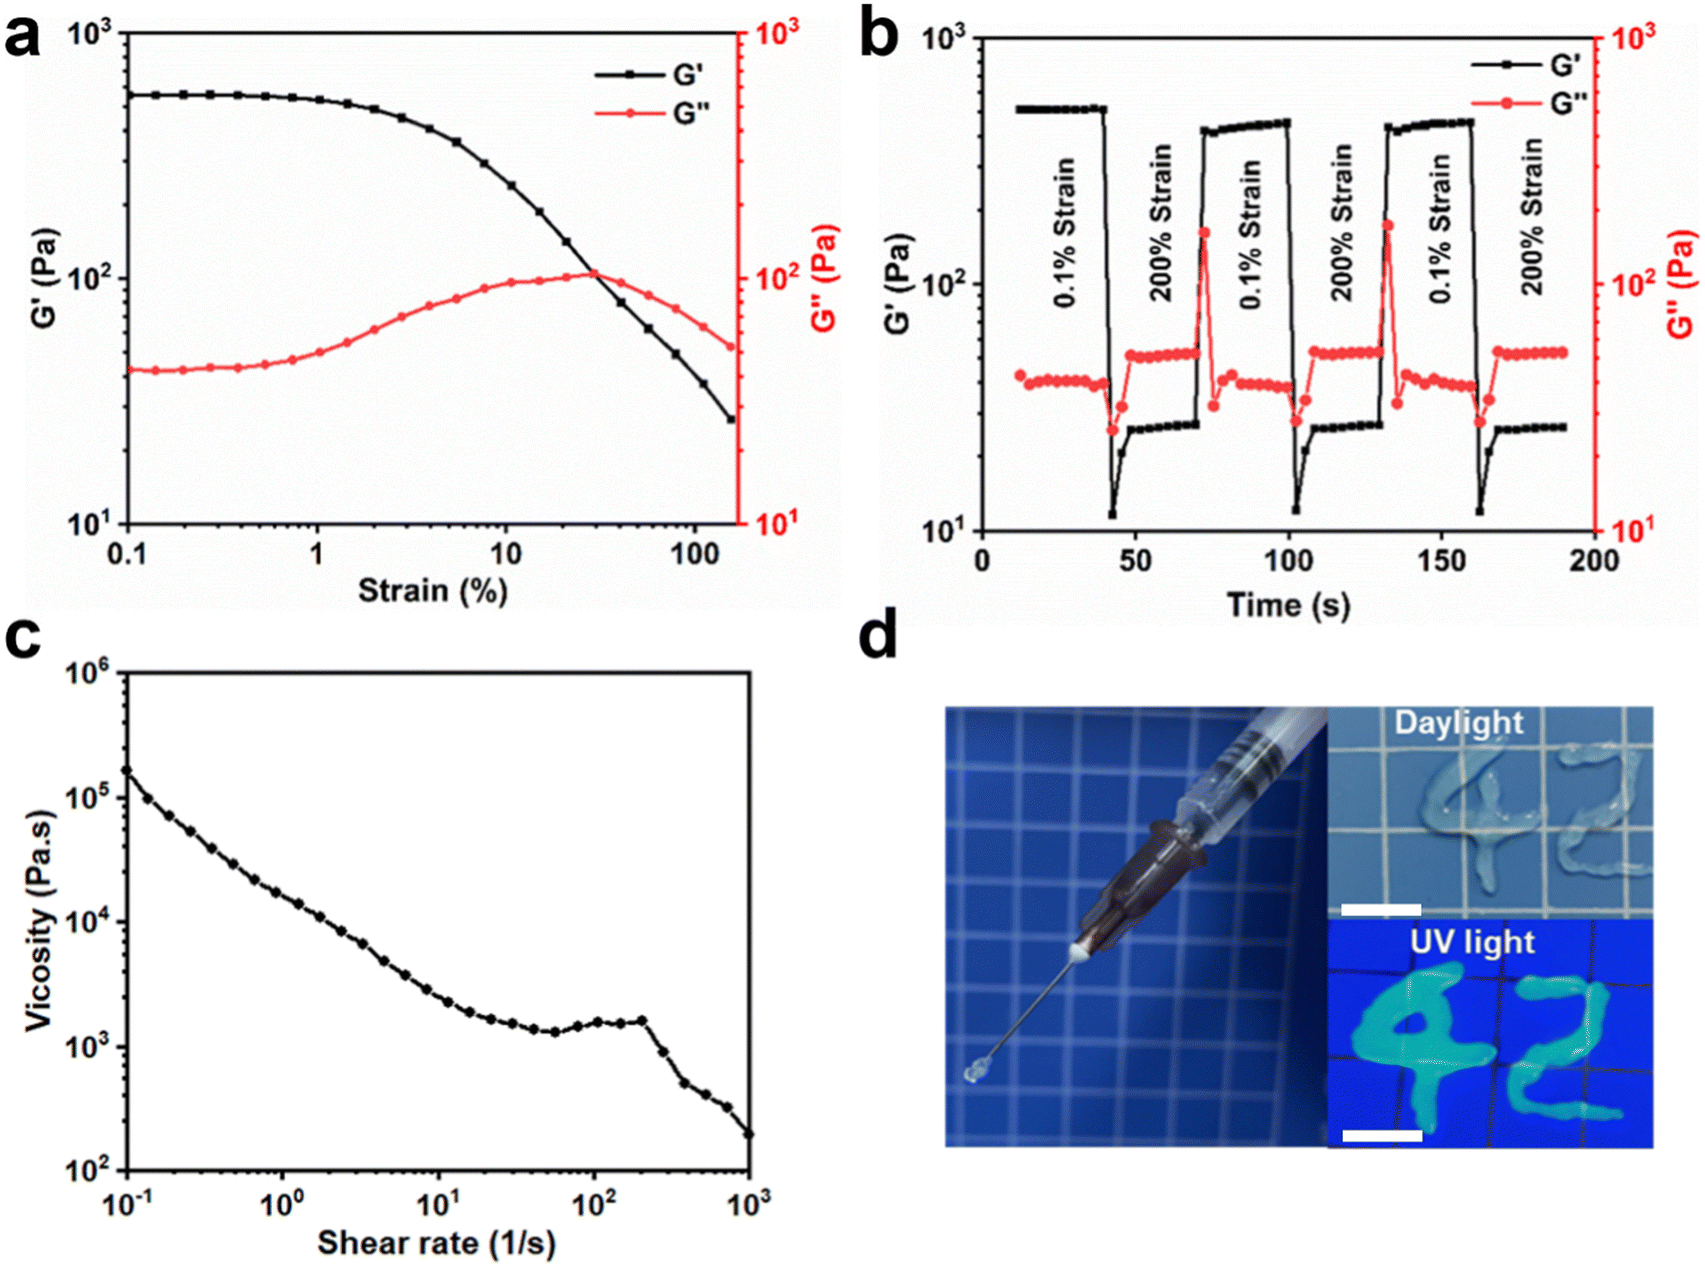
Time scans were performed for three different PU-OD hydrogels to initially evaluate their respective energy storage modulus (G′), loss modulus (G′′), and time stability and are shown in Fig. 2d (Gel1, Gel2, and Gel3 numbers correspond to Table 2). The test results showed that the modulus of Gel1 (ODex 300 μL/PU 200 μL) was moderate with excellent toughness and Gel1 chosen for the subsequent tests. In the scanning frequency range of 0.1–100 rad s−1, G′ was consistently higher than G′′, indicating that the hydrogel possessed an elastic and stable structure (Fig. 2e).
The cross-linked structure of PU-OD hydrogels was derived from the acylhydrazone bonds. Since this reversible dynamic bond could be broken at large strains and re-linked at small strains, the hydrogel exhibited excellent self-healing ability. It was found that the strain at the intersection of G′ and G′′ was about 30% through a strain scan at a fixed frequency of 1 Hz (Fig. 3a), indicating the hydrogel transformed to the sol state when the strain was greater than 30%. Normally, a lower transition point at this point indicates better injectability of the gel.
 | ||
| Fig. 3 (a) Strain scanning (0.1–150%) of PU-OD hydrogel. (b) Alternating strain scanning (0.1–200%) of PU-OD hydrogel. (c) The shear viscosity change of PU-OD hydrogel with shear rate. (d) PU-OD hydrogel can be injected through a syringe. Scale bar = 1 cm. | ||
Based on the results of the strain scans, the sample was tested with alternating strain scans between 0.1% and 200% (Fig. 3b). When the strain was increased to 200%, the PU-OD hydrogel energy storage modulus decreased from approximately 500 Pa to approximately 20 Pa due to the disruption of the gel structure. When the strain was reduced to 0.1%, the energy storage modulus quickly recovered to near the initial value, indicating that the network structure of the hydrogel was restored. After three cycles of alternating strains, the hydrogel showed no visible change in energy storage and loss modulus, showing excellent self-healing ability.
The shear viscosity of the hydrogel decreased as the shear rate increased from 0.1 s−1 to 1000 s−1 (Fig. 3c), indicating that the hydrogel could be injected by shear thinning. Meanwhile, after mixing ODex solution and PU emulsion in the syringe to form the hydrogel, it could be easily injected into various shapes, such as “42”, through a 26 G (0.45 mm) needle (Fig. 3d), which again proved its good maneuverability in clinical applications. In general, the Gel 1 has the most uniform three-dimensional pore structure, optimal mechanical properties, and a moderate gelation time.
3.3. Drug delivery performance of PU-OD hydrogels
Dox·HCl is an anthracycline antibiotic that is used as a chemotherapeutic agent for many types of tumors effectively. However, when the drug is administered via injection into the bloodstream, high doses may occasionally lead to severe side effects. Using hydrogel-encapsulated drugs for local administration not only reduces the damage to other tissues but may also enhance the therapeutic effect. The maximum excitation wavelength of Dox·HCl is 488 nm, and the emission spectrum of the PU-OD hydrogel is in the range of 400–700 nm. Thus, fluorescence resonance transfer could occur between PU-OD and Dox-HCl when the former was loaded with the latter. As shown in Fig. 4a, from 12.5 to 100 μg mL−1, the maximum fluorescence emission intensity of the drug-loaded hydrogel decreased significantly in a dose-dependent manner with the increase of Dox·HCl content, while the fluorescence emission peak of Dox·HCl at about 556 nm became more obvious. And there was a gradual increase in the ratio between the fluorescence intensity of Dox·HCl and that of the hydrogel. This indicated that there was a fluorescence energy transfer from PU-OD to Dox·HCl, which leads to a decrease in the fluorescence intensity of the hydrogel. Meanwhile, as the concentration of Dox·HCl in the hydrogel increased, the fluorescence emission of Dox·HCl was quenched due to the AIQ effect,38 resulting in a decrease in its fluorescence intensity. The fluorescence intensity of the drug-loaded gel at the emission wavelength of 495 nm was fitted and the exponential equation y = 107e−0.01x was obtained, where y is the fluorescence intensity, x is the concentration of Dox·HCl, and R2 = 0.9549 (Fig. 4b). This exponential relationship in the drug-loaded gel indicated a potential application in monitoring drug release.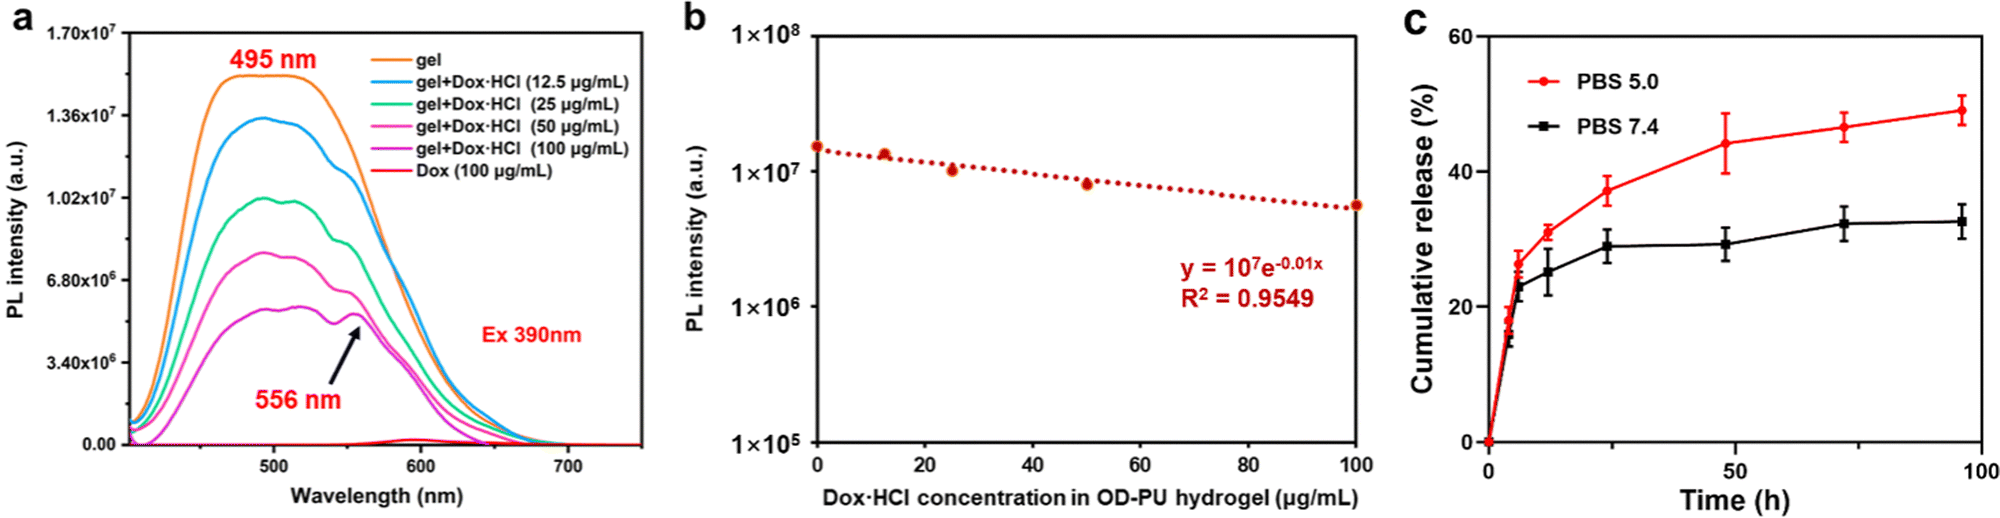 | ||
| Fig. 4 (a) Fluorescence emission spectra of different concentrations of Dox·HCl added to the hydrogel, λex = 390 nm. (b) Fitted exponential equation of the fluorescence intensity of the hydrogel at 495 nm, y = 107e−0.01x and R2 = 0.9549. (c) Drug release profiles of PU-OD hydrogels at different pH (n = 3). | ||
The acylhydrazone bonded cross-linked structures of the PU-OD hydrogel granted its potential for application in controlled drug release. As shown in Fig. 4c, the release behavior of this hydrogel exhibited significant pH sensitivity. The release rate of Dox·HCl in PBS with pH 7.4 was low, with a cumulative release rate of only about 30% in 96 h. In PBS with pH 5.0, the drug release rate increased and the cumulative drug release content increased significantly, with a total cumulative release of approximately 50% in 96 h, showing good pH responsiveness. It was believed that the acylhydrazone bond has a faster dynamic exchange frequency under acidic conditions, which promotes the drug release.
3.4. Biocompatibility of PU-OD hydrogels
Biocompatibility of implant materials is a necessary prerequisite for their practical application generally determined by cytotoxicity in vitro firstly. Materials with toxic damage to cells are prone to local infection after implantation, and in serious cases, cause tissue necrosis and threaten patients’ life.50 The hydrogel is immersed in the body fluid environment after implantation usually. Therefore, the cytotoxicity of hydrogel extracts in vitro can be used to evaluate the biocompatibility of implanted materials in vitro. The cell viability of the diluted gel extracts was all greater than 80% after co-culture with the cells in 1 and 3 days indicating non-toxicity in vitro (Fig. 5a). We believed that the 80% cell viability within an acceptable range may be due to the degradation of hydrogel in DMEM medium which released some components such as the end-capping reagent adipic dihydrazide and salts. After 3 days of culturing with the material extract, the cells were further observed by live-dead staining using CLSM (Fig. 5b). It could be seen that there were no dead cells under the view of both the material group and the blank control group. Both results illustrated the good biocompatibility of the PU-OD hydrogel without cell toxicity.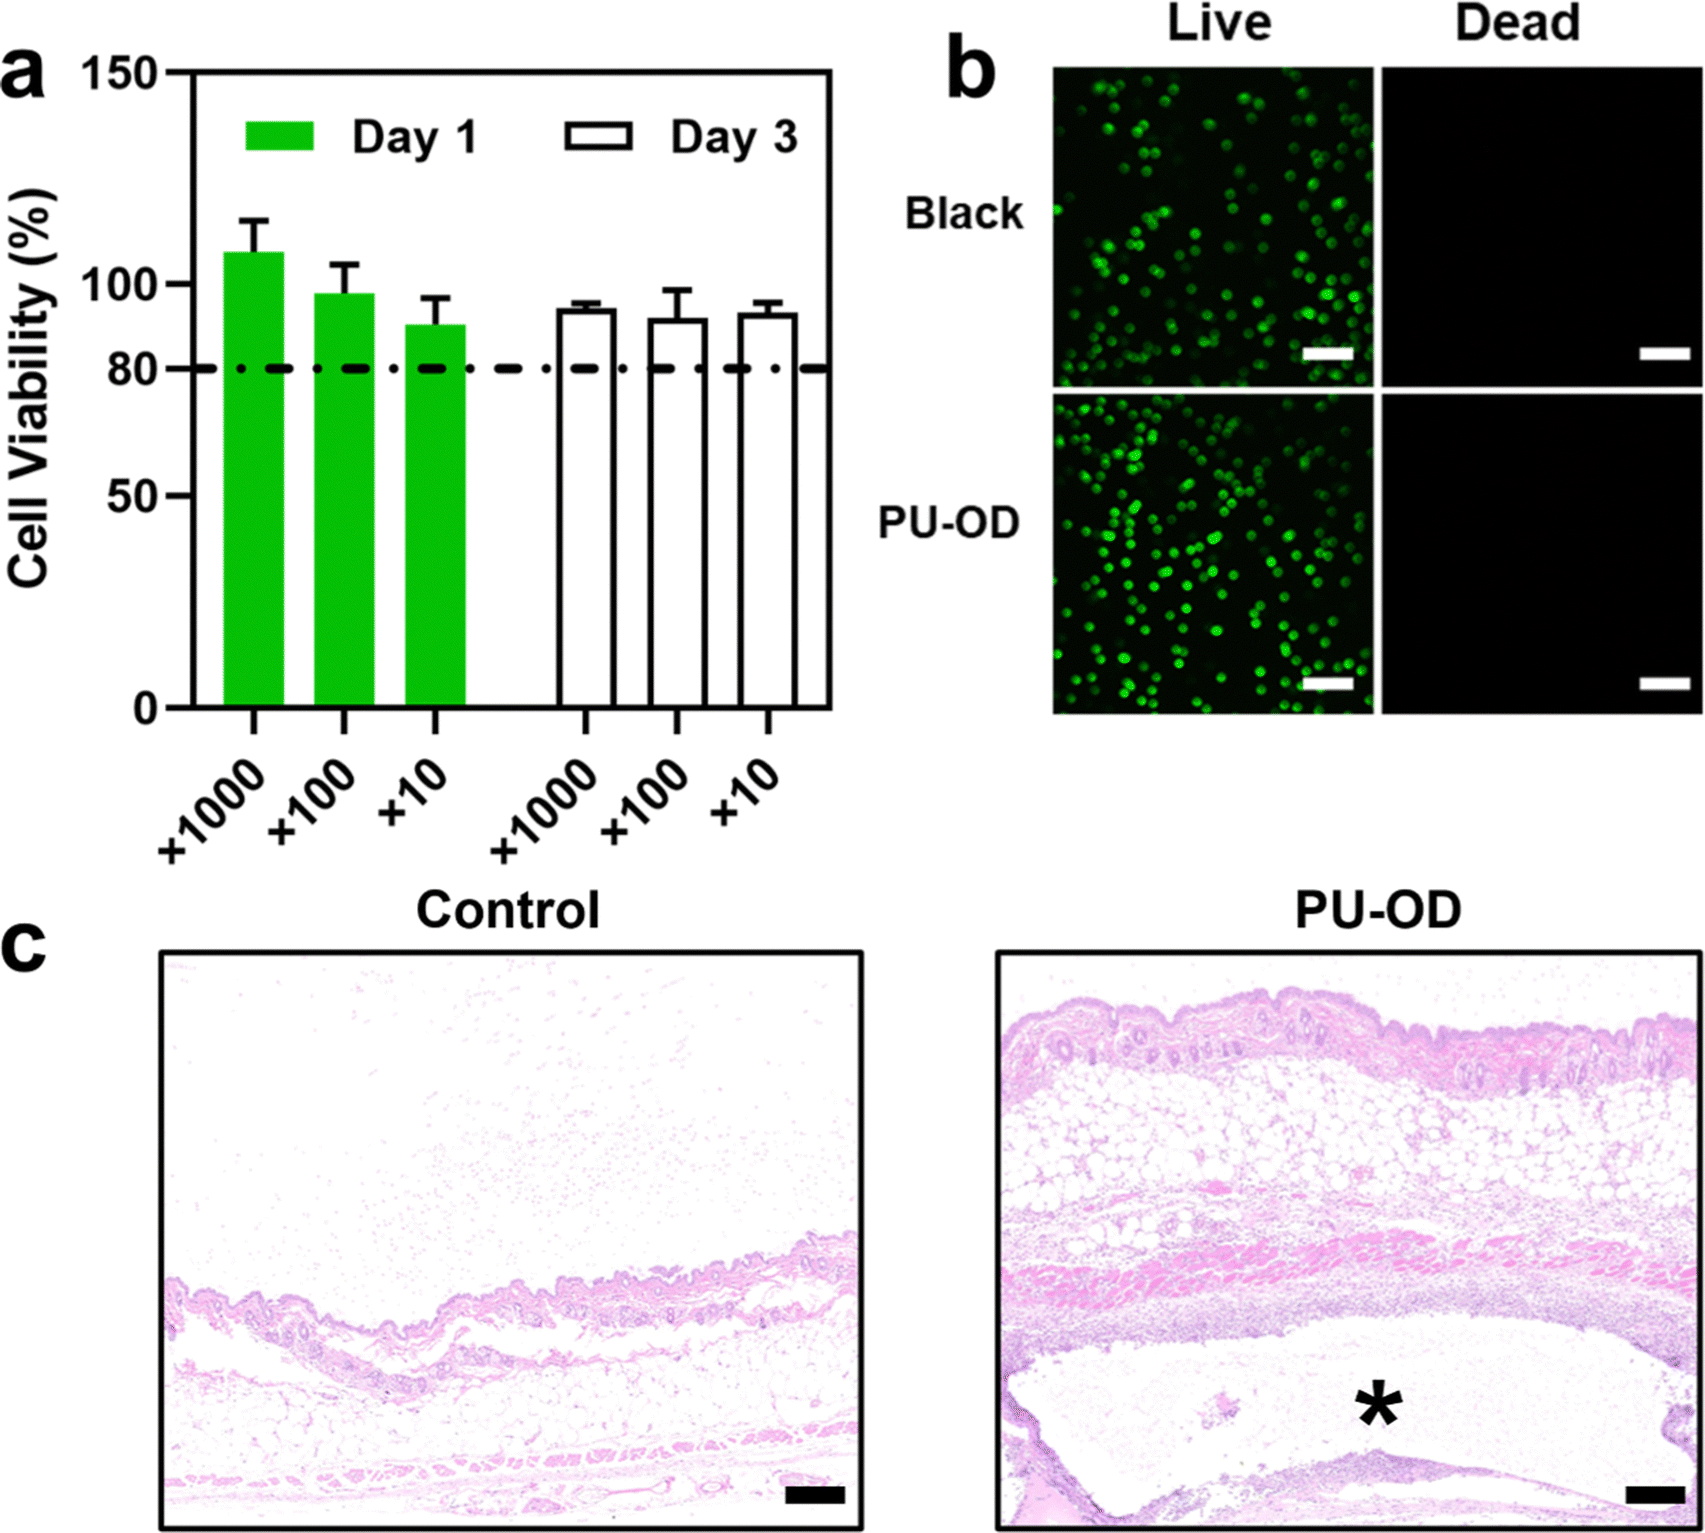 | ||
| Fig. 5 (a) Cell viability after 1 and 3 days of co-culture with PU-OD hydrogel extract (n = 3). (b) Live/dead staining of L929 cells after co-culture with hydrogel extract for 3 days, scar bar = 200 μm. (C) H & E staining of mouse skin tissue after 3 days, * represents the area where the PU-OD hydrogel located. Scale bar = 200 μm. | ||
Furthermore, the inflammatory reaction of the skin tissues at the gel injection site in vivo after 3 days post-injection was assessed by H & E staining. In Fig. 5c, as a foreign implantation of PU-OD hydrogel, a mild inflammatory reaction without bacteria participation occurred. Only some inflammatory cells appeared around the hydrogel section, while the areas slightly away from the material were similar to the normal skin tissue of the control group. Therefore, we could infer that the PU-OD hydrogel would not cause severe inflammatory reactions after implantation and possessed good biocompatibility in vivo, respectively.
3.5. In vitro degradation of PU-OD hydrogels
Monitoring the degradation of hydrogels is important for their implanting applications because the degradation rate of the hydrogels should match the tissue regeneration rate to avoid tissue collapse or excessive regeneration. The degradation behavior of the hydrogel was firstly evaluated using a traditional weighing method. Since the cross-linked structure of the PU-OD gel was constructed by pH-responsive acylhydrazone bonds, the degradation of the gel was tested at PBS with pH 7.4 and 5.0, respectively. At pH 5.0, the hydrogel degradation rate was initially fast, then slowed down, and finally degraded by nearly 40% after 14 days (Fig. 6a). In pH 7.4, the hydrogel degradation rate was more moderate, with less than 30% degradation in 14 days. Particularly, in the initial stage of degradation, the hydrogel degradation rate was significantly higher in pH 5.0 than in pH 7.4.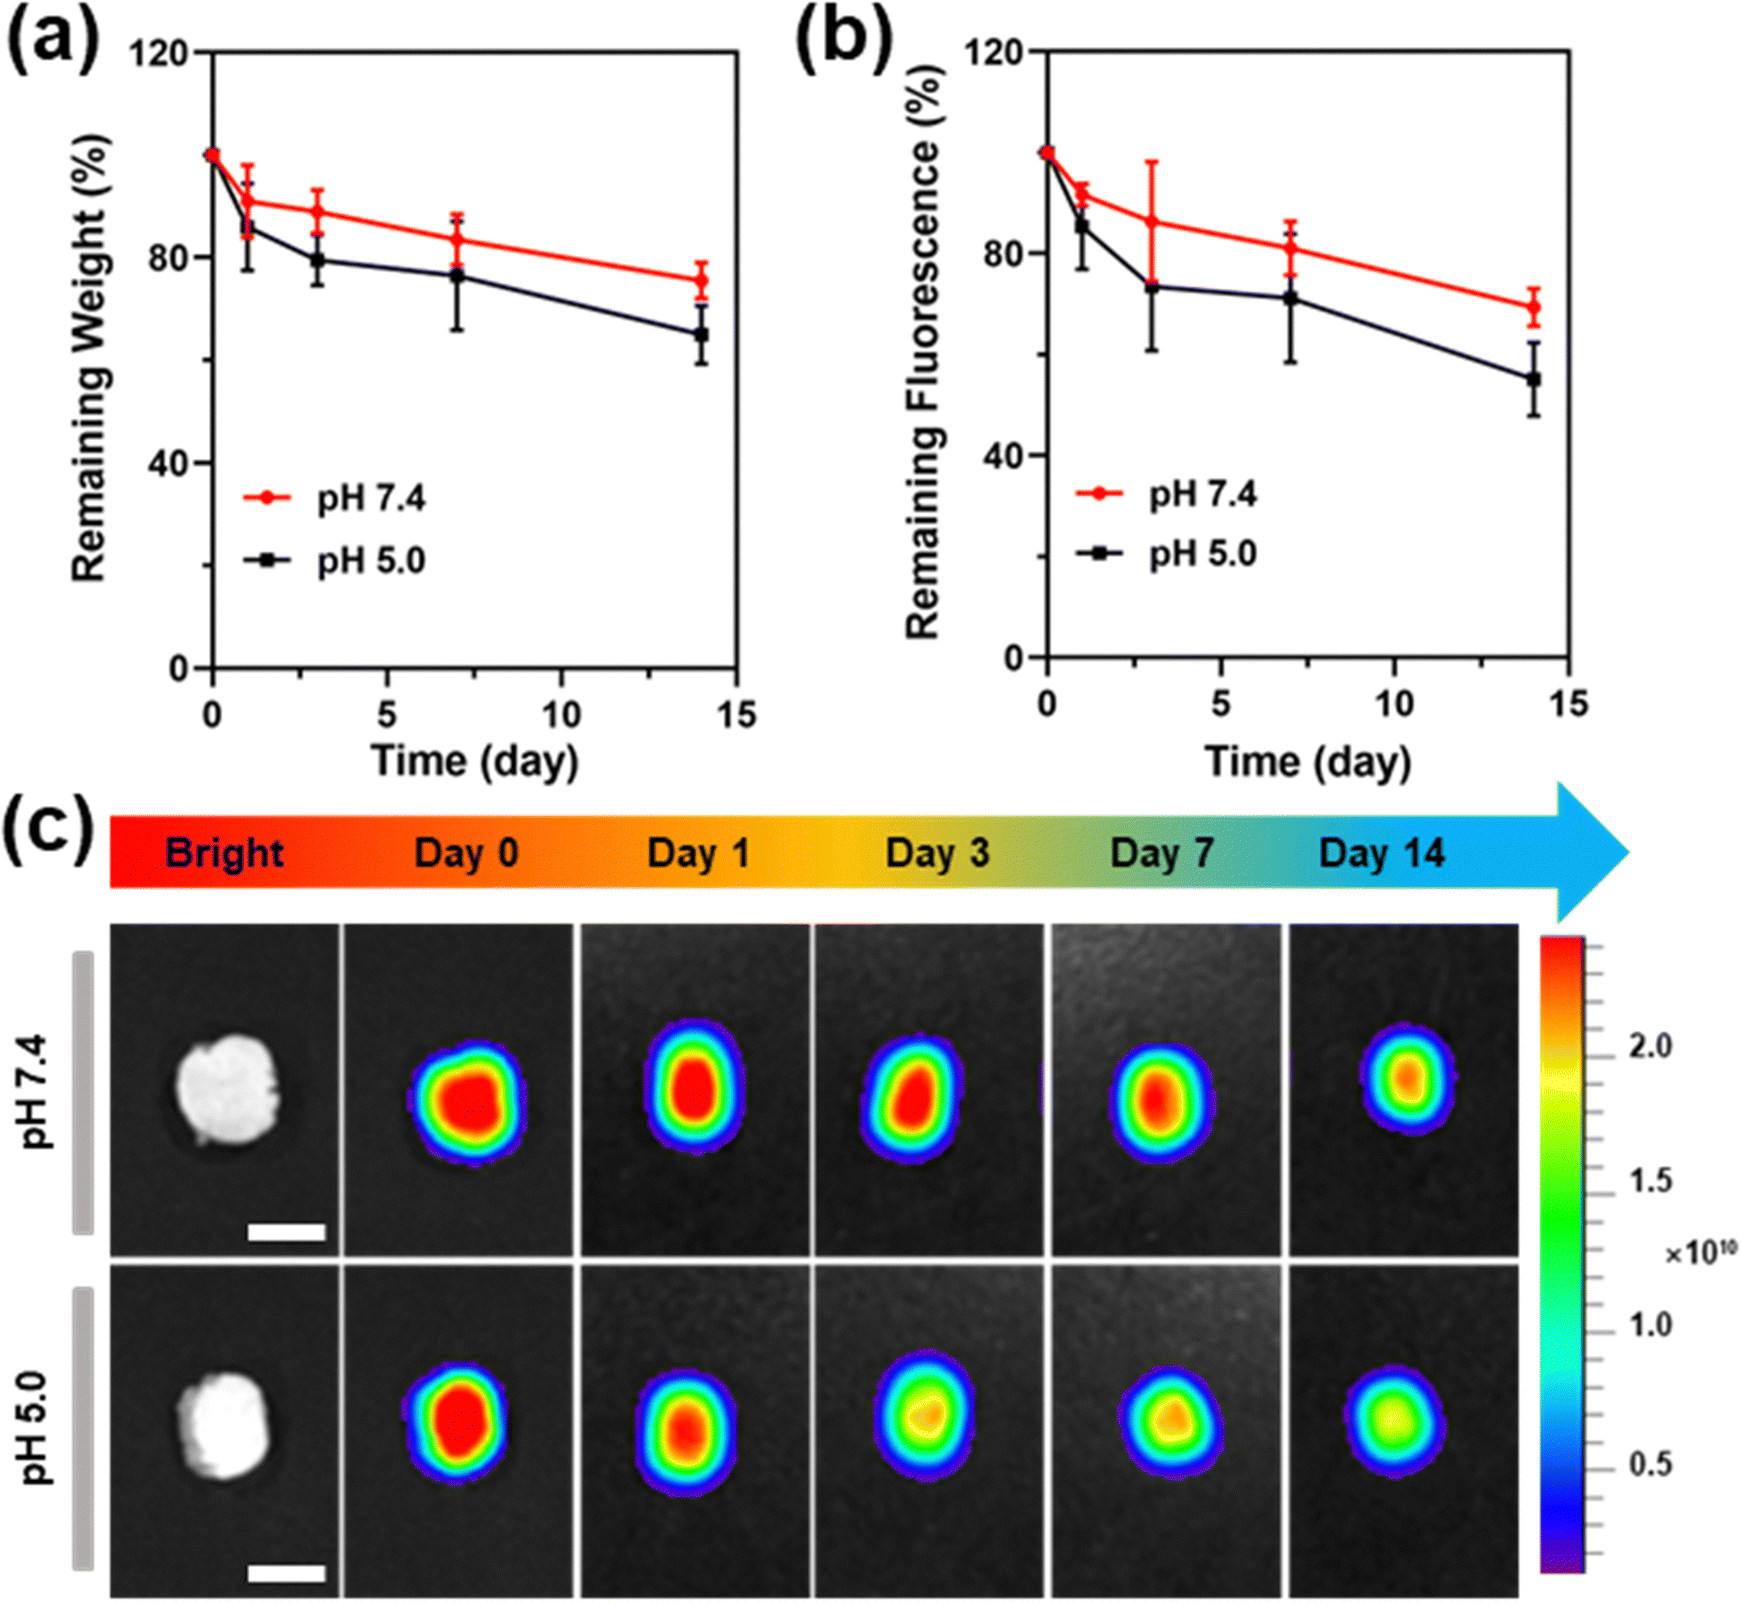 | ||
| Fig. 6 (a) Remaining weight ratio of PU-OD hydrogels over time (n = 3). (b) Remaining fluorescence ratio of PU-OD hydrogels over time, normalized by the initial fluorescence intensity (n = 3). (c) Fluorescence imaging pictures of PU-OD at different degradation time points. Scale bar = 1 cm. | ||
Next, the degraded hydrogel was analyzed by fluorescence imaging. In Fig. 6b and c, the fluorescence of the hydrogel gradually decreased from the center to the surrounding area. As the degradation time increased, the fluorescence at the central part of the remaining hydrogel also decreased but was always higher than the surrounding fluorescence intensity. There was no significant change in fluorescence signal of hydrogels degraded in pH 7.4. In contrast, the degraded hydrogels in pH 5.0 showed a greater decrease in fluorescence intensity with time and were always significantly lower than pH 7.4, which was mostly consistent with the results obtained from the weighing method. The quantitative analysis of the fluorescence of both groups showed that the trend of fluorescence change had the same consistent trends to that of their weight change. In the pH 7.4 group, fluorescence loss was about 30%, while fluorescence loss was about 45% in pH 5.0. The above findings demonstrate the reliability and potential applications of fluorescence-based analysis for hydrogel degradation.
From the fluorescence analysis, it was shown that the fluorescence intensity in the central region of the gel changed most significantly as the hydrogel underwent degradation, so the lyophilized hydrogels were quenched from the central region in liquid nitrogen and then observed by SEM. The cross-sectional morphologies of the central part of the degraded hydrogels are shown in Fig. 7. Within 14 days, the overall three-dimensional network structure inside the hydrogel was still maintained, but the pore distribution was not as uniform as the initial state in Fig. 2c. With the increase in degradation time, the pore structure of both pH 7.4 and pH 5.0 hydrogels gradually broke down. The pore size of the hydrogels in pH 5.0 after 14 days of degradation increased to about 250 μm. And the pore change of the hydrogel was faster in pH 5.0 compared to pH 7.4. The destabilization of acylhydrazone bonds or breakage of polyurethane chains upon immersion in pH 5.0 resulted in the disruption of cross-linked structures and enhanced pore connectivity, leading to enlarged pores. This degradation in hydrogel caused freer and less restricted TPE-containing chain segments of polyurethane, which ultimately led to a decrease in fluorescence intensity.
 | ||
| Fig. 7 Cross-sectional morphology of PU-OD hydrogels immersed in PBS during degradation over 14 days at various pH levels. Scale bar = 200 μm. | ||
3.6. In vivo degradation of PU-OD hydrogels
In vivo degradation monitoring of PU-OD hydrogels was further assessed. The protocol of the in vivo PU-OD hydrogel degradation implanted on the back of mice by subcutaneous injection is illustrated in Fig. 8a. The degradation of hydrogel was then monitored in real time and non-invasively for different time points. Firstly, the yellow-green fluorescence could be clearly seen by irradiating the injection site on the back of the mice through a UV flashlight (Fig. 8b). As the degradation time increased, the range of gel fluorescence was gradually reduced. After the gel was injected into the body for 96 h, only a tiny fluorescent area could be observed under the UV flashlight. Meanwhile, in vivo fluorescence imaging was performed on mice to observe the fluorescence signal of the hydrogel at different times of degradation. The fluorescence imaging can detect a wider range of fluorescence signal than that of the gel observed by eye directly under UV (Fig. 8c). The area of fluorescence signal at the gel injection site gradually became smaller as the degradation time increased, similar to the trend observed by direct UV light. Quantitative analysis of the fluorescence signal intensity in Fig. 8d showed that the remaining fluorescence after 96 h of in vivo degradation was about 20% of the fluorescence signal compared to the initial state. Afterwards, the hydrogels were harvested from the mice and weighed. Notably, the trend of hydrogel weight reduction was approximately similar to that of fluorescence intensity reduction (Fig. 8e), and the remaining weight was approximately 20% of the initial weight. Since the in vivo environment was more complex, the hydrogels degraded significantly faster in vivo than in vitro. The overall findings of this study demonstrate that the non-invasive fluorometric method for monitoring degradation of the injectable fluorescent PU-OD hydrogel exhibits a high level of agreement with the invasive weighing method. | ||
| Fig. 8 (a) Schematic diagram of monitoring the degradation of the hydrogel injected into the mice in vivo. (b) Photographs of the initial subcutaneously injected gel and the fluorescent gelation site at different times under UV light. (c) Photographs of the fluorescent signal of the gel for live imaging of mice. (d) Quantitative analysis of the fluorescent region during degradation (n = 4). (e) Remaining weight of the hydrogel after degradation in vivo (n = 4). Scale bar = 1 cm. | ||
4. Conclusion
An injectable fluorescent PU-OD hydrogel by cross-linking a fluorescent polyurethane emulsion with oxidized dextran via acylhydrazone bonds was successfully prepared. This hydrogel exhibited a uniform pore structure, suitable mechanical properties, and low toxicity both in vitro and in vivo. It can serve as a visual platform for drug loading, such as Dox·HCl, with the fluorescence intensity of the hydrogel varying according to the concentration of encapsulated Dox·HCl. Furthermore, the degradation behavior of the PU-OD hydrogel can be non-invasively and real-time monitored through changes in its own fluorescence intensity, which was validated using a weighing method. Therefore, this proposed fluorescent PU-OD hydrogel holds great potential for non-invasive monitoring applications that are convenient and less detrimental to the body or animals.Author contributions
X. Wang, Y. Ou, F. Luo, Z. Li, J. Li, and H. Tan designed the experiments. X. Wang, Y. Ou and F. Luo wrote the manuscript. X. Wang, Y. Ou, X.-F. Wang, L. Yuan and N. He performed the experiments, data collection and analysis. All authors discussed and revised the paper.Conflicts of interest
The authors declare no competing financial interest.Acknowledgements
This work was supported by the National Natural Science Foundation of China (51873117), the Sichuan Science and Technology Program (2022NSFSC0375) and the State Key Laboratory of Polymer Materials Engineering (sklpme2022-2-07).References
- Q. Peng, X. Sun, T. Gong, C.-Y. Wu, T. Zhang, J. Tan and Z.-R. Zhang, Acta Biomater., 2013, 9, 5063–5069 CrossRef CAS PubMed
.
- J. A. Burdick and W. L. Murphy, Nat. Commun., 2012, 3, 1269 CrossRef PubMed
- K. A. Mosiewicz, L. Kolb, A. J. Van Der Vlies, M. M. Martino, P. S. Lienemann, J. A. Hubbell, M. Ehrbar and M. P. Lutolf, Nat. Mater., 2013, 12, 1072–1078 CrossRef CAS PubMed
- G. Sun, Y. I. Shen, C. C. Ho, S. Kusuma and S. Gerecht, J. Biomed. Mater. Res., Part A, 2010, 93, 1080–1090 Search PubMed
- J. Wu, J. Liu, Y. Shi and Y. Wan, J. Mech. Behav. Biomed. Mater., 2016, 64, 161–172 CrossRef CAS PubMed
- M. Ma, Y. Zhong and X. Jiang, J. Mater. Chem. B, 2021, 9, 4567–4576 RSC
- C. J. Bettinger, J. P. Bruggeman, J. T. Borenstein and R. S. Langer, Biomaterials, 2008, 29, 2315–2325 CrossRef CAS PubMed
- A. Mahdavi, L. Ferreira, C. Sundback, J. W. Nichol, E. P. Chan, D. J. Carter, C. J. Bettinger, S. Patanavanich, L. Chignozha and E. Ben-Joseph, Proc. Natl. Acad. Sci. U. S. A., 2008, 105, 2307–2312 CrossRef CAS PubMed
- M. Yuan, B. Bi, J. Huang, R. Zhuo and X. Jiang, Carbohydr. Polym., 2018, 192, 10–18 CrossRef CAS PubMed
- B. Bi, M. Ma, S. Lv, R. Zhuo and X. Jiang, Carbohydr. Polym., 2019, 212, 368–377 CrossRef CAS PubMed
- S. M. Dorsey, M. Haris, A. Singh, W. R. Witschey, C. B. Rodell, F. Kogan, R. Reddy and J. A. Burdick, ACS Biomater. Sci. Eng., 2015, 1, 227–237 CrossRef CAS PubMed
- Y. Liang, A. Bar-Shir, X. Song, A. A. Gilad, P. Walczak and J. W. Bulte, Biomaterials, 2015, 42, 144–150 CrossRef CAS PubMed
- J. Liu, K. Wang, J. Luan, Z. Wen, L. Wang, Z. Liu, G. Wu and R. Zhuo, J. Mater. Chem. B, 2016, 4, 1343–1353 RSC
- K. Kim, C. G. Jeong and S. J. Hollister, Acta Biomater., 2008, 4, 783–790 CrossRef PubMed
- M. A. Rice, K. R. Waters and K. S. Anseth, Acta Biomater., 2009, 5, 152–161 CrossRef CAS PubMed
- L. Wang, B. Li, F. Xu, Y. Li, Z. Xu, D. Wei, Y. Feng, Y. Wang, D. Jia and Y. Zhou, Biomaterials, 2017, 145, 192–206 CrossRef CAS PubMed
- Y. Zhang, F. Rossi, S. Papa, M. B. Violatto, P. Bigini, M. Sorbona, F. Redaelli, P. Veglianese, J. Hilborn and D. A. Ossipov, Acta Biomater., 2016, 30, 188–198 CrossRef CAS PubMed
- D. Feng, Y. Song, W. Shi, X. Li and H. Ma, Anal. Chem., 2013, 85, 6530–6535 CrossRef CAS PubMed
- Q. Xing, X. Wang, X. Yan, X. Ren, W. Wang, X. Yan, J. Zhang, C. Cao, H. Lan and S. Xiao, Dyes Pigm., 2021, 188, 109232 CrossRef CAS
- Y. Zhao, B. Pang, J. Chen, L. Xiao, H. Liu, W. Lian, T. Sun, Y. Jiang and Q. Lin, Microchim. Acta, 2020, 187, 1–10 CrossRef PubMed
- R. Weissleder and M. J. Pittet, Nature, 2008, 452, 580–589 CrossRef CAS PubMed
- A. C. Grimsdale, K. Leok Chan, R. E. Martin, P. G. Jokisz and A. B. Holmes, Chem. Rev., 2009, 109, 897–1091 CrossRef CAS PubMed
- J. Xu, R. Yan, H. Wang, Z. Du, J. Gu, X. Cheng and J. Xiong, RSC Adv., 2018, 8, 6798–6804 RSC
- D. D. La, S. V. Bhosale, L. A. Jones and S. V. Bhosale, ACS Appl. Mater. Interfaces, 2017, 10, 12189–12216 CrossRef PubMed
- G.-j Liu, S.-n Tian, C.-y Li, G.-w Xing and L. Zhou, ACS Appl. Mater. Interfaces, 2017, 9, 28331–28338 CrossRef CAS PubMed
- B. Wang, S. Liu, X. Liu, R. Hu, A. Qin and B. Z. Tang, Adv. Healthcare Mater., 2021, 10, 2101067 CrossRef CAS PubMed
- J. Mei, Y. Hong, J. W. Lam, A. Qin, Y. Tang and B. Z. Tang, Adv. Mater., 2014, 26, 5429–5479 CrossRef CAS PubMed
- X. Cai and B. Liu, Angew. Chem., Int. Ed., 2020, 59, 9868–9886 CrossRef CAS PubMed
- Y. Hong, J. W. Lam and B. Z. Tang, Chem. Commun., 2009, 4332–4353 RSC
- Y. F. Wang, T. Zhang and X. J. Liang, Small, 2016, 12, 6451–6477 CrossRef CAS PubMed
- Z. Wang, J. Nie, W. Qin, Q. Hu and B. Z. Tang, Nat. Commun., 2016, 7, 12033 CrossRef PubMed
- L. Huang, H. Zhan and X. Jiang, Carbohydr. Polym., 2022, 293, 119739 CrossRef CAS PubMed
- M. Zhang, Z. Wang, P. Huang, G. Jiang, C. Xu, W. Zhang, R. Guo, W. Li and X. Zhang, Nanophotonics, 2020, 9, 2063–2075 CrossRef CAS
- R. Dimatteo, N. J. Darling and T. Segura, Adv. Drug Delivery Rev., 2018, 127, 167–184 CrossRef CAS PubMed
- R. Yegappan, V. Selvaprithiviraj, S. Amirthalingam and R. Jayakumar, Carbohydr. Polym., 2018, 198, 385–400 CrossRef CAS PubMed
- W. Zhang, X. Liu, P. Li, W. Zhang, H. Wang and B. Tang, TrAC, Trends Anal. Chem., 2020, 123, 115742 CrossRef CAS
- P. Wu, X. Wang, Z. Wang, W. Ma, J. Guo, J. Chen, Z. Yu, J. Li and D. Zhou, ACS Appl. Mater. Interfaces, 2019, 11, 18691–18700 CrossRef CAS PubMed
- S. S. Liow, Q. Dou, D. Kai, Z. Li, S. Sugiarto, C. Y. Y. Yu, R. T. K. Kwok, X. Chen, Y. L. Wu and S. T. Ong, Small, 2017, 13, 1603404 CrossRef PubMed
- C. Wang, Y. Xue, H. Tian, Z. Zhao, S. Shen, L. Fang, R. Cui, J. Han and B. Zhu, J. Polym. Sci., 2022, 60, 2383–2394 CrossRef CAS
- H.-C. Wu, Y. Feng, X.-Y. Song, C.-Y. Song, J.-L. Chen, Y.-C. Wang, X.-L. He, R.-C. Liang, J.-H. Li and H. Tan, Chin. J. Polym. Sci., 2022, 40, 491–503 CrossRef CAS
- C.-X. Tian, T. Zhang, Y.-Q. Song, H. Ming, P.-Q. Liu, M.-J. Jiang, F. Luo, J.-H. Li, H. Tan and Q. Fu, Chin. J. Polym. Sci., 2022, 40, 1389–1401 CrossRef CAS
- J.-J. Hu, M. Wang, X.-X. Lei, Y.-L. Jiang, L. Yuan, Z.-J. Pan, D. Lu, F. Luo, J.-H. Li and H. Tan, ACS Appl. Mater. Interfaces, 2022, 14, 42827–42840 CrossRef CAS PubMed
- M. Wang, J. Hu, Y. Ou, X. He, Y. Wang, C. Zou, Y. Jiang, F. Luo, D. Lu and Z. Li, ACS Appl. Mater. Interfaces, 2022, 14, 17093–17108 CrossRef CAS PubMed
- F. Zhang, C. Hu, Q. Kong, R. Luo and Y. Wang, ACS Appl. Mater. Interfaces, 2019, 11, 37147–37155 CrossRef CAS PubMed
- M. Ding, N. Song, X. He, J. Li, L. Zhou, H. Tan, Q. Fu and Q. Gu, ACS Nano, 2013, 7, 1918–1928 CrossRef CAS PubMed
- S. Wendels and L. Avérous, Bioact. Mater., 2021, 6, 1083–1106 CrossRef CAS PubMed
- M. Cao, S. Lu, N. Wang, H. Xu, H. Cox, R. Li, T. Waigh, Y. Han, Y. Wang and J. R. Lu, ACS Appl. Mater. Interfaces, 2019, 11, 16357–16366 CrossRef CAS PubMed
- Y. Ou, X. Wang, N. He, X. Wang, D. Lu, Z. Li, F. Luo, J. Li and H. Tan, J. Mater. Chem. B, 2023, 11, 2266–2275 RSC
- J. Maia, L. Ferreira, R. Carvalho, M. A. Ramos and M. H. Gil, Polymer, 2005, 46, 9604–9614 CrossRef CAS
- M. Zhang, P. Lin, X. Song, K. Chen, Y. Yang, Y. Xu, Q. Zhang, Y. Wu, Y. Zhang and Y. Cheng, J. Polym. Sci., 2022, 60, 1511–1520 CrossRef CAS
Footnote |
| † Electronic supplementary information (ESI) available. See DOI: https://doi.org/10.1039/d3tb01488f |
| This journal is © The Royal Society of Chemistry 2023 |