
PEGylation of a shell over core–shell MOFs—a novel strategy for preventing agglomeration and synergism in terms of physicochemical and biological properties†
Nisha G.
Pillai
a,
Archana
K.
a,
Kyong Yop
Rhee
*b and
Asif
A.
 *a
*a
aDepartment of Chemistry, University College, Research Centre, University of Kerala, Thiruvananthapuram, Kerala 695034, India. E-mail: asifibnuazeez@gmail.com; Tel: +91 9846909077
bIndustrial Liaison Research Institute, Department of Mechanical Engineering, College of Engineering, Kyung Hee University, 446-701 Yongin, Republic of Korea. E-mail: rheeky@khu.ac.kr; Fax: +82 31 202 6693; Tel: +82 31 201 2565
First published on 16th October 2023
Abstract
We demonstrate a new strategy of PEGylation over core–shell MOFs of HKUST-1 and Cu-MOF-2 by a solvothermal method. The novel synthesized PEGylated core–shell MOFs has synergistic enhancement in terms of physicochemical and biological properties. FTIR spectroscopy and XRD analysis described the bonding characteristics of the double-shelled–core MOFs PEG@HKUST-1@CuMOF-2 and PEG@CuMOF-2@HKUST-1. XPS and EDAX spectroscopy confirmed the structural features of the PEG@core–shell MOFs. The as-synthesized PEG-modified core–shell MOFs showed a readily identifiable morphology with a reduction in particle size. The significant observation from SEM and TEM was that agglomeration disappeared completely, and the morphology of individual core–shell MOFs was clearly revealed. BET analysis provided the surface characteristics of MOF compounds. The chemical states of frameworks were established by XPS. The designed PEG-modified copper MOFs were evaluated for their activity against Gram-positive (Staphylococcus aureus, Enterococcus faecalis), Gram-negative (Escherichia coli and Klebsiella pneumoniae) bacterial species and activity against fungal species (Aspergillus niger and Candida albicans). This research work highlights a facile and synergistic approach to design promising biocompatible nano-dimensional core–shell MOFs for biological applications.
1. Introduction
Metal–organic frameworks (MOFs) are new class of hybrid porous materials. Usually, they are constructed from molecular building blocks (MBBs) of metal ions or metal clusters (inorganic nodes referred to as “secondary building units”) and organic linkers, which are connected through coordination bonds to form one-, two- or three-dimensional networks resembling zeolites in crystallinity and surface area.1–5 MOFs have attracted significant attention due to their porous structures and immensely tunable nature, which enables addressing demands such as carbon-dioxide capture,6,7 solar cells,8–10 water treatment,11 gas sensing,12,13 heterogeneous supramolecular catalysis,14 as well as separation and purification of liquid mixtures.15A combination of the features of polymers and crystalline MOFs gives rise to another new emerging class of MOFs: polymer metal–organic frameworks (Poly MOFs). The processability and stability of polymer ligands are used to coordinate with metal ions to form crystalline three-dimensional porous frameworks of Poly MOFs. Polymers can be combined with MOFs in diverse situations. For example, combinations are used in the preparation of: mixed-matrix membranes (in which polymers are co-blended with MOFs); composite materials (in which the chains of polymers are crosslinked with MOFs); core shell-like architectures (in which a layer of polymers is coated on the surface of MOF materials).16 Surface modification by polyethylene glycol (PEG, known as “PEGylation”) is a very important process in which PEG is covalently bonded to another large molecule for therapeutic applications. The flexible and biocompatible nature of PEG makes it suitable for various applications in biomedicine. PEGylation on the surface of MOFs improves their stability, solubility, biocompatibility, and permeability, thereby increasing their adsorption into normal tissue.17 MOFs have attracted attention for antibacterial and antifungal applications due to their designable structure and adjustable size, strong interaction with bacterial membranes, high specific surface area, continuous release of metal ions and high enzyme-like activity. The antifungal activity of MOFs has been less studied. MOFs are promising candidates as antibacterial agents due to their rapid and strong activity against bacteria.18
Among MOFs, core–shell MOFs are synthesized by growing a polymer or another MOF as a shell over the core MOF. This strategy provides synergistic properties and can find applications in biological and storage applications. Core–shell MOFs based on two different MOFs, in which one MOF is a core and other one is a shell, have been reported.19–21 PEGylation on this type of core–shell MOF provides a novel platform for the strategic combination of PEG and core–shell MOF to enhance physicochemical and biological properties synergistically. PEGylated core–shell MOFs are promising biocompatible nanocarriers for drug delivery. Herein, we discuss the synthesis of PEG@copper-based core–shell MOFs: PEG@HKUST-1@Cu-MOF-2 and Cu-MOF-2@HKUST-1. PEGylation was carried out with different concentrations (10%, 30% and 50%) to ascertain the effect of the polymer on the core–shell framework. Synthesized materials were characterized by Fourier transform infrared (FTIR) spectroscopy, powder X-ray diffraction (PXRD) analysis, scanning electron microscopy (SEM), energy-dispersive X-ray (EDAX) spectroscopy, X-ray photoelectron spectroscopy (XPS), transmission electron microscopy (TEM), Brunauer–Emmett–Teller (BET) calculations and thermogravimetric analysis (TGA). Copper frameworks, their core–shells and PEG-modified core–shell systems were screened for biological (e.g., in vitro antibacterial and antifungal) activities.
2. Experimental section
2.1. Materials
Cu(NO3)2·3H2O (97%, Nice Chemicals, India), trimesic acid (1,3,5-benzene tricarboxylic acid, Tokyo Chemical Industry, Japan), terephthalic acid (benzene-1,4-dicarboxylic acid, 98%, Sisco Research Laboratories, India), PEG 400 (Rankem Chemicals, India) and DMF (99%, Merck, USA) of analytical grade were used. All chemicals were used without further purification.2.2. Synthesis
The yield of the synthesized materials stated above was calculated and was found to be around 50% with respect to the initial precursor compounds. A schematic representation of the procedure followed for the synthesis of PEG@HKUST-1@Cu-MOF-2 and PEG@Cu-MOF-2@HKUST-1 is shown in Fig. 1.
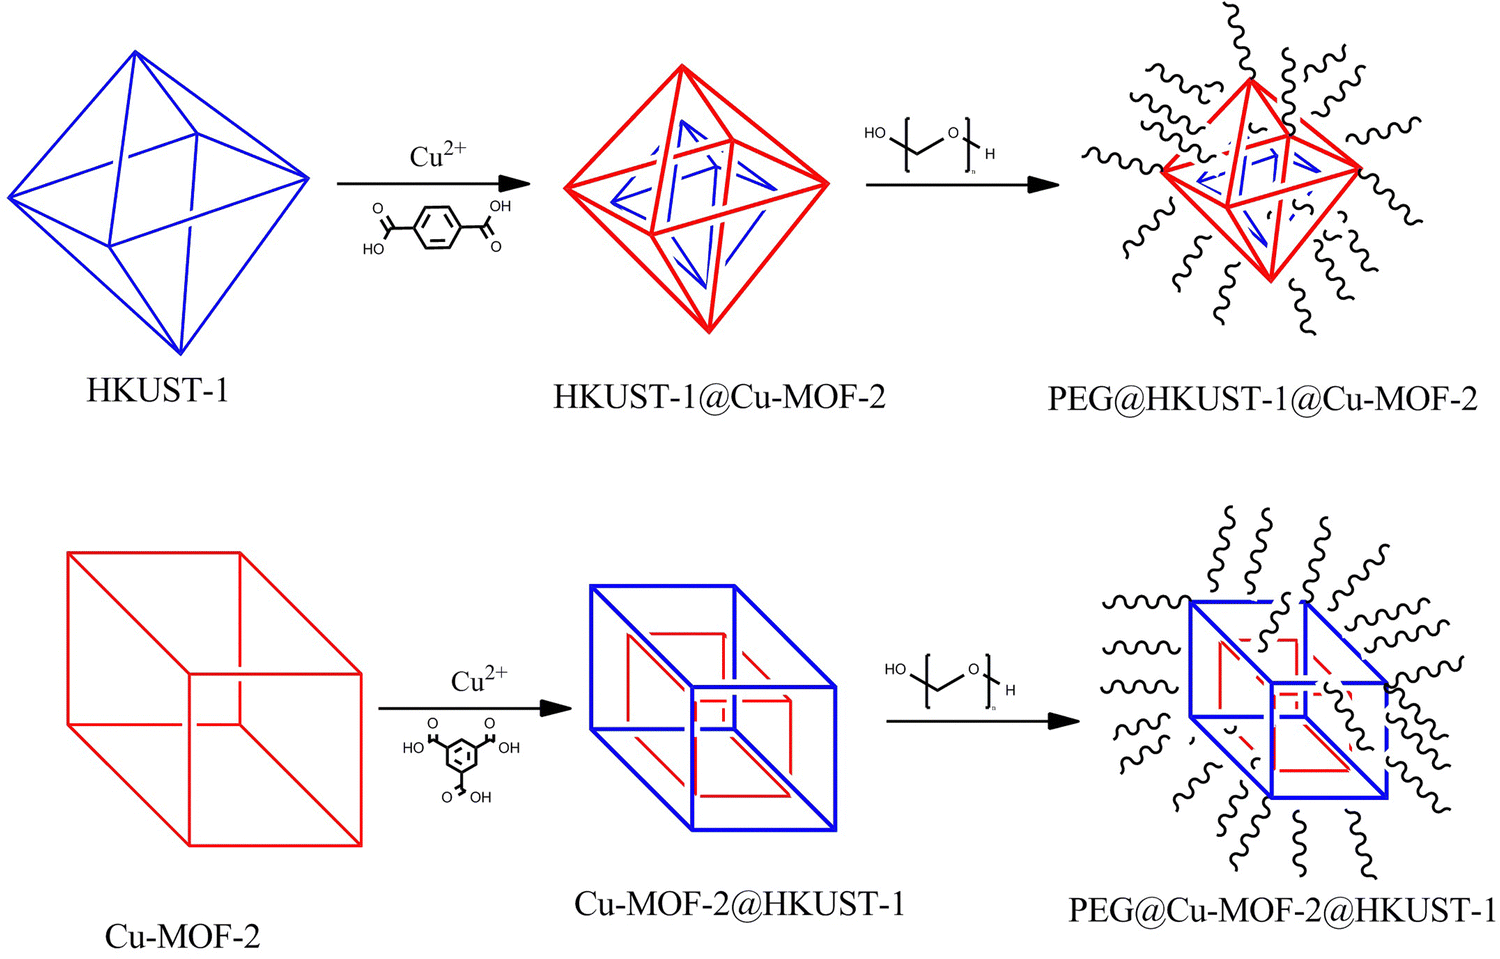 | ||
| Fig. 1 Procedure followed for the synthesis of PEG@HKUST-1@Cu-MOF-2 and PEG@ Cu-MOF-2@HKUST-1. | ||
2.3. Characterization
FTIR spectroscopy was recorded using a spectrophotometer (Presige-21, Schimadzu, Japan) employing KBr pellets with a spectral range of 4000–400 cm−1. PXRD patterns were recorded using a diffractometer (AXS D8 Advance, Bruker, USA) based on Cu Kα radiation (λ = 1.5406 Å) at high temperature. Diffraction data were obtained in the range of 2θ = 3–50° with a step size of 0.02°. Morphological studies were carried out using field emission-scanning electron microscopy (FE-SEM) with a Leo Supra 55 (Genesis 2000 model, Zeiss, Germany) system. High resolution-transmission electron microscopy (HR-TEM) images were taken using a JEM-2100F (Jeol, Japan) setup. TGA was done using a Diamond TG/DTG model (PerkinElmer, USA) with a programmable rate of 0.01–100 °C min−1 in an oxygen atmosphere. Surface-area analysis based on BET theory was undertaken using a Quantachrome instrument (Autosorb iQ station 1 model, Anton Paar, Austria) at 77 K after degassing of the sample at 200 °C for 5 h.The agar-well diffusion method was used to evaluate the antibacterial activity of compounds. The activity of test compounds was studied using two Gram positive (Staphylococcus aureus and Enterococcus faecalis) and two Gram-negative bacteria (Escherichia coli and Klebsiella pneumoniae). Mueller–Hinton agar M173 (15–20 mL; Himedia Laboratories, India) was poured on glass Petri plates of identical size and allowed to solidify. Wells of diameter 8 mm (20 mm apart from one another) were punched aseptically with a sterile cork borer in each plate. Standardized inoculums of each test organism (Microbial Type Culture Collection and Gene Bank, India) were spread uniformly on the surface of plates using a sterile cotton swab. The extract solution (50 μl) at the desired concentration was added to the wells. One well with gentamycin was maintained as the positive control and DMSO was used as the negative control. Then, the agar plates were incubated under suitable conditions depending upon the test microorganism. After incubation, a clear zone was observed. Inhibition of bacterial growth was measured in mm.
Prepared compounds were screened for antifungal activity using the well-diffusion method. The in vitro activity of test compounds was studied against two fungal species: Aspergillus niger and Candida albicans. Rose Bengal agar M842 (Himedia Laboratories) was used for determination of the susceptibility of fungal strains to antifungal agents. A sterile swab was used to distribute the fungal culture evenly over the Rose Bengal agar medium. The medium was dissolved completely by heating to boiling. The medium was sterilized by autoclaving at a pressure of 15 lb at 121 °C for 15 min and cooled to 45–50 °C. It was then mixed well and poured into a sterile Petri plate. Inoculums were procured from the Microbial Type Culture Collection and Gene Bank. Plates were allowed to dry for 15 min before use. The sample solution (40 μL and 80 μL) at the desired concentration from stock (10 mg mL−1) was added to two wells. One well with clotrimazole was the positive control. DMSO (solvent) used for sample preparation was the negative control. Plates were incubated at room temperature for 3 days, after which they were examined for inhibition zones. The strain codes for E. coli, S. aureus, K. pneumoniae, E. faecalis, A. niger and C. Albicans were 443, 87, 109, 436, 281 and 227, respectively.
4. Results and discussion
The presence of functional groups and their interaction in frameworks and polymers were analysed by FTIR spectroscopy. The FTIR spectra of parent Cu-MOFs and core–shell copper MOFs are given in Fig. S1 (ESI†) and those of PEG@core–shell MOFs are given in Fig. 2.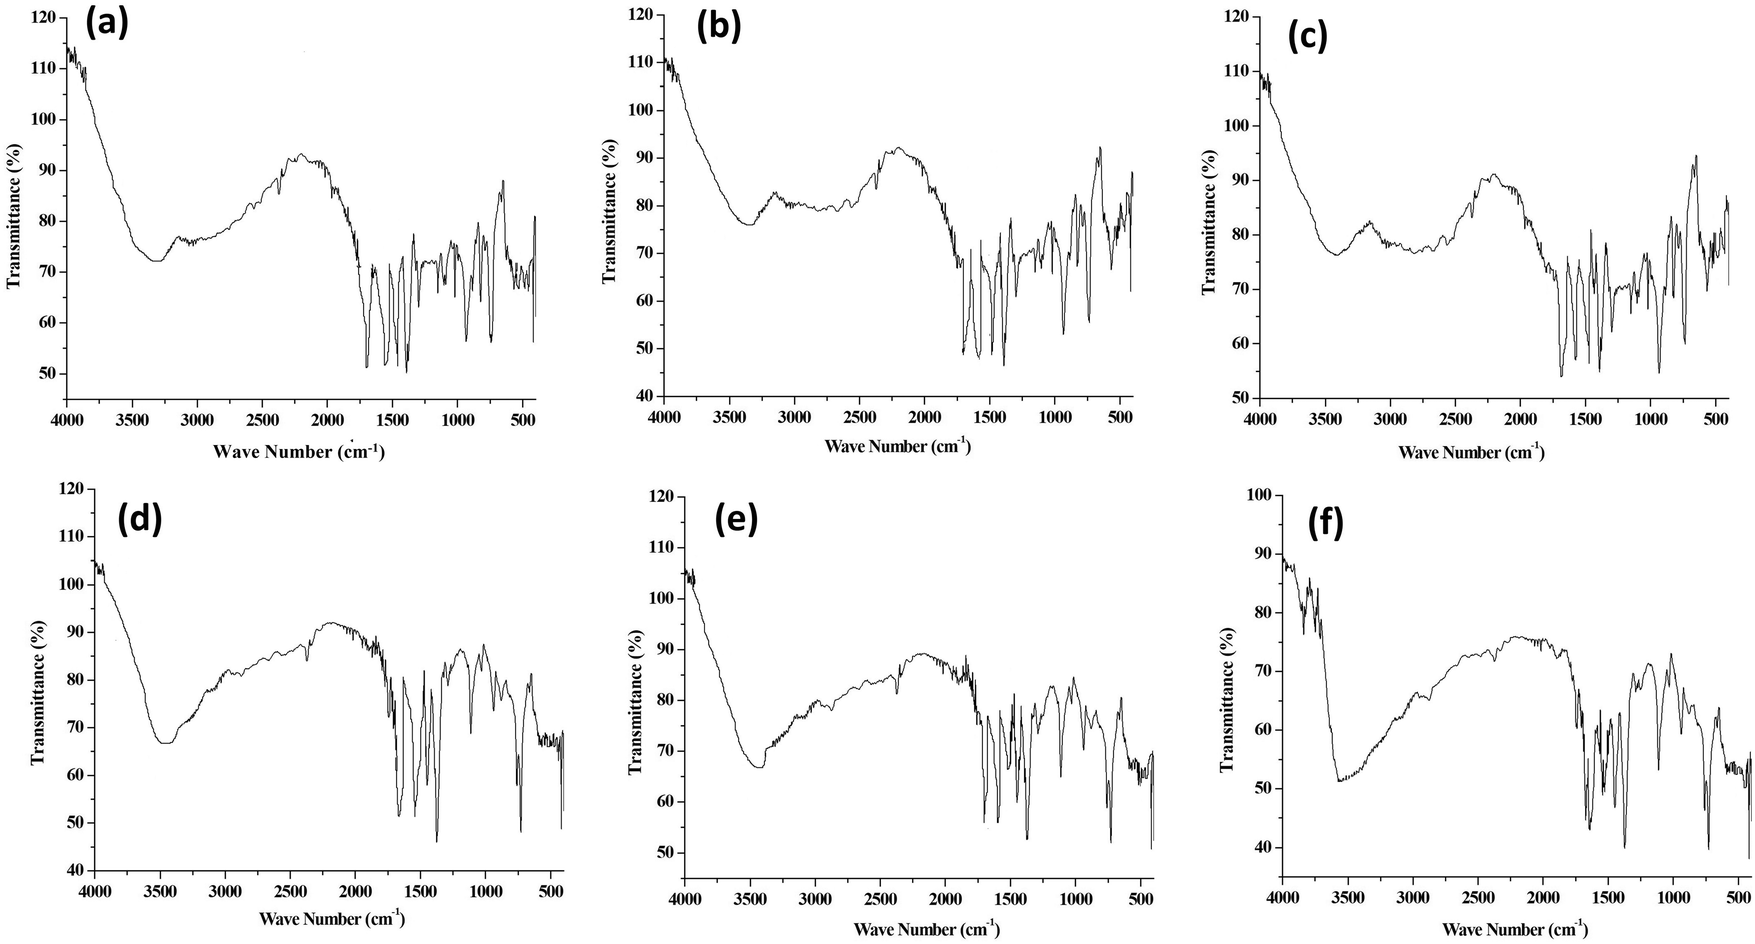 | ||
| Fig. 2 FTIR spectra of (a) 10% PEG@HKUST-1@Cu-MOF-2, (b) 30% PEG@HKUST-1@Cu-MOF-2, (c) 50% PEG@HKUST-1@Cu-MOF-2, (d) 10% PEG@Cu-MOF-2@HKUST-1, (e) 30% PEG@Cu-MOF-2@HKUST-1 and (f) 50% PEG@Cu-MOF-2@HKUST-1. | ||
The FTIR spectra of HKUST-1 (Fig. S1a, ESI†) showed a broad band at 3501 cm−1, which was associated with the –OH group in the framework. The peak at 2867 cm−1 corresponded to the C–H stretching vibration. The peak at 1537 cm−1 corresponded to the C![[double bond, length as m-dash]](https://www.rsc.org/images/entities/char_e001.gif) O stretching vibration. Peaks at 1643 cm−1 and 1369 cm−1 corresponded to the asymmetric and symmetric stretching vibrations of the COO− group.22 The strong peak observed at 1453 cm−1 was associated with the aromatic CC stretching vibration.23 The band at 1115 cm−1 corresponded to OC–OH stretching.24 Cu–O stretching was observed at 728 cm−1, which indicated that oxygen was coordinated to the center of copper metal.25
O stretching vibration. Peaks at 1643 cm−1 and 1369 cm−1 corresponded to the asymmetric and symmetric stretching vibrations of the COO− group.22 The strong peak observed at 1453 cm−1 was associated with the aromatic CC stretching vibration.23 The band at 1115 cm−1 corresponded to OC–OH stretching.24 Cu–O stretching was observed at 728 cm−1, which indicated that oxygen was coordinated to the center of copper metal.25
The FTIR peaks of Cu-MOF-2 (Fig. S1b, ESI†) in the range 3300–3600 cm−1 were due to the presence of acidic –OH groups in the framework. Bands at 1692 cm−1 and 1396 cm−1 corresponded to the asymmetric and symmetric stretching vibrations of the COO− group.26 The peak observed at 1566 cm−1 corresponded to the CO stretching vibration. The peak at 1509 cm−1 was due to phenyl-ring vibrations.26 The bands appearing in the region 700–900 cm−1 were due to the out-of-plane bending vibrations of aromatic C–H groups. The lattice vibrations of Cu–O were also observed in the region 600–800 cm−1.27 The peak observed at 742 cm−1 was due to Cu–O stretching, suggesting that copper metal was coordinated to an oxygen atom.
The core–shell HKUST-1@Cu-MOF-2 (Fig. S1c, ESI†) showed an –OH stretching peak in the range 3300–3600 cm−1. Peaks at 1692 cm−1 and 1369 cm−1 were associated with the asymmetric and symmetric stretching vibrations of the COO− group. The peak observed at 1572 cm−1 corresponded to the CO stretching vibration. The peak observed at 728 cm−1 was due to Cu–O stretching, suggesting that copper metal center in the core–shell structure was coordinated to an oxygen atom. Similarly in core–shell Cu-MOF-2@HKUST-1 (Fig. S1d, ESI†), the –OH stretching peak was observed at 3487 cm−1. Bands at 1650 cm−1 and 1369 cm−1 were associated with the asymmetric and symmetric stretching vibrations of the COO− group. The peak observed at 1558 cm−1 corresponded to the CO stretching vibration. The peak observed at 721 cm−1 was due to Cu–O stretching, suggesting that copper metal was coordinated to an oxygen atom. The existence of the Cu–O stretching bond indicated the presence of Cu-carboxylate linkage in the core–shell MOFs.
The O–H stretching vibration in 10% PEG@HKUST-1@Cu-MOF-2 (Fig. 2a) was observed at 3360 cm−1. The peak at 1692 cm−1 was due to the asymmetric stretching vibration of the carboxylate group. The peak at 1545 cm−1 was due to the CO stretching vibration of the carboxylate group. Bands at 1390 cm−1 and 1298 cm−1 were associated with the C–O stretching vibration of PEG, whose characteristic absorptions are those of a primary alcohol.28 The narrow absorption peak at 1023 cm−1 corresponded to the ether C–O–C bond in PEG (characteristic band for the determination of PEG content) of PEG@core–shell MOF.29 The Cu–O stretching vibration peak was slightly displaced to 735 cm−1 after the addition of PEG. The FTIR spectrum of 30% (Fig. 2b) and 50% PEG@HKUST-1@Cu-MOF-2 (Fig. 2c) was the same as that of the pattern exhibited by 10% PEGylated system.
The FTIR spectrum of 10% PEG@Cu-MOF-2@HKUST-1 (Fig. 2d) exhibited peaks at 3480 cm−1, 1643 cm−1, 1537 cm−1, and 1375 cm−1, which were associated with O–H stretching, stretching vibration of the carboxylate group, CO stretching vibration of the carboxylate group and C–O stretching vibration of the PEG chain, respectively. The presence of the ether C–O–C bond in PEG was identified by a narrow peak at 1023 cm−1. The Cu-O stretching vibration peak was slightly displaced to 735 cm−1 after addition of PEG. Both 30% and 50% PEG@Cu-MOF-2@HKUST-1 also exhibited similar peaks as those of 10% PEG@Cu-MOF-2@HKUST-1. These results suggested that after modification with PEG, the IR spectrum of PEG@core–shell MOFs did not show any obvious difference from that of their corresponding core–shell MOFs.
The PXRD patterns of parent MOFs and their core–shell MOFs are given in Fig. S2 (ESI†) and PEG@core–shell MOF systems are illustrated in Fig. 3.
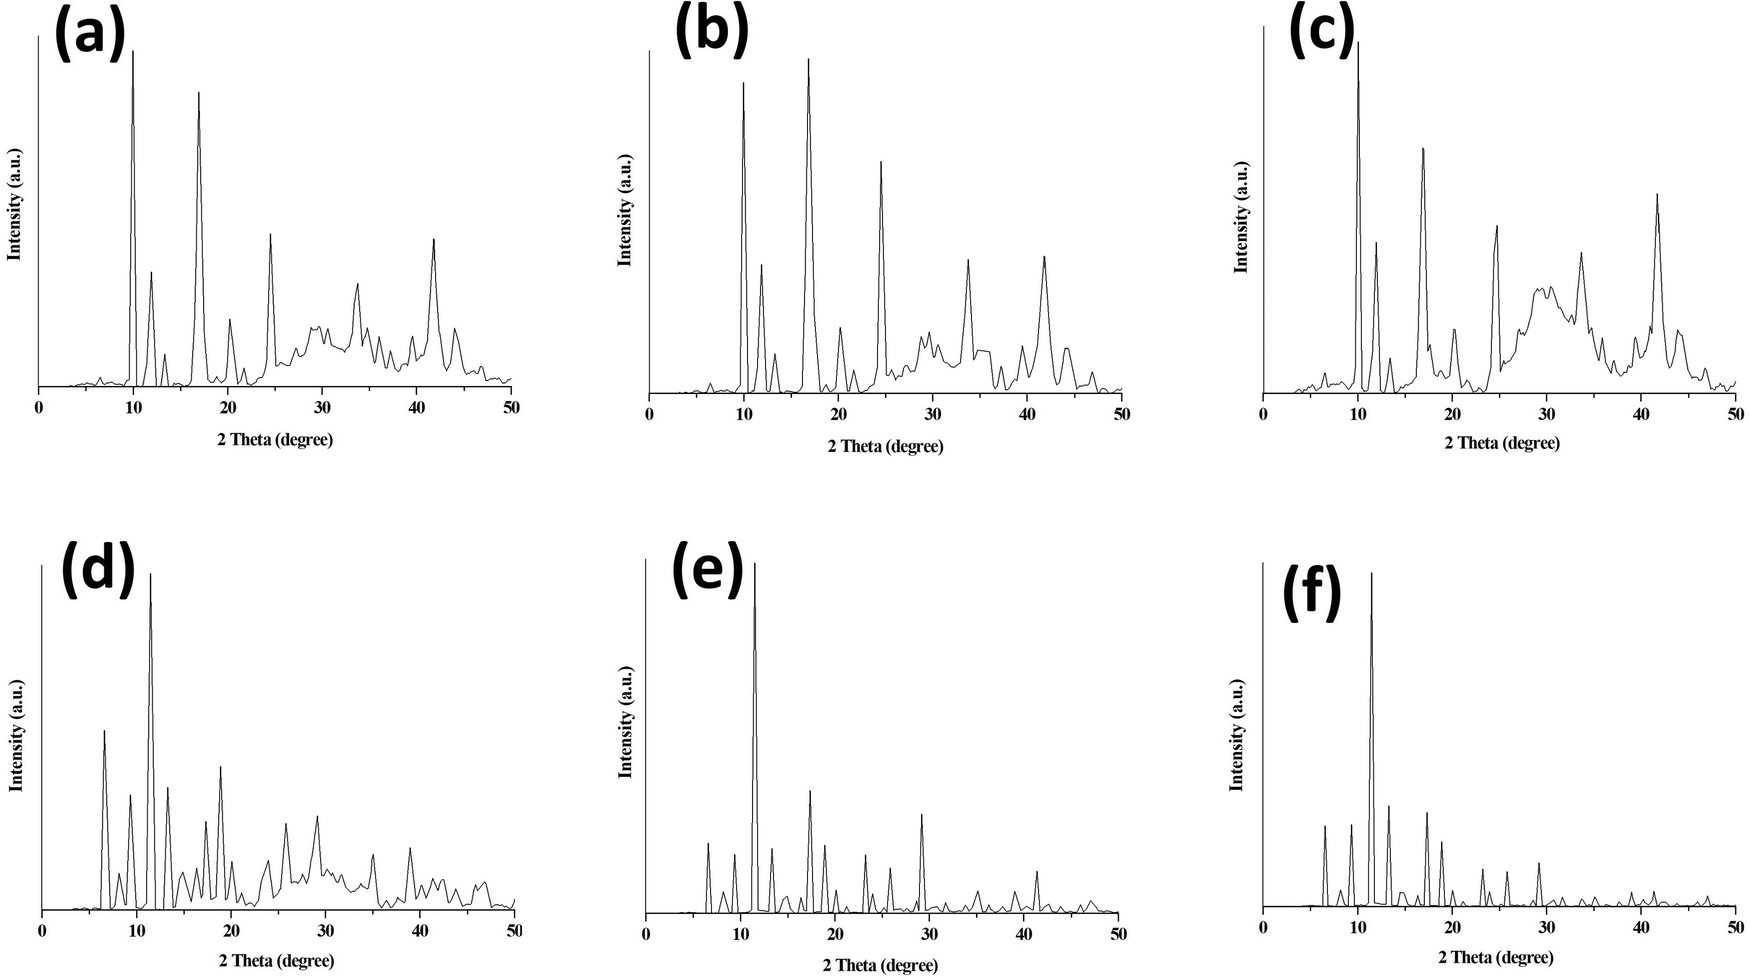 | ||
| Fig. 3 PXRD of (a) 10% PEG@HKUST-1@Cu-MOF-2, (b) 30% PEG@HKUST-1@Cu-MOF-2 (c) 50% PEG@HKUST-1@Cu-MOF-2, (d) 10% PEG@Cu-MOF-2@HKUST-1, (e) 30% PEG@Cu-MOF-2@HKUST-1 and (f) 50% PEG@Cu-MOF-2@HKUST-1. | ||
The PXRD patterns of parent MOFs were in good agreement with those reported for HKUST-125 and Cu-MOF-2.30 The PXRD pattern of HKUST-1 showed a prominent sharp peak at 2θ = 11.6°31 and Cu-MOF-2 at 2θ = 10.3°. The diffraction peaks of HKUST-1 appeared at 2θ values of 6.72°, 9.56°, 11.61°, 13.46°, 17.48°, 19.04°, 20.21°, 23.34°, 26.08° and 29.31°. The diffraction peaks of Cu-MOF-2 appeared at 2θ values of 10.25°, 12°, 17.18° and 25°.
The core–shell HKUST-1@Cu-MOF-2 showed peaks at 2θ values of 6.72°, 9.46°, 10.25°, 12.11°, 13.57°, 17.18°, 20.51° and 24.81°, which corresponded to the peaks of HKUST-1 and Cu-MOF-2. Similarly, in core–shell Cu-MOF-2@HKUST-1, PXRD peaks were observed at 2θ values of 6.72°, 9.56°, 11.61°, 13.37°, 17.48°, 19.04°, 20.31°, 23.54°, 25.98° and 29.40°, which corresponded to those of the parent MOFs. The PXRD pattern of synthesized core–shell MOFs confirmed the existence of the diffraction peaks of both parent MOFs (HKUST-1 and Cu-MOF-2), suggesting that the properties of the intrinsic framework of HKUST-1 and Cu-MOF-2 participating during core–shell formation remained intact.
The two diffraction peaks at 2θ values of around 20.1° and 24.4° in the PEG@core–shell systems of HKUST-1@Cu-MOF-2 indicated the presence of a PEG moiety.32,33 The diffraction peaks of various concentration of PEG@core–shell MOFs HKUST-1@Cu-MOF-2 appeared at the same 2θ values: 9.95°, 11.91°, 16.89°, 20.71°, 24.52°, 33.70° and 41.92°.
The diffraction peaks of different concentrations of PEG@core–shell MOFs of Cu-MOF-2@HKUST-1 appeared at the same 2θ values of 6.53°, 9.46°, 11.51°, 13.28°, 17.38°, 18.94°, 20.02°, 23.83°, 25.78° and 29.01°. The PXRD pattern of different PEG@core–shell MOFs of HKUST-1@Cu-MOF-2 and Cu-MOF-2@HKUST-1 indicated the presence of the diffraction peaks of HKUST-1, Cu-MOF-2 and a PEG moiety. The presence of sharp peaks in all synthesized MOFs indicated their highly crystalline nature. Peaks related to impurities were not observed in the PXRD patterns of synthesized MOFs.
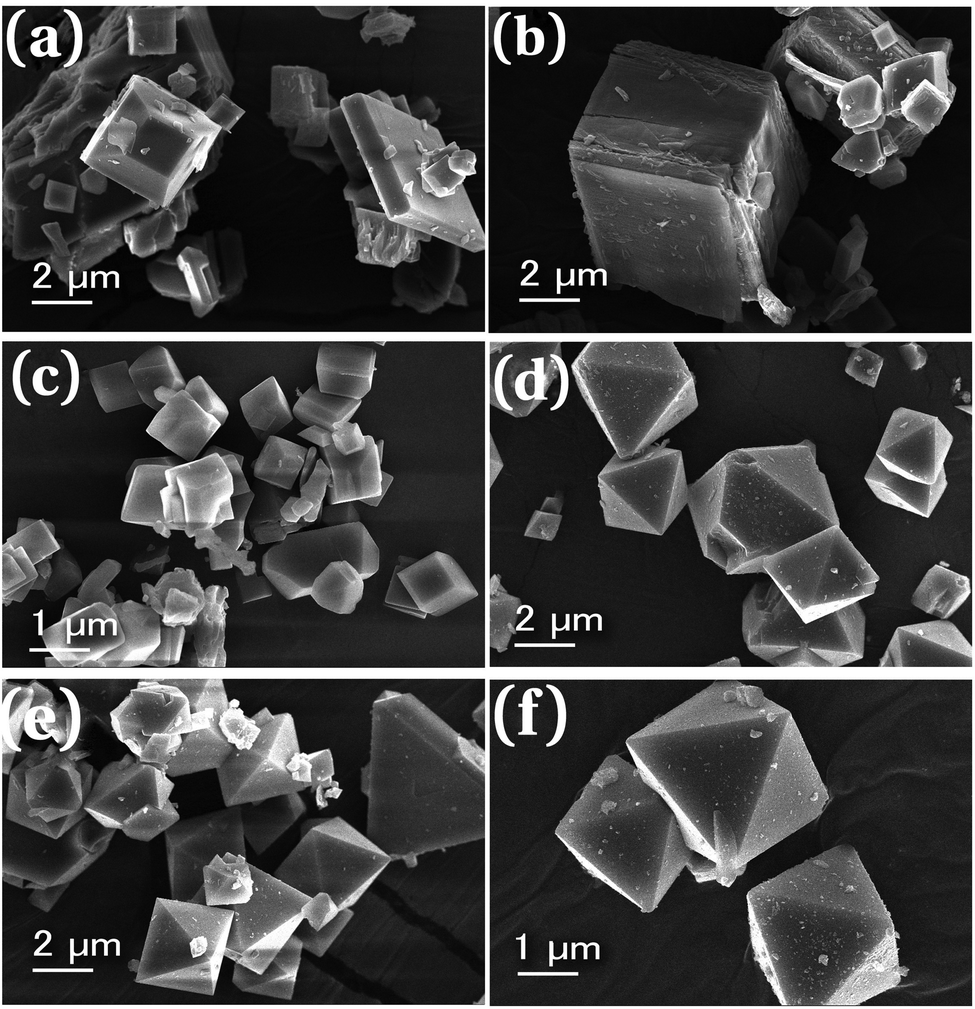
The morphology and average particle size of synthesized MOFs can be obtained from SEM analysis. The scanning electron micrographs of parent MOFs and core–shell MOFs are shown in Fig. 4 and their PEG@core–shell MOFs are shown in Fig. 5.
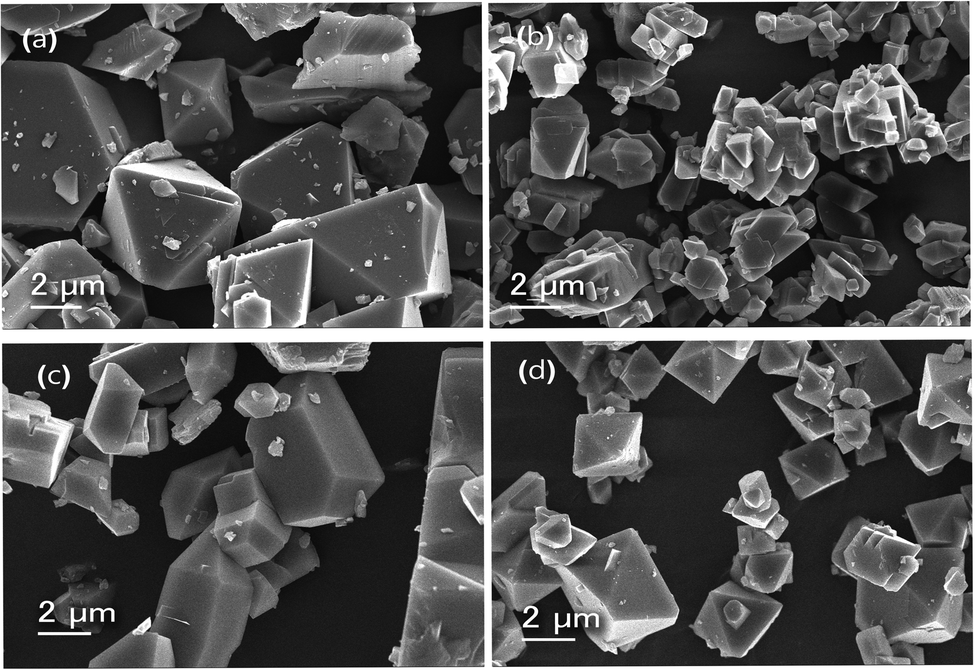 | ||
| Fig. 4 Scanning electron micrographs of (a) HKUST-1, (b) Cu-MOF-2, (c) HKUST-1@Cu-MOF-2 and (d) Cu-MOF-2@HKUST-1. | ||
 | ||
| Fig. 5 Scanning electron micrographs of (a) 10% PEG@HKUST-1@Cu-MOF-2, (b) 30% PEG@HKUST-1@Cu-MOF-2, (c) 50% PEG@HKUST-1@Cu-MOF-2, (d) 10% PEG@Cu-MOF-2@HKUST-1, (e) 30% PEG@Cu-MOF-2@HKUST-1 and (f) 50% PEG@Cu-MOF-2@HKUST-1. | ||
The particles of HKUST-1 exhibited an octahedral morphology with an average particle size of 2–23 μm. On the other hand, Cu-MOF-2 showed a cubic morphology with an average size of 2–18 μm. The SEM image of core–shell MOFs showed the morphology of the composition of the core structure. HKUST-1@Cu-MOF-2 displayed a cubic morphology. Cu-MOF-2@HKUST-1 had an octahedral morphology. The average particle size of HKUST-1@Cu-MOF-2 and Cu-MOF-2@HKUST-1 was 2–20 μm and 2–13 μm, respectively.
Similarly, PEG@core–shell MOFs retained the same morphology of the bare core–shell MOFs (Fig. 5). In the case of 10%, 30% and 50% PEG@HKUST-1@Cu-MOF-2, particles retained the cubic morphology and the average particle size was found to be 2–12 μm, 1.5–10 μm, and 1.5–5.5 μm, respectively. Hence, the average particle size decreased with an increase in the concentration of PEG.
SEM images of 10%, 30% and 50% PEG@Cu-MOF-2@HKUST-1 (Fig. 5) showed particles with an octahedral morphology and the average size was found to be 2–8.5 μm, 2–6 μm and 2–4 μm, respectively. The particle size decreased with an increase in the PEG concentration (similar to the HKUST-1@Cu-MOF-2 system). In both core–shell MOFs, the addition of PEG to MOF systems had an essential role as a capping agent and inhibited particle agglomeration. When the PEG concentration was increased, more –OH bonds became available for capping the shell structure, which caused a reduction in particle size. PEG also became part of the framework structure, thereby retaining the morphology of the core–shell systems.
EDAX spectroscopy is an X-ray method used to acquire quantitative data of the elemental composition of samples. Details of the elemental composition of parent MOFs and core–shell MOFs measured in atomic percent and weight percent are listed in Table S1 (ESI†). The EDAX spectra of MOFs are displayed in Fig. 6.
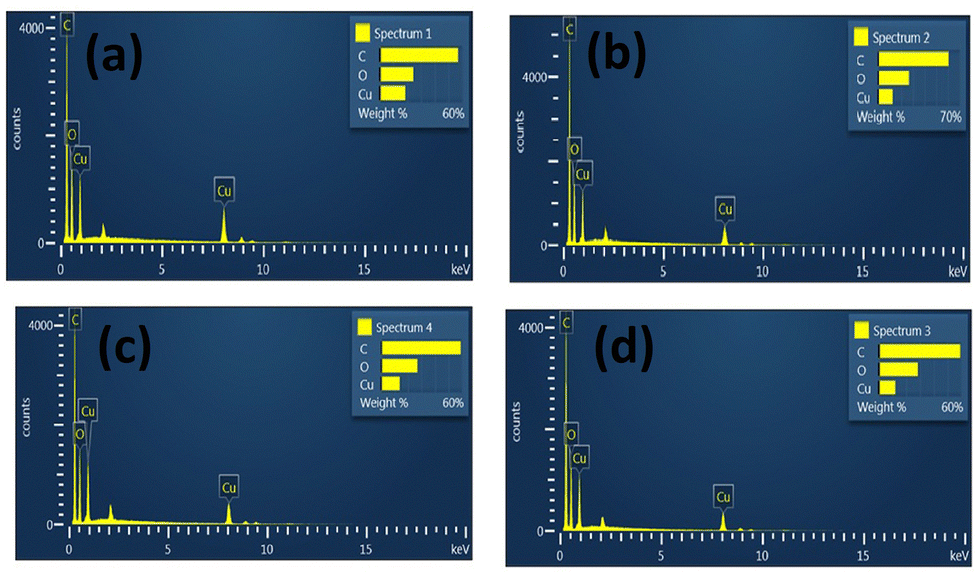 | ||
| Fig. 6 EDAX spectra of (a) HKUST-1, (b) Cu-MOF-2, (c) HKUST-1@Cu-MOF-2 and (d) Cu-MOF-2@HKUST-1. | ||
The EDAX spectra of HKUST-, Cu-MOF-2, HKUST-1@Cu-MOF-2 and Cu-MOF-2@HKUST-1 showed the presence of carbon (C), oxygen (O) and copper (Cu) elements. These results confirmed that all the four frameworks contained the copper metal atom along with the elements of the linkers (terephthalic acid and trimesic acid). The presence of hydrogen could not be detected because it is a lighter element. No other impurity peak was seen in the spectrum of parent MOFs and core–shell MOFs, which confirmed the purity of the copper MOFs. EDAX spectroscopy provided the exact percentage of the elements carbon, oxygen, and copper present in parent MOFs and core–shell MOFs.
The morphological information obtained from SEM images was confirmed by TEM. The different magnifications of TEM images of 10%, 30% and 50% PEG@HKUST-1@Cu-MOF-2 and Cu-MOF-2@HKUST-1 are shown in Fig. 7 and 8, respectively.
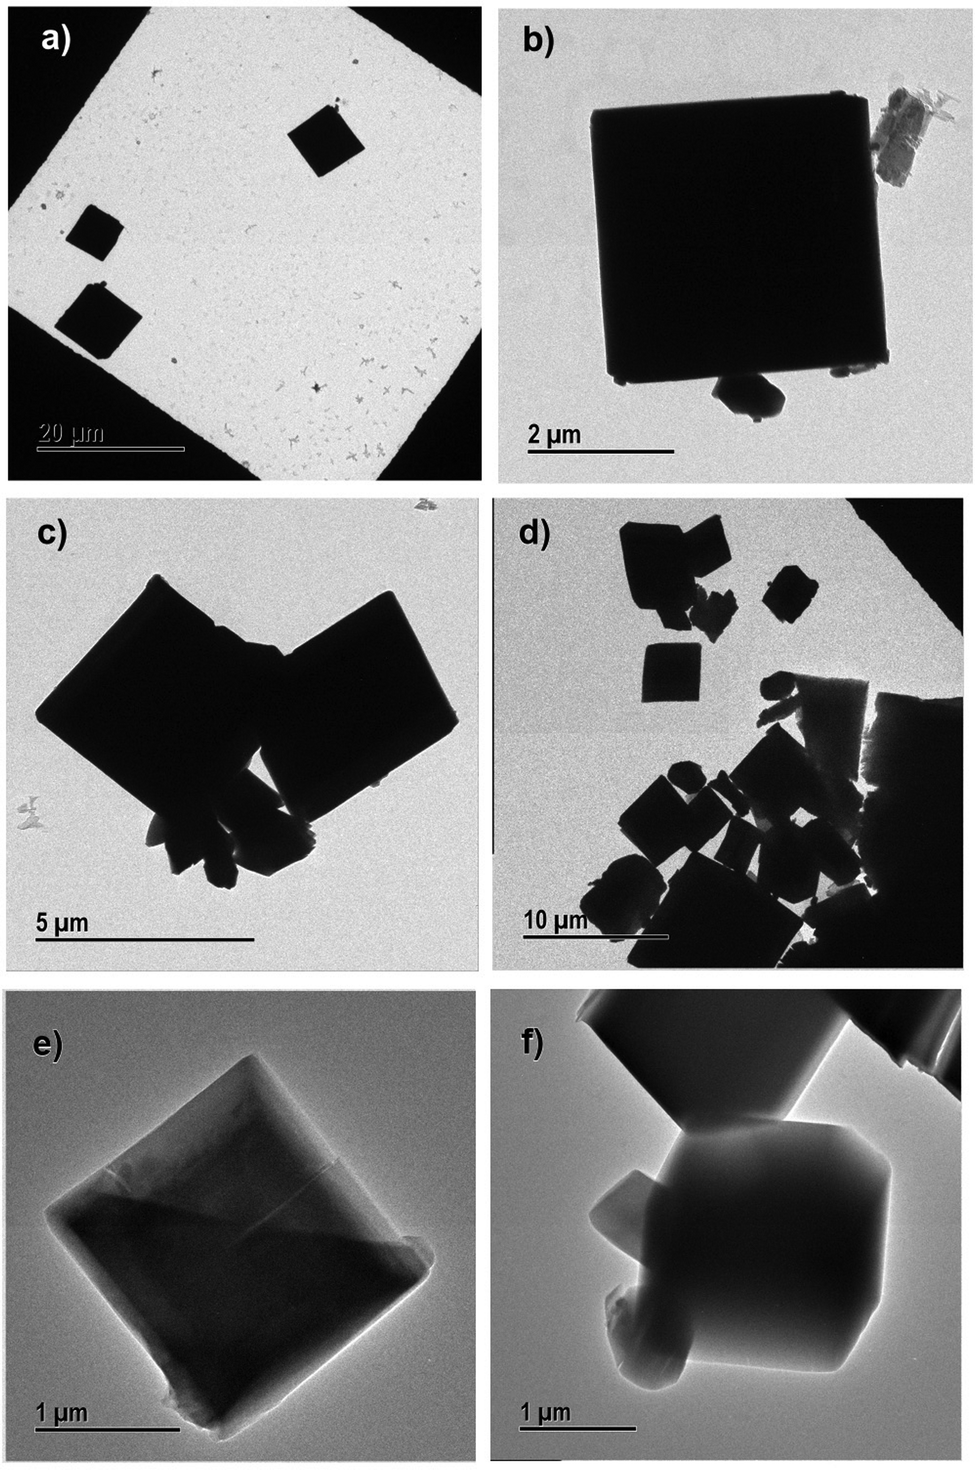 | ||
| Fig. 7 Transmission electron micrographs of (a) and (b) 10% PEG@HKUST-1@Cu-MOF-2, (c) and (d) 30% PEG@HKUST-1@Cu-MOF-2 and (e) and (f) 50% PEG@HKUST-1@Cu-MOF-2. | ||
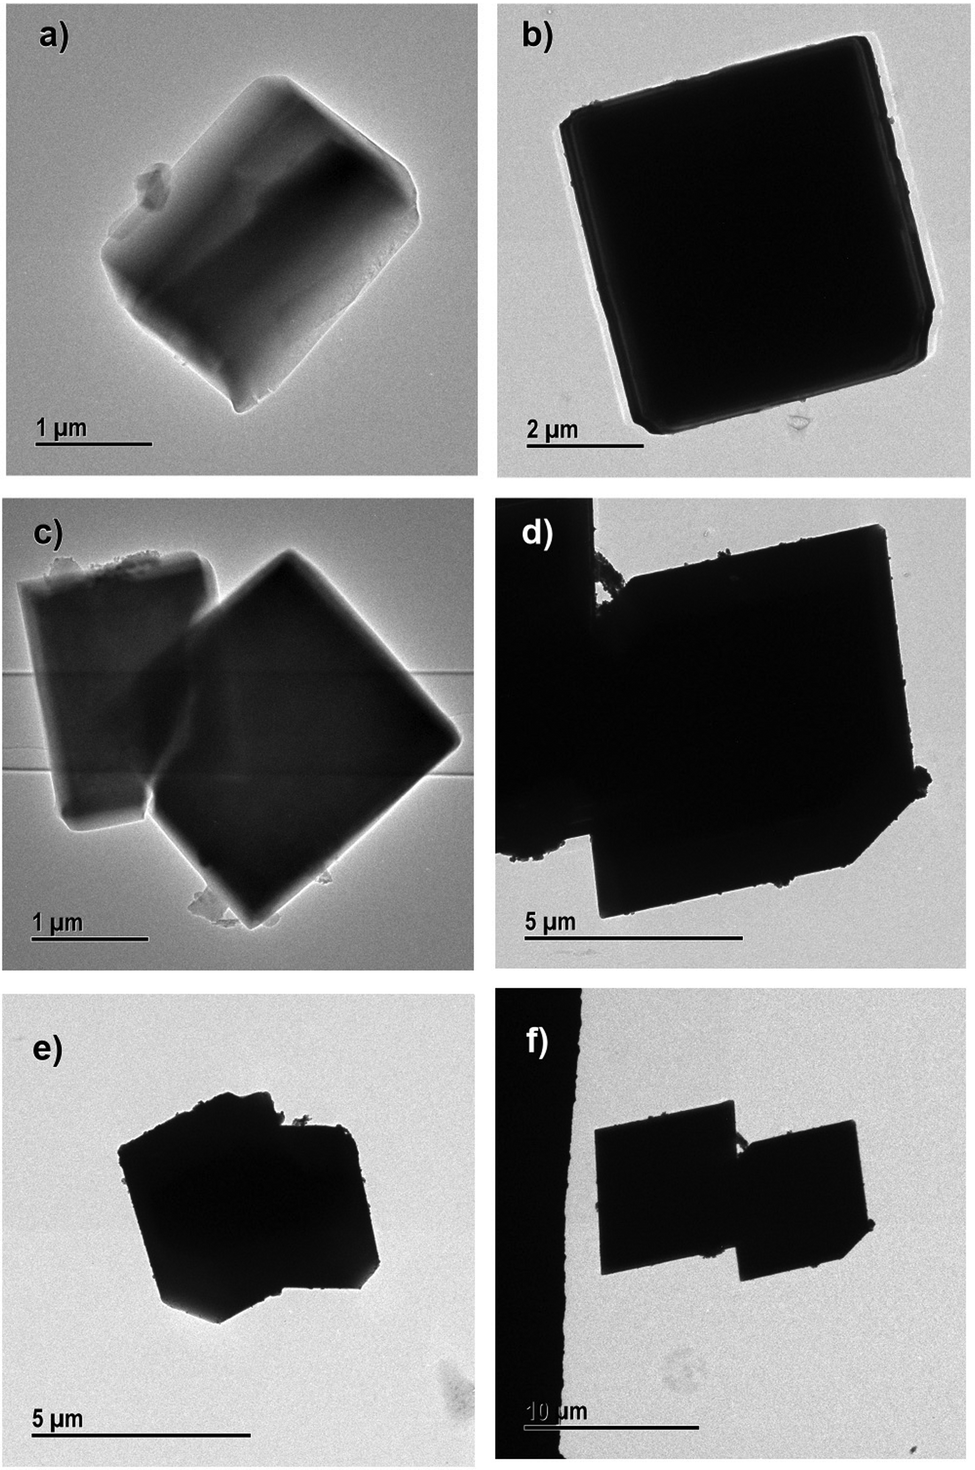 | ||
| Fig. 8 Transmission electron micrographs of (a) and (b) 10% PEG@Cu-MOf-2@HKUST-1, (c) and (d) 30% PEG@Cu-MOF-2@HKUST-1 and (e) and (f) 50% PEG@Cu-MOF-2@HKUST-1. | ||
SEM results were in good agreement with the results obtained from TEM. PEGylation of core–shell MOFs reduced the particle size and retained the morphology. TEM images provide the internal cross-sectional view of samples. Hence, octahedral and cubic morphologies appeared as a square pattern in TEM images. In the case of both core–shells and their PEGylated systems, TEM images showed a square-pattern morphology.
If low-molecular-weight PEG (400 Da) is used for surface modification, a high concentration of PEG is required to cause a large reduction in size of particles. In the case of high-molecular-weight PEG (≥2 kDa), a low concentration (0.5%) is sufficient to obtain MOFs of nanometer size, and a higher concentration does not cause further reduction in the size of particles.34,35
XPS was carried out to establish the electronic states of elements present in core–shell frameworks. The XPS spectra and deconvoluted spectra of core–shell MOFs HKSUT-1@Cu-MOF-2 and Cu-MOF-2@HKUST-1 are shown in Fig. 9. Data specifying binding energy and atomic percentages of elements are shown in Table S2 (ESI†).
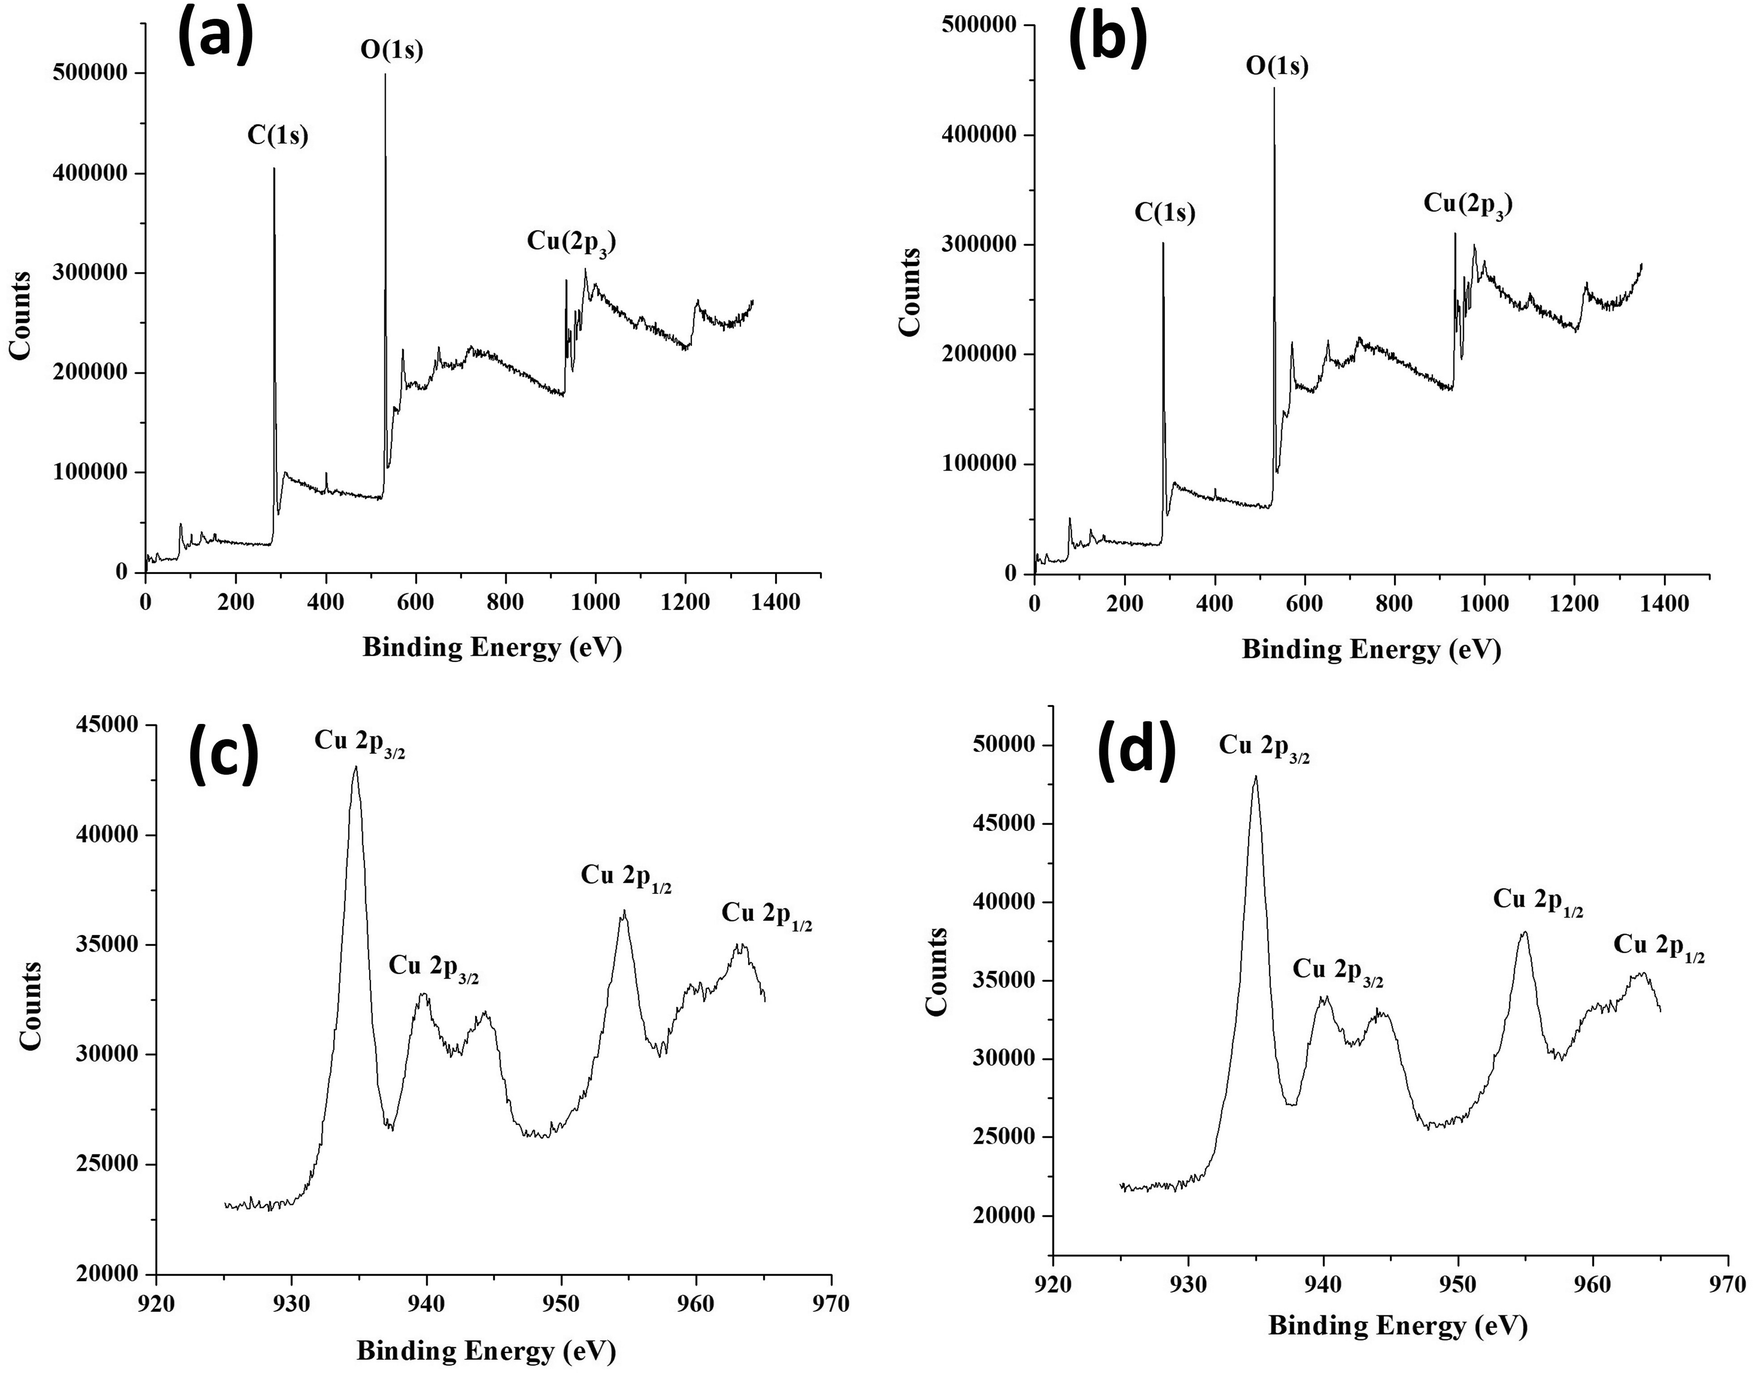 | ||
| Fig. 9 XPS of (a) HKUST-1@Cu-MOF-2 and (b) Cu-MOF-2@HKUST-1. (c) Deconvoluted XPS of Cu-MOF-2@HKUST-1 and (d) HKUST-1@Cu-MOF-2. | ||
XPS showed the existence of carbon, oxygen, and copper from the appearance of characteristic C 1s, O 1s and Cu 2p3 peaks. The C 1s peak in HKUST-1@Cu-MOF-2 at 285.33 eV and Cu-MOF-2@HKUST-1 at 284.34 eV was assigned to the C atom of the linker. The O 1s peak in HKUST-1@Cu-MOF-2 at 532.29 eV and Cu-MOF-2@HKUST-1 at 532.34 eV was assigned to the O atom of the linker. The Cu 2p peak in HKUST-1@Cu-MOF-2 at 935.03 eV and Cu-MOF-2@HKUST-1 at 935.20 eV was assigned to Cu atom in core–shell frameworks.
The deconvolution XPS of Cu 2p3 provided an insight into the chemical states of core–shell frameworks. The deconvoluted spectra of the Cu 2p3 state was split up into two states: Cu 2p3/2 and Cu 2p1/2. The Cu 2p3/2 state was deconvoluted into two peaks centered at 935 eV and 940 eV originating from Cu(II) and Cu(I), respectively. The Cu 2p1/2 state was deconvoluted into two peaks centered at 955 eV and 965 eV originating from Cu(II) and Cu(I), respectively. These deconvoluted XPS analyses confirmed that Cu 2p3/2 and Cu 2p1/2 arose from HKUST-1 and Cu-MOF-2, respectively.36 Data for XPS and deconvoluted spectra confirmed the existence of core–shell frameworks.
The surface area and porosity of core–shell MOFs and PEG@core–shell MOF systems were studied using N2 adsorption/desorption isotherms. The pore-size distribution was determined using the Barrett–Joyner–Halenda (BJH) method based on the kelvin equation.37 The N2 sorption isotherms of core–shell MOFs are displayed in Fig. S3 (ESI†) and those of PEG@core–shell MOFs are displayed in Fig. 10. Their corresponding BJH plots are shown in Fig. S4 (ESI†).
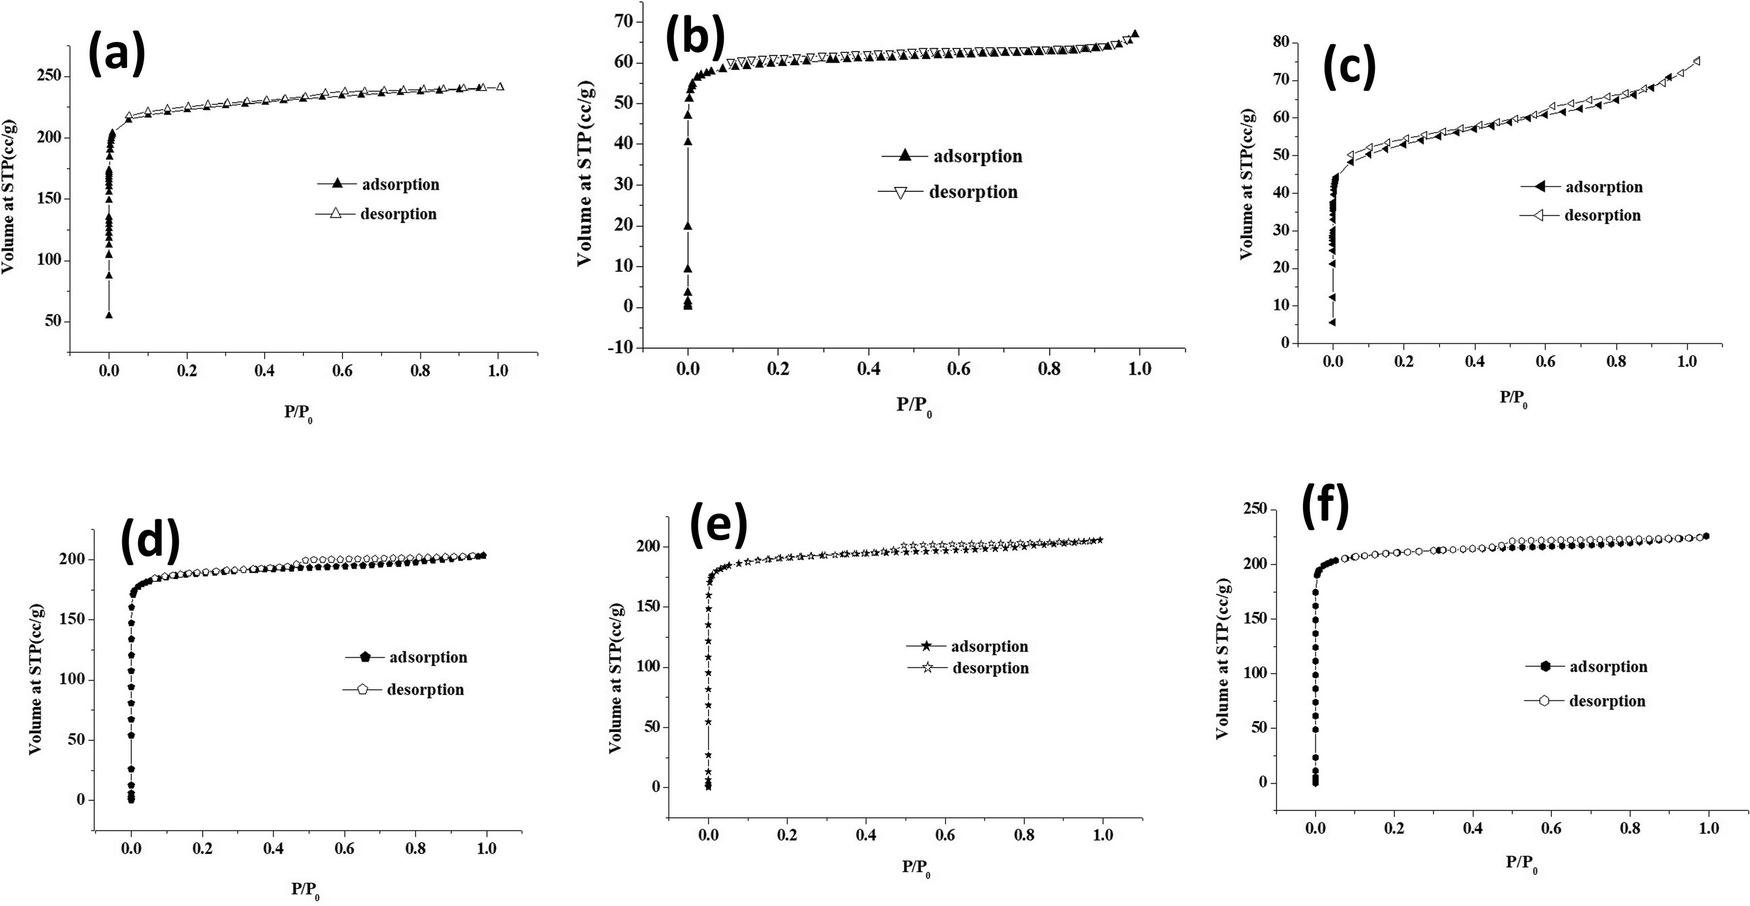 | ||
| Fig. 10 N2 sorption isotherms of (a) 10% PEG@HKUST-1@Cu-MOF-2, (b) 30% PEG@HKUST-1@Cu-MOF-2, (c) 50% PEG@HKUST-1@Cu-MOF-2, (d) 10% PEG@Cu-MOF-2@HKUST-1, (e) 30% PEG@Cu-MOF-2@HKUST-1 and (f) 50% PEG@Cu-MOF-2@HKUST-1. | ||
Both the core–shell MOFs HKUST-1@Cu-MOF-2 and Cu-MOF-2@HKUST-1 showed type-I adsorption isotherms. Cu-MOF-2@HKUST-1 possessed greater monolayer adsorption than HKUST-1@Cu-MOF-2. The presence of a minor hysteresis loop in HKUST-1@Cu-MOF-2 indicated the presence of a small amount of mesopore adsorption in open metal sites. The absence of a hysteresis loop in Cu-MOF-2@HKUST-1 implied the absence of open metal sites.
Table 1 represents the BET surface area and pore volume of core–shell and PEG@core–shell MOFs. The BET surface area and pore volume of HKUST-1@Cu-MOF-2 were 785.91 m2 g−1 and 0.327 cm3 g−1, respectively. Similarly, the BET surface area and pore volume of Cu-MOF-2@HKUST-1 were 1287 m2 g−1 and 0.528 cm3 g−1, respectively. The pore diameter of both HKUST-1@Cu-MOF-2 and Cu-MOF-2@HKUST-1 obtained from the BJH pore-size-distribution plot was found to be identical: 2.59 nm. The presence of a high pore volume in Cu-MOF-2@HKUST-1 compared with that in HKUST-1@Cu-MOF-2 resulted in slightly higher monolayer adsorption in Cu-MOF-2@HKUST-1.19
| MOF | Specific surface area (m2 g−1) | Pore volume (cm3 g−1) | Pore diameter (nm) |
|---|---|---|---|
| HKUST-1 | 1067.1 | 0.416 | 2.52 |
| Cu-MOF-2 | 807.78 | 0.320 | 2.52 |
| HKUST-1@Cu-MOF-2 | 785.91 | 0.327 | 2.59 |
| Cu-MOF-2@HKUST-1 | 1287 | 0.528 | 2.59 |
| 10% PEG@HKUST-1@Cu-MOF-2 | 271.93 | 0.494 | 0.49 |
| 30% PEG@HKUST-1@Cu-MOF-2 | 241.7 | 0.104 | 0.49 |
| 50% PEG@HKUST-1@Cu-MOF-2 | 201.18 | 0.103 | 0.49 |
| 10% PEG@Cu-MOF-2@HKUST-1 | 849.59 | 0.348 | 2.52 |
| 30% PEG@Cu-MOF-2@HKUST-1 | 763.9 | 0.317 | 2.52 |
| 50% PEG@Cu-MOF-2@HKUST-1 | 759.78 | 0.314 | 2.52 |
The PEG@core–shell MOFs of HKUST-1@Cu-MOF-2 with different concentrations of PEG (10%, 30%, 50%) exhibited a type-I adsorption isotherm curve with small hysteresis loop. Also, 10% PEG@HKUST-1@Cu-MOF-2 had higher monolayer adsorption compared with that of 30% and 50% PEG@core–shell MOF systems. The BET surface area of 10%, 30% and 50% PEG@HKUST-1@Cu-MOF-2 core–shell MOFs was 271.93 m2 g−1, 241.7 m2 g−1 and 201.18 m2 g−1, respectively.
The pore diameter of 10%, 30% and 50% PEG@HKUST-1@Cu-MOF-2 obtained from the BJH pore-size-distribution plot was found to be 0.49 nm. Addition of various concentrations of PEG to HKUST-1@Cu-MOF-2 led to a change in its pore diameter. The pore diameter fell from 2.59 nm to 0.49 nm. This reduction may have been due to the surface modification of PEG on the available coordination sites of HKUST-1@Cu-MOF-2 due to a lack of a rigid framework structure.
The PEG@core–shell MOFs of Cu-MOF-2@HKUST-1 with different concentrations of PEG (10%, 30%, 50%) exhibited a type-I adsorption isotherm curve with a small hysteresis loop. The BET surface area of 10%, 30% and 50% PEG@Cu-MOF-2@HKUST-1 core–shell MOFs was 849.59 m2 g−1, 763.9 m2 g−1 and 759.78 m2 g−1, respectively. The pore diameter of 10%, 30% and 50% PEG@Cu-MOF-2@HKUST-1 obtained from the BJH pore-size-distribution plot was found to be 2.52 nm.
The pore diameter of PEG@Cu-MOF-2@HKUST-1 MOF systems remained the same as for Cu-MOF-2@HKUST-1 even after the addition of PEG, which may have been due to the rigid structure of Cu-MOF-2@HKUST-1. The decrease in specific surface area of both PEG@core–shell MOFs after the addition of PEG suggested that PEG present on the surface of MOFs blocked the pore entrance.35 Incorporation of PEG into the network structure of core–shell MOF was responsible for the decrease in pore diameter.38
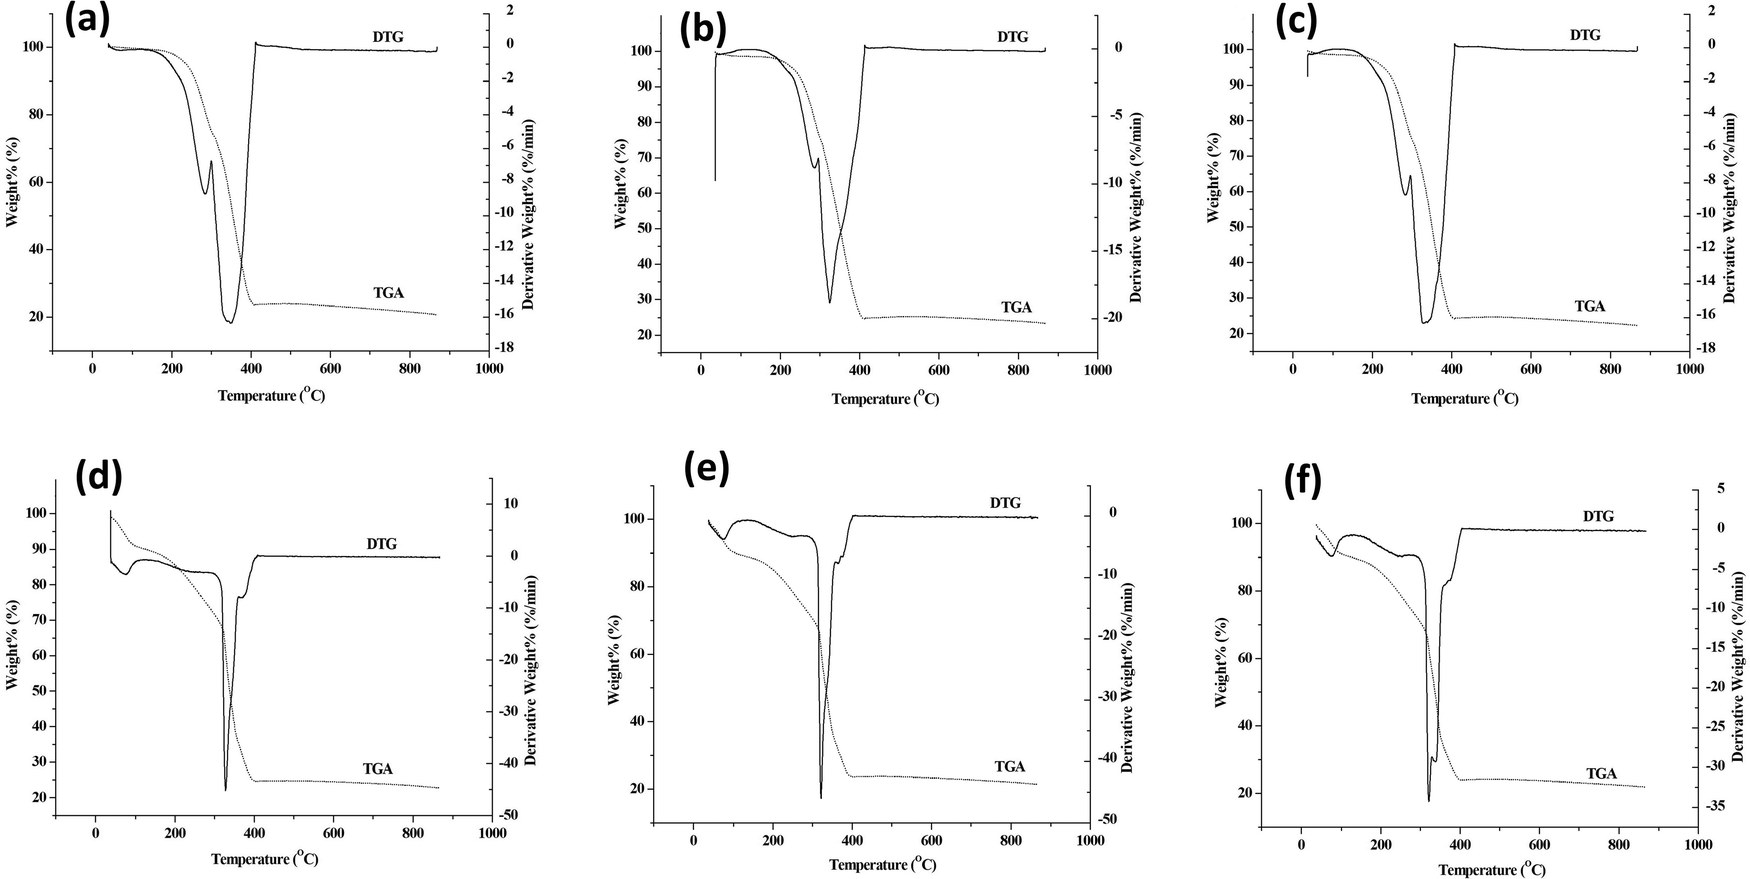
Thermal decomposition of synthesized MOFs was carried out by TGA in a nitrogen atmosphere. The thermograms of MOFs and core–shell MOFs are shown in Fig. S5 (ESI†) and their PEG@core–shell MOFs are shown in Fig. 11.
 | ||
| Fig. 11 TGA and DTG of (a) 10% PEG@HKUST-1@Cu-MOF-2, (b) 30% PEG@HKUST-1@Cu-MOF-2, (c) 50% PEG@HKUST-1@Cu-MOF-2, (d) 10% PEG@Cu-MOF-2@HKUST-1, (e) 30% PEG@Cu-MOF2@HKUST-1 and (f) 50% PEG@Cu-MOF-2@HKUST-1. | ||
The parent MOFs HKUST-1 and Cu-MOF-2 exhibited thermal stability up to 327 °C and 310 °C, respectively. The parent MOF, HKUST-1, showed two decomposition stages, with DTG peaks at 79 °C and 331 °C. Similarly, Cu-MOF-2 showed two decomposition stages, with DTG peaks centered at 274 °C and 333 °C. The core–shell MOFs, HKUST-1@Cu-MOF-2 and Cu-MOF-2@HKUST-1, were thermally stable up to 305 °C and 330 °C, respectively. The decomposition of HKUST-1@Cu-MOF-2 took place in two stages, as indicated by DTG peaks at 273 °C and 324 °C. The core–shell Cu-MOF-2@HKUST-1 underwent decomposition in two stages, with DTG peaks centred at 79 °C and 335 °C.
The thermograms of PEG@core–shell MOFs resembled the curve exhibited by their corresponding core–shell MOFs. The decomposition of PEG@core–shell MOFs of HKUST-1@Cu-MOF-2 and Cu-MOF-2@HKUST-1 in the range of 245–400 °C and 320–400 °C, respectively, was due to thermal degradation of the polymer and frameworks.39 Beyond 400 °C there was no weight change with increasing temperature, which indicated the residual thermal stability of the PEGylated MOFs. There was a slight increase in the thermal stability of PEG@core–shell MOFs with increase in PEG concentration that followed the pattern 10% < 30% < 50%, which may have been due to the presence of thermally stable PEG on core–shell MOFs.
5. Biological studies
The relationship between humans with bacteria is complex. Bacteria can be useful as well as harmful to human health. Contamination by bacteria is one of the most serious and life-threatening problems in medicine, food and environmental arenas. Antibiotics are, in general, used to treat bacterial infections. Bacteria have the genetic ability to resist the drugs used for treating bacterial infections. The immunity of humans is supressed due to the antibiotic resistance of bacteria. New infections caused by new bacterial strains are resistant to many therapeutic drugs. Hence, it is essential to develop unique antibacterial agents. Bacteria are classified into two groups (Gram-positive and Gram-negative) based on the gram stain (a test that checks for bacteria at the site of an infection).The antibacterial activity of MOFs, core–shell MOFs and PEG@core–shell MOFs were studied in vitro against two Gram-positive (S. aureus and E. faecalis) and two Gram-negative (K. pneumoniae and E. coli) bacterial species. Graphical representation of antibacterial activity against different bacterial species is given in Fig. 12.
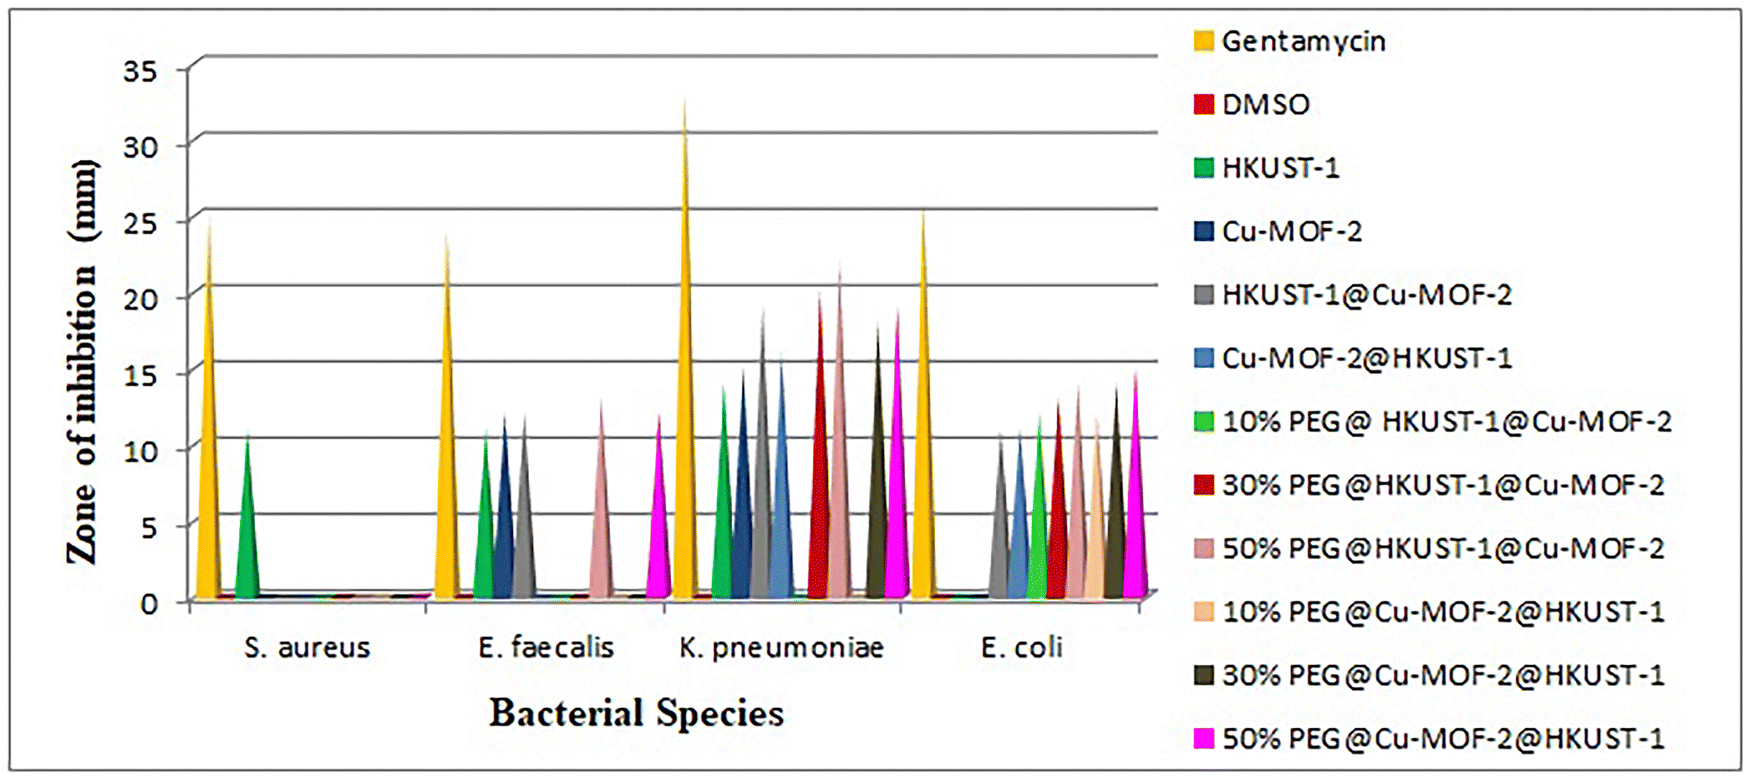 | ||
| Fig. 12 Antibacterial activity of Cu MOFs, core–shell MOFs and PEG@core shell MOFs. | ||
Except HKUST-1, all other MOFs were inactive towards the Gram-positive bacterium S. aureus. The parent MOFs HKUST-1 and Cu-MOF-2, core–shell MOFs HKUST-1@Cu-MOF-2 and 50% PEG@core–shell MOFs of HKUST-1@Cu-MOF-2 and Cu-MOF-2@HKUST-1 were active against the Gram-positive bacterium E. faecalis.
The parent MOFs HKUST-1 and Cu-MOF-2, core–shell MOFs HKUST-1@Cu-MOF-2 and Cu-MOF-2@HKUST-1 and 50% PEG@core–shell MOFs of HKUST-1@Cu-MOF-2 and Cu-MOF-2@HKUST-1 were active against the Gram-negative bacterium K. pneumoniae. Core–shell MOF systems and all concentrations of PEG@core–shell systems showed activity against the Gram-negative bacterium E. coli.
Hence, Gram-negative bacterial species were more sensitive towards MOFs than Gram-positive bacteria, as reported previously.40,41 The presence of a thick peptidoglycan layer of the cell wall in Gram-positive bacteria prevents the penetration of metals in the structure of MOFs into bacteria cells.42–45 The major factor affecting the antibacterial activity of MOFs is the ease of release of metal ions. The antibacterial effect of MOFs is due to the presence of metal ions but also due to the antibacterial action of organic linkers.46
A fungus belongs to the group of eukaryotic microorganisms that contain chitin in their cell wall, which makes it different from other kingdoms of bacteria, plants and animals. Fungi, along with bacteria, are essential for breaking down organic matter, resulting in the release of elements such as carbon, nitrogen, phosphorous and oxygen into soil and the atmosphere. Fungal species are diverse with different properties that can be useful or harmful. Some fungi, such as mushrooms and truffles are edible. They can also be used in the preparation of food items such as wine, bread and cheese. Fungi can also be used in the production of enzymes, vitamins and statin drugs used to control the level of cholesterol.
The antifungal activity of MOFs, core–shell MOFs and PEG@core shell MOFs were tested in vitro against two fungal species: A. niger and C. albicans. Graphical representation of antifungal activity is given in Fig. 13.
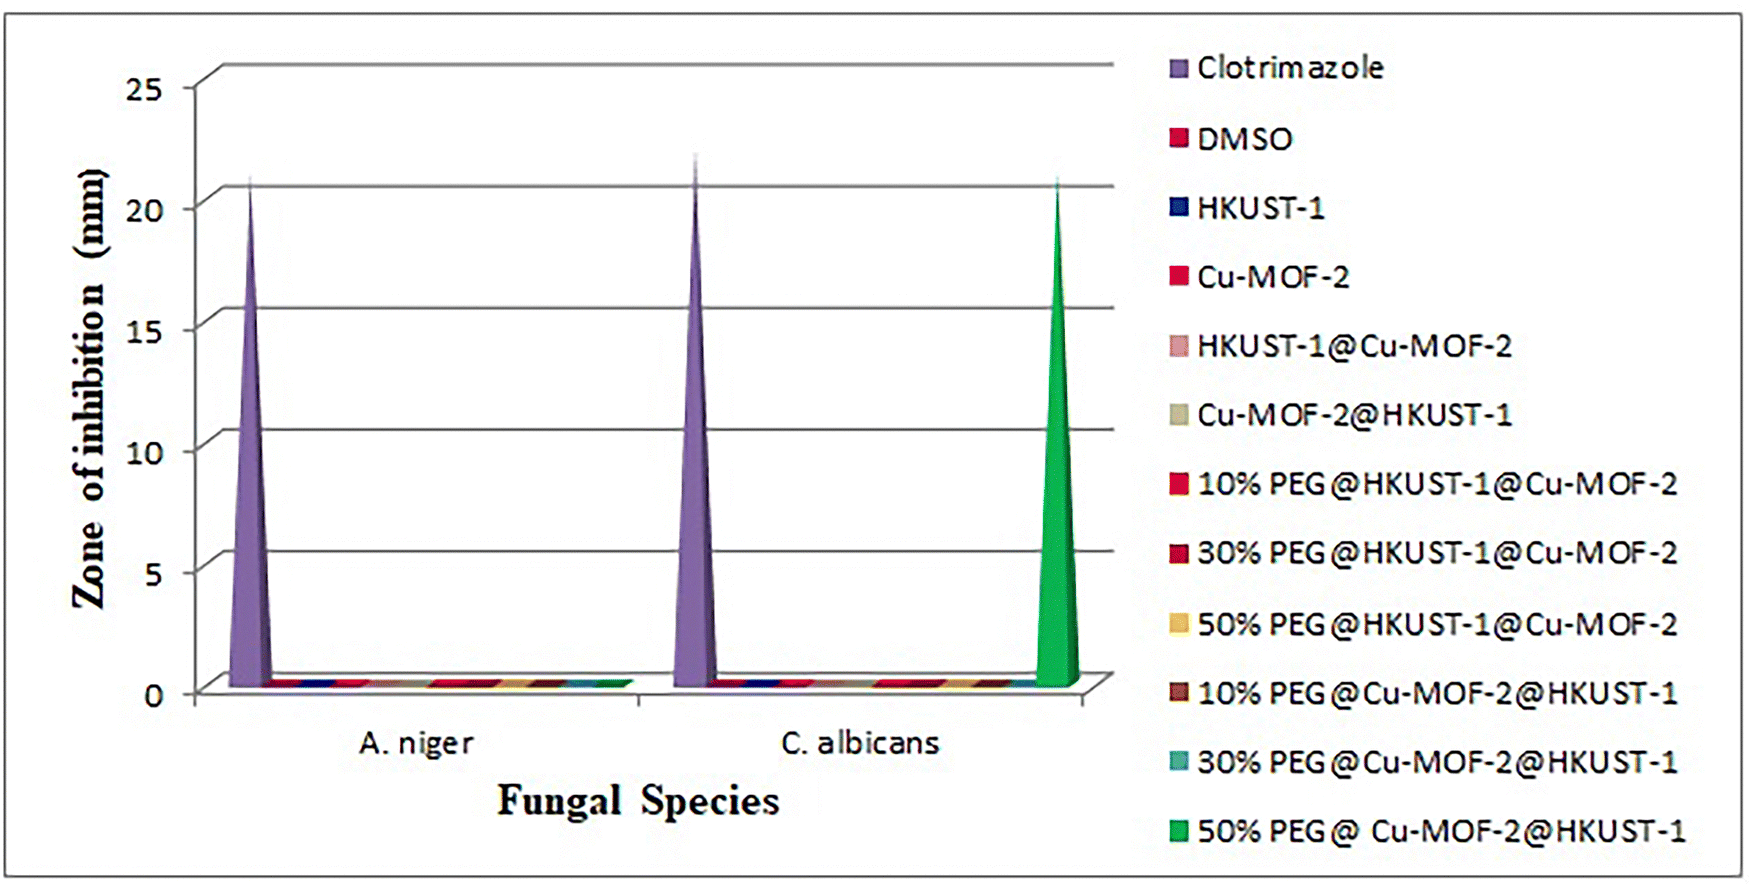 | ||
| Fig. 13 Antifungal activity of Cu MOFs, core–shell MOFs and PEG@core–shell MOFs. | ||
All MOFs were inactive towards A. niger. In the case of C. albicans, all other MOFs except 50% PEG@Cu-MOF-2@HKUST-1 were inactive. The antifungal activity of 50% PEG@Cu-MOF-2@HKUST-1 was as potent as its standard. The antifungal activity of 50% PEG@Cu-MOF-2@HKUST-1 MOF could be explained based on Tweedy's chelation theory and Overton's theory.47,48
The chelation theory states that the polarity of a metal ion is reduced upon chelation due to the partial sharing of the positive charge of metal ions with the donor atoms present in the ligands, and there is a possibility of delocalization over the entire chelated ring. According to Overton's theory, lipophilicity plays an important part in determining antifungal activity. Chelation increases lipophilicity, which favours the penetration of MOFs into the lipid membranes of microorganisms. This penetration disrupts the respiration process and arrests protein synthesis, which is an essential requirement for the growth of microorganisms. Thus, 50% PEG@core–shell MOF of Cu-MOF-2@HKUST-1 disturbed the metabolic pathways in cells which, ultimately, resulted in cell death.
The antifungal inactivity of all other MOFs may have been due to the impermeability of microorganism cells or a difference in the ribosomes of these cells. The low lipid solubility of metal ions prevents the metal reaching the site of action of the fungal cell wall to interfere with the metabolic process of the cell. Thus, metal ions have a decisive role in determining antifungal activity.
PEGylation was responsible for the enhanced antifungal activity of 50% PEG@Cu-MOF-2@HKUST-1. As the concentration of PEG increased from 10% to 50%, more –OH groups in PEG became available for sharing of the positive charge of metal ions upon chelation. Antifungal activity was also dependent upon the ability of a PEGylated MOF to release copper ions from its own structure which, in turn, bind to the cell wall of the fungus to disturb the transport of nutrients and obstruct intracellular enzymes.
6. Conclusions
A new strategy of PEGylating a shell over a core–shell MOF was introduced, for the first time, via a solvothermal method. This was a highly practical approach to prevent the agglomeration of core–shell MOFs. PEGylation further improved the physicomechanical and biological properties of the as-synthesised double-shelled core MOFs PEG@HKUST-1@CuMOF-2 and PEG@CuMOF-2@HKUST-1. The bonding characteristics and crystallinity of compounds were identified by FTIR spectroscopy and PXRD analysis. The chemical structure and composition of MOFs were determined from XPS and EDAX spectroscopy. SEM and TEM confirmed the formation of PEGylated core–shell MOFs and retention of the morphology of the parent core structure. There was a decrease in size of particles, which indicated the capping effect of PEGylation. A rigid framework structure was observed for PEG@CuMOF-2@HKUST-1, which reflected the thermal stability. Surface modification by PEG improved the surface characteristics, such as surface area and pore parameters which, in turn, reflected in the biological properties. The improved in vitro antibacterial and antifungal properties of the PEGylated system showed the importance of developing a hybrid double-shell–core system to tackle future medical emergencies.Conflicts of interest
There are no conflicts to declare.Acknowledgements
The authors gratefully acknowledge the Kerala State Council for Science, Technology and Environment and UGC (2348-MRP/15-16/KLKE029/UGC-SWRO) for providing financial support. We are also thankful to STIC, Cochin, Kerala and Kyung Hee University, Republic of Korea and Department of Chemistry, Kariavattam, Kerala, for providing characterization data.References
- C. Janiak and J. K. Vieth, MOFs, MILs and more: concepts, properties and applications for porous coordination networks (PCNs), New J. Chem., 2010, 34, 2366–2388 RSC.
- H.-C. J. Zhou and S. Kitagawa, Metal–organic frameworks (MOFs), Chem. Soc. Rev., 2014, 43(16), 5415–5418 RSC.
- T. Zhang and W. Lin, Metal–organic frameworks for artificial photosynthesis and photocatalysis, Chem. Soc. Rev., 2014, 43(16), 5982–5993 RSC.
- P. Deria, J. E. Mondloch, O. Karagiaridi, W. Bury, J. T. Hupp and O. K. Farha, Beyond post-synthesis modification: evolution of metal–organic frameworks via building block replacement, Chem. Soc. Rev., 2014, 43(16), 5896–5912 RSC.
- Z. Zhang and M. J. Zaworotko, Template-directed synthesis of metal–organic materials, Chem. Soc. Rev., 2014, 43(16), 5444–5455 RSC.
- O. T. Qazvini, R. Babarao and S. G. Telfer, Selective capture of carbon dioxide from hydrocarbons using a metal-organic framework, Nat. Commun., 2021, 12, 197 CrossRef CAS.
- G. B. Damas, L. T. Costa, R. Ahuja and C. M. Araujo, Understanding carbon dioxide capture on metal-organic frameworks from first-principles theory: The case of MIL-53(X), with X = Fe3+, Al3+ and Cu2+, J. Chem. Phys., 2021, 155(2), 024701 CrossRef CAS.
- W. Xing, P. Ye, J. Lu, X. Wu, Y. Chen, T. Zhu, A. Peng and H. Huang, Tellurophene-based metal-organic framework nanosheets for high-performance organic solar cells, J. Power Sources, 2018, 401, 13–19 CrossRef CAS.
- A. Melillo, R. Garcia-Aboal, S. Navalon, P. Atienzar, B. Ferrer, M. Alvaro and H. Garcia, Photoactive Zr and Ti Metal-organic-frameworks for solid-state solar cells, ChemPhysChem, 2021, 22(9), 842–848 CrossRef CAS.
- S. Wu, Z. Li, M.-Q. Li, Y. Diao, F. Lin, T. Liu, J. Zhang, P. Tieu, W. Gao, F. Qi, X. Pan, Z. Xu, Z. Zhu and A.-K.-Y. Jen, 2D metal-organic framework for stable pervoskite solar cells with minimized lead leakage, Nat. Nanotechnol., 2020, 15, 934–940 CrossRef CAS PubMed.
- M. Priyadarshini, I. Das and M. M. Ghangrekar, Application of metal organic framework in wastewater treatment and detection of pollutants: Review, J. Indian Chem. Soc., 2020, 97, 507–512 CAS.
- H. Yuan, N. Li, W. Fan, H. Cai and D. Zhao, Metal-organic framework based gas sensors, Adv. Sci., 2022, 9(6), 2104374 CrossRef CAS.
- L. J. Small, M. E. Schindelholz and T. M. Nenoff, Hold on tight: MOF based irreversible gas sensors, Ind. Eng. Chem. Res., 2021, 60(21), 7998–8006 CrossRef CAS.
- A. Bavykina, N. Kolobov, S. Khan, J. A. Bau, A. Ramirez and J. Gascon, Metal–organic frameworks in heterogeneous catalysis: Recent progress, New trends, and Future perspectives, Chem. Rev., 2020, 120(16), 8468–8535 CrossRef CAS PubMed.
- M. Wagemann, N. Radzik, A. Krzyzak and A. Adams, Screening metal–organic frameworks for separation of binary solvent mixtures by compact NMR relaxometry, Molecules, 2021, 26(12), 21623481 CrossRef PubMed.
- T. Kitao, Y. Zhang, S. Kitagawa, B. Wang and T. Uemura, Hybridization of MOFs and polymers, Chem. Soc. Rev., 2017, 46(11), 3108–3133 RSC.
- J.-B. Qu, H.-H. Shao, G.-L. Jing and F. Huang, PEG-chitosan-coated iron oxide nanoparticles with high saturated magnetization as carriers of 10-hydroxycamptothecin: Preparation, characterization and cytotoxicity studies, Colloids Surf., B, 2013, 102, 37–44 CrossRef CAS PubMed.
- C. Pettinari, R. Pettinari, C. Di Nicola, A. Tombesi, S. Scuri and F. Marchatti, Antimicrobial MOFs, Coord. Chem. Rev., 2021, 446, 214121 CrossRef CAS.
- K. Archana, N. G. Pillai, S. K. V. Srinivasan, P. K. Chauhan, R. Sujith, K. Y. Rhee and A. Asif, Enhanced isosteric heat of adsorption and gravimetric storage density of hydrogen in GNP incorporated Cu based core-shell metal-organic framework, Int. J. Hydrogen Energy, 2020, 45(58), 33818–33831 CrossRef CAS.
- D. K. Panchariya, R. K. Rai, E. Anil Kumar and S. K. Singh, Core−Shell zeolitic imidazolate frameworks for enhanced hydrogen storage, ACS Omega, 2018, 3(1), 167–175 CrossRef CAS PubMed.
- J. Yang, F. Zhang, H. Lu, X. Hong, H. Jiang, Y. Wu and Y. Li, Hollow Zn/Co ZIF Particles Derived from Core–Shell ZIF-67@ZIF-8 as Selective Catalyst for the Semi-Hydrogenation of Acetylene, Angew. Chem., 2015, 54(37), 10889–10893 CrossRef CAS.
- M. Stawowy, P. Jagodka, K. Matus, B. Samojeden, J. Silvestre-Albero, J. Trawczynski and A. Lamaca, HKUST-1-supported cerium catalysts for CO oxidation, Catalysts, 2020, 10(1), 108 CrossRef CAS.
- C. J. Wijaya, S. Ismadji, H. W. Aparamarta and S. Gunawan, Statistically optimum HKUST-1 synthesized by room temperature coordination modulation method for the adsorption of crystal violet dye, Molecules, 2021, 26(21), 6430 CrossRef CAS PubMed.
- E. Pretsch, P. Buhlmann and C. Affolter, Structure determination of organic compounds, Springer, Fourth edn, 2009 Search PubMed.
- R. Kaur, A. Kaur, A. Umar, W. A. Anderson and S. K. Kansal, Metal organic framework (MOF) porous octahedral nanocrystals of Cu-BTC: Synthesis, properties and enhanced absorption properties, Mater. Res. Bull., 2018, 109, 124–133 CrossRef.
- R. S. Salama, S. A. El-Hakam, S. E. Samra, S. M. El-Dafrawy and A. I. Ahmed, Adsorption, equilibrium and kinetic studies on the removal of methyl orange dye from aqueous solution by using of copper metal organic framework (Cu-BDC), Int. J. Modern Chem., 2018, 10(2), 195–207 CAS.
- H. Yu, H. Wu, X. Tian, Y. Zhou, C. Ren and Z. Wang, A nano-sized Cu-MOF with high peroxidase-like activity and its potential application in colorimetric detection of H2O2 and glucose, RSC Adv., 2021, 11(43), 26963–26973 RSC.
- A. R. Polu and R. Kumar, Impedance spectroscopy and FTIR studies of PEG - based polymer electrolytes, J. Chem., 2011, 8(1), 347–353 CAS.
- I. M. Deygen and E. V. Kudryashova, New versatile approach for analysis of PEG content in conjugates and complexes with biomacromolecules based on FTIR spectroscopy, Colloids Surf., B, 2016, 141, 36–43 CrossRef CAS PubMed.
- C. G. Carson, K. Hardcastle, J. Schwartz, X. Liu, C. Hoffmann, R. A. Gerhardt and R. Tannenbaum, Synthesis and structure characterization of copper terephthalate metal–organic frameworks, Eur. J. Inorg. Chem., 2009,(16), 2338–2343 CrossRef CAS.
- W. Zaman, K. Allmond, J. Stone, S. Harp and K. Mujibur, Synthesis and electrospraying of nanoscale MOF (Metal Organic Framework) for high-performance CO2 adsorption membrane, Nanoscale Res. Lett., 2017, 12(1), ISSN 19317573 Search PubMed.
- K. Shameli, M. B. Ahmad, S. D. Jazayeri, S. Sedaghat, P. Shabanzadeh, H. Jahangirian, M. Mahdavi and Y. Abdollahi, Synthesis and characterization of polyethylene glycol mediated silver nanoparticles by the green method, Int. J. Mol. Sci., 2012, 13(6), 6639–6650 CrossRef CAS.
- S. Pramanik, F. Ataollahi, B. Pingguan-Murphy, A. A. Oshkour and N. A. A. Osman, In vitro study of surface modified poly(ethylene glycol)-impregnated sintered bovine bone scaffolds on human fibroblast cells, Sci. Rep., 2015, 5, 9806 CrossRef CAS.
- T. Rijnaarts, R. Mejia-Ariza, R. J. M. Egberink, W. V. Roosmalen and J. Huskens, Metal–organic frameworks (MOFs) as multivalent materials: size control and surface functionalization by monovalent capping ligands, Chem. – Eur. J., 2015, 21(29), 10296–10301 CrossRef CAS PubMed.
- R. Mejia-Ariza and J. Huskens, The effect of PEG length on the size and guest uptake of PEG-capped MIL-88A particles, J. Mater. Chem. B, 2016, 4(6), 1108–1115 RSC.
- B. D. Credico, M. Redaelli, M. Bellardita, M. Calamante, C. Cepek, E. Coabani, M. D’Arienzo, C. Evangelisti, M. Marelli, M. Moret, L. Palmisano and R. Scotti, Step-by-step growth of HKUST-1 on functionalized TiO2 surface: An efficient material for CO2 capture and solar photoreduction, Catalysts, 2018, 8(9), 353 CrossRef.
- S. Fu, Q. Fang, A. Li, Z. Li, J. Han, X. Dang and W. Han, Accurate characterization of full pore size distribution of tight sandstones by low-temperature nitrogen gas adsorption and high-pressure mercury intrusion combination method, Energy Sci. Eng., 2021, 9(1), 80–100 CrossRef CAS.
- H. P. N. Thi, H. D. Ninh, C. V. Tran, B. T. Le, S. V. Bhosale and D. D. La, Size-control and surface modification of flexible metal-organic framework MIL-53(Fe) by polyethyleneglycol for 5-fluorouracil anticancer drug delivery, ChemistrySelect, 2019, 4(8), 2333–2338 CrossRef.
- J. Manson, D. Kumar, B. J. Meenan and D. Dixon, Polyethylene glycol functionalized gold nanoparticles: the influence of capping density on stability in various media, Gold Bull., 2011, 44, 99–105 CrossRef CAS.
- X. Lu, J. Ye, D. Zhang, R. Xie, R. F. Bogale, Y. Sun, L. Zhao, Q. Zhao and G. Ning, Silver carboxylate metal-organic frameworks with highly antibacterial activity and biocompatibility, J. Inorg. Biochem., 2014, 138, 114–121 CrossRef CAS PubMed.
- S. M. Sheta, S. M. El-Sheikh and M. M. Abd-Elzaher, Simple synthesis of novel copper metal–organic framework nanoparticles: biosensing and biological applications, Dalton Trans., 2018, 47(14), 4847–4855 RSC.
- W. Qian, H. Wang, J. Chen and Y. Kong, Spherical V-Fe-MCM-48: The Synthesis, Characterization and Hydrothermal Stability, Materials, 2015, 8(4), 1752–1765 CrossRef CAS PubMed.
- Y. Song, H. Jiang, H. Bi, G. Zhong, J. Chen, Y. Wu and W. Wei, Multifunctional Bismuth Oxychloride/Mesoporous Silica Composites for Photocatalysis, Antibacterial Test, and Simultaneous Stripping Analysis of Heavy Metals, ACS Omega, 2018, 3(1), 973–981 CrossRef CAS PubMed.
- X. Zhu, J. Wang, L. Cai, Y. Wu, M. Ji, H. Jiang and J. Chen, Dissection of the antibacterial mechanism of zinc oxide nanoparticles with manipulable nanoscale morphologies, J. Hazard. Mater., 2022, 430, 128436 CrossRef CAS PubMed.
- L. Cai, X. Zhu, H. Ruan, J. Yang, W. Wei, Y. Wu, L. Zhou, H. Jiang, M. Ji and J. Chen, Curcumin-stabilized silver nanoparticles encapsulated in biocompatible electrospun nanofibrous scaffold for sustained eradication of drug-resistant bacteria, J. Hazard. Mater., 2023, 452, 131290 CrossRef CAS.
- M. Shen, F. Forghani, X. Kong, D. Liu, X. Ye, S. Chen and T. Ding, Antibacterial applications of metal–organic frameworks and their composites, Compr. Rev. Food Sci. Food Saf., 2020, 19(4), 1397–1419 CrossRef CAS.
- A. A. Al-Amiery, A. A. H. Kadhum and A. B. Mohamad, Antifungal and antioxidant activities of pyrrolidone thiosemicarbazone complexes, Bioinorg. Chem. Appl., 2012, 5, 795812 Search PubMed.
- L. Cai, Y. Huang and Y. Duan, et al., Schiff-base silver nanocomplexes formation on natural biopolymer coated mesoporous silica contributed to the improved curative effect on infectious microbes, Nano Res., 2021, 14(8), 2735–2748 CrossRef CAS.
Footnote |
| † Electronic supplementary information (ESI) available. See DOI: https://doi.org/10.1039/d3tb01125a |
| This journal is © The Royal Society of Chemistry 2023 |