
Phytantriol phase behaviour in choline chloride urea and water mixtures†
Saffron J.
Bryant
 *,
Aaron
Elbourne
,
Tamar L.
Greaves
and
Gary
Bryant
*,
Aaron
Elbourne
,
Tamar L.
Greaves
and
Gary
Bryant
School of Science, College of STEM, RMIT University, Melbourne, Australia. E-mail: Saffron.bryant@rmit.edu.au
First published on 26th June 2023
Abstract
Deep eutectic solvents (DES) are tailorable non-aqueous solvents with promising properties for a range of applications, from industrial dissolution of plant products to biomedicine. They are mixtures of hydrogen bond donors and acceptors with low melting points that can be tailored to specific applications, and many support the self-assembly of amphiphilic molecules into lyotropic liquid crystal phases. Self-assembled lipid structures have potential for numerous applications, including drug delivery. These ordered structures can act as carriers, slow-release vehicles, or microreactors. Lipid self-assembly in non-aqueous solvents, such as deep eutectic solvents, is important for applications at extreme temperatures, or involving water-insoluble or water sensitive components. However, lipid self-assembly in these solvents remains largely unexplored. In this paper, we have examined the self-assembly of phytantriol, a non-ionic lipid, at 10 and 30 wt% in the deep eutectic solvent choline chloride:urea, with and without water. Self-assembly was assessed using small angle X-ray scattering and cross polarised optical microscopy at temperatures from 25–66 °C. We found that pure choline chloride:urea supports a Pn3m cubic phase similar to that formed in water. However, mixtures of the DES with water resulted in phytantriol forming an inverse hexagonal phase and influenced the phase transition temperatures. These results demonstrate that choline chloride:urea can support diverse phase behaviour, and also provides a mechanism for tailoring the phase for particular applications simply by controlling the amount of water in the solvent. In the future this could lead to methods of triggered release of drugs and biomolecules by the simple addition of water which could be critical for drug delivery applications.
 Saffron J. Bryant | Dr Saffron Bryant is a research fellow within the School of Science at RMIT University, Australia. After finishing a Bachelor in Biomedical Science, Saffron completed a PhD in Physical Chemistry in 2017 at The University of Sydney. Saffron's main research focus is applying deep eutectic solvents and ionic liquids to real world problems, including cryopreservation, antimicrobial treatments, and advanced materials synthesis. Her combined background in biomedical science and physical chemistry makes her ideally suited for exploring translational technologies for health-related applications. |
Introduction
Lipid lyotropic liquid crystals (LLCs) have applications in drug delivery, optical and bio-sensing, as microreactors, and in food science.1–4 Liquid crystals lie somewhere between strictly solid ‘crystals’ and melts.5 They possess some ordering, such as preferred orientational or spatial arrangements, but this ordering occurs at mesoscopic rather than atomic length scales.5 LLCs are formed by hydrophobic/hydrophilic interactions between lipid molecules and the surrounding solvent. However, a complex interplay of interactions results in the formation of many different structures depending on factors such as lipid type, concentration, solvent, and temperature.5–8 The suitability of LLCs for different applications depends largely on their structure, as this affects physical properties such as viscosity, and influences stability and release profiles.1,9–14 For example, previous research has shown that release of loaded materials such as glucose is faster from a bicontinuous cubic phase than from a hexagonal phase due to the interconnected network of lipid and water channels in the former,9,15 although release does to some degree depend on whether the material is hydrophilic or hydrophobic.Phytantriol is a lipid commonly used in cosmetic products as it is inexpensive and has a phase behaviour which makes it interesting for pharmaceutical applications.16–18 Phytantriol is superior to the other main lipid of interest for these applications, monoolein, as it does not possess an ester bond which is a major site of degradation.19 The phase behaviour of phytantriol in water was first described in 200317 and since then has been somewhat modified to account for the effects of impurities, additives, and proteins (Fig. S1, ESI†).16,19,20 There have been some reports of the phase behaviour of phytantriol in ionic liquids which demonstrate that the choice of solvent can significantly influence self-assembly.21–24
Historically, it was thought that only a small number of solvents could support LLC phase formation,25,26 but in recent decades it has been demonstrated that many molecular solvents and ionic liquids can support these phases.27–31 More recently, formation of lyotropic liquid crystal phases by some surfactants and phospholipids has been demonstrated in deep eutectic solvents (DESs).32–38 However, this has been largely limited to lamellar and micellar structures. The phase behaviour of lipids such as phytantriol which form hexagonal and cubic phases has yet to be explored in DESs.
DESs are mixtures of hydrogen bond donors and acceptors that have a melting point much lower than either of the constituents.39 DESs have a key advantage for solvent design in that their method of synthesis allows for easy ‘mix-and-match’ tailoring of properties such as viscosity, melting point, polarity and most other physico-chemical properties. Many DESs can be made from food-grade products such as lactic acid and sugars, as well as biocompatible components like amino acids.40–44 In fact, the ‘hallmark’ DES component (choline chloride) is used as a food additive to promote chicken growth.45 Traditionally, DESs are synthesised by simple mixing of the precursor components, with heating to ∼50 °C if required. This is energetically inexpensive and results in 100% atom efficiency.39,46 All of these factors make DESs preferable to many traditional solvents and they are seeing increasing uptake for a number of applications including chemical extraction, catalysis, bioprocessing, and many other chemical applications.32,33,42,47–55
Choline chloride:urea (ChCl:U) was first described in 2003 and is the most studied DES to date (Fig. 1).46 The self-assembly of numerous amphiphiles has been reported in ChCl:U, including the spontaneous formation of vesicles by phospholipids,33 and micelle formation by ionic (and zwitterionic) surfactants such as alkali dodecylsulphates.32,35–39,56 The ability of DESs to support the formation of complex lipid phases opens the door for even more applications, in particular in the biomedical space.38,57
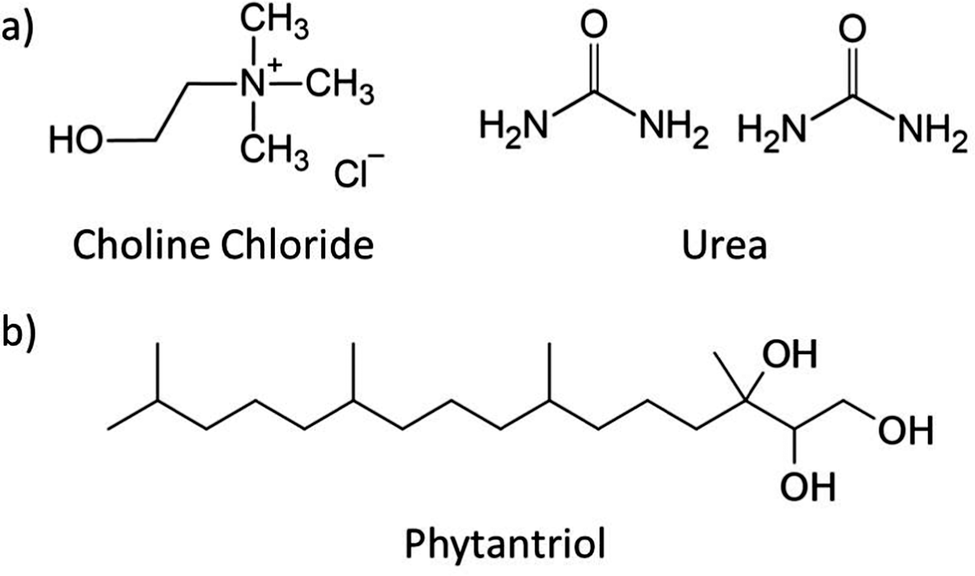 | ||
Fig. 1 Chemical structure of (a) choline chloride![[thin space (1/6-em)]](https://www.rsc.org/images/entities/char_2009.gif) :urea (1:2 mol ratio) and (b) phytantriol. :urea (1:2 mol ratio) and (b) phytantriol. | ||
As described above, lyotropic liquid crystals can be used for numerous applications, but some of these are limited by a reliance on water. DESs have advantages over water through solvent tailorability, and because they are generally non-volatile. In particular, ChCl:U does not evaporate with heating and so can be used for high-temperature (e.g. over 100 °C) applications without solvent loss, unlike aqueous systems.58,59 Furthermore, DESs can be tailored to maximise the solubility of different molecules, even those that are not soluble in water. For example, the solubility of itraconazole can be increased 6700-fold compared to water by using DESs.60 This is relevant to pharmaceutical applications which often rely on solubilisation of hydrophobic drug molecules. Finally, DESs allow the formation and fine-tuning of lipid phases that are not easily accessible in aqueous systems. DESs can be further tailored by controlling the water content, for example, addition of water generally leads to lower viscosities.61
In this paper we utilised synchrotron-based small angle X-ray scattering and cross polarised optical microscopy to characterise the lyotropic liquid crystal phase behaviour of the lipid phytantriol in ChCl:U with 0, 10, 20, 30, 40, 50, 60, 70, 80, 90 and 100 wt% water at temperatures ranging from 25–66 °C. ChCl:U promoted the assembly of complex lipid phases and the addition of water significantly influenced the phases that were formed across the temperature range studied. This provides fundamental insight into the influence of solvent on lipid self-assembly as well as a potential avenue for fine-tuning phase behaviour.
Materials and methods
Chemicals
ChCl:U was synthesised by combining choline chloride (≥98%, Sigma) with urea (99%, chem-supply) at a 1:2 molar ratio (Fig. 1). This mixture was heated to 50 °C with stirring until a homogenous clear liquid was formed. Water content was measured using Karl Fischer Titration and was below 0.5 wt%.
Phytantriol was provided by DSM Nutritional Products, Germany, and used as received.
Small angle X-ray scattering
Phytantriol was dissolved in ethanol and then pipetted into 96 well plates (Greiner, half-area) so that wells contained either 10 or 30 mg of phytantriol. The ethanol was evaporated in an oven at 70 °C for several hours until only a dry film of phytantriol remained in each well.62 Mixtures of ChCl:U and water were prepared with 10, 20, 30, 40, 50, 60, 70, 80, and 90 wt% water. ChCl:U, water, or a mixture was added to each well to achieve a final concentration of either 10 or 30 wt% phytantriol in solvent. The plates were then sealed with Kapton tape. Each sample was made in triplicate. Lipid-free controls for each solvent mixture were included for background measurements. The plates were cycled between 25–80 °C and vortexed prior to SAXS measurements to promote proper mixing and equilibration. Throughout the paper, samples will be referred to by their phytantriol content (either 10 or 30 wt%) and the composition of the solvent (e.g. 10 wt% ChCl:U and 90 wt% water).SAXS measurements were taken on the SAXS/WAXS beamline of the Australian Synchrotron. Scattering patterns (3 per well per temperature) were recorded over 1 s by a 1M Pilatus detector, using a q range of 0.01–0.6 Å−1, and a wavelength λ = 1.52 Å (12 keV). SAXS patterns were acquired of each plate at 25 °C, and then at temperatures of 35, 45, 50, 58, and 66 °C, with equilibration times of approximately 15 minutes at each temperature. The plates were heated in a custom-made sample holder at the SAXS beamline. Each plate was then cooled down to 25 °C and SAXS patterns acquired.
SAXS patterns were reduced using Scatterbrain software63 and the resulting 1D plots were analysed using custom software for peak identification and phase assignment.64 Each analysis was assessed visually to ensure correct peak and phase assignment. Classification of phases was based on established Bragg peak ratios. In this work, two specific arrangements were identified, a Pn3m cubic phase, identified by peak ratios of √2, √3, √4, √6, and an inverse hexagonal phase, identified by peak ratios of 1, √3, √4. Graphical illustrations of these phases are shown in Fig. 2. Lattice parameters for each phase were calculated based the position of the first peak in the 1D scattering curves. Equations for phase assignment and lattice parameters are given in the ESI.†
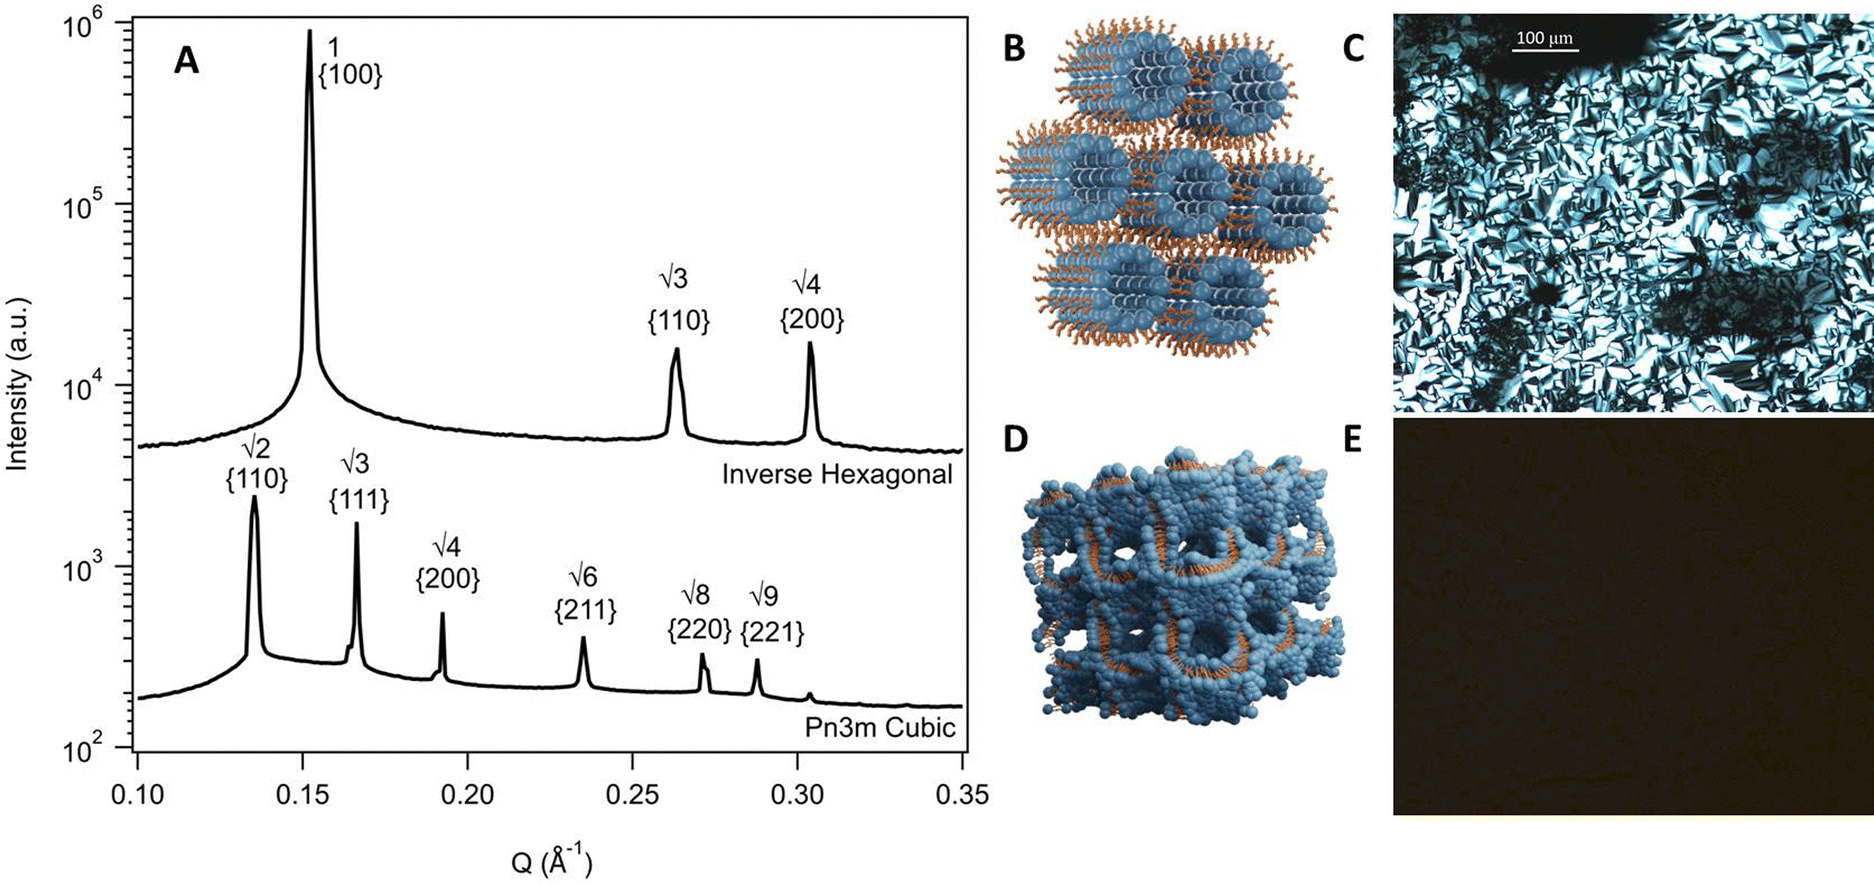 | ||
| Fig. 2 (A) SAXS scattering patterns of an inverse hexagonal (10 wt% phytantriol in a solvent mixture of 50/50 ChCl:U/water at 25 °C) and a Pn3m cubic phase (10 wt% phytantriol in water at 25 °C) with peak position ratios and Miller indices. (B and D) Schematic illustrations of an inverse hexagonal and a Pn3m cubic phase respectively. (C and E) Textures from cross polarised optical microscopy for a hexagonal phase and cubic phase respectively. Cubic phases are isotropic and so appear black under crossed polarisers. | ||
Cross polarised optical microscopy
After SAXS measurements, a sample of each composition was taken from the well-plates and placed onto a microscope slide. A coverslip was then placed on top, and the system sealed using superglue to minimise water absorption or evaporation.These samples were observed using a Nikon Eclipse Ni microscope fitted with polarisers, to identify signature textures of lipid phases. The samples were heated to ∼70 °C with 5 °C increments (Hot Stage HS82 with Hot Stage controller HS1, Mettler Toledo) to observe changes to the samples with temperature, and to mimic the heating regime used for the acquisition of SAXS patterns.
Results and discussion
To inform the results shown below, the phase diagram of phytantriol in water, consisting of regions of lamellar, inverse micelles, inverse hexagonal, and cubic phases is provided in Fig. S1 (ESI†).17Fig. 2 shows example SAXS scattering patterns of an inverse hexagonal and a Pn3m cubic phase with peak position ratios and Miller Indices labelled.65 Schematics of these two phases along with their textures under crossed polarising microscopy are also shown in Fig. 2. For pure DES, only a Pn3m cubic phase was observed, while in water mixtures an inverse hexagonal phase was also seen. Other phases (as identified in Fig. S1, ESI†) were not observed.
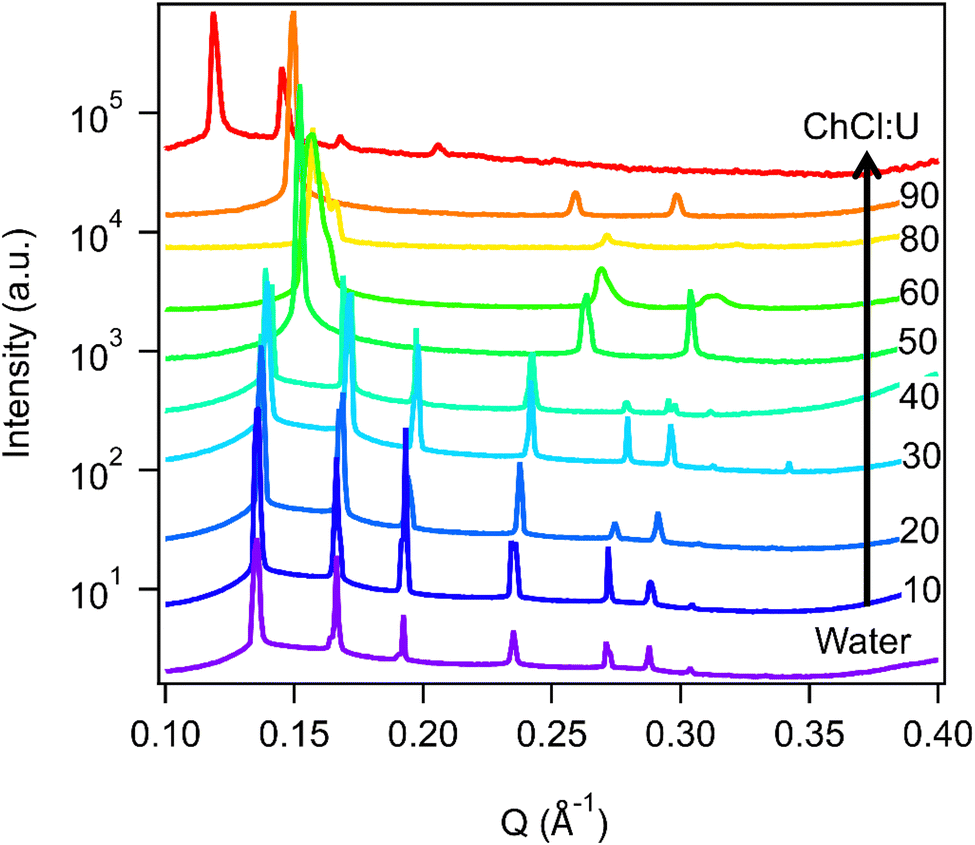
Fig. 3 shows the SAXS patterns of 10 wt% phytantriol in each solvent heated from 25 °C to 66 °C, as well as a ‘cooled’ pattern after returning to 25 °C. These are representative patterns taken from >5 replicate measurements. After SAXS, samples were taken from the SAXS plate and examined using crossed polarising microscopy. Fig. 4 shows images of samples of 10 wt% phytantriol in either 90 wt% ChCl:U (10 wt% water) or 60 wt% ChCl:U (40 wt% water) at 25 °C, each with birefringent patterns consistent with a hexagonal phase. Images collected by cross polarised microscopy were used to support the findings of the SAXS data.
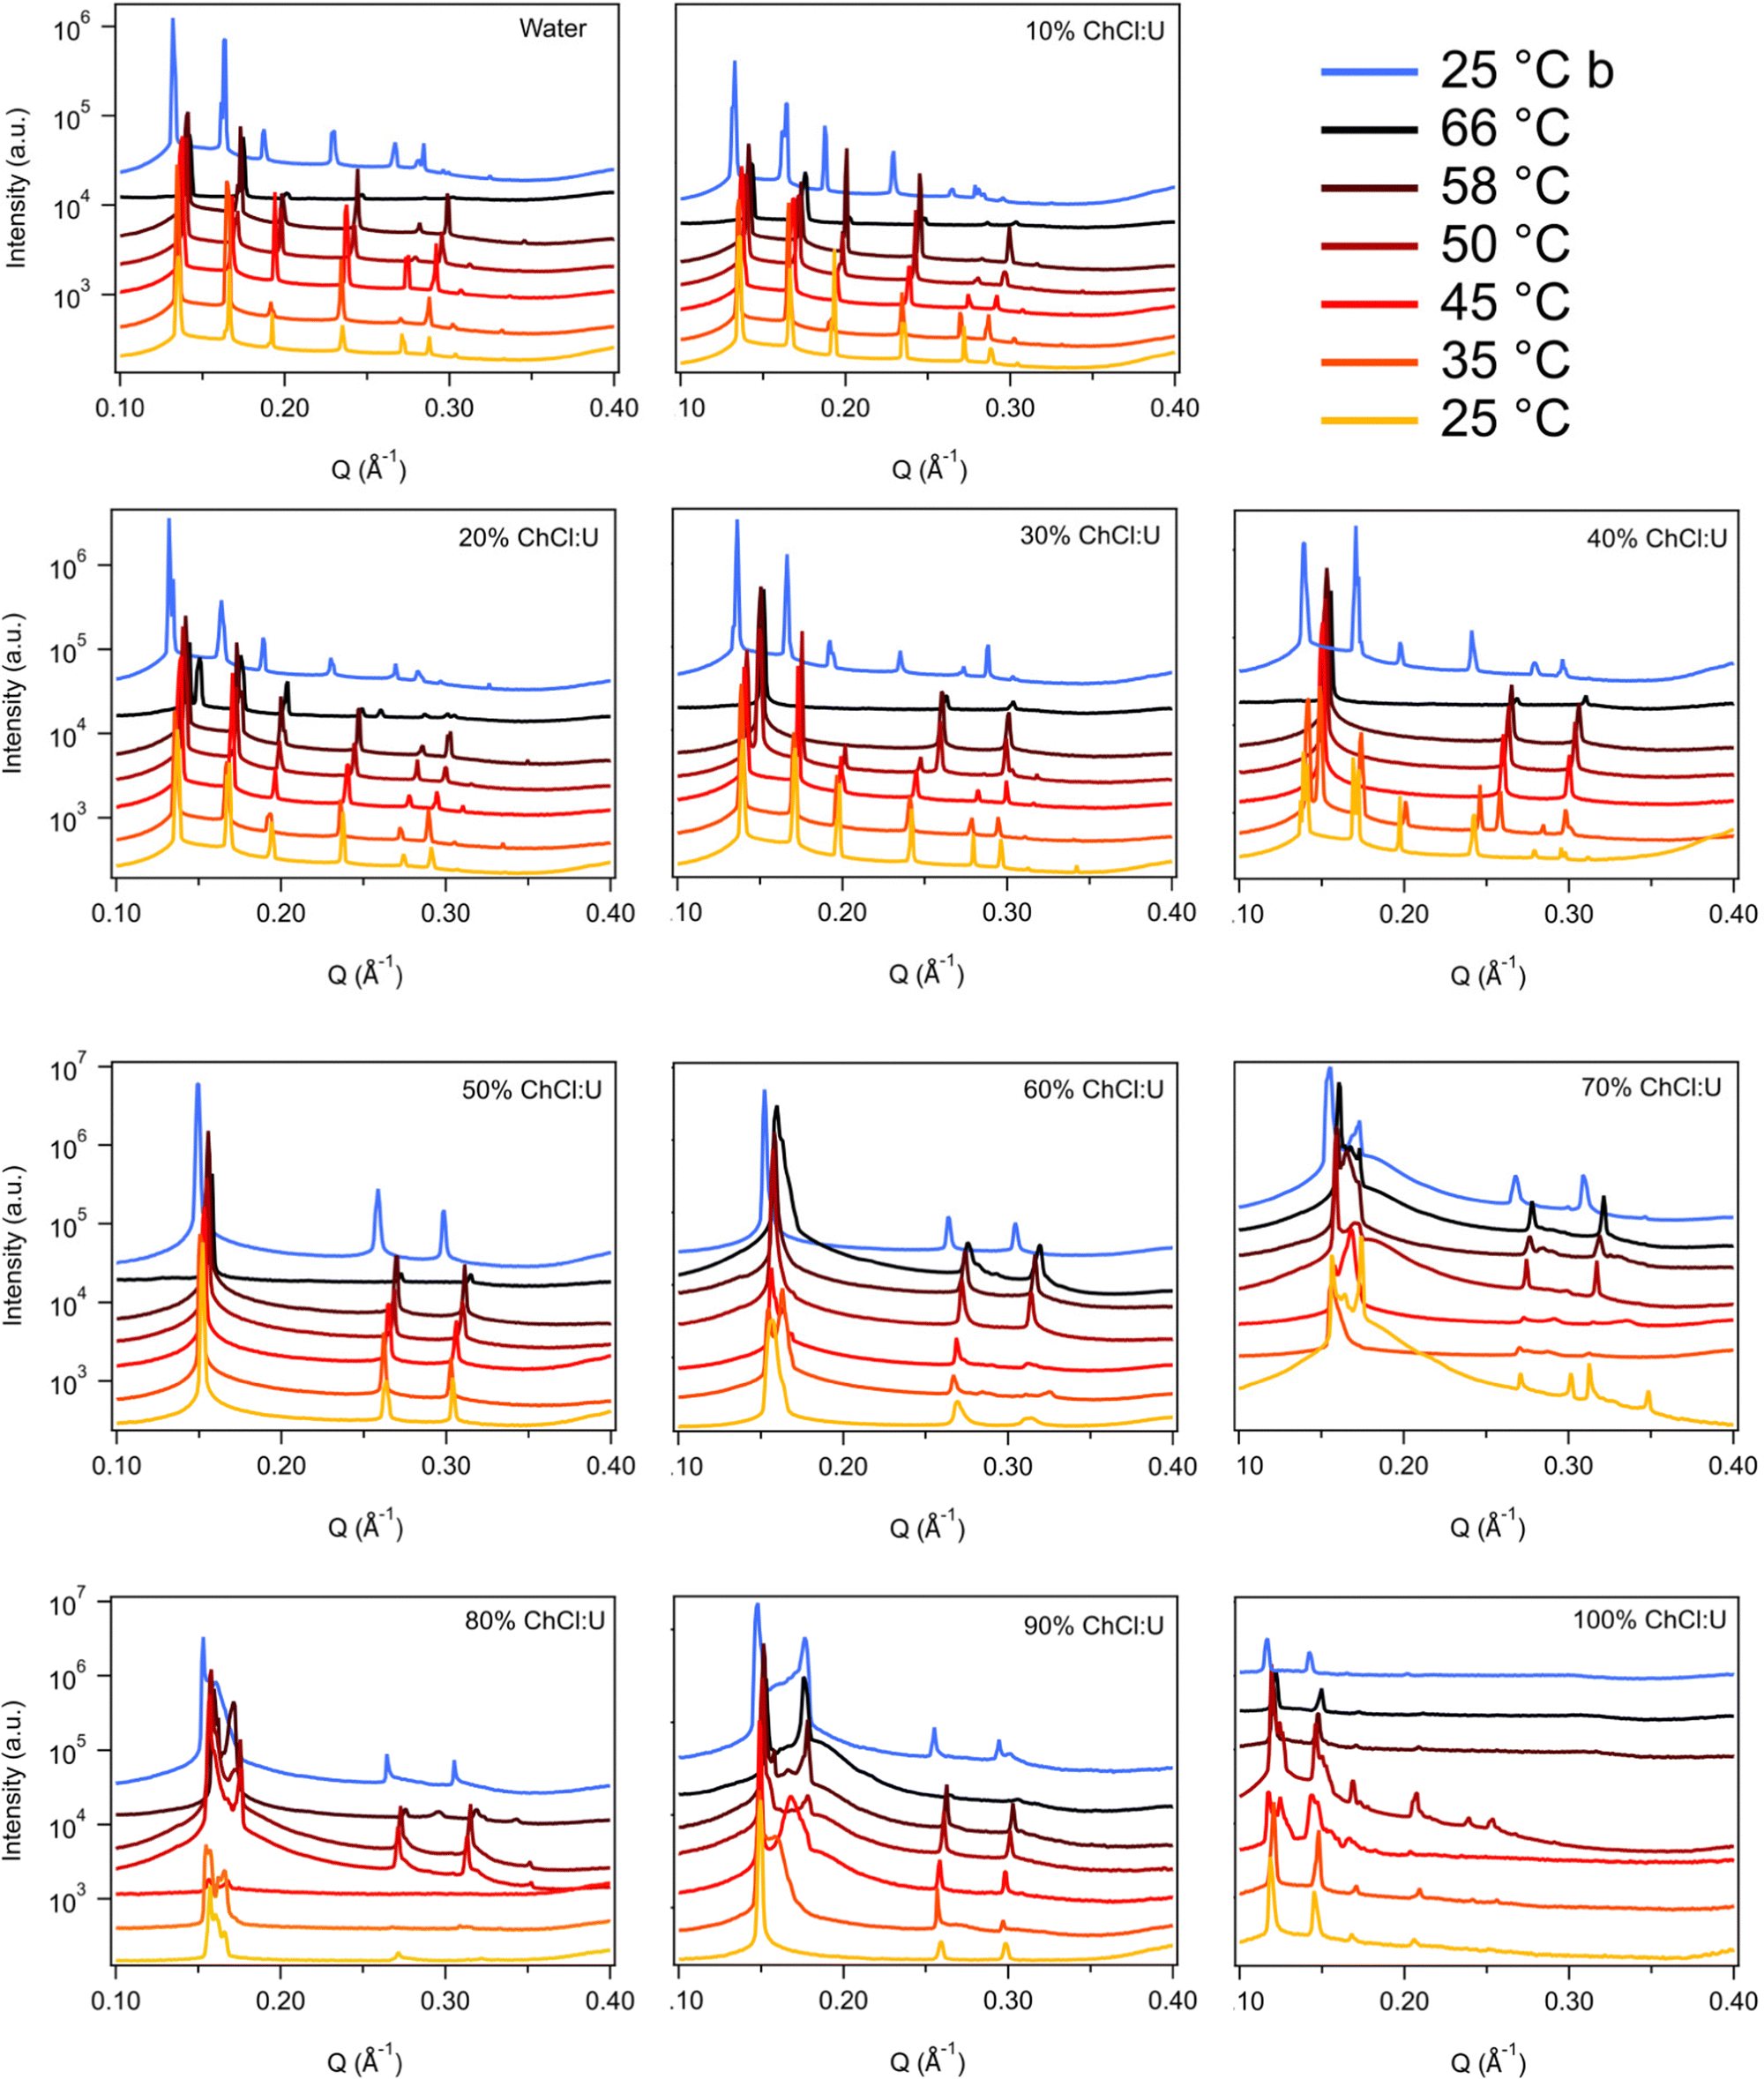 | ||
| Fig. 3 SAXS patterns of 10 wt% phytantriol in mixtures of water and ChCl:U from 25–66 °C. Blue patterns labelled 25 °C b were taken after cooling from 66 °C. Data are offset vertically for clarity. | ||
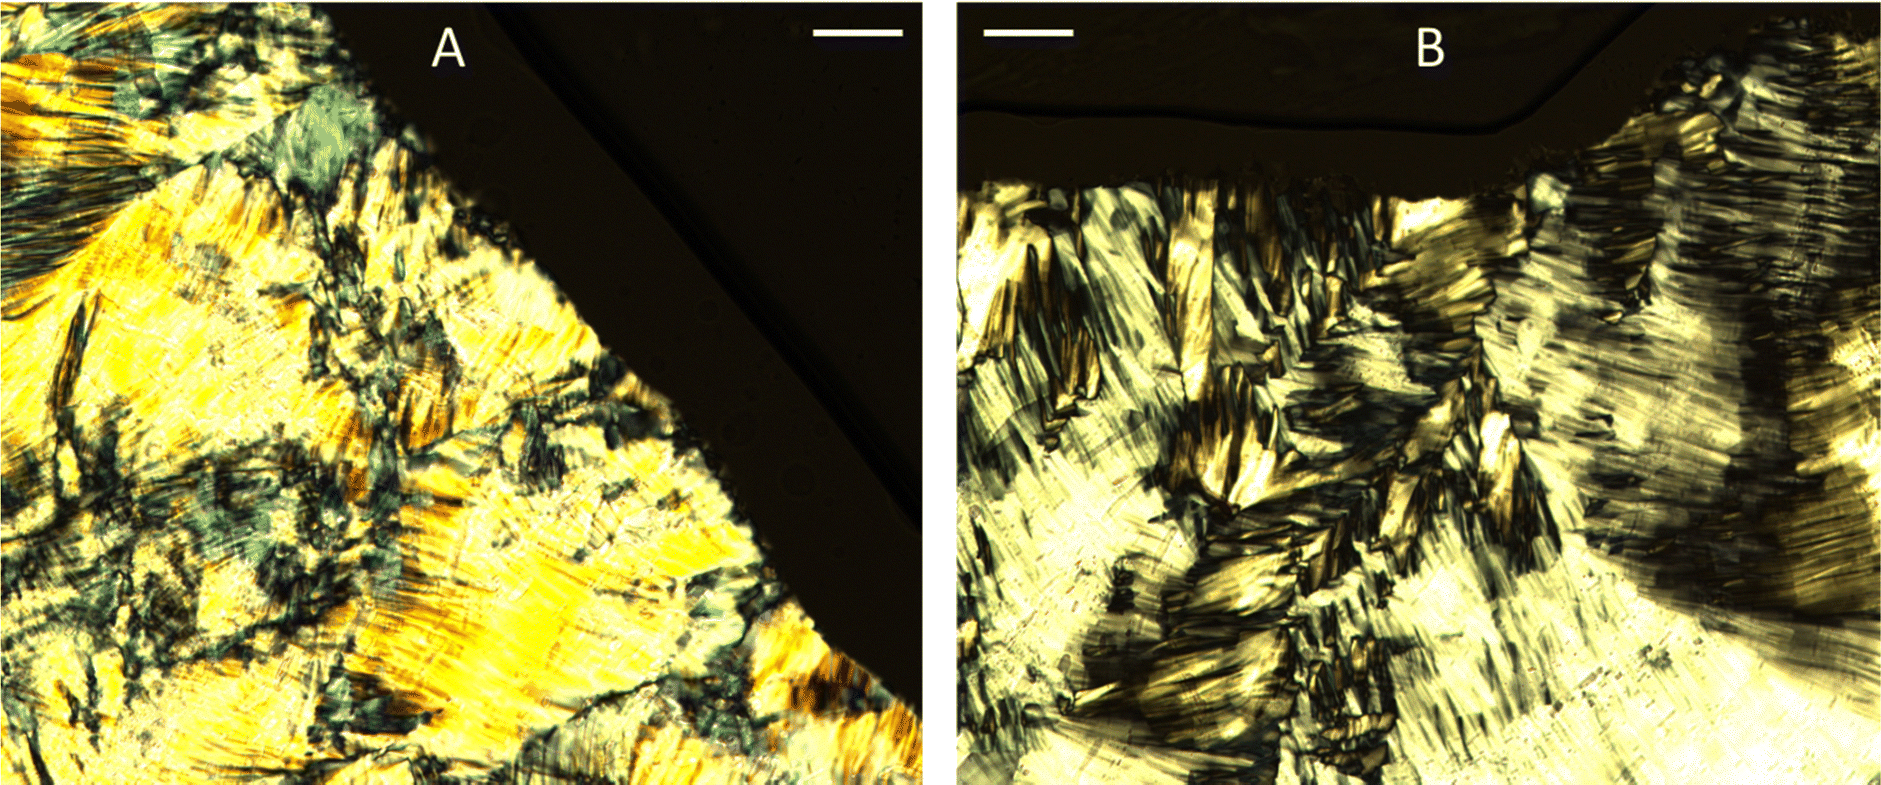 | ||
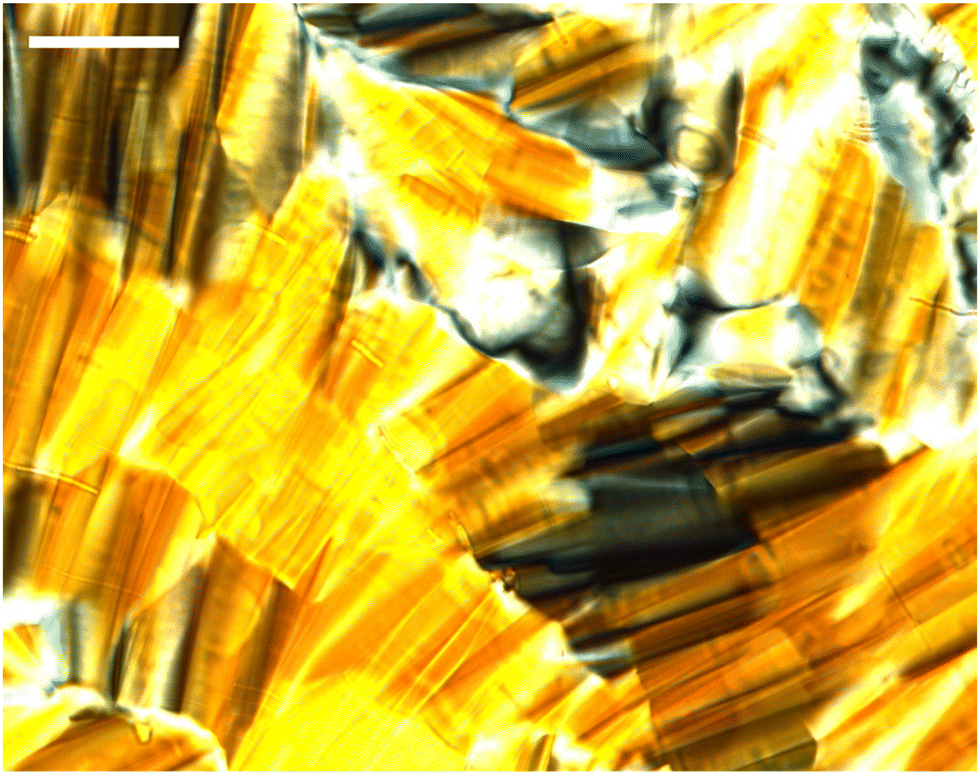
| Fig. 4 Illustrative images from cross polarised microscopy showing a hexagonal phase formed by 10 wt% phytantriol in solvent containing 90 wt% ChCl:U and 10 wt% water (A) or 60 wt% ChCl:U and 40 wt% water (B) at 25 °C. Scale bars are 100 μm. | ||
In water 10 wt% phytantriol formed a Pn3m cubic phase, as shown by the definitive scattering patterns in Fig. 3, in agreement with the literature.16,17 This phase was retained on heating to 66 °C, which is higher than previously reported, and will be discussed in more detail below.
The Pn3m cubic phase that persisted with heating to 66 °C was also observed for 10 wt% phytantriol in 100% ChCl:U, although the intensity of the peaks decreased with increasing temperature compared to the intensity at 25 °C, suggesting that this phase may be melting in the DES.
The impact of changing water content on the lipid phase formation is demonstrated in Fig. 5. Mixtures with low DES content (up to 30 wt% ChCl:U) had scattering patterns consistent with a Pn3m cubic phase at room temperature which was confirmed by the absence of birefringent textures under cross polarised microscopy. With heating, samples containing 20 and 30 wt% ChCl:U underwent a transition to an inverse hexagonal phase, as demonstrated by the change in Bragg peaks shown in Fig. 3. The phase change observed in SAXS for the mixture containing 30 wt% ChCl:U was not observed in microscopy. However, this may be due to challenges such as evaporation of the water, kinetic pressures from the coverslip, or different heating rates on a microscope slide compared to in a SAXS plate. Given the clarity of the related SAXS patterns, we are confident that the transition from cubic to hexagonal observed for this sample is genuine.
 | ||
| Fig. 5 SAXS patterns of 10 wt% phytantriol in mixtures of water and ChCl:U at 25 °C. Data for the solvent mixture of 70/30 ChCl:U/water has been omitted for clarity. Data are offset vertically for clarity. | ||
The trend continued with the sample containing 40 wt% ChCl:U showing a coexisting Pn3m/hexagonal phase at room temperature that transitioned to pure hexagonal with heating. This phase transition was also observed by microscopy where the sample showed no birefringence at room temperature but transitioned to a hexagonal phase on heating to ∼30 °C (Fig. S2, ESI†). Samples with intermediate water/DES solvent contents (50, 60 and 90 wt% ChCl:U) had scattering patterns consistent with a hexagonal phase that persisted with heating. However, the SAXS patterns of the samples containing 70 and 80 wt% ChCl:U had low scattering intensity or were inconclusive with poorly defined peaks (Fig. 3). This is attributed to either air bubbles, or the beam hitting the side of the well. An example of the two-dimensional image collected for one of these systems is shown in Fig. S3 (ESI†). For these systems, the presence of a hexagonal phase was confirmed by cross polarised optical microscopy which demonstrated birefringent textures consistent with a hexagonal phase (Fig. S4, ESI†).
The phase diagram determined for 10 wt% phytantriol in ChCl:U/water mixtures is shown in Fig. 6. Based on the SAXS measurements, crystal phases were still present at 66 °C. However, in cross polarised microscopy there was evidence of flow and melting for all compositions near 65 °C. This is most likely due to the different heat distribution and sample volume differences on a slide compared to the plate setup in SAXS. There were also challenges with high-temperature observations using cross polarised microscopy as the sample would flow out of field of view, and there were concerns about water evaporation even with the coverslip being sealed.
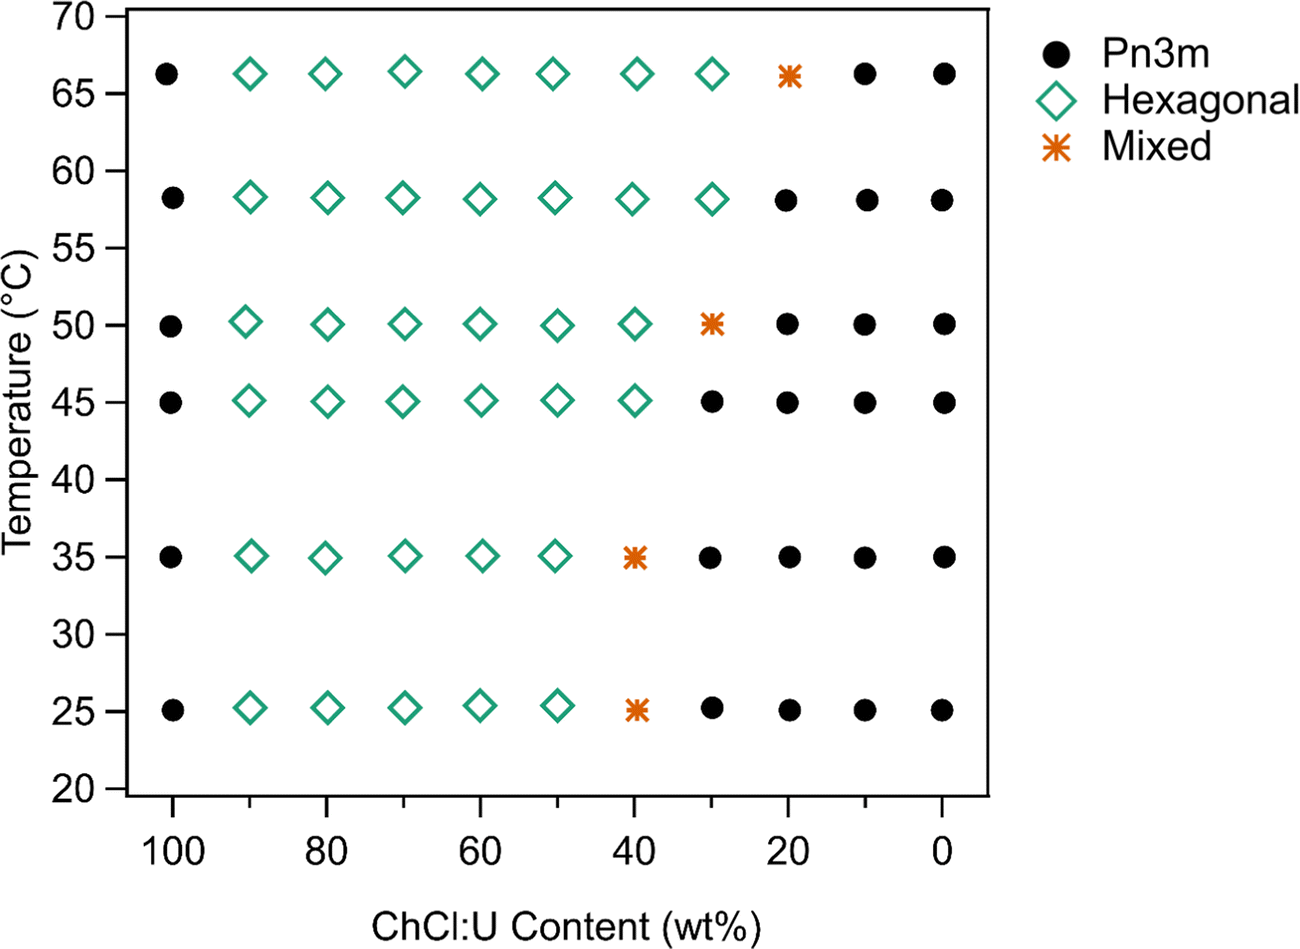 | ||
| Fig. 6 Phase diagram of 10 wt% phytantriol as a function of ChCl:U/water% and temperature. The X-axis refers to the ChCl:U content in the solvent; the concentration of phytantriol is always 10 wt% with 90 wt% solvent. | ||
As discussed above, phytantriol in either water or ChCl:U forms a Pn3m cubic phase across the temperature range studied. However, the addition of even small amounts of water to ChCl:U leads to in an inverse hexagonal phase. Both the Pn3m and inverse hexagonal phases have been observed for phytantriol in water in previous studies.17 Based on the SAXS scattering patterns, the ‘mixed’ phases identified in Fig. 6 are co-existing hexagonal and Pn3m.
According to the literature, 10 wt% phytantriol in water forms a Pn3m cubic phase that will transition to an inverse hexagonal phase with heating to ∼60 °C (Fig. S1, ESI†). This transition was not observed in our experiments (neither SAXS nor cross polarised microscopy) and reasons for this will be discussed below. Samples with low DES contents appear to have a preference towards the inverse hexagonal phase, with gradually decreasing transition temperatures from near 66 °C at 20 wt% ChCl:U to room temperature at 40 wt%.
A higher concentration of phytantriol in the same solvents was then investigated to see if a similar trend persisted. SAXS scattering patterns for 30 wt% phytantriol are shown in Fig. 7. These are representative patterns taken from >5 replicates performed for each sample.
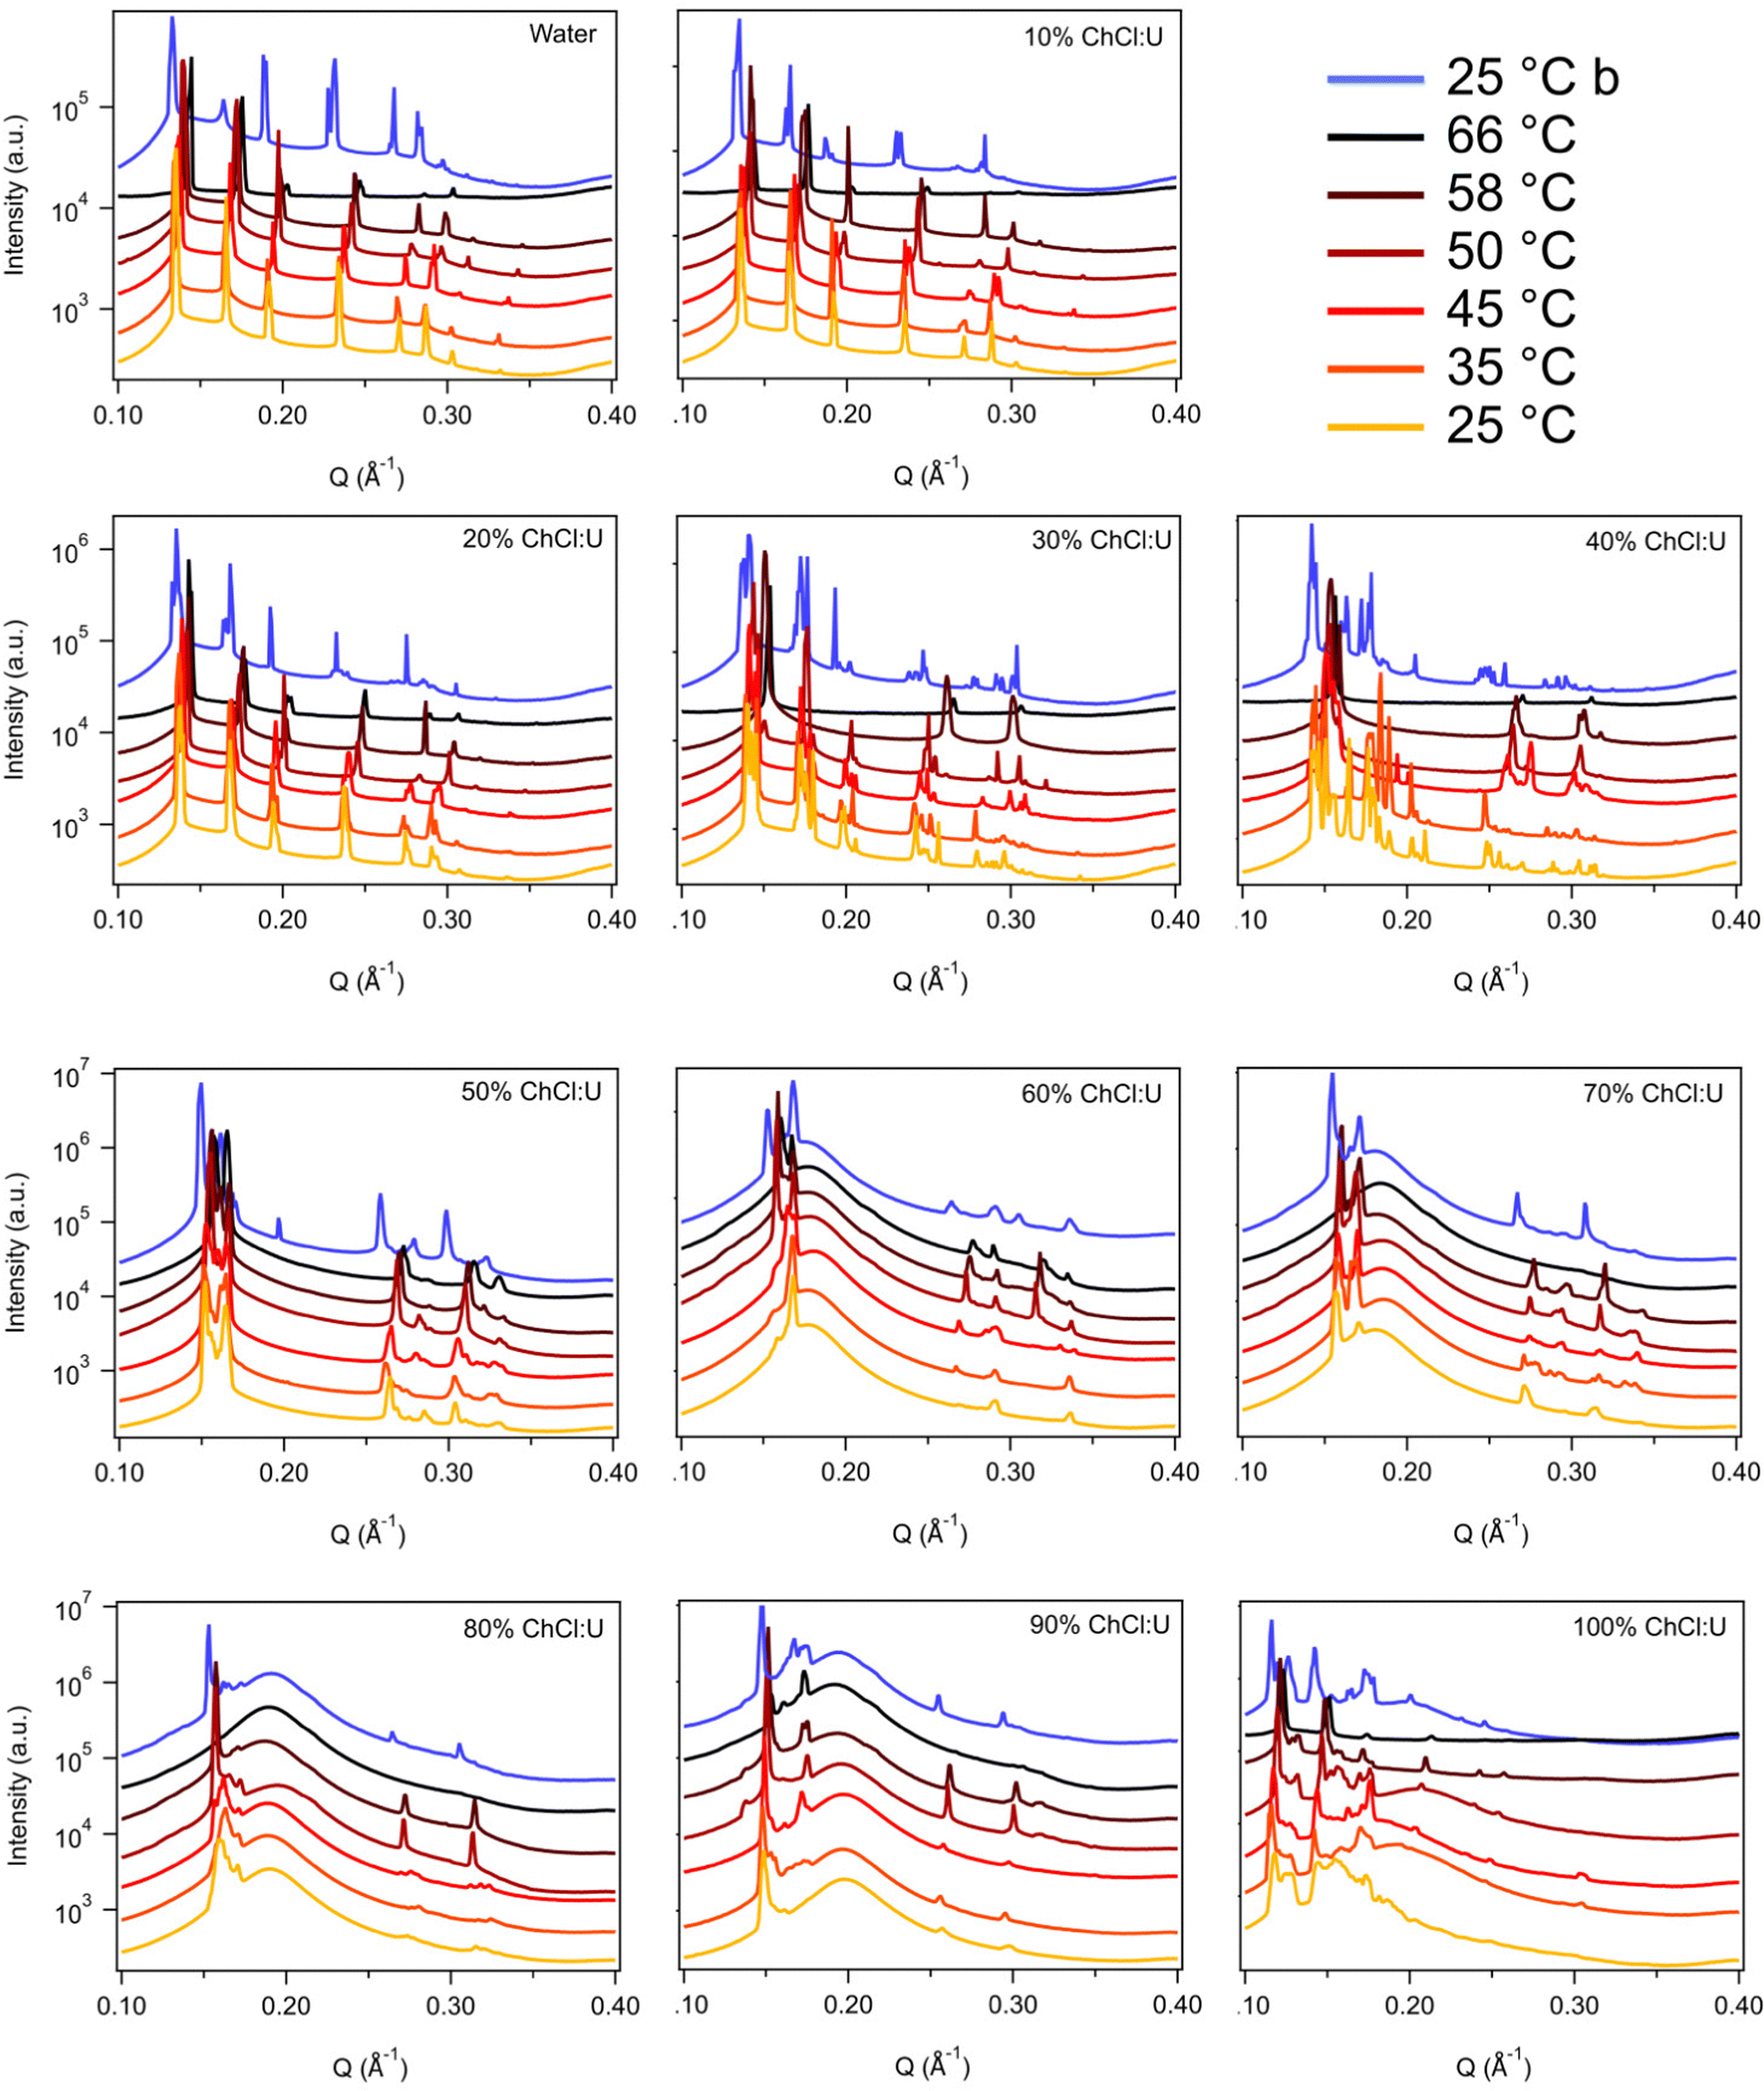 | ||
| Fig. 7 SAXS patterns of 30 wt% phytantriol in mixtures of water and ChCl:U from 25–66 °C. Blue patterns labelled 25 °C b are SAXS data taken after cooling from 66 °C. Data are offset vertically for clarity. | ||
In water, 30 wt% phytantriol formed a clear Pn3m phase across the temperature range studied, as demonstrated by the SAXS spectra shown in Fig. 7. This is consistent with existing literature, although as with the 10 wt% sample, there was no evidence of a transition to an inverse hexagonal phase with heating, which has been reported previously (Fig. S1, ESI†).
In pure ChCl:U, 30 wt% phytantriol formed a Pn3m cubic phase. However, as shown in Fig. 7, there were multiple peaks which could not be assigned, possibly coexisting cubic or other phases which changed with heating. Cross polarised microscopy of this sample at 25 °C showed regions of hexagonal phase, embedded in stiff, non-birefringent regions, consistent with a cubic phase. ChCl:U has a very high viscosity (reported values range from 449–1571 mPa s−139) and cubic phases are even more viscous. Therefore, it is possible that this system has not yet equilibrated, leading to mixed phases in both the SAXS spectra and cross polarised microscopy.
While the behaviour was similar for 30 wt% and 10 wt% phytantriol systems, there were some notable differences, in particular the existence of a broad ‘amorphous’ peak near a q value of 0.2 Å−1 in the SAXS spectra of samples with high concentrations of ChCl:U (see for example the 90% ChCl:U data in Fig. 7). This broad peak is most likely due to an amorphous phase such as a micellar or sponge phase and its scattering pattern is similar to that assigned “L2” in the original phase diagram of phytantriol proposed by Barauskas et al.17 No birefringent textures were observed by cross polarised optical microscopy of these samples, further supporting the idea that this broad peak is due to a relatively disordered structure.
Samples with low water contents (10–40 wt% water) were assigned to a mixed amorphous/hexagonal phase, due to the existence of the broad peak discussed above, as well as the presence of smaller peaks, consistent with a hexagonal phase (see for example 60 wt% ChCl:U at 25 °C, Fig. 7). Furthermore, these samples exhibited obvious textures consistent with hexagonal phases under cross polarised microscopy (Fig. 9).
A phase transition from cubic to hexagonal was observed for 30 wt% phytantriol in 30 wt% ChCl:U by both SAXS and cross polarised microscopy. In contrast, samples with higher water contents (0–20 wt% ChCl:U) did not exhibit any birefringence on heating under cross polarised microscopy, confirming that a hexagonal phase did not emerge.
The phase behaviour based on SAXS and supported by cross polarised microscopy is shown in Fig. 8. Unlike 10 wt% phytantriol, there was some evidence of phase melting at 66 °C for samples containing 10 and 20 wt% water (90 and 80 wt% ChCl:U respectively) (Fig. 7). Cross polarised microscopy showed some evidence of flow and melting for most samples near 65 °C. As with the 10 wt% phase diagram, the ‘Mixed’ phase shown in Fig. 8 was attributed to coexisting inverse hexagonal and Pn3m phases based on mixed SAXS patterns and the presence of both birefringent and isotropic textures observed using crossed polarising microscopy. The SAXS spectra for 30% and 40 wt% ChCl:U at 25 °C initially appears to be mixed non-equilibrated systems. Heating to 66 °C resulted in the emergence of a hexagonal phase, but subsequent cooling resulted in a return of the highly complex spectra, suggesting that this mixed phase is the equilibrated state.
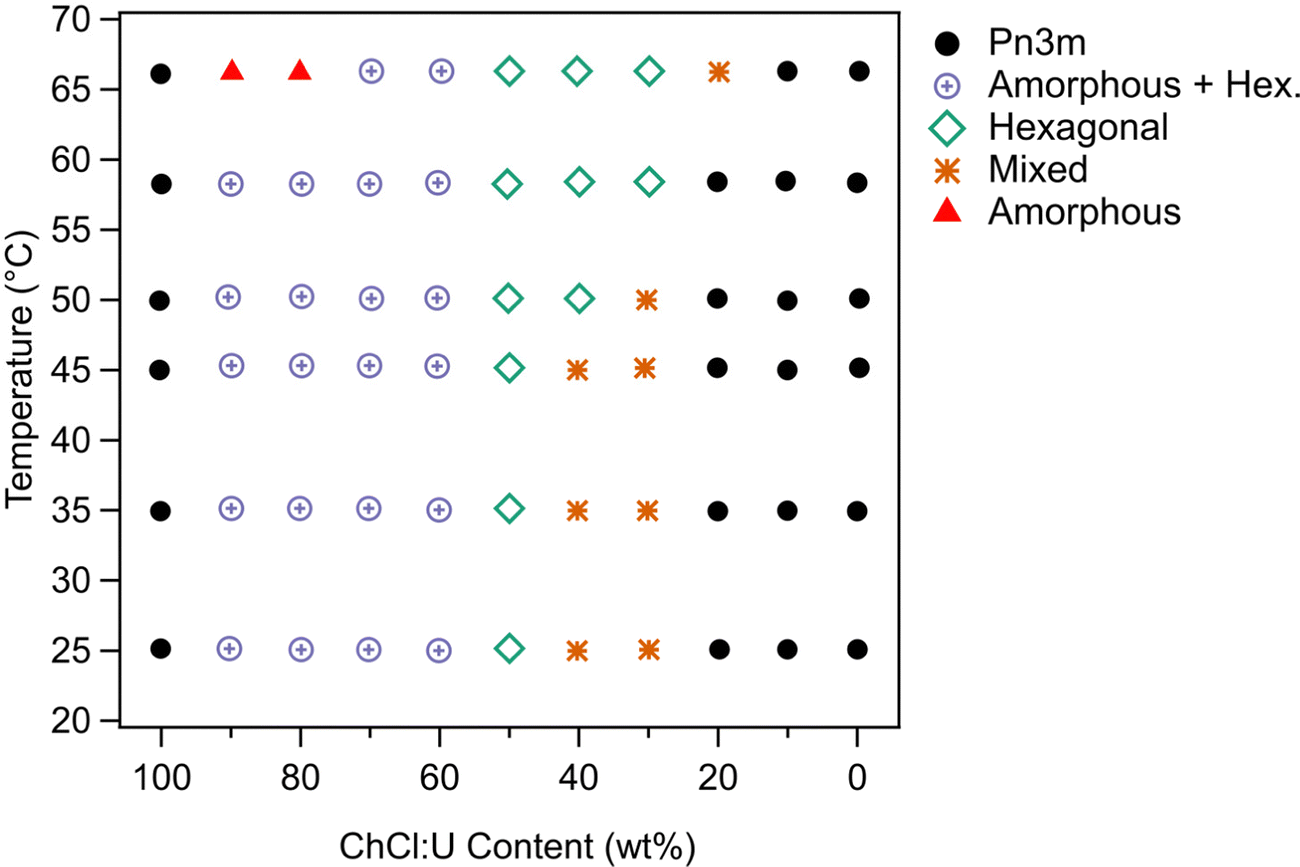 | ||
| Fig. 8 Phase diagram of 30 wt% phytantriol as a function of ChCl:U/water% and temperature. The X-axis refers to the ChCl:U content in the solvent; the concentration of phytantriol is always 30 wt% with 70 wt% solvent. | ||
 | ||
| Fig. 9 Cross polarised optical microscopy image of 30 wt% phytantriol in a solvent mixture containing 70 wt% ChCl:U and 30 wt% water at 25 °C. Birefringent texture is consistent with a hexagonal phase. Scale bar is 100 μm. | ||
To date there have been no reports of the phase behaviour of phytantriol in a DES. Previous studies in water showed that phytantriol (up to ∼60 wt%) will form a Pn3m cubic phase at room temperature that transitions to a hexagonal phase on heating.16,17,19 However, the temperature of this phase transition varies significantly with manufacturer and purity of the phytantriol, and in some cases the hexagonal phase exists only across a very narrow temperature range.16 Here we did not observe a transition to a hexagonal phase for phytantriol in water, at either phytantriol concentration, across the temperature range studied (up to 66 °C). It is possible that for this particular batch of phytantriol the transition exists at a higher temperature or exists over such a narrow temperature range that it was not observed. It should be noted that for both 10 and 30 wt% phytantriol, the intensity of the SAXS peaks at 66 °C had decreased significantly compared to the intensity at 25 °C (Fig. 3 and 7), suggesting that the cubic phase is becoming less ordered, without any obvious transition to a hexagonal phase.
Previous studies have examined the phase behaviour of phytantriol in ionic liquids, which share some properties with DESs. These studies generally found that phytantriol formed fewer, and less complex phases in ionic liquids than in water.22,23 For example, 30 wt% phytantriol in 1-methylimidazolium pentadecafluorooctanoate formed micellar and lamellar phases at low and intermediate water contents, and only with addition of 75 wt% water was a cubic phase (Ia3d) observed.21 This ionic liquid possesses polar, hydrophobic and fluorocarbon regions, making it a more complex solvent than ChCl:U. Similarly, the other ionic liquids that have been studied as self-assembly media for phytantriol are generally composed of an amphiphilic cation and a small polar anion.22,23 It is likely that the presence of the hydrophobic tail on the cation increases the solvation of phytantriol, reducing the drive toward self-assembly. Furthermore, previous research has demonstrated that these cations can act as co-surfactants, increasing headgroup area,29 which could explain the preference for less curved lamellar and micellar structures rather than cubic and inverse hexagonal structures. Previous research found that higher solvent cohesion with hydroxyl groups and small chains led to greater phase diversity23 which aligns well with the results presented here as ChCl:U is composed of small, polar molecules that are non-amphiphilic and so cannot act as cosurfactants. Furthermore, previous studies of the nanostructure and physical properties of ChCl:U have demonstrated that it has high cohesion and strong solvent nanostructure.39 The influence of water on self-assembly in ionic liquids has been demonstrated previously.64
In addition to phase transitions, the lattice parameters of lipid phases offer significant information about solvent interactions. Fig. 10 shows the lattice parameters of 10 and 30 wt% phytantriol in ChCl:U/water mixtures at 25 and 66 °C. Lattice parameters for all of the temperatures studied are shown in Fig. S5 (ESI†) and in Tables 1 and 2 for samples containing 10 wt% or 30 wt% phytantriol, respectively. The equations used to calculate the lattice parameter are shown in the ESI.†
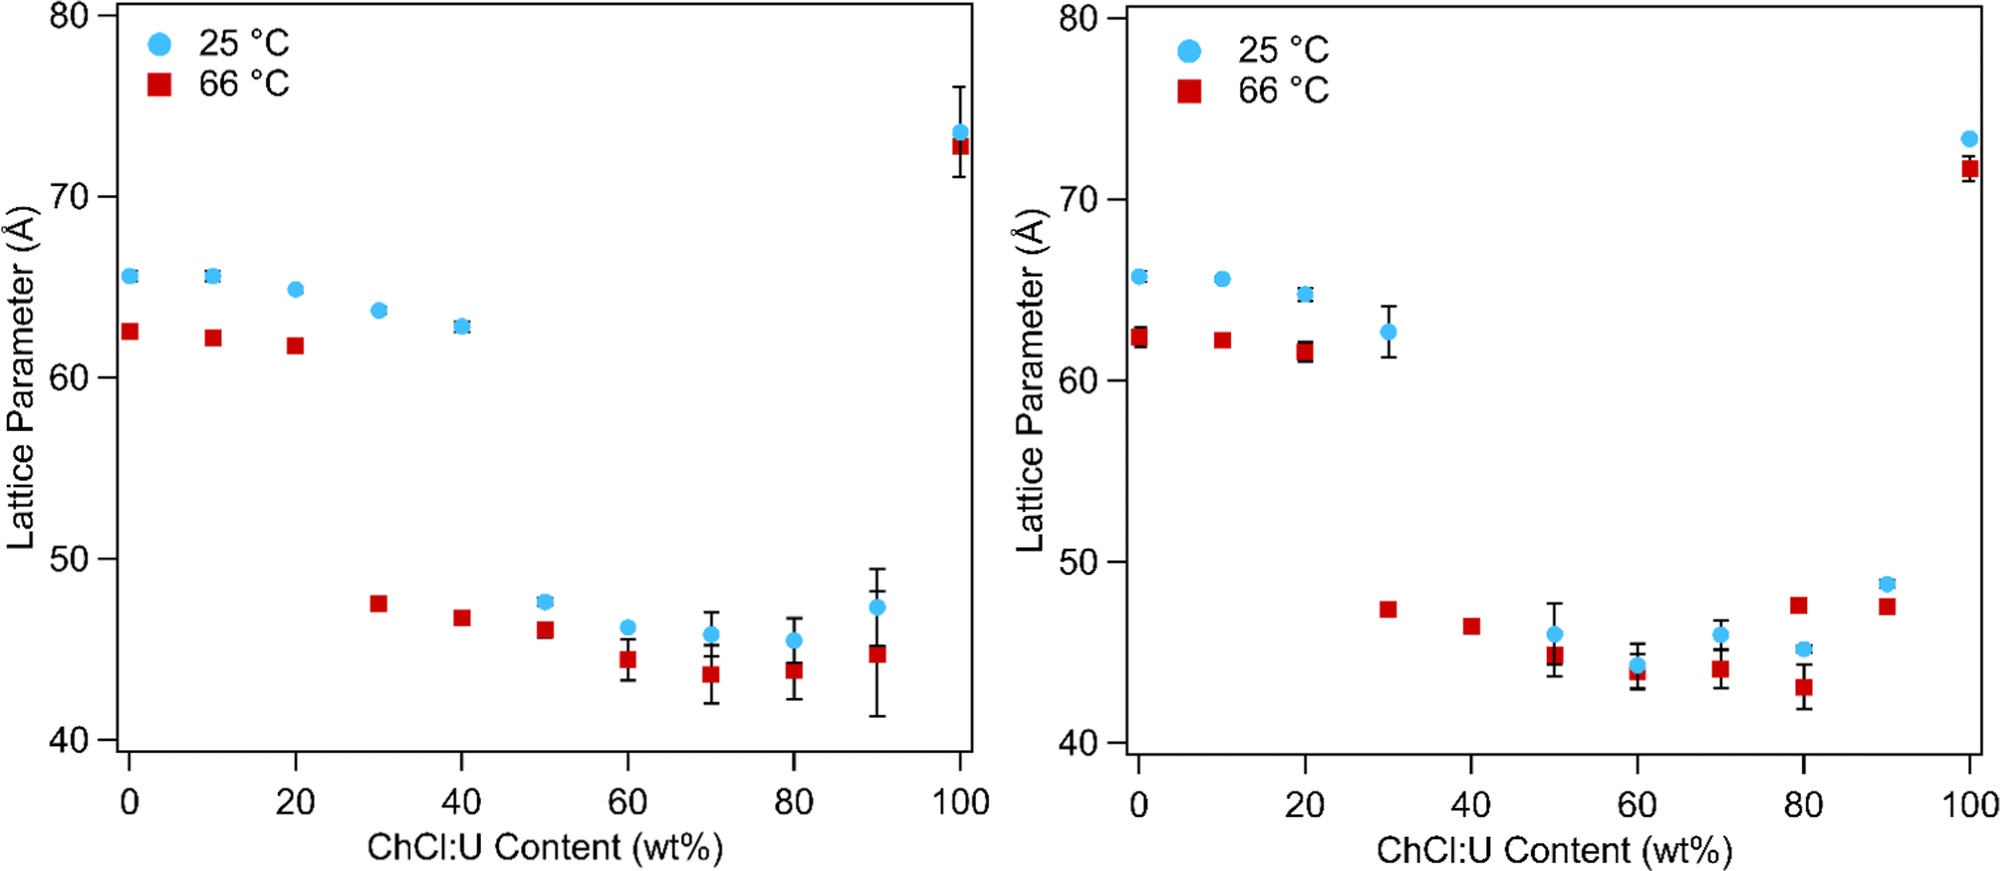 | ||
| Fig. 10 Lattice parameters for 10 wt% (left) and 30 wt% (right) phytantriol as functions of ChCl:U content (wt%) at 25 and 66 °C. Lattice parameters above 60 Å are associated with the Pn3m cubic phase while lattice parameters below 60 Å are associated with the inverse hexagonal phase. Error bars are based on the standard deviation of multiple measurements and in some cases are smaller than the symbols. | ||
| ChCl:U content (wt%) | 25 °C | 35 °C | 45 °C | 50 °C | 58 °C | 66 °C |
|---|---|---|---|---|---|---|
| a Pn3m. b Inverse Hexagonal. | ||||||
| 100 | 74 ± 3a | 74 ± 3a | 73 ± 3a | 74 ± 2a | 73 ± 2a | 73 ± 1a |
| 90 | 47 ± 2b | 47 ± 3b | 47 ± 3b | 46 ± 4b | 45 ± 4b | 45 ± 4b |
| 80 | 45 ± 1b | 44 ± 3b | 44 ± 3b | 45 ± 2b | 44 ± 2.5b | 44 ± 2b |
| 70 | 46 ± 1b | 45 ± 2b | 45 ± 2b | 44 ± 2b | 44 ± 2b | 44 ± 2b |
| 60 | 46 ± 1b | 46 ± 2b | 46 ± 2b | 45 ± 1b | 45 ± 1b | 44 ± 1b |
| 50 | 48 ± 1b | 48 ± 1b | 48 ± 1b | 47 ± 1b | 47 ± 1b | 47 ± 1b |
| 40 | 63 ± 1a | 63 ± 1a | 48 ± 1b | 48 ± 1b | 47 ± 1b | 47 ± 1b |
| 49 ± 1b | 49 ± 1b | |||||
| 30 | 64 ± 1a | 64 ± 1a | 63 ± 1a | 62 ± 1a | 48 ± 1b | 48 ± 1b |
| 48 ± 1b | ||||||
| 20 | 65 ± 1a | 65 ± 1a | 64 ± 1a | 63 ± 1a | 62 ± 1a | 62 ± 1a |
| 48 ± 1b | ||||||
| 10 | 66 ± 1a | 66 ± 1a | 65 ± 1a | 64 ± 1a | 63 ± 1a | 62 ± 1a |
| 0 | 66 ± 1a | 66 ± 1a | 65 ± 1a | 64 ± 1a | 63 ± 1a | 63 ± 1a |
| ChCl:U content (%) | 25 °C | 35 °C | 45 °C | 50 °C | 58 °C | 66 °C |
|---|---|---|---|---|---|---|
| a Where a phase could not be identified, no lattice parameter is given. b Pn3m. c Inverse hexagonal. | ||||||
| 100 | 73 ± 3b | 73 ± 3b | 73 ± 3b | 73 ± 1b | 72 ± 1b | |
| 90 | 49 ± 1c | 48 ± 2c | 48 ± 1c | 48 ± 1c | 48 ± 1c | 48 ± 1c |
| 80 | 45 ± 1c | 45 ± 2c | 44 ± 2c | 45 ± 2c | 46 ± 1c | 43 ± 1c |
| 70 | 46 ± 1c | 45 ± 2c | 44 ± 2c | 44 ± 2c | 45 ± 1c | 44 ± 1c |
| 60 | 44 ± 1c | 45 ± 2c | 45 ± 2c | 45 ± 2c | 45 ± 2c | 44 ± 1c |
| 50 | 46 ± 2c | 46 ± 2c | 46 ± 2c | 45 ± 2c | 45 ± 1c | 45 ± 1c |
| 40 | 47 ± 2c | 47 ± 1c | 46 ± 1c | 46 ± 1c | ||
| 30 | 63 ± 1b | 63 ± 2b | 62 ± 1b | 62 ± 1b | 62 ± 1b | 47 ± 1c |
| 48 ± 1c | 48 ± 1c | |||||
| 20 | 65 ± 1b | 65 ± 1b | 64 ± 1b | 63 ± 1b | 62 ± 1b | 62 ± 1b |
| 48 ± 1c | ||||||
| 10 | 66 ± 1b | 66 ± 1b | 65 ± 1b | 63 ± 1b | 63 ± 1b | 62 ± 1b |
| 0 | 66 ± 1b | 66 ± 1b | 65 ± 1b | 64 ± 1b | 63 ± 1b | 62 ± 1b |
In water the Pn3m phase had a lattice parameter of 65–67 Å at 25 °C which decreased to 62 ± 1 Å with heating to 66 °C. This is consistent with literature values which report a lattice parameter for phytantriol in water of 64–68 Å at 25 °C which decreases with heating due to increased disorder of the hydrocarbon chains.16–19
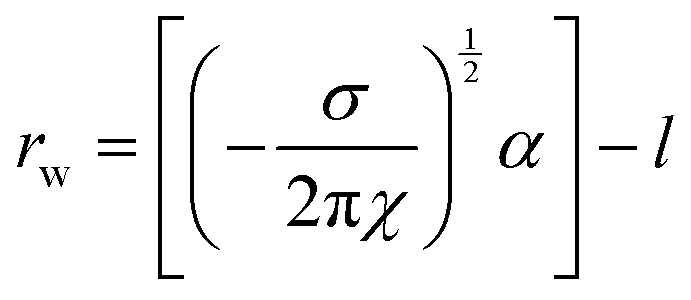
Addition of ChCl:U causes a gradual decrease in packing parameter to 63 ± 1 Å, until at intermediate DES concentrations, there is a change from a cubic to an inverse hexagonal phase. Large uncertainties make it difficult to discern patterns in the lattice parameter of the hexagonal phase, which varied between 45–48 ± 1 Å, although it does appear that there is a minimum near 40 wt% water. The Pn3m phase formed in pure ChCl:U has a significantly larger lattice parameter (74 ± 3 Å) than that of the cubic phase in water. In previous work, an increase in the lattice parameter of the Ia3d cubic phase of phytantriol was also observed with addition of the ionic liquid ethanolammonium formate, although an explanation for this change was not provided.24 The lattice parameter of cubic phases can increase due to increased thickness of the lipid layer, repulsion across the water channel (e.g. by incorporation of charged lipids), or by increased stiffness of the lipid layer, as with the addition of cholesterol.66 In the case of ChCl:U, the increase in the lattice parameter of nearly 10 Å compared to water may be due to the nanostructure of the solvent which may cause strong self-association of the molecules, causing a repulsive force between the lipid layers and increasing the size of the channel.67 The radius of the channel (rw) can be calculated using eqn (1):
 | (1) |
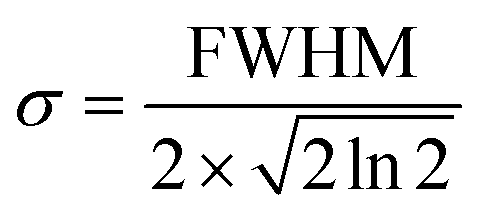
An additional physical property that can be gained from SAXS data is the domain size of the liquid crystals. This parameter was calculated for a subset of the data based on the full width at half maximum (FWHM) of the first reflection peak, which is related to the standard deviation σ by:
 | (2) |
 | (3) |
The domain sizes obtained using the above equations are shown in Table 3. At 25 °C the domain sizes of the Pn3m cubic phase of 10 wt% phytantriol in water and in ChCl:U were the same. However, with heating to 66 °C the domain size of the phase in water increased, while in ChCl:U it decreased. The domain size of 10 wt% phytantriol in the solvent containing both water and ChCl:U was significantly larger than in either of the pure solvents. This is most likely due to the fact that it is in the inverse hexagonal phase which is a 2-D structure, so it is perhaps not surprising that the linear dimension is larger than the 3-D cubic Pn3m phase. On heating, the domain size of the hexagonal phase decreased by 20%. Clearly, the DES is influencing the domain size, but given the complexity of this ternary system it is difficult to identify with certainty the underlying interactions.
| Solvent | Domain size (μm) at 25 °C | Domain size (μm) at 66 °C |
|---|---|---|
| Water | 3.1 | 3.6 |
| 50/50 Water/ChCl:U | 5.2 | 4.4 |
| ChCl:U | 3.1 | 2.5 |
Importantly, while pure ChCl:U and water both result in a cubic phase, their mixture resulted in a hexagonal phase. Furthermore, it would appear that the addition of ChCl:U caused the cubic-to-hexagonal phase transition to occur at lower temperatures (above 66 °C for 10 wt% ChCl:U, but only ∼50 °C for 30 wt% ChCl:U) until at 50 wt% ChCl:U no cubic phase was observed. This suggests that ChCl:U when combined with water promotes greater negative curvature (i.e. an inverse hexagonal over a cubic phase). There are several possible explanations for this effect, including the possibility that the choline molecules are able to insert into the hydrophobic regions, but only when the DES components are sufficiently hydrated to free them from the neat solvent nanostructure. Alternatively, it may be that the DES is able to dehydrate the lipid headgroups, thus decreasing the headgroup area and increasing negative curvature, but this does not explain the return to a Pn3m phase at 100% ChCl:U. Further investigations using molecular dynamics simulations and utilising other DESs may shed further light on the interactions between lipids and DES molecules, and the underlying forces driving self-assembly.
As discussed above, solvent cohesion has been cited as an important indicator for promoting lipid self-assembly. Previous work examining surfactant self-assembly in ionic liquids and DESs has made use of the Gordon parameter as a means of explaining phase diversity.70–72 However, as raised in our recent review,39 it is difficult to define ‘1 mol’ of a DES, which is a critical variable in calculating the Gordon Parameter.39 This calculation becomes even more difficult in the presence of water. Therefore, we do not feel that a valid Gordon Parameter can be calculated for these solvent systems. We attempted to correlate solvent surface tension with phase behaviour. However, the surface tension of ChCl:U decreases continually with addition of water (data not shown) which does not match with the phase diversity identified here. Given the complexity of solvent nanostructure, degree of disassociation, and incorporation of water into that nanostructure, it seems unlikely that a single parameter could accurately predict the self-assembly behaviour of lipids in DES/water mixtures, especially in a quaternary system such as this. Further complication comes from the relative molar proportions of solvent to lipid as the ratio of DES to water changes. Fig. 11 shows the number of solvent molecules per molecule of phytantriol for each solvent composition for both 10 and 30 wt% phytantriol. In pure DES, the number of solvent molecules to each phytantriol molecule is just 34.5 (11.5 choline chloride + 23 urea) and 9 (3 choline chloride and 6 urea) for 10 and 30 wt% phytantriol respectively. The ratio of solvent molecules to phytantriol increases significantly with addition of water to 100 (5.75 choline chloride + 11.5 urea + 83 water) for 10 wt% phytantriol and 26 (1.5 choline chloride + 3 urea + 21.5 water) for 30 wt% phytantriol in 50% ChCl:U. In pure water, the solvent ratio is almost five times higher than in pure ChCl:U at 166 and 43 molecules of solvent per lipid molecule for 10 and 30 wt% phytantriol respectively. This demonstrates the significantly different solvent environment that exists at different water contents, even beyond the chemical and nanostructure environment. Furthermore, this significant difference in the ratio of solvent to lipid molecules could account for the broad amorphous peak observed in samples containing 30 wt% phytantriol and high ChCl:U concentrations; there may be insufficient solvent molecules to solvate all of the lipid in the hexagonal phase and so the rest remains in an amorphous L2 phase.
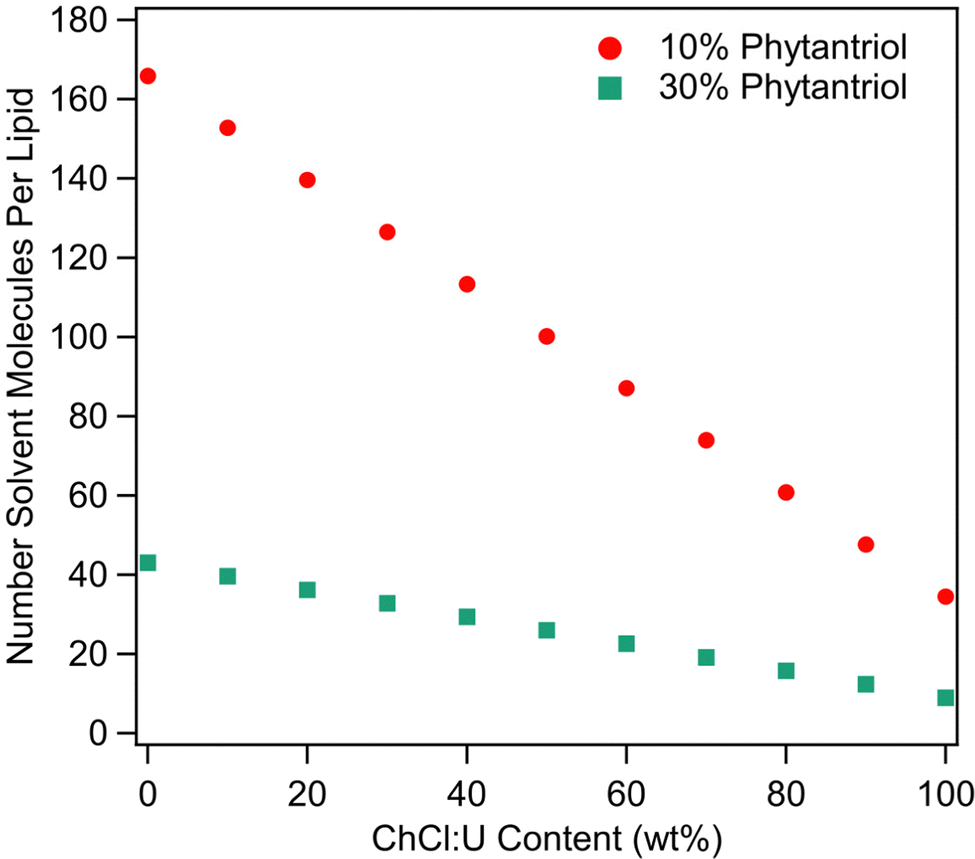 | ||
| Fig. 11 Number of solvent molecules (i.e. choline chloride, plus urea, plus water) per molecule of phytantriol at different ChCl:U contents for both 10 and 30 wt% phytantriol. | ||
Conclusions
To date, examination of phytantriol phase behaviour in non-aqueous solvents has been extremely limited. Here we show that phytantriol behaves very differently in ChCl:U/water mixtures than it does in either of the pure solvents. Specifically, in both neat ChCl:U and neat water, phytantriol formed a Pn3m cubic phase and yet in mixtures of the two solvents, an inverse hexagonal phase emerged. In solvents with high water contents it appears that addition of ChCl:U causes a preference toward the inverse hexagonal phase, resulting in a decreasing transition temperature with increasing DES in the solvent. The same trends were observed for both 10 and 30 wt% phytantriol. This is exciting for several reasons. First, it presents an easy method for fine-tuning phase formation as well as for release of loaded materials. For example, in drug delivery applications, this system could be used to cause a transition from a slow-release hexagonal phase, to a faster release cubic phase simply by the addition of water. Second, it further supports previous research suggesting that intermediate mixtures of DESs and water can have behaviour that is quite distinct from either of the pure solvents.39Future research will examine other DESs in an effort to elucidate how the solvent, its components, and its nanostructure, are influencing lipid assembly. Other phytantriol concentrations will also be explored to build a more complete phase diagram which will contribute to future applications of these advanced materials.
Conflicts of interest
There are no conflicts to declare.Acknowledgements
This research was supported by an AINSE Ltd. Early Career Researcher Grant (ECRG) (SB). This research was undertaken on the SAXS/WAXS beamline at the Australian Synchrotron, part of ANSTO. GB and SB acknowledge the support of the ARC Research Council grant DP190101010. A. E. is supported by an Australian Research Council (ARC) Discovery Early Career Research Award (DECRA) (DE220100511).References
- R. Mezzenga, J. M. Seddon, C. J. Drummond, B. J. Boyd, G. E. Schröder-Turk and L. Sagalowicz, Adv. Mater., 2019, 31, 1900818 CrossRef PubMed.
- J. J. Vallooran, S. Handschin, S. M. Pillai, B. N. Vetter, S. Rusch, H.-P. Beck and R. Mezzenga, Adv. Funct. Mater., 2016, 26, 181–190 CrossRef CAS.
- C. R. Thorn, N. Thomas, B. J. Boyd and C. A. Prestidge, Drug Delivery Transl. Res., 2021, 11, 1598–1624 CrossRef CAS PubMed.
- H. M. G. Barriga, M. N. Holme and M. M. Stevens, Angew. Chem., Int. Ed., 2019, 58, 2958–2978 CrossRef CAS PubMed.
- S. T. Hyde, in Handbook of Applied Surface and Colloid Chemistry, ed K. Holmberg, Wiley, West Sussex, England, 2002, ch. 16, pp. 299–332 Search PubMed.
- C. W. Reese, Z. I. Strango, Z. R. Dell, S. Tristram-Nagle and P. E. Harper, Phys. Chem. Chem. Phys., 2015, 17, 9194–9204 RSC.
- A. Åkesson, T. Lind, N. Ehrlich, D. Stamou, H. Wacklin and M. Cárdenas, Soft Matter, 2012, 8, 5658–5665 RSC.
- J. N. Israelachvili, D. J. Mitchell and B. W. Ninham, J. Chem. Soc., Faraday Trans. 2, 1976, 72, 1525–1568 RSC.
- B. J. Boyd, D. V. Whittaker, S.-M. Khoo and G. Davey, Int. J. Pharm., 2006, 309, 218–226 CrossRef CAS PubMed.
- J. Zhai, C. Fong, N. Tran and C. J. Drummond, ACS Nano, 2019, 13, 6178–6206 CrossRef CAS PubMed.
- Y. Chen, P. Ma and S. Gui, BioMed Res. Int., 2014, 2014, 815981 Search PubMed.
- R. Rajabalaya, M. N. Musa, N. Kifli and S. R. David, Drug Des., Dev. Ther., 2017, 11, 393–406 CrossRef CAS PubMed.
- R. Bala, R. K. Sindhu, B. Kaundle, R. Madaan and S. Cavalu, J. Mol. Struct., 2021, 1245, 131117 CrossRef CAS.
- L. S. Nielsen, L. S. Helledi and L. Schubert, Drug Dev. Ind. Pharm., 2001, 27, 1073–1081 CrossRef PubMed.
- R. Negrini and R. Mezzenga, Langmuir, 2011, 27, 5296–5303 CrossRef CAS PubMed.
- Y.-D. Dong, A. W. Dong, I. Larson, M. Rappolt, H. Amenitsch, T. Hanley and B. J. Boyd, Langmuir, 2008, 24, 6998–7003 CrossRef CAS PubMed.
- J. Barauskas and T. Landh, Langmuir, 2003, 19, 9562–9565 CrossRef CAS.
- P. Astolfi, E. Giorgini, V. Gambini, B. Rossi, L. Vaccari, F. Vita, O. Francescangeli, C. Marchini and M. Pisani, Langmuir, 2017, 33, 12369–12378 CrossRef CAS PubMed.
- Y.-D. Dong, I. Larson, T. Hanley and B. J. Boyd, Langmuir, 2006, 22, 9512–9518 CrossRef CAS PubMed.
- C. Darmanin, S. Sarkar, L. Castelli and C. E. Conn, Cryst. Growth Des., 2016, 16, 5014–5022 CrossRef CAS.
- Y. Shen, T. L. Greaves, D. F. Kennedy, A. Weerawardena, N. Kirby, G. Song and C. J. Drummond, Phys. Chem. Chem. Phys., 2014, 16, 21321–21329 RSC.
- T. L. Greaves, A. Weerawardena, I. Krodkiewska and C. J. Drummond, J. Phys. Chem. B, 2008, 112, 896–905 CrossRef CAS PubMed.
- T. L. Greaves, A. Weerawardena, C. Fong and C. J. Drummond, J. Phys. Chem. B, 2007, 111, 4082–4088 CrossRef CAS PubMed.
- X. Mulet, D. F. Kennedy, T. L. Greaves, L. J. Waddington, A. Hawley, N. Kirby and C. J. Drummond, J. Phys. Chem. Lett., 2010, 1, 2651–2654 CrossRef CAS.
- T. L. Greaves and C. J. Drummond, Chem. Soc. Rev., 2013, 42, 1096–1120 RSC.
- T. L. Greaves and C. J. Drummond, Chem. Soc. Rev., 2008, 37, 1709–1726 RSC.
- E. C. Wijaya, T. L. Greaves and C. J. Drummond, Faraday Discuss., 2013, 167, 191–215 RSC.
- E. C. Wijaya, F. Separovic, C. J. Drummond and T. L. Greaves, Phys. Chem. Chem. Phys., 2016, 18, 24377–24386 RSC.
- S. J. Bryant, R. Atkin, M. Gradzielski and G. G. Warr, J. Phys. Chem. Lett., 2020, 11, 5926–5931 CrossRef CAS PubMed.
- S. J. Bryant, C. J. Jafta, R. Atkin, M. Gradzielski and G. G. Warr, J. Colloid Interface Sci., 2019, 540, 515–523 CrossRef CAS PubMed.
- S. J. Bryant, K. Wood, R. Atkin and G. G. Warr, Soft Matter, 2017, 13, 1364–1370 RSC.
- S. J. Bryant, R. Atkin and G. G. Warr, Langmuir, 2017, 33, 6878–6884 CrossRef CAS PubMed.
- S. J. Bryant, R. Atkin and G. G. Warr, Soft Matter, 2016, 12, 1645–1648 RSC.
- Q. Li, J. Wang, N. Lei, M. Yan, X. Chen and X. Yue, Phys. Chem. Chem. Phys., 2018, 20, 12175–12181 RSC.
- I. Manasi, S. J. Bryant, O. S. Hammond and K. J. Edler, in Advances in Botanical Research, ed R. Verpoorte, G.-J. Witkamp and Y. H. Choi, Academic Press, 2021, vol. 97, pp. 41–68 Search PubMed.
- A. Sanchez-Fernandez, O. S. Hammond, K. J. Edler, T. Arnold, J. Doutch, R. M. Dalgliesh, P. Li, K. Ma and A. J. Jackson, Phys. Chem. Chem. Phys., 2018, 20, 13952–13961 RSC.
- T. Arnold, A. J. Jackson, A. Sanchez-Fernandez, D. Magnone, A. E. Terry and K. J. Edler, Langmuir, 2015, 31, 12894–12902 CrossRef CAS PubMed.
- M. Basu, P. A. Hassan and S. B. Shelar, J. Mol. Liq., 2023, 375, 121301 CrossRef CAS.
- S. J. Bryant, A. J. Christofferson, T. L. Greaves, C. F. McConville, G. Bryant and A. Elbourne, J. Colloid Interface Sci., 2022, 608, 2430–2454 CrossRef CAS PubMed.
- P. V. de Almeida Pontes, I. Ayumi Shiwaku, G. J. Maximo and E. A. Caldas Batista, Food Chem., 2021, 352, 129346 CrossRef CAS PubMed.
- M. Francisco, A. van den Bruinhorst, L. F. Zubeir, C. J. Peters and M. C. Kroon, Fluid Phase Equilib., 2013, 340, 77–84 CrossRef CAS.
- Y. H. Choi, J. van Spronsen, Y. Dai, M. Verberne, F. Hollmann, I. W. C. E. Arends, G.-J. Witkamp and R. Verpoorte, Plant Physiol., 2011, 156, 1701–1705 CrossRef CAS PubMed.
- L. Yang, L. Li, H. Hu, J. Wan and P. Li, Pharmaceutics, 2019, 11, 18 CrossRef CAS PubMed.
- M. Faggian, S. Sut, B. Perissutti, V. Baldan, I. Grabnar and S. Dall'Acqua, Molecules, 2016, 21, 1531 CrossRef PubMed.
- I. R. Igwe, C. J. Okonkwo, U. G. Uzoukwu and C. O. Onyenegecha, Annu. Res. Rev. Biol., 2015, 8, 1–8 CrossRef.
- A. P. Abbott, G. Capper, D. L. Davies, R. K. Rasheed and V. Tambyrajah, Chem. Commun., 2003, 70–71, 10.1039/B210714G.
- J. T. Gorke, F. Srienc and R. J. Kazlauskas, in Ionic Liquid Applications: Pharmaceuticals, Therapeutics, and Biotechnology, American Chemical Society, 2010, vol. 1038, ch. 14, pp. 169–180 Search PubMed.
- J. T. Gorke, F. Srienc and R. J. Kazlauskas, Chem. Commun., 2008, 1235–1237, 10.1039/B716317G,.
- M. A. Kareem, F. S. Mjalli, M. A. Hashim and I. M. AlNashef, Fluid Phase Equilib., 2012, 314, 52–59 CrossRef CAS.
- H. Zhao and G. A. Baker, J. Chem. Technol. Biotechnol., 2013, 88, 3–12 CrossRef CAS.
- A. P. Abbott, G. Capper, K. J. McKenzie and K. S. Ryder, J. Electroanal. Chem., 2007, 599, 288–294 CrossRef CAS.
- S. J. Bryant, M. A. da Silva, K. M. Z. Hossain, V. Calabrese, J. L. Scott and K. J. Edler, RSC Adv., 2020, 10, 37023–37027 RSC.
- D. Carriazo, M. C. Serrano, M. C. Gutiérrez, M. L. Ferrer and F. del Monte, Chem. Soc. Rev., 2012, 41, 4996–5014 RSC.
- A. Paiva, R. Craveiro, I. Aroso, M. Martins, R. L. Reis and A. R. C. Duarte, ACS Sustainable Chem. Eng., 2014, 2, 1063–1071 CrossRef CAS.
- S. J. Bryant, M. A. da Silva, K. M. Z. Hossain, V. Calabrese, J. L. Scott and K. J. Edler, Nanoscale Adv., 2021, 3, 2252–2260 RSC.
- A. Sanchez-Fernandez, K. J. Edler, T. Arnold, R. K. Heenan, L. Porcar, N. J. Terrill, A. E. Terry and A. J. Jackson, Phys. Chem. Chem. Phys., 2016, 18, 14063–14073 RSC.
- S. J. Bryant, M. N. Awad, A. Elbourne, A. J. Christofferson, A. V. Martin, N. Meftahi, C. J. Drummond, T. L. Greaves and G. Bryant, J. Mater. Chem. B, 2022, 10, 4546–4560 RSC.
- S. J. Richardson, P. A. Staniec, G. E. Newby, J. L. Rawle, A. R. Slaughter, N. J. Terrill, J. M. Elliott and A. M. Squires, Chem. Commun., 2015, 51, 11386–11389 RSC.
- M. Rittman, H. Amenitsch, M. Rappolt, B. Sartori, B. M. D. O’Driscoll and A. M. Squires, Langmuir, 2013, 29, 9874–9880 CrossRef CAS PubMed.
- Z. Li and P. I. Lee, Int. J. Pharm., 2016, 505, 283–288 CrossRef CAS PubMed.
- Y. Xie, H. Dong, S. Zhang, X. Lu and X. Ji, J. Chem. Eng. Data, 2014, 59, 3344–3352 CrossRef CAS.
- C. Darmanin, C. E. Conn, J. Newman, X. Mulet, S. A. Seabrook, Y.-L. Liang, A. Hawley, N. Kirby, J. N. Varghese and C. J. Drummond, ACS Comb. Sci., 2012, 14, 247–252 CrossRef CAS PubMed.
- A. Synchrotron, ScatterBrain Software, https://archive.synchrotron.org.au/aussyncbeamlines/saxswaxs/software-saxswaxs).
- S. Paporakis, J. Binns, D. Yalcin, C. J. Drummond, T. L. Greaves and A. V. Martin, J. Chem. Phys., 2023, 158, 014902 CrossRef CAS PubMed.
- D. Marsh, Handbook of Lipid Bilayers, CRC Press, Boca Raton, 2 edn, 2013 Search PubMed.
- A. I. I. Tyler, H. M. G. Barriga, E. S. Parsons, N. L. C. McCarthy, O. Ces, R. V. Law, J. M. Seddon and N. J. Brooks, Soft Matter, 2015, 11, 3279–3286 RSC.
- T. J. McIntosh, A. D. Magid and S. A. Simon, Biochemistry, 1989, 28, 7904–7912 CrossRef CAS PubMed.
- E. Nazaruk, P. Miszta, S. Filipek, E. Górecka, E. M. Landau and R. Bilewicz, Langmuir, 2015, 31, 12753–12761 CrossRef CAS PubMed.
- R. W. James, The Optical Principles of The Diffraction of X-Rays, G. Bell and Sons Ltd., London, 1962 Search PubMed.
- O. S. Hammond, D. T. Bowron and K. J. Edler, ACS Sustainable Chem. Eng., 2019, 7, 4932–4940 CrossRef CAS.
- Z. Chen, T. L. Greaves, C. Fong, R. A. Caruso and C. J. Drummond, Phys. Chem. Chem. Phys., 2012, 14, 3825–3836 RSC.
- S. J. Bryant, A. Garcia, R. J. Clarke and G. G. Warr, Soft Matter, 2021, 17, 2688–2694 RSC.
Footnote |
| † Electronic supplementary information (ESI) available. See DOI: https://doi.org/10.1039/d3tb00554b |
| This journal is © The Royal Society of Chemistry 2023 |