Poisson–Nernst–Planck framework for modelling ionic strain and temperature sensors
Gaurav
Balakrishnan
 a,
Jiwoo
Song
a,
Aditya S.
Khair
a,
Jiwoo
Song
a,
Aditya S.
Khair
 b and
Christopher J.
Bettinger
*ac
aMaterials Science and Engineering, Carnegie Mellon University, 5000 Forbes Avenue, Pittsburgh, PA 15213, USA. E-mail: cbetting@andrew.cmu.edu
bChemical Engineering, Carnegie Mellon University, 5000 Forbes Avenue, Pittsburgh, PA 15213, USA
cBiomedical Engineering, Carnegie Mellon University, 5000 Forbes Avenue, Pittsburgh, PA 15213, USA
First published on 17th February 2023
Abstract
Ionically conductive hydrogels are gaining traction as sensing and structural materials for use bioelectronic devices. Hydrogels that feature large mechanical compliances and tractable ionic conductivities are compelling materials that can sense physiological states and potentially modulate the stimulation of excitable tissue because of the congruence in electro-mechanical properties across the tissue-material interface. However, interfacing ionic hydrogels with conventional DC voltage-based circuits poses several technical challenges including electrode delamination, electrochemical reaction, and drifting contact impedance. Utilizing alternating voltages to probe ion-relaxation dynamics has been shown to be a viable alternative for strain and temperature sensing. In this work, we present a Poisson–Nernst–Planck theoretical framework to model ion transport under alternating fields within conductors subject to varying strains and temperatures. Using simulated impedance spectra, we develop key insights about the relationship between frequency of the applied voltage perturbation and sensitivity. Lastly, we perform preliminary experimental characterization to demonstrate the applicability of the proposed theory. We believe this work provides a useful perspective that is applicable to the design of a variety of ionic hydrogel-based sensors for biomedical and soft robotic applications.
10th Anniversary StatementHappy 10 year Anniversary to the editors, associate editors, staff, and the entire Journal of Materials Chemistry B team! JMCB has been a trusted partner in helping the Bettinger group disseminate our discoveries in biomaterials and biomaterials science to the scientific community. We are grateful for the long-term and productive partnership that we have forged together over the years. Our lab looks forward to continuing this collaboration for decades more in the future. |
Introduction
Synthetic and natural polymer-based hydrogels are being explored as structural and sensing elements for using in implantable and wearable bioelectronics systems.1–4 Their similarity in physiochemical properties to soft biological tissue has shown improved biocompatibility and integration with the human body in comparison to other materials.5–9 As a result, hydrogel-based bioelectronics have been utilized in interfacing with the peripheral nervous system,10,11 the cardiac system,12 and the skin.13,14 Hydrogels have been used as various components in sensors such as structural elements and substrates,15,16 coatings and intermediate layers,17,18 and sensing elements.19,20 Heterogenous integration of the electronics with hydrogels has proved challenging arising from manufacturing incompatibilities between swollen polymer networks and typical microfabrication techniques, including the use of solvents, acids, strong vacuums and high temperatures.4,21–24 As a result, conductive hydrogels are being explored to serve as the primary device components with common applications thus far including strain and temperature sensing.25–28Strain sensing has several applications in physiological monitoring including cardiac and respiratory output,12,29,30 pressure and tactile sensing,31–33 and muscular function.34,35 Temperature can also be used as a physiological marker of health,36 internal organ function,37 and tracking wound healing.38 For many such applications, fully hydrogel-based sensors promise low biotoxicity,39,40 high conformity and adhesion with soft curvilinear tissues,41,42 and integration and consolidation with the biological environment.43,44
To replace conventional thin-film metal conductors typically operated under non-alternating DC voltages, there has been a targeted effort in increasing the conductivity of soft hydrogels. This has been pursued through two primary means: (i) using conductive polymers such as PEDOT:PSS to form the hydrogel matrix;19,45,46 and (ii) utilizing conductive fillers such as metallic nano- and micro-particles (Au, Ag, Pt), carbon-based materials, ionic liquids,47–49 and MXenes within polymer matrices.50–54
There has been considerable success in applying these materials in sensing both mechanical deformation and temperature.55–58 However, there remain considerable barriers to adopting conductive hydrogels as a replacement to conventional conductors. These include electrochemical and mechanical stability, toxicity and biocompatibility of nanoparticle fillers and conjugated polymers, and the apparent trade-off between mechanical compliance and electrical conductivity.59–63
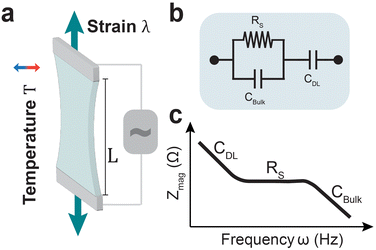
Ionic strain sensing has been explored for wearable devices,33,64 soft robotics,22,49 and cardiac output monitoring.12 Recent work has demonstrated that ionically conductive gels can also be designed to accurately monitor body temperature through wearable devices.32,65 Utilizing AC voltages and electrochemical impedance has been proposed as alternate measurement technique for hydrogel-based sensors (Fig. 1a).66–68 Electrochemical impedance spectroscopy (EIS) employs a range of small-amplitude AC voltage frequencies to probe ionic transport and relaxation phenomena in electrolytes.69 Using equivalent circuit models the electrode–electrolyte interface (Fig. 1b) can be described as a combination of physical parameters such as the double layer capacitance, bulk capacitance between electrodes, and solution resistance. These parameters can be extracted from recorded impedance spectra through data fitting (Fig. 1c).70,71 This eliminates the need to prioritize electronic conductivity using conjugated polymers and filler materials. Further, this technique is commonly applied in non-faradaic regimes with small voltage amplitudes (∼10 mV), contributing to electrochemical stability of the hydrogel conductors. Therefore, it is a non-destructive technique that avoids limitations of DC sensing techniques such as drifting interfacial impedance, electrode delamination, and faradaic reactions.
Here, we develop a theoretical framework to model electrochemical impedance spectra of ionic conductors, specifically in use as strain and temperature sensors. Using the Poisson–Nernst–Planck (PNP) system of equations, we build a microscopic picture of ions under the influence of the alternating electric fields. By varying the length scale and temperature of the electrochemical cell, we model the performance of ionic conductors as strain and temperature sensors, respectively. Further, we perform experimental characterization of strain and temperature sensing using sodium chloride (NaCl) electrolytes.
Poisson–Nernst–Planck model
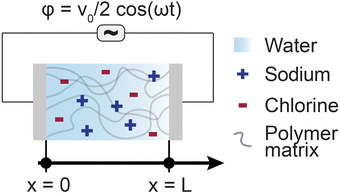
The Poisson–Nernst–Planck (PNP) framework consists of non-linear partial differential equations that model the behaviour of ions under electric fields.72 Applying oscillatory voltage fields within PNP equations allow for the modelling of electrochemical impedance properties of ionic systems.73–75 This approach has been successfully used to model the impedance of a variety of aqueous electrolytes and ionically conductive hydrogel systems.In this work, we model the electrochemical cell as a 1-dimensional system with an electrolyte sandwiched between ideally polarizable parallel-plate electrodes (Fig. 2). The Poisson equation (eqn (1)) describes a relationship between spatial charge distribution and a changing electric field. The Nernst–Planck equation (eqn (2)) encodes the nature of ion transport arising from a combination of passive diffusion and electromigration.
 | (1) |
 | (2) |
We also apply appropriate boundary conditions at each electrode to further define the problem. The first set of boundary conditions (eqn (3)) arises from the oscillating potential applied at each electrode (x = 0 and x = L).
 | (3) |
 | (4) |
We non-dimensionalize the system of equations using normalization parameters in Table 1 followed by linearization using perturbation expansions for ion density and potential (eqn (5) and (6)). For convenience, we switch from using trigonometric functions to complex exponentials to define the oscillatory perturbations.
| ñi = ñ0 + ñi,1eiωt | (5) |
![[small phi, Greek, tilde]](https://www.rsc.org/images/entities/i_char_e0e2.gif) = = ![[small phi, Greek, tilde]](https://www.rsc.org/images/entities/i_char_e0e2.gif) 1eiωt 1eiωt | (6) |
 | (7) |
 | (8) |
 | (9) |
 | (10) |
 | (11) |
| Parameter | Normalization term | Non-dimensional variable |
|---|---|---|
| Ionic density ni | Bulk ionic density n0 | ñ i = ni/n0 |
| Voltage ϕ (V) | Thermal voltage ϕ0 = kBT/e |
![[small phi, Greek, tilde]](https://www.rsc.org/images/entities/i_char_e0e2.gif) = ϕ/ϕ0 = ϕ/ϕ0 |
| Spatial dimension x (m) | Electrode spacing L |
![[x with combining tilde]](https://www.rsc.org/images/entities/i_char_0078_0303.gif) = x/L = x/L |
| Time t (s) | RC time constant τRC |
![[t with combining tilde]](https://www.rsc.org/images/entities/i_char_0074_0303.gif) = t/τRC = t/τRC |
| Voltage v0 = 10 mV | Bulk ionic density n0 = 0.1 M |
| Sodium diffusivity DNa = 1.33 × 10⁻⁹ m2 s−1 | Chlorine diffusivity DCl = 2.03 × 10⁻⁹ m2 s−1 |
| Sodium charge zNa = +1 | Chlorine charge zCl = −1 |
| Channel width L = 10 μm | Electrode area S = 1 mm2 |
| Temperature T = 297 K | Relative permittivity of water εwater = 80.4 |
To apply this model for evaluating ionic strain and temperature sensors, we vary the distance between the electrodes L and temperature T, respectively.
Currently, the theoretical framework assumes small ion mobility within the aqueous electrolyte as the dominant contributor to the hydrogel's electrochemical properties. This can serve as an accurate representation for ideally crosslinked polymer networks without significant polymer segment mobility. However, in realistic non-ideal polymer networks, there is a possibility of polymer segment motion contributing to the overall electrochemical nature of the system. While these effects are highly system dependent, their contributions can add to the Nernst–Planck equation (eqn (2)) as additional flux terms.
Results and discussion
Theoretical strain sensing performance
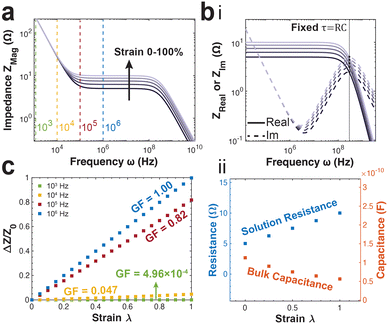
The PNP framework was applied to understand the performance of ionic conductors in measuring strain. The primary variable between simulation groups is the distance between the parallel plate electrodes (L). The magnitude of impedance increases with increasing strain, particularly in the mid-to-high frequency regimes (Fig. 3a).Further, the real and imaginary components of impedance are plotted versus frequency to highlight their intersection. The frequency of intersection indicates the inverse of time constant related to solution resistance and bulk capacitance RC-circuit (Fig. 3b(i)). We find this time constant remains the same for all applied strains. This arises from the change in cell length L has opposing effects on the resistance (RS = ρL/S) and capacitance (CBulk = Sε/L). This is further illustrated by fitting the data using the equivalent circuit model presented in Fig. 1b.
There is linear increase and decrease in the solution resistance and bulk capacitance respectively (Fig. 3b(ii)). Further, the average time constant calculated by multiplying the two is 5.64 × 10⁻¹⁰ s, with a highly tight distribution (s.d. 5.99 × 10⁻¹³ s).
During practical applications of impedance-based strain sensors, there is often a single frequency at which measurements are acquired. Using the PNP simulations, we provide insight on the relationship between strain sensitivity and measurement frequency (Fig. 3c).
The strain sensitivity is denoted by gauge factor, the ratio between the normalized change in impedance and applied strain (eqn (12)).
 | (12) |
Theoretical temperature sensing performance
The PNP framework was applied to evaluate the performance of ionic conductors as temperature sensors. With biological application in mind, we investigated variations in temperature between room temperature and 40 °C.By varying temperature in the PNP framework, we are modulating the diffusion coefficients of the ions via the Stokes–Einstein relationship (eqn (13)) and the Debye length (eqn (14)).
 | (13) |
 | (14) |
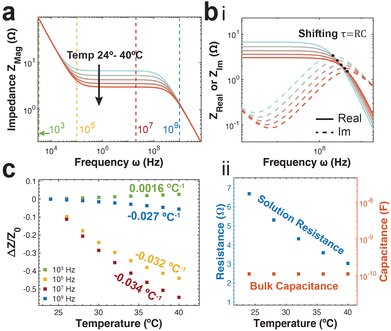
With increasing ionic diffusion coefficients, we expect a decrease in impedance with increasing temperature particularly in the resistive frequency regime. This is reflected in the predicted spectra, with the greatest difference between spectra reflected specifically in the resistive regime (Fig. 4a). Unlike the group with varying strain, the intersection of the real and imaginary impedances in the high frequency regime do not fall at the same frequency (Fig. 4b(i)). This indicates a changing time constant for the solution resistance and bulk capacitance RC-circuit. This is further supported examining the equivalent circuit parameters obtained from data fitting. As expected, we observe a decrease in solution resistance with increasing temperature, however the bulk capacitance remains constant with temperature (Fig. 4b(ii)). This is primarily because the bulk capacitance doesn’t depend directly on the diffusion coefficient of ions.
Like strain sensing, there is also a need to understand the frequency dependence of impedance-based temperature sensing. Temperature sensitivity (k) is defined as the ratio of normalized impedance change to change in temperature (eqn (15)).
 | (15) |
At low frequencies approaching the double layer capacitive regime, we notice a low but positive temperature sensitivity value. This arises from a decrease in double layer capacitance with increasing temperature as a result of an increase in the Debye length. In the high frequency bulk capacitive regime, the temperature sensitivity remains negative but approaches zero. This is a direct result of the varying solution resistance, but fixed bulk capacitance as previously shown.
Experimental characterization of strain and temperature sensing
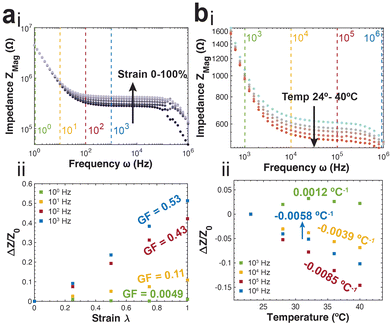
To apply the insight gained from the PNP framework to practical applications, we perform a series of preliminary experiments. First, we utilize gelatin-based ionic hydrogels and measure impedance spectra at specific applied strains. Briefly, glycerol plasticized gelatin networks were infiltrated with 0.1 M NaCl solution. Sections of the gel were placed in custom built tensile manipulators and interfaced with conductive leads. The impedance spectra measured at the varying strains (0, 25, 50, 75, 100%) demonstrate close agreement to the theoretical spectra (Fig. 5a(i)). Specifically, there is an increase in average impedance correlated with increasing strain that begins in the mid-frequency regime corresponding to the resistive region that extends into the high frequency bulk capacitive region. This is further reflected in the strain sensitivity analysis, with the ionic conductors demonstrating increasing sensitivity and gauge factors as we sample from the low-frequency to the mid-frequency regimes (Fig. 5a(ii)). This is a trend that also demonstrates close agreement with the predicted trend.Next, we also obtain experimental measurements from coplanar microelectrodes in an 0.1 M NaCl solution at varying temperatures (24, 28, 32, 36, 40 °C). The impedance spectra, in agreement with the theory, show a decrease in average impedance with increasing temperature, specifically in the resistive mid-frequency regime (Fig. 5b(i)). At both the high and low frequency regimes, we observe a convergence of the impedance spectra obtained at varying temperatures. An analysis of the temperature sensitivity at varying frequencies shows similar results to the theoretical prediction (Fig. 5b(ii)).
We find that at a low frequency, corresponding to the double layer capacitance there is a positive sensitivity to increasing temperature resulting from an increase to the Debye length. This is in opposition to the higher frequencies, displaying a negative sensitivity indicating a decrease in impedance with increasing temperature as a result of elevated ionic diffusion coefficients. The impedance response to temperature is found to be most sensitive when sampled at frequencies only corresponding to the resistive regime (105 Hz; −0.0085 °C−1).
For both strain and temperature sensing, there is a noticeable difference in the frequency regime of interest between the theoretical and experimental results. This is primarily attributed to the differences in the electrochemical cell set-up between theory and experiment. For instance, the cell length used in the theoretical model is significantly smaller than the experimental set-up as a result of computational limitations associated with resolving the sharp variations in ion densities and electric potential near the electrodes. This causes the impedance variation to shift to higher frequencies in the theoretical model, although the trend of impedance variation with frequency measured from experimental data matches well with the theoretical predictions. Further, the theoretical framework simplifies a complex 3-dimensional system of impedance between co-planar electrodes into a 1-dimensional approximation of impedance between parallel electrodes. While there is room to create a more physically accurate theoretical model, this simplified model provides extremely relevant insights into the trends reflected in the experimental data.
Conclusions
In this work, we present a theoretical framework based on a Poisson–Nernst–Planck framework to model ionic conductors as strain and temperature sensors. By analysing predicted impedance spectra under varying temperature and strains, we present important insights about the relationship of strain and temperature sensitivity and the frequency of the applied voltage perturbation. We utilize experiments to confirm the validity of the theoretical framework and demonstrate their practical application. Specifically, we find that ionic conductors can be sampled at frequency regimes within or higher than the solution resistive domain to achieve the highest capable gauge factor. Temperature sensitivity can be optimized by sampling at frequencies within the solution resistance domain. This work provides important analytical frameworks that can be broadly applied in the design of ionic hydrogel-based sensors for a variety of wearable device and soft robotics applications. Future work in this area can include coupling mechanical modelling with the Poisson–Nernst–Planck framework presented here for predictive sensor optimization and design.Methods
Synthesis and strain characterization of gelatin hydrogels
Gelatin (10% w/w, 300 bloom type A, Sigma Aldrich) was heated in DI water with 0.1 M NaCl at 65 °C until fully dissolved. The solution was poured into a custom acrylic mold and gelled in ambient conditions for 48 h. Potentiostatic EIS was conducted between 1 and 106 Hz with an amplitude of 20 mV (Interface 1000e, Gamry Instruments, Warminster, PA) while the hydrogel strain was controlled using a custom-machined micromanipulator.Microfabricating thin-film electrodes
Platinum thin-film (100 nm) electrodes were evaporated (Lesker PRO Line PVD75 Electron Beam Evaporator) and photolithographically patterned. The electrodes were encapsulated with Parylene-C (300 nm; SCS Parylene Labcoater 2) and etched using reactive ion etching (50 W, 60 sccm O2 6 min; Phantom RIE, Trion Tech) to expose electrodes and contacts.Temperature sensing
Thin-film electrodes (1 mm diameter) were placed in a beaker containing 0.1 M NaCl. The temperature of the solution was controlled by submerging it in an oil bath for even heating. Two-electrode potentiostatic electrochemical impedance spectra were recorded using a GAMRY 1000e potentiostat (Gamry Instruments, PA USA) from 1 to 106 Hz over the temperature range of interest (RT to 40 °C).Author contributions
G. B., A. S. K. and C. J. B. contributed to conceptualization and planning. G. B. and J. S. conducted and implemented the work. G. B. prepared the manuscript draft and all authors provided edits. J. S., A. S. K., and C. J. B. revised the manuscript.Conflicts of interest
There are no conflicts to declare.Acknowledgements
The authors acknowledge funding from the following sources: National Institutes of Health Grants R21EB026073 and R21EB028418. GB acknowledges the Carnegie Mellon University Presidential Fellowship and the Carnegie Mellon Ronald F. and Janice A. Zollo Fellowship in Neuroengineering for financial support.Notes and references
- H. Yuk, B. Lu and X. Zhao, Chem. Soc. Rev., 2019, 48, 1642–1667 RSC
.
- F. Fu, J. Wang, H. Zeng and J. Yu, ACS Mater. Lett., 2020, 2, 1287–1301 CrossRef CAS
.
- Y. Liu, T. Yang, Y. Zhang, G. Qu, S. Wei, Z. Liu and T. Kong, Adv. Mater., 2019, 31, 1902783 CrossRef
.
- G. Balakrishnan, J. Song, C. Mou and C. J. Bettinger, Adv. Mater., 2022, 34, 2106787 CrossRef CAS
.
- S. Naahidi, M. Jafari, M. Logan, Y. Wang, Y. Yuan, H. Bae, B. Dixon and P. Chen, Biotechnol. Adv., 2017, 35, 530–544 CrossRef CAS
.
- G. Shi, W. Chen, Y. Zhang, X. Dai, X. Zhang and Z. Wu, Langmuir, 2019, 35, 1837–1845 CrossRef CAS
.
- Y. S. Zhang and A. Khademhosseini, Science, 2017, 356, eaaf3627 CrossRef
.
- E. Caló and V. V. Khutoryanskiy, Eur. Polym. J., 2015, 65, 252–267 CrossRef
.
- L. Lei, D. Huang, H. Gao, B. He, J. Cao and N. A. Peppas, Sci. Adv., 2022, 8, eadc8738 CrossRef CAS
.
- W.-C. Huang, X. C. Ong, I. S. Kwon, C. Gopinath, L. E. Fisher, H. Wu, G. K. Fedder, R. A. Gaunt and C. J. Bettinger, Adv. Funct. Mater., 2018, 28, 1801059 CrossRef
.
- C. C. Horn, M. Forssell, M. Sciullo, J. E. Harms, S. Fulton, C. Mou, F. Sun, T. W. Simpson, G. Xiao, L. E. Fisher, C. Bettinger and G. K. Fedder, J. Neural Eng., 2021, 18, 055008 CrossRef
.
- J. Song, C. Mou, G. Balakrishnan, Y. Wang, M. Rajagopalan, A. Schreiner, D. Naik, T. Cohen-Karni, M. S. Halbreiner and C. J. Bettinger, Adv. NanoBiomed Res., 2023, 3, 2200132 CrossRef CAS
.
- C. Lim, Y. J. Hong, J. Jung, Y. Shin, S.-H. Sunwoo, S. Baik, O. K. Park, S. H. Choi, T. Hyeon, J. H. Kim, S. Lee and D.-H. Kim, Sci. Adv., 2021, 7, eabd3716 CrossRef CAS
.
- C. Wang, X. Chen, L. Wang, M. Makihata, H.-C. Liu, T. Zhou and X. Zhao, Science, 2022, 377, 517–523 CrossRef CAS
.
- H. Wu, V. Sariola, C. Zhu, J. Zhao, M. Sitti and C. J. Bettinger, Adv. Mater., 2015, 27, 3398–3404 CrossRef CAS
.
- S. Moreno, J. Keshtkar, R. A. Rodriguez-Davila, A. Bazaid, H. Ibrahim, B. J. Rodriguez, M. A. Quevedo-Lopez and M. Minary-Jolandan, Adv. Electron. Mater., 2020, 6, 2000391 CrossRef CAS
.
- J. Goding, C. Vallejo-Giraldo, O. Syed and R. Green, J. Mater. Chem. B, 2019, 7, 1625–1636 RSC
.
- X. Ren, M. Yang, T. Yang, C. Xu, Y. Ye, X. Wu, X. Zheng, B. Wang, Y. Wan and Z. Luo, ACS Appl. Mater. Interfaces, 2021, 13, 25374–25382 CrossRef CAS
.
- B. Lu, H. Yuk, S. Lin, N. Jian, K. Qu, J. Xu and X. Zhao, Nat. Commun., 2019, 10, 1043 CrossRef
.
- S. Zhang, Y. Chen, H. Liu, Z. Wang, H. Ling, C. Wang, J. Ni, B. Çelebi-Saltik, X. Wang, X. Meng, H. Kim, A. Baidya, S. Ahadian, N. Ashammakhi, M. R. Dokmeci, J. Travas-Sejdic and A. Khademhosseini, Adv. Mater., 2020, 32, 1904752 CrossRef CAS
.
- H. Fan and J. P. Gong, Macromolecules, 2020, 53, 2769–2782 CrossRef CAS
.
- Y. Lee, W. J. Song and J.-Y. Sun, Mater. Today Phys., 2020, 15, 100258 CrossRef
.
- X. Liu, J. Liu, S. Lin and X. Zhao, Mater. Today, 2020, 36, 102–124 CrossRef CAS
.
- X. Chen, H. Yuk, J. Wu, C. S. Nabzdyk and X. Zhao, Proc. Natl. Acad. Sci. U. S. A., 2020, 117, 15497–15503 CrossRef CAS
.
- J. Chen, H. Wen, G. Zhang, F. Lei, Q. Feng, Y. Liu, X. Cao and H. Dong, ACS Appl. Mater. Interfaces, 2020, 12, 7565–7574 CrossRef CAS
.
- R. An, X. Zhang, L. Han, X. Wang, Y. Zhang, L. Shi and R. Ran, Mater. Sci. Eng., C, 2020, 107, 110310 CrossRef CAS
.
- Z. Wang, J. Chen, Y. Cong, H. Zhang, T. Xu, L. Nie and J. Fu, Chem. Mater., 2018, 30, 8062–8069 CrossRef CAS
.
- D. Zhang, Y. Tang, Y. Zhang, F. Yang, Y. Liu, X. Wang, J. Yang, X. Gong and J. Zheng, J. Mater. Chem. A, 2020, 8, 20474–20485 RSC
.
- X. Pei, H. Zhang, Y. Zhou, L. Zhou and J. Fu, Mater. Horiz., 2020, 7, 1872–1882 RSC
.
- A. Yamamoto, H. Nakamoto, Y. Bessho, Y. Watanabe, Y. Oki, K. Ono, Y. Fujimoto, T. Terada and A. Ishikawa, Med. Biol. Eng. Comput., 2019, 57, 2741–2756 CrossRef
.
- Y. Dobashi, D. Yao, Y. Petel, T. N. Nguyen, M. S. Sarwar, Y. Thabet, C. L. W. Ng, E. Scabeni Glitz, G. T. M. Nguyen, C. Plesse, F. Vidal, C. A. Michal and J. D. W. Madden, Science, 2022, 376, 502–507 CrossRef CAS
.
- I. You, D. G. Mackanic, N. Matsuhisa, J. Kang, J. Kwon, L. Beker, J. Mun, W. Suh, T. Y. Kim, J. B.-H. Tok, Z. Bao and U. Jeong, Science, 2020, 370, 961–965 CrossRef CAS
.
- Y. M. Kim and H. C. Moon, Adv. Funct. Mater., 2020, 30, 1907290 CrossRef CAS
.
- Q. Li, J. Li, D. Tran, C. Luo, Y. Gao, C. Yu and F. Xuan, J. Mater. Chem. C, 2017, 5, 11092–11099 RSC
.
- S. Wang, K. Chen, M. Wang, H. Li, G. Chen, J. Liu, L. Xu, Y. Jian, C. Meng, X. Zheng, S. Liu, C. Yin, Z. Wang, P. Du, S. Qu and C. W. Leung, J. Mater. Chem. C, 2018, 6, 4737–4745 RSC
.
- H. Kim, Y.-S. Kim, M. Mahmood, S. Kwon, N. Zavanelli, H. S. Kim, Y. S. Rim, F. Epps and W.-H. Yeo, Adv. Sci., 2020, 7, 2000810 CrossRef CAS
.
- D. Lu, Y. Yan, R. Avila, I. Kandela, I. Stepien, M. Seo, W. Bai, Q. Yang, C. Li, C. R. Haney, E. A. Waters, M. R. MacEwan, Y. Huang, W. Z. Ray and J. A. Rogers, Adv. Healthcare Mater., 2020, 9, 2000942 CrossRef CAS
.
- D. Lou, Q. Pang, X. Pei, S. Dong, S. Li, W. Tan and L. Ma, Biosens. Bioelectron., 2020, 162, 112275 CrossRef CAS
.
- S. Choi, S. I. Han, D. Jung, H. J. Hwang, C. Lim, S. Bae, O. K. Park, C. M. Tschabrunn, M. Lee, S. Y. Bae, J. W. Yu, J. H. Ryu, S.-W. Lee, K. Park, P. M. Kang, W. B. Lee, R. Nezafat, T. Hyeon and D.-H. Kim, Nat. Nanotechnol., 2018, 13, 1048–1056 CrossRef
.
- Y. Ahn, H. Lee, D. Lee and Y. Lee, ACS Appl. Mater. Interfaces, 2014, 6, 18401–18407 CrossRef CAS
.
- J. Deng, H. Yuk, J. Wu, C. E. Varela, X. Chen, E. T. Roche, C. F. Guo and X. Zhao, Nat. Mater., 2021, 20, 229–236 CrossRef CAS
.
- L. Han, X. Lu, M. Wang, D. Gan, W. Deng, K. Wang, L. Fang, K. Liu, C. W. Chan, Y. Tang, L.-T. Weng and H. Yuan, Small, 2017, 13, 1601916 CrossRef
.
- J. W. Salatino, K. A. Ludwig, T. D. Y. Kozai and E. K. Purcell, Nat. Biomed. Eng., 2017, 1, 862–877 CrossRef CAS
.
- N. Noskovicova, R. Schuster, S. van Putten, M. Ezzo, A. Koehler, S. Boo, N. M. Coelho, D. Griggs, P. Ruminski, C. A. McCulloch and B. Hinz, Nat. Biomed. Eng., 2021, 1–20 Search PubMed
.
- H. Yuk, B. Lu, S. Lin, K. Qu, J. Xu, J. Luo and X. Zhao, Nat. Commun., 2020, 11, 1604 CrossRef CAS
.
- J. Wang, Q. Li, K. Li, X. Sun, Y. Wang, T. Zhuang, J. Yan and H. Wang, Adv. Mater., 2022, 34, 2109904 CrossRef CAS
.
- M. Jia and M. Rolandi, Adv. Healthcare Mater., 2020, 9, 1901372 CrossRef CAS
.
- H. Dechiraju, M. Jia, L. Luo and M. Rolandi, Adv. Sustainable Syst., 2022, 6, 2100173 CrossRef CAS
.
- M. Guo, X. Yang, J. Yan, Z. An, L. Wang, Y. Wu, C. Zhao, D. Xiang, H. Li, Z. Li and H. Zhou, J. Mater. Chem. A, 2022, 10, 16095–16105 RSC
.
- Y. Ohm, C. Pan, M. J. Ford, X. Huang, J. Liao and C. Majidi, Nat. Electron., 2021, 4, 185–192 CrossRef CAS
.
- H. S. Song, O. S. Kwon, J.-H. Kim, J. Conde and N. Artzi, Biosens. Bioelectron., 2017, 89, 187–200 CrossRef CAS
.
- Y. Zhang, M. Gong and P. Wan, Matter, 2021, 4, 2655–2658 CrossRef CAS
.
- M. Amjadi, K.-U. Kyung, I. Park and M. Sitti, Adv. Funct. Mater., 2016, 26, 1678–1698 CrossRef CAS
.
- C. Boehler, S. Carli, L. Fadiga, T. Stieglitz and M. Asplund, Nat. Protoc., 2020, 15, 3557–3578 CrossRef CAS
.
- H. Wei, D. Kong, T. Li, Q. Xue, S. Wang, D. Cui, Y. Huang, L. Wang, S. Hu, T. Wan and G. Yang, ACS Sens., 2021, 6, 2938–2951 CrossRef CAS
.
- Z. Wang, Y. Liu, D. Zhang, K. Zhang, C. Gao and Y. Wu, Compos. Sci. Technol., 2021, 216, 109042 CrossRef CAS
.
- Z. Wang, Y. Cong and J. Fu, J. Mater. Chem. B, 2020, 8, 3437–3459 RSC
.
- X. Yu, W. Qin, X. Li, Y. Wang, C. Gu, J. Chen and S. Yin, J. Mater. Chem. A, 2022, 10, 15000–15011 RSC
.
- A. M. El Badawy, R. G. Silva, B. Morris, K. G. Scheckel, M. T. Suidan and T. M. Tolaymat, Environ. Sci. Technol., 2011, 45, 283–287 CrossRef CAS
.
- T. Mironava, M. Hadjiargyrou, M. Simon, V. Jurukovski and M. H. Rafailovich, Nanotoxicology, 2010, 4, 120–137 CrossRef CAS
.
- P. Mazurek, S. Vudayagiri and A. Ladegaard Skov, Chem. Soc. Rev., 2019, 48, 1448–1464 RSC
.
- K. Parida, J. Xiong, X. Zhou and P. S. Lee, Nano Energy, 2019, 59, 237–257 CrossRef CAS
.
- L. Jin, A. Chortos, F. Lian, E. Pop, C. Linder, Z. Bao and W. Cai, Proc. Natl. Acad. Sci. U. S. A., 2018, 115, 1986–1991 CrossRef CAS
.
- X.-Y. Yin, Y. Zhang, X. Cai, Q. Guo, J. Yang and Z. Lin Wang, Mater. Horiz., 2019, 6, 767–780 RSC
.
- H. W. Kim, E. Kim, J. Oh, H. Lee and U. Jeong, Adv. Sci., 2022, 9, 2200687 CrossRef CAS
.
- S. Cheng, Y. S. Narang, C. Yang, Z. Suo and R. D. Howe, Adv. Mater. Interfaces, 2019, 6, 1900985 CrossRef
.
- C. Keplinger, J.-Y. Sun, C. C. Foo, P. Rothemund, G. M. Whitesides and Z. Suo, Science, 2013, 341, 984–987 CrossRef CAS
.
- Y. Zhu, C. Chao, C.-H. Cheng and W. W.-F. Leung, IEEE Electron Device Lett., 2009, 30, 337–339 CAS
.
- S. Wang, J. Zhang, O. Gharbi, V. Vivier, M. Gao and M. E. Orazem, Nat. Rev. Methods Primers, 2021, 1, 1–21 CrossRef
.
- S. E. Feicht and A. S. Khair, Soft Matter, 2016, 12, 7028–7037 RSC
.
- B. A. Yezer, A. S. Khair, P. J. Sides and D. C. Prieve, J. Colloid Interface Sci., 2015, 449, 2–12 CrossRef CAS
.
- J. R. Macdonald and D. R. Franceschetti, J. Chem. Phys., 1978, 68, 1614–1637 CrossRef CAS
.
- E. K. Lenzi, L. R. Evangelista, L. Taghizadeh, D. Pasterk, R. S. Zola, T. Sandev, C. Heitzinger and I. Petreska, J. Phys. Chem. B, 2019, 123, 7885–7892 CrossRef CAS
.
- J. R. Macdonald, L. R. Evangelista, E. K. Lenzi and G. Barbero, J. Phys. Chem. C, 2011, 115, 7648–7655 CrossRef CAS
.
- F. Ciucci, Curr. Opin. Electrochem., 2019, 13, 132–139 CrossRef CAS
.
| This journal is © The Royal Society of Chemistry 2023 |

