
 Open Access Article
 This Open Access Article is licensed under a Creative Commons Attribution-Non Commercial 3.0 Unported Licence
Hydrogels with electrically conductive nanomaterials for biomedical applications†
Georgios
Kougkolos
 ab,
Muriel
Golzio
c,
Lionel
Laudebat
bd,
Zarel
Valdez-Nava
*b and
Emmanuel
Flahaut
*a
ab,
Muriel
Golzio
c,
Lionel
Laudebat
bd,
Zarel
Valdez-Nava
*b and
Emmanuel
Flahaut
*a
aCIRIMAT, Université de Toulouse, CNRS, INPT, UPS, 31062 Toulouse CEDEX 9, France. E-mail: emmanuel.flahaut@univ-tlse3.fr
bLAPLACE, Université de Toulouse, CNRS, INPT, UPS, 31062 Toulouse CEDEX 9, France. E-mail: zarel.valdez-nava@laplace.univ-tlse.fr
cIPBS, Université de Toulouse, NRS UMR, UPS, 31077 Toulouse CEDEX 4, France
dINU Champollion, Université de Toulouse, 81012 Albi, France
First published on 3rd February 2023
Abstract
Hydrogels, soft 3D materials of cross-linked hydrophilic polymer chains with a high water content, have found numerous applications in biomedicine because of their similarity to native tissue, biocompatibility and tuneable properties. In general, hydrogels are poor conductors of electric current, due to the insulating nature of commonly-used hydrophilic polymer chains. A number of biomedical applications require or benefit from an increased electrical conductivity. These include hydrogels used as scaffolds for tissue engineering of electroactive cells, as strain-sensitive sensors and as platforms for controlled drug delivery. The incorporation of conductive nanomaterials in hydrogels results in nanocomposite materials which combine electrical conductivity with the soft nature, flexibility and high water content of hydrogels. Here, we review the state of the art of such materials, describing the theories of current conduction in nanocomposite hydrogels, outlining their limitations and highlighting methods for improving their electrical conductivity.
 From left to right: Georgios Kougkolos, Muriel Golzio, Lionel Laudebat, Zarel Valdez-Nava and Emmanuel Flahaut | Georgios Kougkolos is pursuing a PhD in materials science. His research interests lie in the interface between materials science and biomedicine and currently include nanocomposite hydrogels, drug delivery and electroporation. Muriel Golzio is a senior CNRS researcher in biophysics. Her main research interests lie in the field of cell electroporation, nucleic acids electrotransfer and biomedical applications for cancer treatment and gene therapy. Lionel Laudebat is an associate professor of electrical engineering and researcher. His main research interests include numerical simulation and modelling of power electronic materials and studies of dielectric materials. Zarel Valdez-Nava is a CNRS researcher in electrical engineering. His research concerns insulating and dielectric materials for high voltage and/or high temperature power electronics, focusing in identifying the relationship between processing and properties of composites and ceramics. Emmanuel Flahaut is a senior CNRS researcher in materials science. His research is focused on the synthesis and functionalization of carbon nanomaterials as well as their application in various fields ranging from materials science to biomedicine. All are affiliated to the University of Toulouse, France. They are all partners of a National (ANR) project on non-invasive drug delivery through skin electroporation, involving electrically conductive nanocomposite hydrogels. |
1. Introduction
1.1 Hydrogels
Hydrogels are three-dimensional, viscoelastic networks of hydrophilic polymer chains, cross-linked in an aqueous environment. The water–polymer network is gelated through the association of polymer chains to form a continuous structure, that immobilises water within it and becomes resistant to flow.1 The association of polymer chains occurs through a variety of mechanisms that can be classified into physical or chemical. Mechanisms of physical cross-linking include the physical entanglement of individual polymer chains, typically induced by solubility alterations in response to temperature changes; macromolecular self-assembly through non-covalent bonding (hydrogen bonds, van der Waals forces, hydrophobic interactions); crystallization, the formation of microcrystals through a freeze-and-thaw process, which then act as a cross-linking site; ionic gelation, polymer chains surround ions forming a crosslinking site; and electrostatic interaction of polymer chains with opposite charges.2–5 Chemical cross-linking involves the formation of covalent bonds between polymer chains through mechanisms including radical polymerization, chemical reactions of complementary groups (for example hydroxyl groups or amides with carboxylic acids), high energy irradiation, addition of chemical cross-linking agents (glutaraldehyde, epoxy compounds, isocyanates, metal ions) and enzymatic reactions.2–4,6Physically cross-linked hydrogels are reversible, easy to produce and do not require the use of chemical cross-linking agents.3,4 Chemically cross-linked hydrogels generally have higher mechanical strength and offer more possibilities for control of the cross-linking process and customised design.2,3 However, they often make use of toxic cross-linkers which then have to be extracted to keep the hydrogel biocompatible.4 The combination of physical and chemical cross-linking mechanisms offers the possibility for more precise control over the hydrogels’ properties.2
Hydrogels can be further classified according to their polymeric composition as: (1) single polymer networks (homo-polymers), derived from one type of monomer unit; (2) copolymers, derived from the cross-linking of two or more types of monomers, arranged in alternating, block or random configuration on the polymer chain; (3) semi-interpenetrating polymer networks, where a linear polymer is contained within an independent, cross-linked polymer network; and (4) interpenetrating polymer networks, derived from two independent, cross-linked polymer networks interlocked together.4,5,7 In each case, at least one of the monomers must be hydrophilic, to render the network water swellable.
Hydrogels are rich in water (typically 80 to 95% w/w but can span almost all range), flexible with viscoelastic behaviour and usually biocompatible.8–10 These properties have fostered numerous applications in the domains of biomedicine, soft electronics and actuators.2 Some of these properties can be straightforwardly modified to fit a specific application. For example, the rigidity and water content of hydrogels can be tuned by adjusting the polymer concentration and the cross-linking degree.11 In an aqueous environment, a dynamic equilibrium exists between the interactions responsible for water sorption (capillary, osmotic and hydration forces) and the cross-linked polymer network resisting expansion.12
In addition, hydrogels can be highly responsive to external stimuli. Small changes in environmental conditions such as temperature, pH, pressure, electric field or chemical agents can induce unexpected and mostly reversible changes in hydrogel properties such as volume, swelling degree, conductivity or permeability.13 These stimuli-responsive or smart hydrogels can be engineered to sense external stimuli and transmit an electrical or optical signal, by modifying a readily readable property such as electrical conductivity or colour.13,14 Many hydrogels used in motion sensing devices change their electrical conductivity when strained, giving an electrical signal to the device.13 Hydrogel membranes can selectively allow the transfer of molecules by swelling to open or block their pores, according to biochemical signals.15 More recently, 3D printing of hydrogels has opened new possibilities for customized design.16
Despite their remarkable properties and several possible applications, hydrogels have some important limitations. They generally have limited mechanical strength and are susceptible to irreversible deformation.17 In addition, hydrogels from commonly used polymers intrinsically have very low electrical conductivity. These limitations make conventional hydrogels unsuitable for applications that require robustness or electrical conductivity.
1.2 Electrically conductive hydrogels
Electrical conductivity, in particular, is an important property of hydrogels in biomedical applications. Applications of electrically conductive hydrogels include hydrogels used as substrates for the growth of electroactive cells, hydrogels which function as flexible strain sensors for health monitoring and wearable devices and drug-loaded hydrogels used for electro-stimulated drug delivery.18 There are three approaches to prepare electrically conductive hydrogels: (1) using a conducting polymer in the hydrogel matrix, (2) increasing the ionic conductivity of the aqueous phase and (3) incorporating a conductive material in the hydrogel.Conducting polymers are organic macromolecules with intrinsic electrical conductivity. Conducting polymers commonly used for preparing hydrogels are polypyrrole (PPy), polyaniline (PANI) and poly-(3,4-ethylenedioxythiophene) (PEDOT).19 They cannot form hydrogels themselves but have to be combined with a supporting polymer that provides hydrophilicity and mechanical strength.19 They provide a conducting path of electronic conductivity due to the delocalized pi electrons of their conjugated systems, and can also increase the ionic conductivity of the aqueous phase by contributing ions.20,21 Guo and Ma reviewed materials for tissue engineering with conducting polymers, including hydrogels22 and Stejskal reviewed conducting polymer hydrogels with a focus on preparation methods.19
The ionic conductivity of the aqueous phase can be increased by preparing and/or swelling the hydrogel in an ion-rich aqueous solution. Free ions can be generated in water from acids, metal salts or ionic liquids.23 Metal ions, in particular, can act both as cross-linking agents for polymer chains and electrolytes of ionic conductivity.24 The cross-linking mechanism is metal–ligand interaction where the metal ions form coordinate covalent bonds with chelating agents (N, O, S) in the polymer chain.25 In high concentrations, the free metal ions contribute to the ionic conductivity of the hydrogel.24 Zhang et al. review the recent advances in metal ion hydrogels for biological applications.25 Non-ionic polymer chains may impair the ionic conductivity of hydrogels, compared to polyelectrolyte hydrogels.26 Polyelectrolytes are polymers which contain ionic and/or ionizable groups in a substantial portion of their constitutional units.27 They can be cationic, anionic or ampholytic (containing both negative and positive charges; also called zwitterionic, commonly when the positive and negative charges are located in the same pendant group).26,27 In low concentration electrolyte solutions, polycationic and polyanionic hydrogels exhibit the highest ionic conductivity, due to high concentrations of mobile counterions. In high concentration electrolyte solutions, polyzwitterionic hydrogels promote fast ion dissociation and transport due to the highly charged polar side groups.26,28 Wang et al. and Liu et al. reviewed polyelectrolyte29 and polyzwitterionic30 hydrogels for biomedical applications.
The incorporation of conductive materials aims to create a continuous network of electronic conduction throughout the hydrogel, through the dispersion of conductive nanomaterials and/or other conductive materials, such as metal microwires or carbon fibers, in the hydrogel framework.
The current review focuses on the incorporation of conductive nanomaterials in otherwise electrically insulating hydrogel polymer matrices. Each section is accompanied by illustrative examples of practical applications from the recent literature. Electrically conductive hydrogels are widely researched for applications in biomedicine and soft electronics including tissue engineering, strain sensors and controlled drug release (Fig. 1). In the following section, we present these practical applications and underline the relevance of electrical conductivity in each case. Section 2 lists the conductive nanomaterials commonly incorporated in hydrogels. In Sections 3–5 we delve into the electrical properties of nanocomposite hydrogels by introducing electrical percolation, current conduction mechanisms and experimental electrical characterization techniques. Lastly, section 6 includes a comprehensive table and graph of conductive nanocomposite hydrogels and a discussion on some processing methods that can improve electrical conductivity.
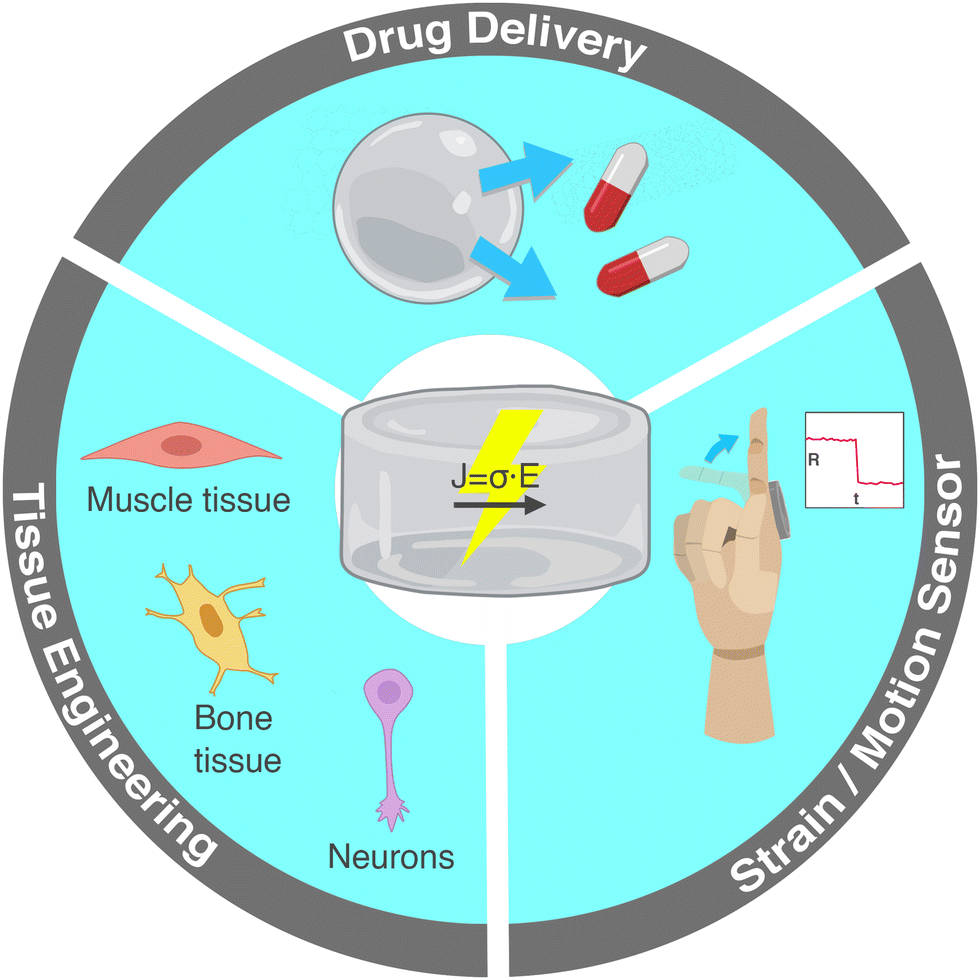 | ||
| Fig. 1 Main applications of hydrogels with electrically conductive nanomaterials: tissue engineering of electroactive cells, controlled drug delivery and strain sensors for human motion monitoring. | ||
1.3 Applications
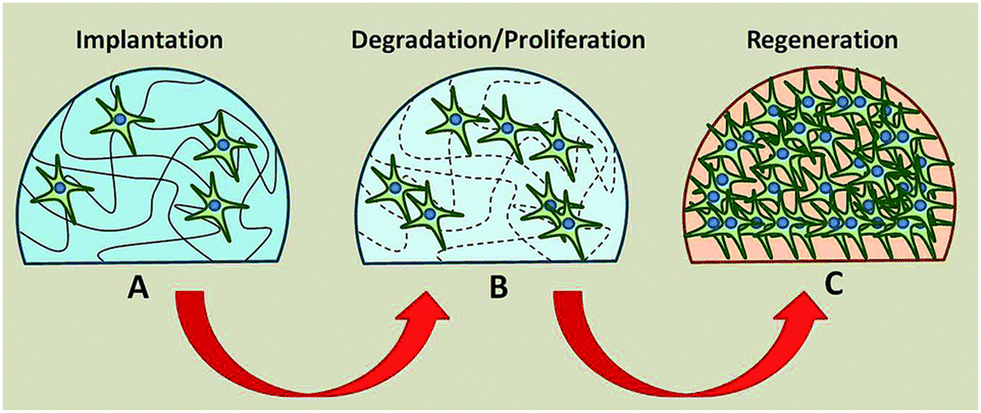 | ||
| Fig. 2 Biodegradable hydrogel as a substrate for tissue regeneration. (A) Stem cells seeded on hydrogel. (B) Hydrogel degrades while cells proliferate and secrete their extracellular matrix. (C) Hydrogel has completely degraded leaving in place a new tissue composed of tissue and extracellular matrix. Reproduced from ref. 32 with permission from The Royal Society of Chemistry. | ||
Electrical conduction plays an important role in cell signalling and affects the differentiation and proliferation of cells. In particular, muscle and neural cells are excitable; they use rapid changes in membrane potential for cell-to-cell communication. Muscle tissue cells can contract, in response to electrical signals. Thus, substrates with an electrical conductivity near the conductivity of the native muscle deliver the most promising results.35
Navaei et al. developed a conductive, nanocomposite hydrogel to act as a cardiac tissue substrate for myocardial regeneration and repair. They synthesized gold nanorods which were incorporated into a methacrylated gelatin prepolymer solution and cross-linked it through UV radiation. A concentration of 1.5 mg ml−1 of gold nanorods reduced the electrical impedance of the hydrogel (measured by impedance spectroscopy) and improved both cell–cell signalling and electrical signal propagation on cells growing on the substrate, compared to the pristine hydrogel. This resulted in an improved cardiac tissue contractility with a lower excitation threshold (Fig. 3(A)).36 Dong et al. reviewed the conductive biomaterials employed in muscle tissue engineering35 while a review article of Li et al. focused on the conductive biomaterials employed for cardiac repair.37
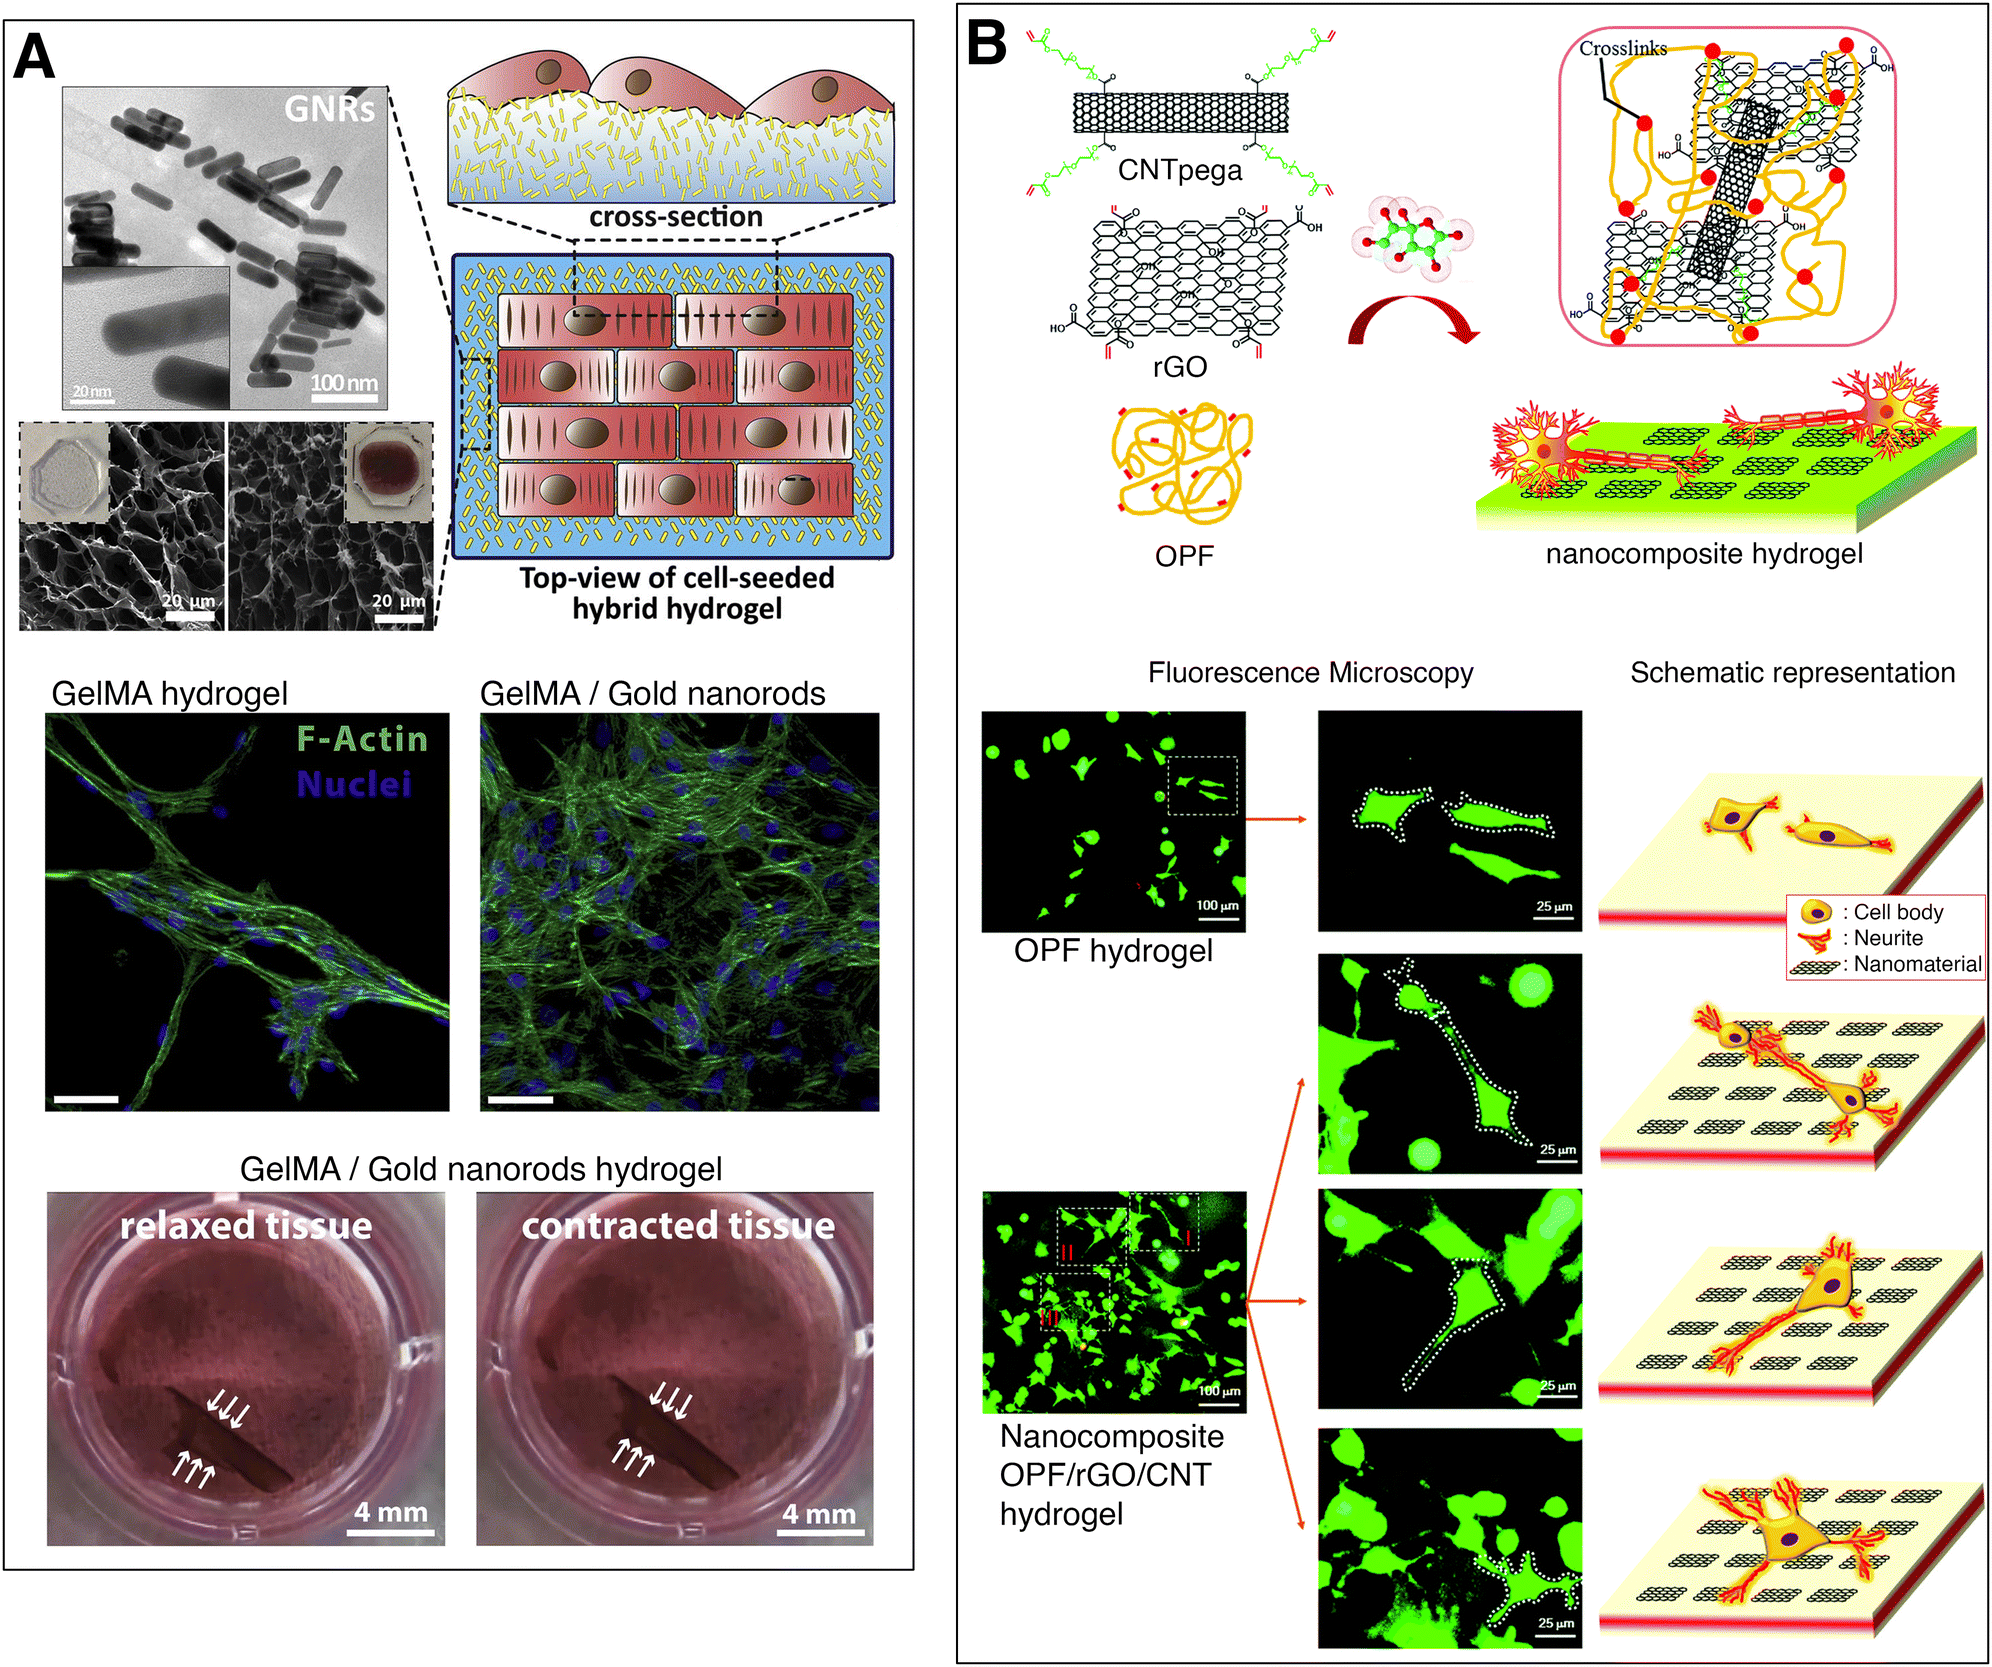 | ||
| Fig. 3 Electrically conducting hydrogels for tissue engineering. (A) Gelatin methacrylate hydrogel with gold nanorods for myocardial regeneration. The nanocomposite hydrogels illustrate highly packed cardiomyocytes with local alignment of fibers. A cell-loaded nanocomposite hydrogel displays contraction of the full hydrogel. Adapted from ref. 36, Copyright 2016, with permission from Elsevier. (B) Oligo(poly ethylene glycol) fumarate hydrogel with CNTs and rGO for neural tissue engineering. Fluorescent microscopy images and schemes of PC12 cells growing on plain and nanocomposite hydrogel, showing that neural cells growing on conductive substrates exhibit increased neurite development. Adapted from ref. 39 with permission from The Royal Society of Chemistry. | ||
Nerve tissue is comprised of electroactive neural cells that transmit electrochemical signals. Conductive scaffolds, enhance the cellular activity and tissue regeneration of neural cells, compared to non-conductive substrates.38 Liu et al. chemically cross-linked reduced graphene oxide (rGO) sheets and carbon nanotube (CNT) poly(ethylene glycol) acrylate to oligo(poly ethylene glycol) fumarate hydrogels, increasing their electrical conductivity from 2 × 10⁻⁴ S m−1 to 7.9 × 10⁻⁴ S m−1. The nanoengineered conductive hydrogel was biocompatible and led to a higher proliferation of PC12 cells and increased neurite development (Fig. 3(B)).39
Bone regeneration and remodelling involves electrical fields generated by intrinsic piezoelectric properties of the bone tissue.33 Additionally, bone cell tissue engineering requires scaffolds with high mechanical strength to stimulate the differentiation of osteocytes.40 Pelto et al. fabricated polylactide scaffolds to serve as a substrate for osteogenic differentiation and coated them with electrically conductive polypyrrole. The electrically conductive scaffold increased significantly the differentiation of human adipose stem cells compared to the insulating one.41
Xia et al. fabricated a conductive polyacrylamide/chitosan hydrogel with carboxylated multi-wall CNTs that functions as a wearable, self-healable and adhesive sensor (Fig. 4(A)).44 The incorporation of 1% w/w CNTs increased the conductivity of the hydrogel from 0.1 to 0.95 S m−1 and more importantly improved the strain sensitivity of the hydrogel (the ratio of resistance change over applied strain). The electrical resistance of the hydrogel increased with increasing stress and recovered fast (150 ms) after the stress was removed.44 The strained hydrogel both reorganized the conductive nanomaterial network decreasing its electronic conductivity and densified the polymer network, restricting ion mobility and thus reducing ionic conductivity.44,45 The hydrogel was tested for the monitoring of movements of human articulations (finger, wrist, elbow, knee) and was sensitive enough to monitor even subtle strains such as talking, breathing and pulse, placed on the neck, chest and inside of wrist, respectively (Fig. 4(A)).44 He et al. developed a highly-sensitive, freeze-resisting strain sensor gel by incorporating tannic acid–CNTs into a polyvinyl alcohol water/glycerol gel. The nanomaterials increased the electrical conductivity from 0.19 to 5.13 S m−1 and the gels could be used as strain sensors to detect joint movements and as flexible electrodes for the detection of electrophysiological signals (EMG and ECG, Fig. 4(B)).46 Coupled with a wireless transmitter, such hydrogel materials can be useful in health and activity monitoring.45 Three recent review publications summarised the latest developments regarding hydrogels used as strain sensors.13,42,43
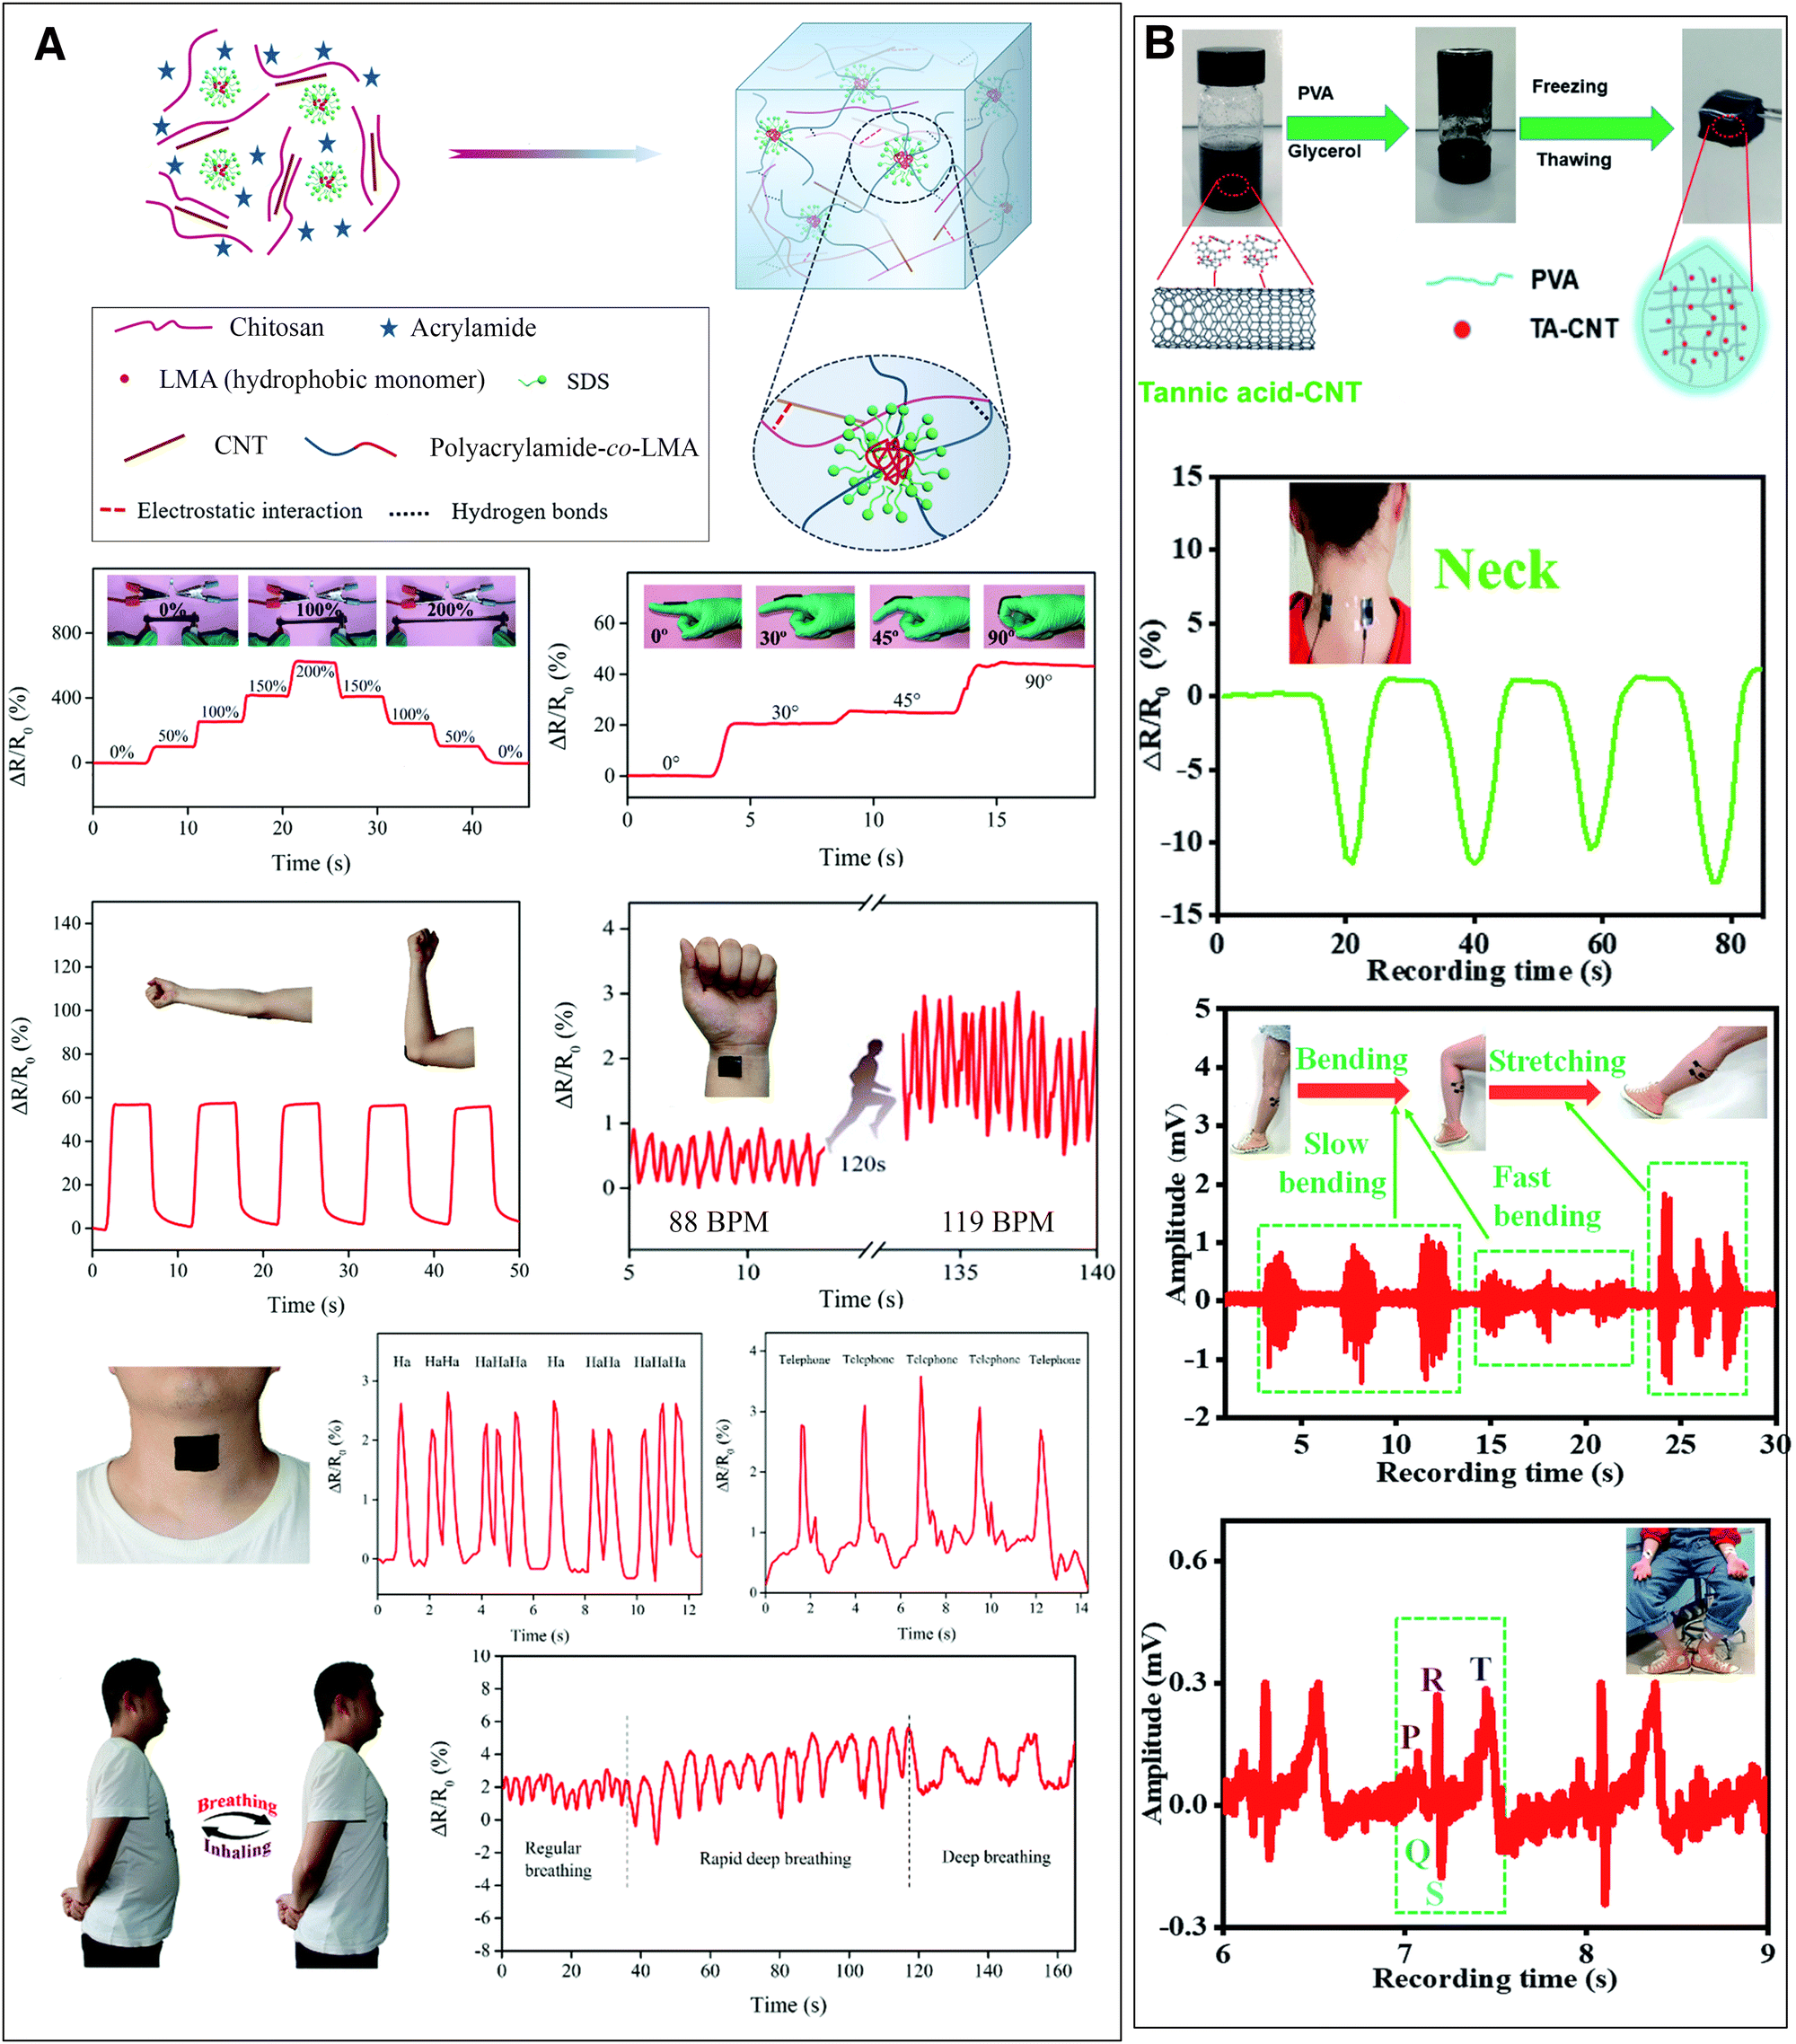 | ||
| Fig. 4 Conductive nanocomposite hydrogels used as strain sensors for monitoring human motions and health. (A) A polyacrylamide-co-lauryl methacrylate/chitosan and carboxylated CNTs hydrogel changes its electrical resistance with strain. This property can be exploited to monitor movements such as finger and elbow flexion or even heart pulse, talking and breathing. Adapted from ref. 44 with permission from The Royal Society of Chemistry. (B) Polyvinyl alcohol/tannic acid–CNT hydrogel monitors joint movements such as neck bending and can also be used as an electrode for electrophysiological measurements (EMG and ECG). Adapted from ref. 46 with permission from The Royal Society of Chemistry. | ||
Nanocomposite hydrogels used as biosensors are the ideal candidates to bridge the gap between humans and machines, in the context of biomedical engineering, diagnostics and wearable and implantable devices.47 Both living organisms and electronic devices use electric signals to coordinate their activities. In living organisms, these signals are based on ionic conduction in a soft and water-rich environment. Small ions (Na+, K+, Cl−, Ca2+) rapidly flow through channels in the plasma membranes of cells, hyperpolarising and depolarising the transmembrane potential. In machines, electric signals are based on electronic conductivity in dry and rigid solids. Free electrons flow through the metallic or semi-conducting components of electronic devices. Nanocomposite hydrogels incorporate elements of both: they are viscoelastic materials with adjustable mechanical strength, high water content and solid-like behaviour, and the conduction mechanisms can combine ionic and electronic conductivity. Yuk et al. have reviewed conductive hydrogels in the interface between biology and electronics.47
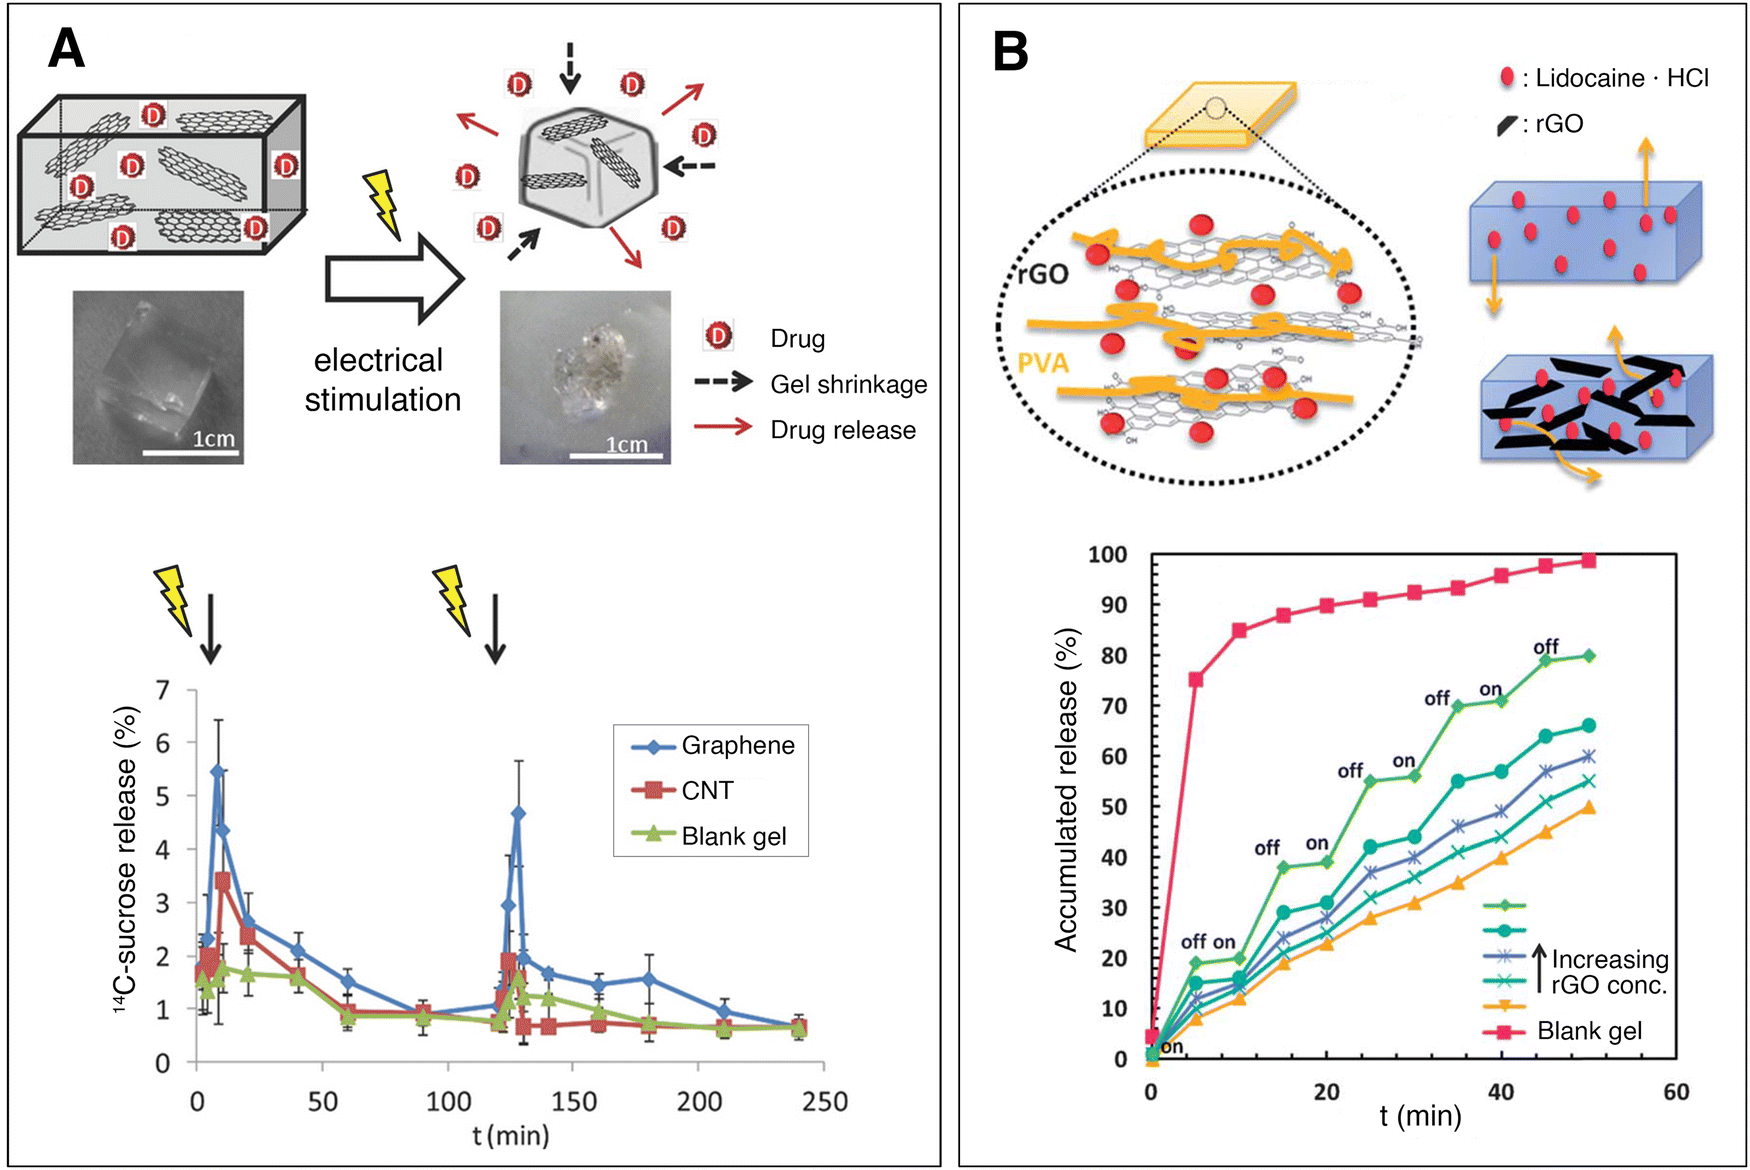 | ||
| Fig. 5 Conductive nanocomposite hydrogels for controlled drug delivery. (A) Electrical stimulation causes a methacrylic acid–graphene nanosheet hydrogel to shrink, releasing drug. In vivo release profile of 14C sucrose on the blood plasma of mice implanted with sucrose-loaded hydrogels. Hydrogels with no nanomaterials (green), 0.2 mg ml−1 CNTs (red) and 0.2 mg ml−1 graphene (blue) were tested. A tension of 10 V DC is applied for 1 minute with a time interval of 2 h. The graphene-loaded hydrogel (which also had the highest conductivity) demonstrated a pulsatile release of sucrose, controlled by the electric field. Adapted, with permission, from ref. 53. Copyright 2014 Wiley. (B) Reduced graphene oxide nanomaterials retain lidocaine hydrochloride within a polyvinyl alcohol hydrogel. Upon pulsatile electrical stimulation (on/off, 15 V DC) the nanocomposite hydrogels exhibit controlled drug release, while the blank gel does not change release profile. Adapted from ref. 49 with permission from The Royal Society of Chemistry. | ||
1.4 Electrical conductivity targets
2. Conductive nanomaterials
The conductive nanomaterials incorporated in hydrogels to increase their electrical conductivity fall into three categories: carbon-based, polymeric and metals and metal oxides (Fig. 6). Throughout this review, the ISO definitions of nanomaterials and nanoparticles are used. A nanomaterial is defined as a material with any external dimension, internal structure or surface in the nanoscale, i.e. 1 to 100 nm. A nano-object is a discrete piece of material with one, two or three external dimensions in the nanoscale while a nanoparticle has all three external dimensions in the nanoscale range.64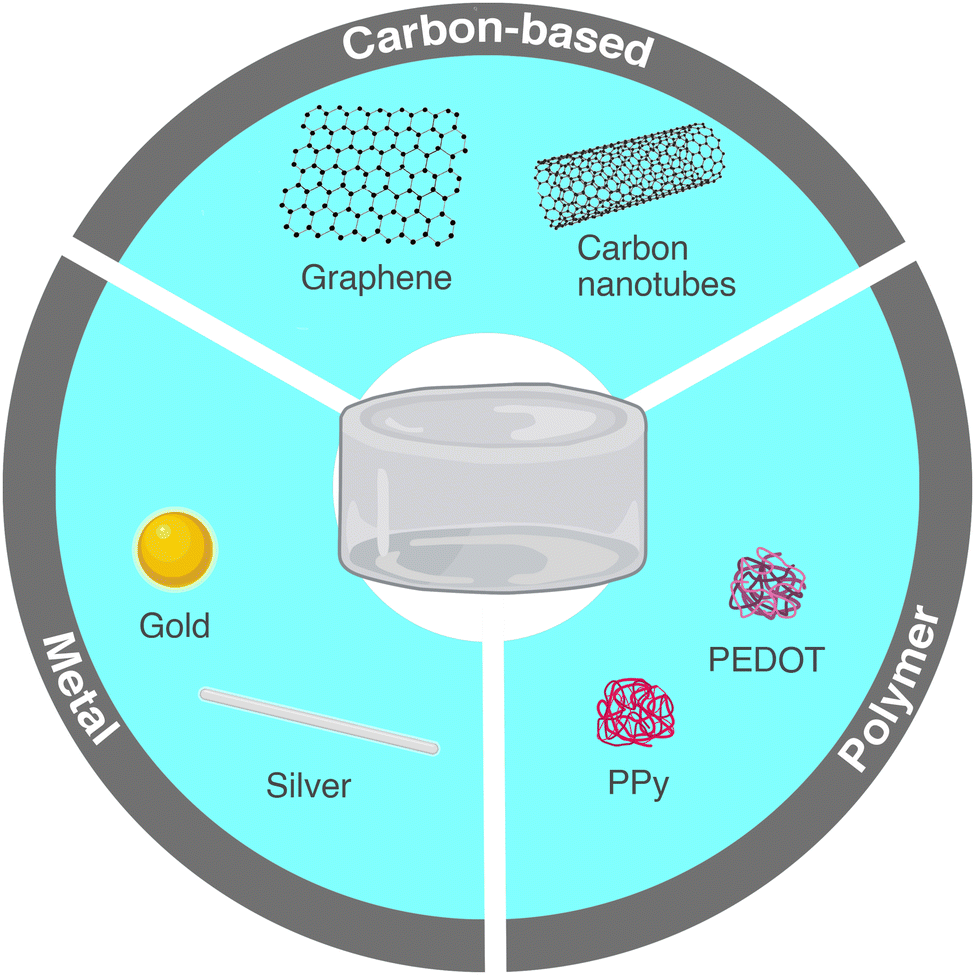 | ||
| Fig. 6 Commonly used conductive nanomaterials in nanocomposite hydrogels. | ||
2.1 Carbon-based nanomaterials
Carbon-based nanomaterials have high mechanical strength, electrical conductivity, surface area and chemical stability and are available in a variety of allotropes and forms.65 They can usually combine these properties, which is rather unique. The carbon nanomaterials most commonly employed to increase the electrical conductivity of hydrogels include carbon nanotubes (CNTs) and graphene-related materials (GRMs), and less often carbon black and graphite.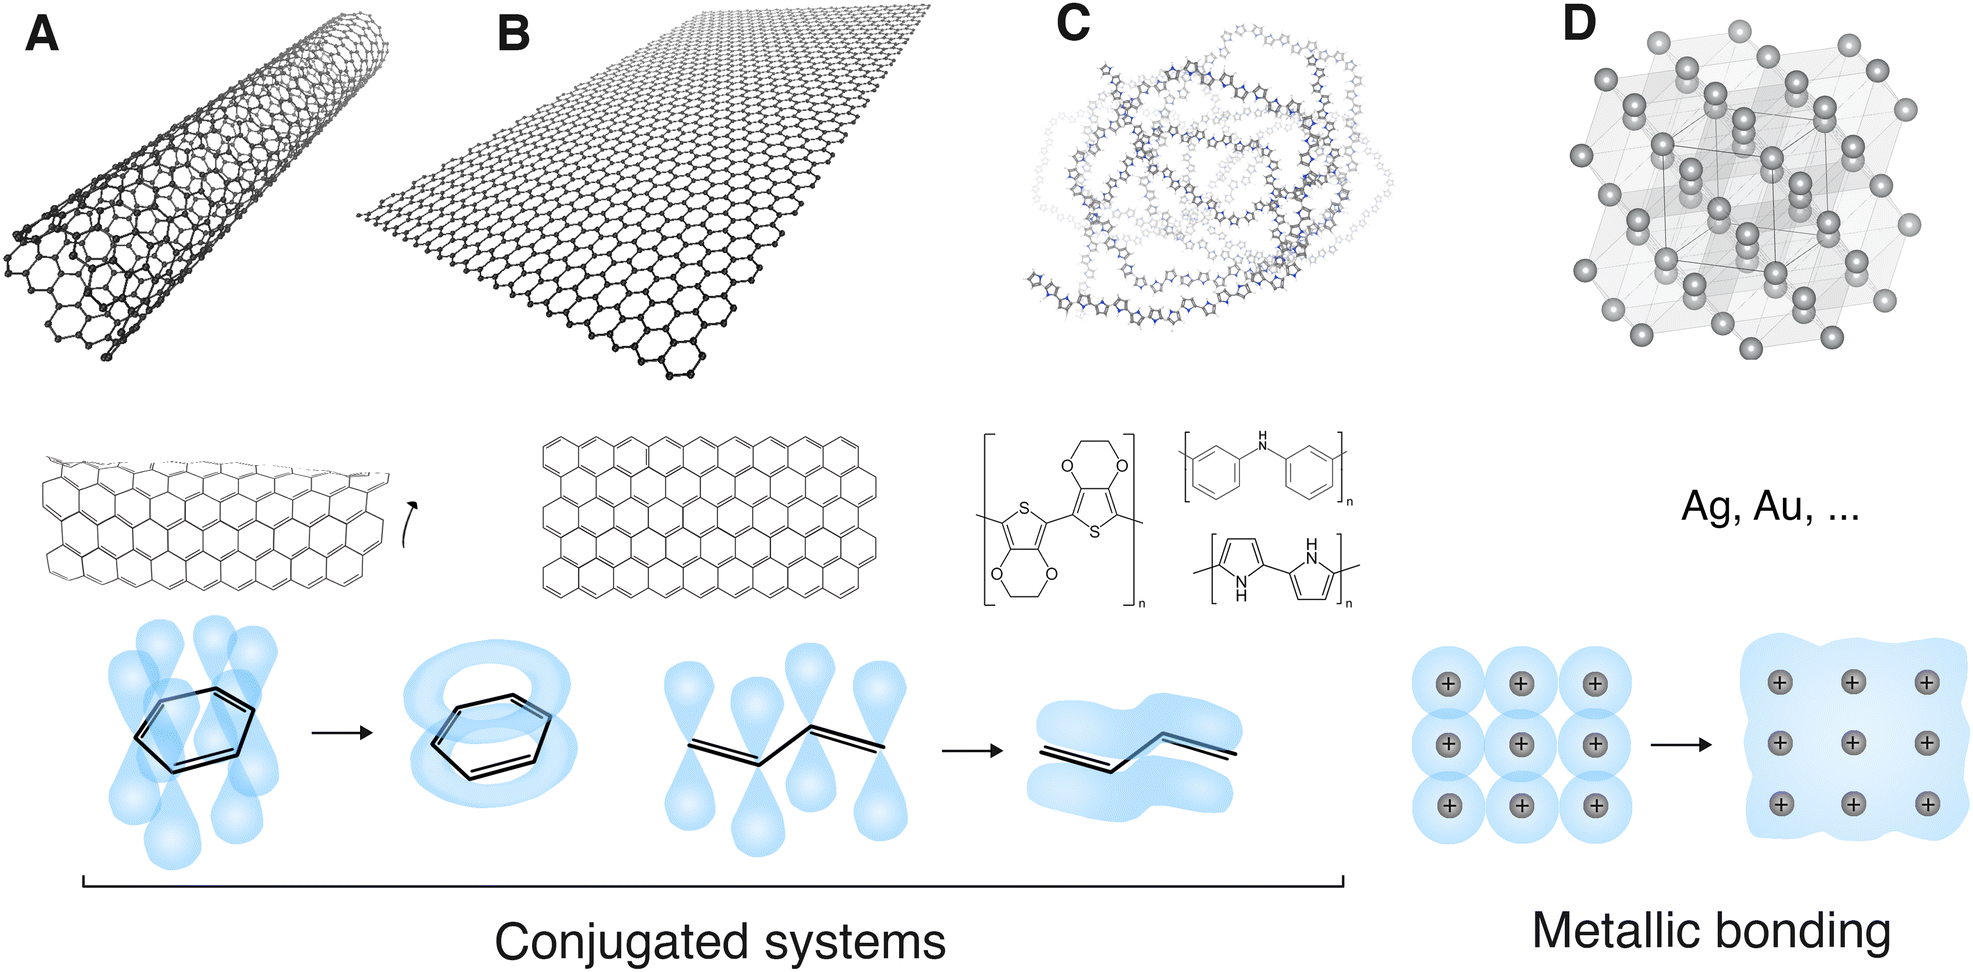 | ||
| Fig. 7 Conductive nanomaterials. (A) Carbon nanotube; (B) graphene; (C) conducting polymer (polypyrrole); (D) metal (silver). A, B and C are conjugated systems. The pi orbitals of their hybridized sp2 bonds form a delocalized, overlapping and conducting pi electron orbital on a parallel plane over and under the sigma bonds. This is conventionally represented by alternating single and double bonds. D forms metallic bonding. Conduction electrons from the metal cations form a delocalized electron cloud all over the metal crystal structure. Software used: VMD81 and VESTA.82 | ||
CNTs can be semi-conducting or metallic, depending on the diameter and the helicity of the nanotube. The electrical conductivity of isolated CNTs can reach values of 105–108 S m−1.69,70 They are commonly implemented in nanocomposite hydrogels to increase their electrical conductivity because of their high intrinsic electrical conductivity, the ability to form percolation‡ networks even at low concentration thanks to their high aspect ratio (typically from a few hundreds to tens of thousands) and the compliance with many polymer matrices.69 Additionally, CNTs can also significantly reinforce the mechanical properties of nanocomposite hydrogels.71,72
Zhou et al. added SWNT into a gelatin hydrogel and cross-linked them with glutaraldehyde. The hydrogel served as a scaffold for engineered cardiac tissue, aimed to treat myocardial infarction. Adding 0.15% w/w of SWNT into a hydrogel with 7.5% w/w gelatin and 2.5% w/w glutaraldehyde increased the electrical conductivity from 3 × 10⁻⁸ to 5 × 10⁻⁵ S m−1 and the shear modulus from 30 to 40 Pa. The SWNT concentration was chosen as a compromise between conductivity and cytotoxicity; hydrogel scaffolds with higher SWNT concentration significantly decreased cardiac cell viability. The conductive SWNTs enhanced the contractile muscle tissue function and the formation of gap junction and globally improved heart function after myocardial infarction, as tested on rats.73
Spizzirri et al. added MWNTs into gelatin microgels by emulsion polymerization, in the presence of sodium methacrylate and N,N′-ethylenebisacrylamide. The microgels served as a drug reservoir for electro-stimulated release on the skin surface. It was found that 0.8% w/w MWNTs increased the hydrogel conductivity from 1.3× 10⁻⁷ to 2.6 × 10⁻⁷ S m−1. Lower concentrations of MWNT had no effect on the conductivity, indicating that a percolation network was not formed. The microgels with MWNTs showed no significant cytotoxic effect and increased the release rate of the drug, both with and without an external electric field.74
Alternatively, the Hummers’ method is used to oxidise graphite, which can then be exfoliated into graphene oxide (GO) in solution.77 The covalent functionalization of graphene drastically reduces its conductivity to values around 2 × 10⁻² S m−1, but GO has an easier production and can be dispersed in aqueous solutions. Then, GO can be chemically or thermally reduced to restore part of its electrical conductivity. Chemical reduction with reducing agents reaches conductivity values of 6 × 10⁴ S m−1 and thermal reduction with high annealing temperatures can produce reduced graphene oxide (rGO) with conductivities up to 2 × 10⁵ S m−1.78
GRMs are incorporated into hydrogels to increase their electrical conductivity because of their high intrinsic conductivity and large aspect ratio, allowing for low percolation thresholds. They also simultaneously improve the mechanical properties of nanocomposite hydrogels.53
Wang et al. added rGO to increase the conductivity and mechanical resistance of a PVA–PDA (polyvinyl alcohol–polydopamine hydrochloride) hydrogel. The hydrogel was developed as a strain-sensitive human motion sensor. Blending in 5% GO/PVA slightly increased the conductivity from 10−2 to 2 × 10⁻² S m−1. However, reducing GO for 1 hour by mixing it with PDA and then adding the solution to the PVA hydrogel, in concentrations 5% w/w GO/PVA and 7.5% w/w PDA/PVA increased the conductivity of the hydrogel to 0.1 S m−1. Increasing the reduction time to 4 hours further increased the conductivity to 0.27 S m−1. The GO also increased the tensile strength of the hydrogels though the rGO reinforced the strength less than GO. This was attributed to the functional oxygen groups in GO, which physically interact with the polymer chains. The conductive hydrogels successfully changed their conductivity according to strain, as tested on a human wrist and knee joint.79
Alam et al. fabricated conductive, robust and pH-sensitive hydrogels by adding graphene to polyacrylic acid. Graphene was prepared from graphite powder, by oxidizing in an acidic environment with simultaneous ultrasonication. A thin film of the as-prepared graphene had a conductivity of 495 S m−1. The composite hydrogels were prepared by in situ polymerization. Adding 1% v/v graphene to the hydrogels increased their electrical conductivity from 3 × 10⁻¹⁴ to 1.3 × 10⁻⁵ S m−1, the compressive strength from 0.4 to 6.9 MPa and the Young's modulus from 1.6 to 19 MPa.80
2.2 Conducting polymers
Conducting (or conjugated) polymers are organic macromolecules with a backbone of alternating double and single bonds. The delocalized pi electrons of the double bonds, in combination with a dopant ion that is added to carry charges, confer them conducting or semiconducting properties (Fig. 7(C)).83 The most common conducting polymers are polypyrrole (PPy), polyaniline (PANI), polythiophene and their derivatives, notably aniline oligomers and poly-(3,4-ethylenedioxythiophene) (PEDOT).22Nanomaterials of conducting polymers can be prepared by post-polymerization dispersion or direct polymerization in disperse heterophase systems.84 PPy nanomaterials are spherical with diameters ranging from 50 to 400 nm, depending on the stabilizer used and have a conductivity of 102–5 × 10³ S m−1.84,85 PANI nanomaterials can have diameters as small as 4 nm and up to 500 nm, in spherical or ellipsoid, rice-grain shape and have a conductivity of 10–107 S m−1. PEDOT nanomaterials are often doped with anionic polyelectrolytes, such as poly(sodium-4-stryenesulfonate) (PSS), which serve as a charge balance. PEDOT:PSS nanomaterials are water soluble and have spherical size with diameters 35–100 nm and electrical conductivities of approx. 105 S m−1.84,85 Most conducting polymers can also be directly prepared by electropolymerisation on conducting substrates.
Conducting polymers are added to hydrogels to increase their conductivity, as an alternative to carbon-based or metal nanomaterials. They are mostly inexpensive, easy to process and biocompatible.22 Additionally, surface functionalization and incorporation of dopant ions can further modulate their electrical properties.83 However, conducting polymers are brittle and may decrease the overall mechanical strength of nanocomposite hydrogels.86
Li et al. synthesized a tough and conductive nanocomposite hydrogel by in situ polymerization of N-hydroxyethyl acrylamide in a solution containing PEDOT:PSS nanoparticles and LAPONITE® nanoplatelets. The polymer nanoparticles were added to increase the conductivity and the clay nanoplatelets to add mechanical strength. Adding 0.5% w/v PEDOT:PSS to the hydrogel increased the conductivity from 0.04 to 0.09 S m−1. The nanocomposite hydrogels exhibited strain-responsive conductivity and self-healing capacity, making them ideal candidates for applications in motion sensors.87
Wang et al. prepared a gelatin methacrylate hydrogel and integrated PPy nanoparticles into it with a dopamine crosslinker. The electrical conductivity of the hydrogels increased from 3.6 × 10⁻³ S m−1 (with 1 mg ml−1 PPy) to 1.2 × 10⁻² S m−1 with 4 mg ml−1 PPy nanoparticles. The conductive hydrogel was then tested as an engineered cardiac patch to repair myocardial infarction in affected rat models, enhancing the functionalization of cardiomyocytes.88
2.3 Metal and metal oxide nanomaterials
These nanomaterials are nanoscale entities of pure metals or metal compounds, such as oxides (Fig. 7(D)). The most used metal nanomaterials for increasing the electrical conductivity of hydrogels are gold and silver nano-objects. Gold nano-objects are mostly spherical or rod-shaped, have diameters of 1–60 nm and a conductivity of 4.5 × 10⁷ S m−1. Silver nano-objects can be spherical with diameters of 4–120 nm or nanowires, with diameters of 10–200 nm and lengths of 5–100 μm.85,89 Silver has an electrical conductivity of 6.3 × 10⁷ S m−1. Additionally, silver nano-objects are known to have antimicrobial properties, which can prove useful for some applications.90 One major drawback of metal nano-objetcs is their propension to oxidation, leading to a decrease in performance over time.Baei et al. synthesized a thermosensitive, conductive hydrogel by embedding gold nanoparticles into a chitosan matrix. The gold nanoparticles were spherical with an average diameter of 7 nm. A hydrogel with 0.016% w/v gold nanoparticles had a conductivity of 0.13 S m−1, close the conductivity of the native myocardium (0.16 S m−1), while the pristine chitosan hydrogel was not conductive. The conductive nanocomposite hydrogel stimulated the differentiation of mesenchymal stem cells into cardiomyocytes and was deemed promising for use as an injectable hydrogel to deliver cells and bioactive factors to the infarcted heart.91
2.4 MXenes
MXenes, two-dimensional sheets of transition metal carbides, carbonitrides or nitrides, represent a more recent class of conductive nanomaterials.92 MXenes are prepared by selective chemical etching of the A element from MAX phases, layered ternary solids with a general formula of Mn+1AXn (n = 1–4) where M is an early d-block transition metal, A is a main-group sp element and X is C, N or both.93 They consist of sheets with a thickness of few atomic layers (3 to 9 atomic layers) and up to tens of microns in their lateral dimensions.92,94 MXenes can have semiconducting or metallic conductivities with the highest values reported being 2.4 × 10⁶ S m−1 for a Ti3C2 MXene.95 MXene surfaces are commonly terminated with oxygen or hydroxyl groups, which render them hydrophilic.92,94 Their hydrophilicity, high electrical conductivity and large aspect ratio make them suitable candidates for incorporation in conductive nanocomposite hydrogels.94 For the moment, notable biomedical applications of MXene nanocomposite hydrogels have mostly focused on strain sensors.94,96 An important limitation is that MXenes have a metastable character in aqueous media, i.e. they are prone to degradation.96,973. Electrical percolation
3.1 Percolation theory
Incorporation of a conducting filler in an insulating hydrogel matrix, increases the conductivity of the nanocomposite, with increasing filler concentration. Often, a point is observed where a small increase in filler concentration leads to a steep increase in conductivity, a shift of few orders of magnitude.69,98 Further increase in filler concentration has a limited effect on conductivity. The resultant graph of conductivity versus filler concentration exhibits a sigmoidal shape (Fig. 8).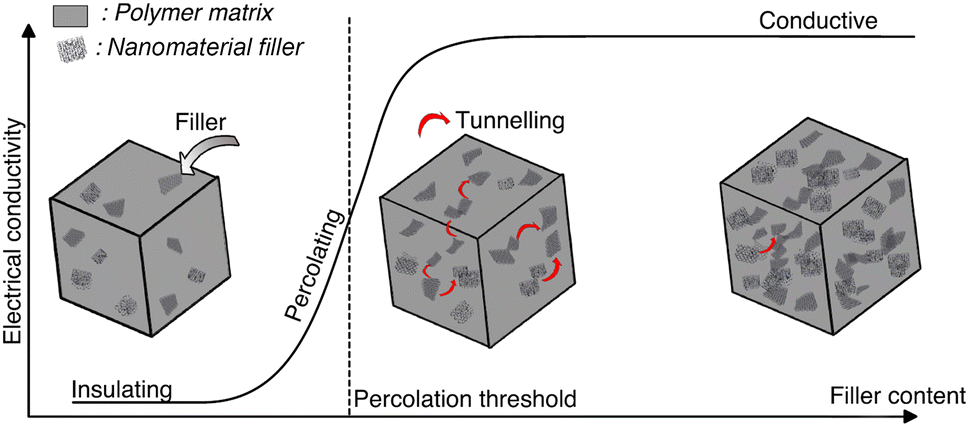 | ||
| Fig. 8 Electrical conductivity vs. nanofiller content. Percolation has three phases: initially the concentration of the nanomaterial is not enough to form an interconnecting network and the conductivity remains low. As the concentration increases, electrons can hop through the nanofillers with tunnelling and the conductivity increases. When the concentration reaches the percolation threshold, a network is formed throughout the whole system and the conductivity reaches a high plateau. Adapted from ref. 78. | ||
Percolation theory explains this jump-like transition. The conductivity increases steeply when the filler forms a continuous conducting network within the hydrogel. Individual clusters of filler particles come into contact with each other, to ultimately form a single cluster that extends throughout the system.98 Electron transport takes place through the conductive filler network and the system's behaviour changes from insulating to conducting (Fig. 8). The corresponding critical filler concentration is called percolation threshold. The percolation threshold of different nanocomposite hydrogels varies widely and depends on the polymer matrix and the shape, size, orientation and dispersion of the filler.69 Higher aspect ratios and better dispersions lead to lower percolation thresholds.
The electrical percolation threshold is an important parameter in percolating systems. Experimentally finding it and tuning it by changing the properties of the system can lead to the development of highly conductive nanocomposites with minimal filler concentration and desirable properties. For a random distribution of a well-dispersed filler, the statistical percolation theory can model the conductivity of composites.98,99
| σ = σ0(Φ − Φc)t, for Φ > Φc | (1) |
Experimentally, the electrical percolation threshold can be deduced from a graph of electrical conductivity with increasing filler concentration. The threshold is the middle point of the S-shaped part of the graph. It can also be calculated by fitting eqn (1) to experimental data.
Numerically, there are various models with increasing complexity for calculating the percolation threshold. The first studies of percolation assumed a lattice organisation of particles where a set of predefined spatial positions may be covered or be left empty.98 In materials science though, the results of these studies can only be relevant for systems with a crystalline structure. The continuum percolation models can be applied for hydrogels, which have an amorphous structure and thus a random distribution of particles. The simplest models simulate the filler particles with interpenetrating objects. The electrical percolation threshold is calculated as the point where the filler particles form a continuous network, a cluster of particles that extends through the simulation space.
The calculated percolation thresholds from the above method can be higher than the experimental ones because it does not take into account two phenomena: the filler particles cannot penetrate into each other because of repulsive van der Waals interactions and the electrical percolation threshold can occur before the geometrical percolation, due to electron tunnelling.101 Geometrical percolation is when the filler particles form a network with physical contact. Electrical percolation can occur at lower filler concentrations, as electrons can be transferred through a thin film of dielectric material that separates the filler particles. The electron tunnelling distance is in the order of few nm.102
The hard–core, soft–shell simulation model is used to represent more accurately the nanocomposite system. In this model, the fillers are randomly distributed in a fixed space and are represented by impenetrable hard cores. The soft shells can overlap with the cores and with each other and represent the tunnelling distance.69,101 Another factor that differentiates experimental from numerical results is the non-randomness of real dispersions. In numerical models, the particles will be randomly distributed within the system's boundaries while in experiments particles tend to agglomerate/cluster and align, affected by particle interactions, the dispersion method and the thermal or mechanical processing history of the material.103 This clustering and non-random alignment of nanomaterials can have substantial effects on the percolation concentration of the system.103,104
3.2 Critical path approximation
Percolation models assume a sharp cut-off point of electrical conductivity. Two individual particles are either electrically connected or not. Subsequently, a cluster of particles passes from disconnected (insulating) to percolated (electrically conductive), when the percolation threshold is reached. Ambrosetti et al. argue that this approach is well suited to explain the electrical conductivity in the extreme cases of low filler concentration (particles with no electrical contact) and high filler concentration (particles “touching” each other throughout the system) but fails to account for the conductivity changes in the intermediate regime, around the percolation concentration.105 They model the conductivity changes in nanocomposite systems by focusing on the tunnelling conductance between conductive particles.105,106 The tunnelling conductance decays exponentially with distance, but does not include a sharp cut-off. This model can be solved numerically by simulating the conducting fillers as a network of particles that are all connected to each other through tunnelling processes (Global Tunnelling Network). An analytical solution for the conductivity σ, is given by the critical path approximation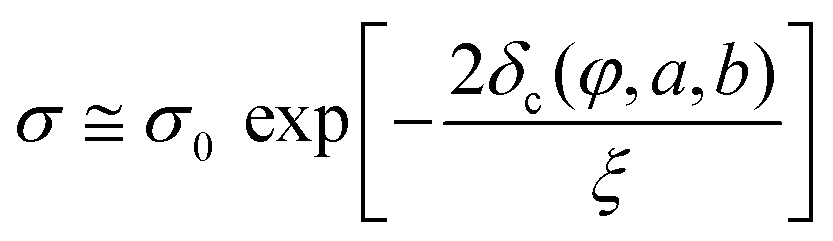 | (2) |
The implications of the critical path approximation are that the transition from insulating to conducting is no longer described by a power law increase in conductivity after the percolation threshold concentration, but rather as a crossover between the insulating matrix conductivity and the interparticle tunnelling conductivity.105
3.3 Percolation of carbon nanotubes
CNTs have a high aspect ratio (generally ca. 1000 or higher), which allows for low percolation thresholds.69 Kovacs et al. used the excluded volume concept to calculate a percolation threshold of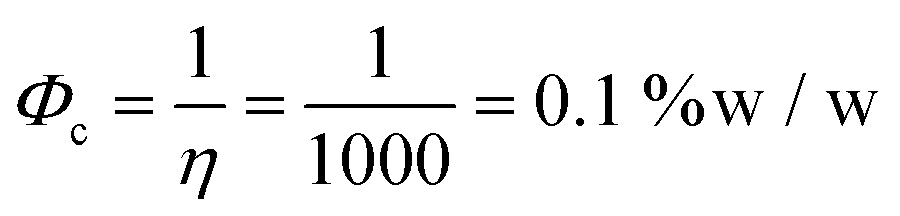 | (3) |
CNTs can be modelled as capped cylinders for the numerical simulations. The most sophisticated models take into account the electron tunneling distance, the non-random alignment, as well as the waviness of the nanotubes, which increases the percolation threshold.107
3.4 Percolation of graphene-related materials
The high specific surface area and aspect ratio of GRMs allow for low percolation thresholds. Zhang et al. compared the percolation threshold of graphene and graphite nanocomposites, to illustrate the influence of the aspect ratio and specific surface. They measured the conductivity of PET/graphene and PET/graphite with increasing filler concentrations and obtained a percolation threshold of 0.47% v/v for graphene and 3.5% v/v for graphite.108Marsden et al. reviewed the electrical percolation threshold of GRM nanocomposites and the average percolation threshold was 0.5% v/v.78 A high standard deviation though (0.7% v/v) indicates that the percolation threshold may vary widely according to the dispersion, shape parameters of the filler (aspect ratio and specific surface) and the polymer matrix.
3.5 Electrical percolation studies in hydrogels
Most conductive hydrogel studies presented in this review did not report a percolation threshold. The ones commenting on percolation threshold concentration are grouped here. Ferris and Panhuis found a percolation threshold of 1.3% w/w for gellan gum hydrogels containing multi-walled CNTs.109 Mottet et al. report a percolation threshold of 0.5% w/w for alginate hydrogels with CNTs.110 Cui et al. report a percolation threshold of 0.015% w/w for poly-ethyl acrylate hydrogels, with multi-walled CNTs.111 Guillet et al. and Macdonald et al. found no percolation threshold for agarose – double-wall CNTs hydrogels for concentrations up to 1% w/w and for collagen – SWNTs for concentrations up 0.008% w/w respectively.112,113 Alam et al. reported a percolation threshold of 0.4% v/v for graphene incorporated in poly acrylic acid hydrogels.80 Sayyar et al. and Qiu et al. both reported a percolation threshold of 0.1% w/w for rGO fillers in chitosan and poly-isopropyl acrylamide hydrogels.114,115In contrast, in studies of solid nanocomposite polymers, there are more publications reporting a clear electrical percolation threshold. We explain this by four factors: (1) there are fewer studies in total for nanocomposite hydrogels, (2) carbon-based materials which generally exhibit low percolation thresholds are highly hydrophobic resulting in the formation of aggregates and poor dispersions in aqueous media, (3) polymer chains may tend to wrap around nano-objects, limiting direct contact between the conductive phase, and (4) hydrogels are more complex systems consisting of at least three components (polymer matrix, water, filler) and two conduction mechanisms (ionic and electronic). This complicates the investigation of the percolation threshold. Rather than a clear cut-off point of several orders of magnitude increase in conductivity, many nanocomposite hydrogels present modest augmentations with increasing nanofiller content.
3.6 Dispersion
Nanomaterials are introduced into nanocomposite hydrogels using one of three possible approaches: (1) dispersion of nanomaterials in an aqueous suspension of a monomer, followed by gelation, (2) dispersion of a nanomaterial precursor in an aqueous suspension of a monomer, followed by gelation and nanomaterial synthesis within the polymerized matrix, and (3) physical embedding of nanomaterials into a hydrogel matrix.116,117 The nanomaterials can significantly alter the properties of the nanocomposite hydrogels, thanks to the multiple physical and/or chemical interactions between the nanomaterials and the polymer. These include hydrogen bonds, van der Waals interactions and electrostatic interactions.116 The dispersion of nanomaterials in the hydrogel network affects the system's electrical and mechanical properties. Poor dispersions, leading to nanomaterial agglomeration undermine the property-enhancing features of nano-engineering.Carbon-based nanomaterials have highly hydrophobic surfaces. They form agglomerates in aqueous suspensions and have low interfacial compatibility with polymer matrices.116,118 The surface of carbon nanotubes and graphene sheets can be functionalized with hydrophilic groups, such as –COOH and –OH, facilitating their dispersion in water through electrostatic repulsion (at slightly acidic pH and above, the carboxylic function is present as a negatively charged carboxylate).119 However, covalent functionalization disrupts the electronic structure of pristine carbon-based nanomaterials, deteriorating their electrical conductivity.116 Another route is the addition of surfactants. Lastly, physical methods, such as polymer wrapping and cellulose-assisted dispersion have also been developed. Polymer wrapping and surfactants improve dispersion but also cover the surface of carbon nanomaterials and may increase the distance between the nanomaterials, decreasing electron tunnelling conductance and negatively affecting the conductivity of the nanocomposite hydrogel.118
Metal nanomaterials have high surface energy and strong dipole–dipole attractions. They form aggregates and precipitate in aqueous suspensions. Two approaches that achieve stable dispersions with fewer aggregates are the in situ growth of metal nanomaterials after gelation of the hydrogel and the use of metal nanomaterials as reactive cross-linking agents to polymerize the hydrogel.116
Conducting polymers are hydrophobic in their undoped form.83 Nanoparticles of conducting polymer, stabilized with a dopant, can be dispersed in aqueous solutions by stirring and sonicating. PEDOT is a hydrophobic, positively charged conjugated polymer. It is usually doped with PSS, a hydrophilic, negatively charged polyelectrolyte, to create stable water dispersions of PEDOT:PSS.120 PEDOT:PSS nanoparticles have fairly good dispersibility in water.87 Similarly, PANI is hydrophobic in its undoped form and hydrophilic when stabilized with a dopant such as camphor sulfonic acid.121,122 Polypyrrole nanoparticles can be doped with iron(III) chloride or PSS and can be easily dispersed in aqueous solutions.123,124
4. Electrical conductivity and conduction mechanisms
4.1 Conductivity
Electrical conductivity is an intrinsic property of materials which measures how well they conduct electric current. It is the reciprocal of resistivity, the resistance of a material to the flow of electric current. When a potential difference is applied to a sample, an electric field E is created, and charges inside the sample have an electric force applied to them. For an isotropic conductivity and a homogenous electric field, the current density J that results, depends on the sample's conductivity σ.| J = σ·E | (4) |
Electric current is conducted by charge carriers, which can be ions, electrons and holes. Electrical conductivity depends on the product of charge carrier concentration and mobility.
4.2 Conduction mechanisms
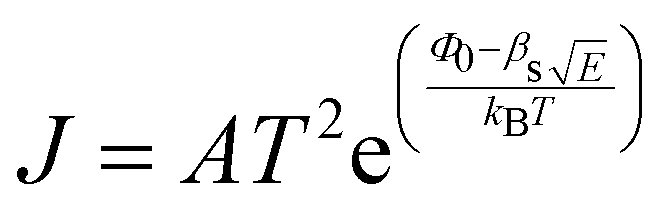
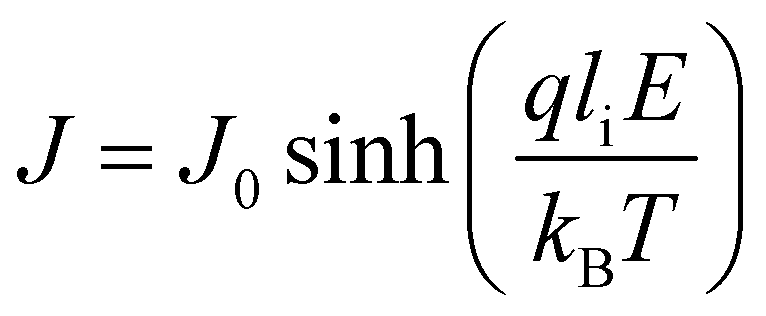
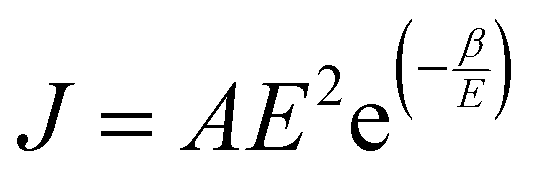
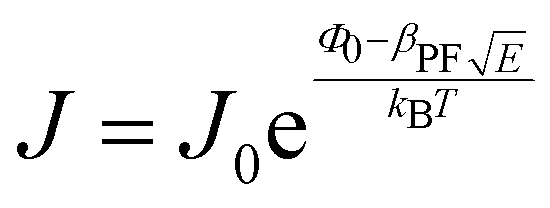
When a sample is placed between two electrodes, charge is injected in it through the interface of the sample with the electrode materials, then passes through its volume and gets out again from the interface of the sample with the other electrode. Localised charge movements also result in a measurable current, even if the charge carrier does not exit the sample. The limiting conduction mechanism is the determining one and this can fall into one of two categories: interface-limited (or electrode-limited) and volume-limited (or bulk-limited).125 Depending on the nature of the material and the applied electric field, one or more conduction mechanisms may contribute to the electric current transport.Interface–limited conduction mechanisms depend on the electrical properties at the contact between the sample and the electrode. The most important parameters are the energy barrier height that the charge carrier has to overcome in order to get injected into the sample and the effective mass of the charge carriers.125,126 Volume-limited conduction mechanisms depend on the electrical properties of the sample. The most important parameter in volume-limited conduction are traps, locations in solids which restrict the movement of charge carriers. Trap energy level, trap spacing and concentration all affect volume-limited conduction. Other parameters include the electrical mobility, the dielectric relaxation time and the density of states in the conduction band.125,126Table 1 summarizes the conduction mechanisms in solid materials and their equations, where J the current density, σ the conductivity, E the electric field, J0 the zero-field current density, q the electric charge, li the ion jump distance from one potential well to another, kB the Boltzmann constant, T the temperature, Φ0 the barrier height and A and β constants.
| Volume-limited | Interface-limited | ||
|---|---|---|---|
| Ohmic | J = σE | Schottky |
|
| Ionic (Hopping) |
|
Fowler–Nordheim–Tunneling effect |
|
| Poole–Frenkel |
|
||
4.3 Ionic conduction
Ionic conduction occurs when the charge carriers are ions. It is the dominant conduction mechanism in electrolyte solutions but also contributes to the electrical conductivity of solids. Fast ion conductors and solid electrolytes are examples of solid materials where ionic conduction is the main conduction mechanism.128 The ionic conduction mechanism consists of a series of jumps over potential barriers from one site to another.126 Ions are several orders of magnitude bigger and heavier than electrons and consequently ion mobility, reduced by steric effects, is much lower than electron mobility. Ionic conduction depends on ion concentration, temperature, ion size and valency, electrical field magnitude, viscosity (in the case of solutions) and the height and spacing of potential barriers (in the case of solids).4.4 Electric current
The movement of charge carriers under the influence of an electric field is the conduction current. There are two more current types that can be measured. The diffusion current is created by the movement of charge carriers under the influence of their concentration gradient. The displacement current is a transitory current due to the variation of the electric field and is not linked to a charge movement inside the sample. It includes the polarisation current, a transitory current that arises from the orientation of dipoles with the electric field. The total current can be written as the sum of the above current types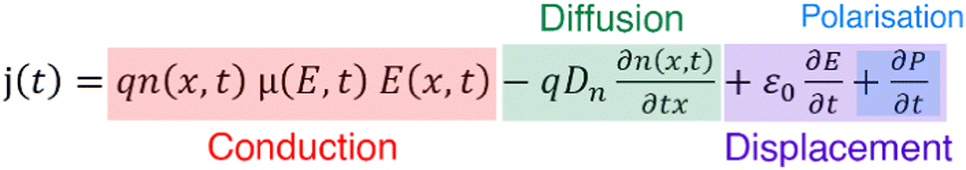 | (5) |
4.5 Hydrogel water content and electrical conductivity
Nanocomposite hydrogels are complex systems consisting of at least three components: water, which comprises the largest part of the hydrogel, a cross-linked polymer network and the filler nanomaterials. The role of each constituent in the electrical conductivity of the system is still poorly understood. Deionised water is used for the fabrication of most hydrogel samples. Nevertheless, some ions will always be present, introduced to the system from the polymer, the nanomaterials and other impurities, the contact with air and labware and due to the non-perfect deionisation of water. These free ions contribute to the electrical conductivity of nanocomposite hydrogels by ionic conduction. However, the mobility of ions in hydrogels is restricted by the porous network of the polymer. The ion mobility inside a hydrogel depends on the concentration and charge of the polymer and the pore size and distribution and is significantly lower than the ion mobility in an aqueous solution. The total amount of water within hydrogels can be classified into three types, according to phase transition behaviour: (1) non-freezing (bound) water, in the primary hydration shell of the hydrophilic polymer chains, (2) freezing bound water, in the secondary hydration shell and (3) freezing free water, which does not interact with the polymer matrix.129,130 These different states of water within the hydrogel framework can be distinguished through differential scanning calorimetry (DSC).131 Ionic mobility is expected to be much lower in the bound water fraction.132,133 Therefore, the ionic conductivity is mostly affected by the free water in the hydrogel matrix. The polymer network consists of electrically insulating polymer chains. The conduction mechanisms through it are expected to be equivalent to conduction through non-crystalline dielectric solids. Lastly, the nanomaterials studied in this review are embedded in hydrogels because of their metallic conduction properties. When they are present in a critically high concentration, they form a percolating network through the hydrogel allowing for a steep increase in the system's conductivity. The conduction mechanism through a percolating network of conductive nanomaterials is ohmic conduction.112The water content of nanocomposite hydrogels directly affects their electrical conductivity. Lower water contents decrease ionic conduction by densifying the polymer network, leading to smaller pores and lower ion mobility. At the same time, a decrease in water content with the subsequent densification of the hydrogel, increases the volume fraction of the nanomaterials and thus the chances of forming a percolating network. Ferris and Panhuis measured the electrical conductivity of a gellan gum hydrogel embedded with multi-walled CNTs and a control gellan gum hydrogel (without nanomaterials), upon drying. They inserted the hydrogels between two electrodes, put it on a mass balance and placed all the system in a heated chamber, with the temperature increasing from 20 to 60 °C, over time. The device allowed for simultaneous mass and conductivity measurements. The initial conductivity for both hydrogels was 10−3 S m−1. At 95% water content the conductivity of the nanocomposite hydrogel increased to 10−2 S m−1 while the conductivity of the control hydrogel decreased dramatically to 10−5 S m−1 (Fig. 9).109 The initial hydrogel conductivity can be attributed to ionic conduction, while the differences in the behaviours for decreasing water content can be explained on the basis of electrical percolation of the CNTs and ion mobility restriction in the control hydrogel.
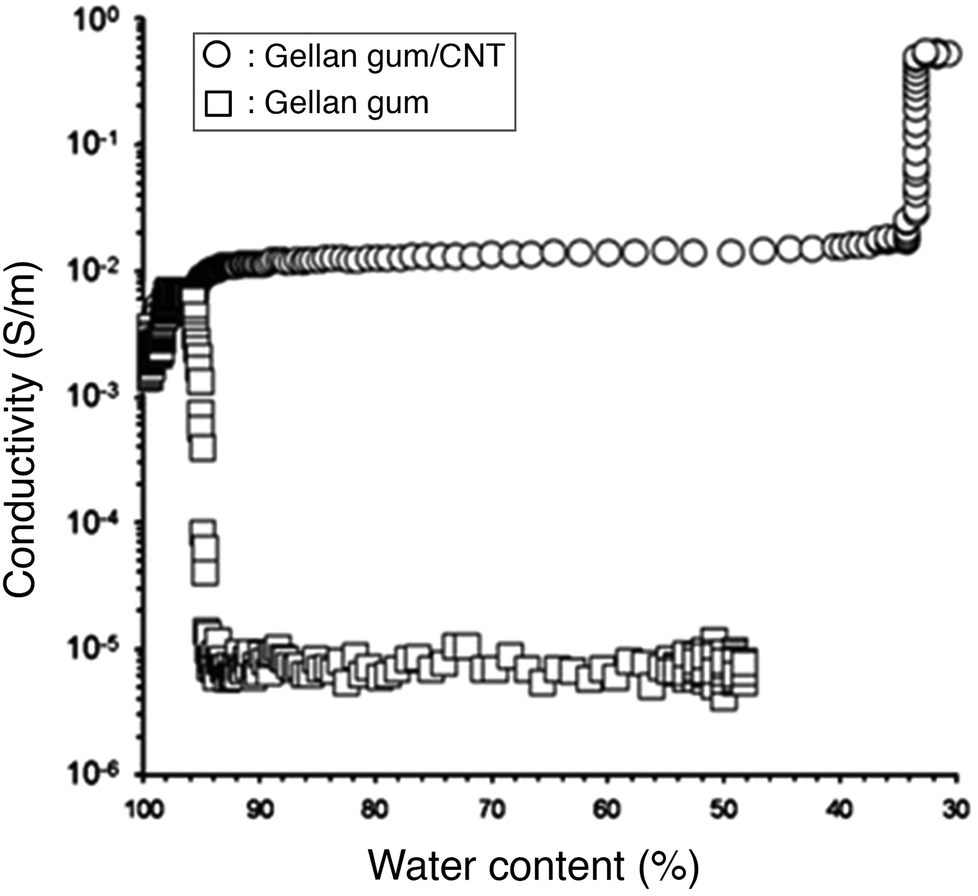 | ||
| Fig. 9 Conductivity of gellan gum hydrogels with CNTs (circles) and without (squares), over decreasing water content. The loss of water content densifies the polymer network restricting ion mobility but simultaneously increases the nanomaterial volume fraction and leads to percolation. Adapted from ref. 109 with permission from The Royal Society of Chemistry. | ||
5. Measuring electrical properties
The electrical conductivity of hydrogels can be measured from the relation between voltage and current. First, the sample hydrogel is placed between two electrodes. Then, an electrical stimulus is applied to the electrodes (known voltage or current) and the response of the system is observed. The electrical response of the system depends on the transport of charges within the material and the transfer of electrons to or from the atoms and ions of the sample at the electrode–sample interface. The total current flow will depend on the resistance of the sample and the reaction rates at the interface between the sample and electrodes. In addition, the electrical response will be affected by impurities on the sample and electrodes, possibly leading to oxidation or reduction reactions. Typically, these measures apply low voltages to the sample (50 mV to 1 V). Care has to be taken to not apply over 1.23 V for an extended time period, which would lead to electrolysis of water molecules (oxidation, release of oxygen) and affect the results.5.1 Two-point and four-point probe methods
The measuring device can be connected to the electrodes via a two-point or four-point system. Two-point probes are easier to handle but also measure the contact resistance, i.e. the resistance at the interface between the cables and the electrodes (Fig. 10(A)). A four-point system measures directly the resistance of the sample. The electrical stimulus is applied through two probes and the sample's response is measured through the two other probes, avoiding the contact resistance (Fig. 10(B)). However, in most cases of nanocomposite hydrogels, the sample's resistance is several orders of magnitude higher than the contact resistance, so the choice of a two- or four-point probe is of negligible impact.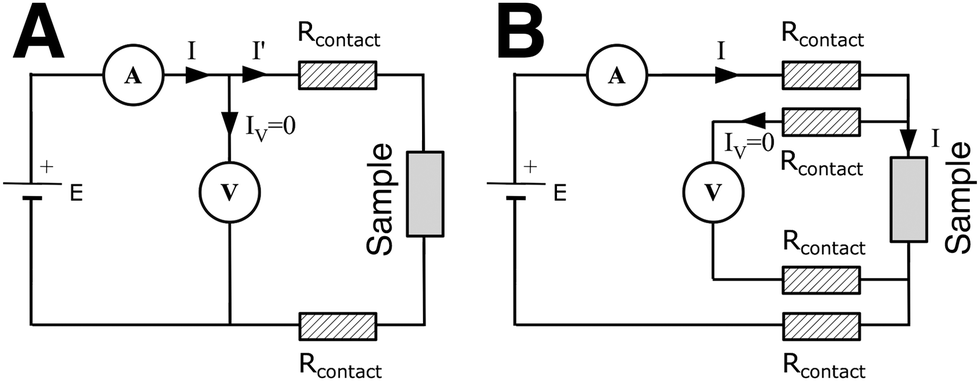 | ||
| Fig. 10 Circuit diagrams of (A) two-point probe and (B) four-point probe method. | ||
5.2 Direct current
 | (6) |
For an isotropic conductivity and a homogenous electric field, and with a simple sample geometry, the conductivity is calculated as the reciprocal of resistivity.
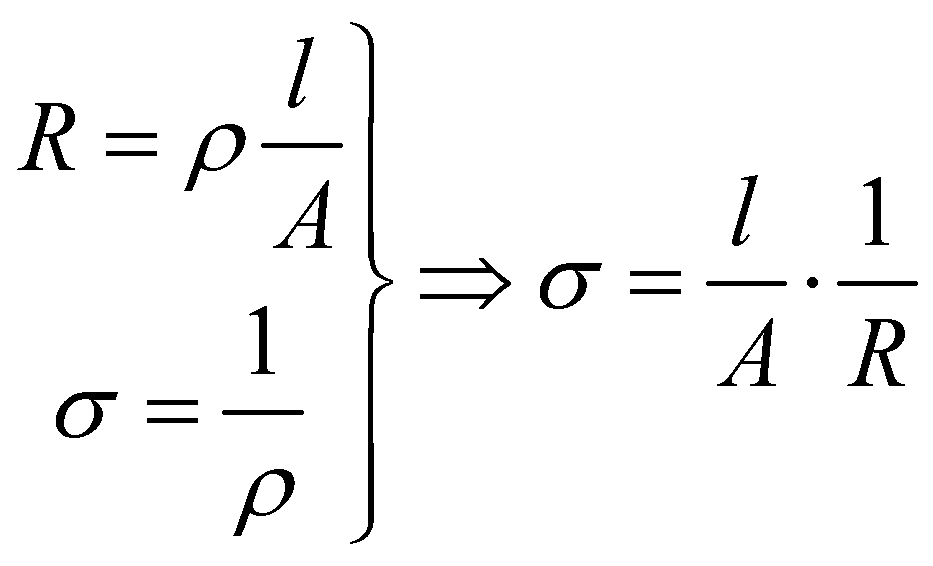 | (7) |
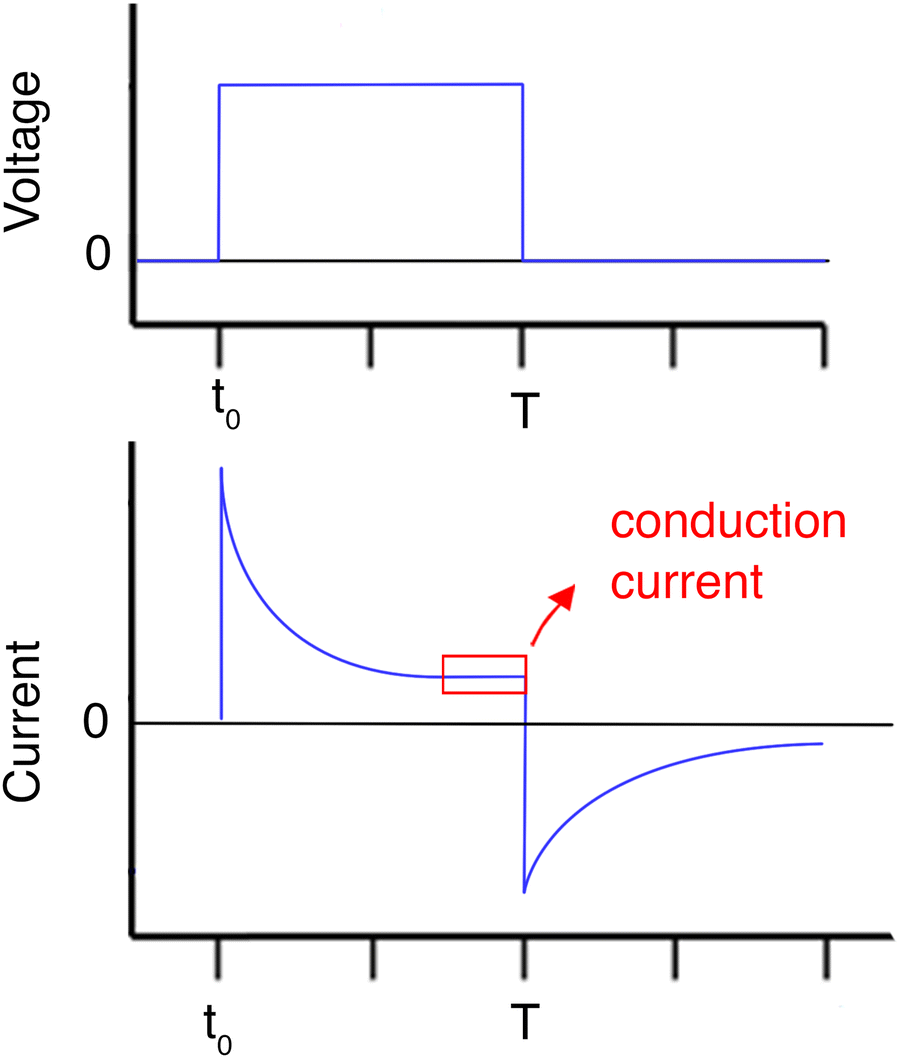 | ||
| Fig. 11 Double-pulsed, controlled potential chronoamperometry. A square wave voltage initially causes a current peak, due to polarisation. The current then exponentially decays to the conduction current. The removal of the voltage may cause a brief reversed current peak. | ||
From eqn (4), we have 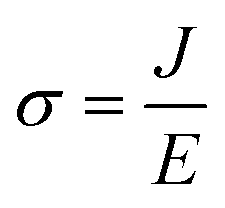 and for a simple geometry with the normal of the electric field perpendicular to it
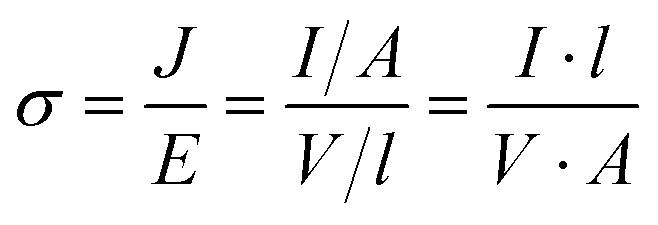 | (8) |
To calculate the conductivity, the conduction current (the time-invariant part of the I(t) graph) is inserted into eqn (8). Chronoamperometry also gives additional info about the sample's RC time constant.
Guillet et al. studied the conduction mechanism of agarose/CNTs nanocomposite hydrogels through chronoamperometry. They applied increasing voltage from 50 mV to 1.3 V and measured the current passing through the sample, vs. time. By plotting the conduction current density vs. the electric field (applied voltage divided by sample thickness) and comparing the graph with known equations of conduction mechanisms (Table 1), they suggested that pristine agarose hydrogels are dominated by an ionic conduction type, while nanocomposite hydrogels with CNTs most possibly exhibit a Poole–Frenkel conduction type.112
5.3 Alternating current
From the amplitude and phase shift measurement, a complex impedance Z is deduced with Z′ the real part (resistance) and Z′′ the imaginary part (reactance). Impedance expands the notion of resistance by taking reactance into account. While resistance leads to the dissipation of energy as heat, reactance stores energy and releases it after π/2. Capacitive reactance stores energy in the form of an electric field and inductive reactance stores energy in the form of a magnetic field.
The analysis of impedance spectroscopy data provides information about the electrical properties of the sample hydrogel. Different excitation frequencies will elicit different electrical responses from the material. For example, in low frequencies, electrons, ions and dipoles of different sizes will all move responding to the electric field. In higher frequencies ions and bigger dipoles do not have the time to move; only electrons respond to a rapidly changing electric field. Plotting the impedance data into a Nyquist plot (Fig. 12) allows the visualization of electrical phenomena and the modelling of an equivalent circuit, i.e. a simplified theoretical model that retains all the electrical characteristics of the original, complex circuit.135 The y-axis represents the negative of the imaginary part and the x-axis represents the real part of the complex impedance. The intersection of the curve with the x-axis designates the resistance of the hydrogel.136 The conductivity is then calculated from eqn (7).
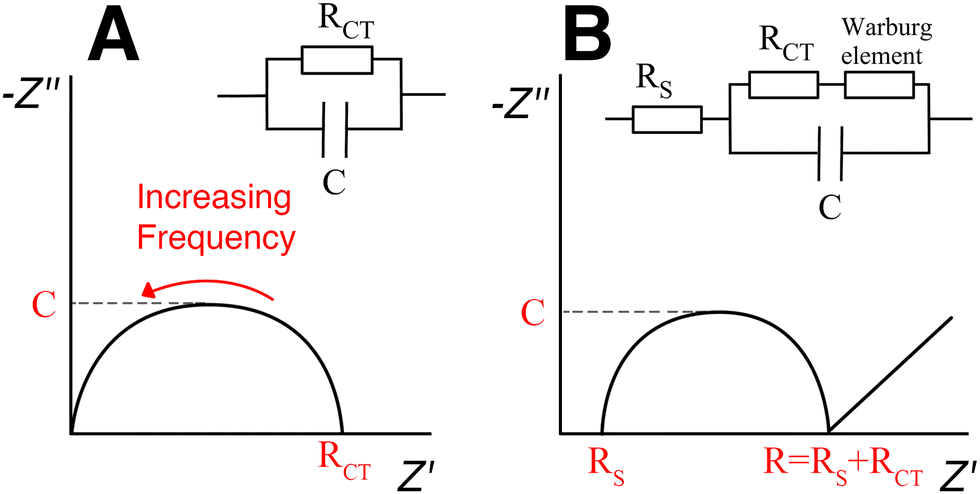 | ||
| Fig. 12 Impedance spectroscopy results can be visualised with a Nyquist plot. (A) Typical Nyquist plot of simple RC circuit with one resistor and one capacitor in parallel. (B) Typical Nyquist plot of resistance in series with the parallel combination of a capacitance with a resistance and a Warburg diffusion element (also known as Randles circuit). | ||
In the case of nanocomposite hydrogels, the equivalent circuit seems to include a Warburg impedance element in series with a resistor.112,137,138 The Warburg element models diffusion processes and is recognizable by a straight line with 45° slope, at low frequencies (Fig. 12(B)).
Warren et al. used impedance spectroscopy to investigate the percolation behaviour of CNT-loaded gellan gum hydrogels.137 They prepared the hydrogels by dissolving gellan gum powder into warm (80 °C) deionised water, dispersing CNTs in the solution through sonolysis and then cross-linking with Ca2+ ions. By varying the length of the hydrogel, they were able to distinguish between the sample's resistance and the contact resistance: the sample's resistance increases linearly with length, while the contact resistance remains invariable.
 | (9) |
Three different carbon nanomaterials were employed, single-wall CNTs, multi-wall CNTs and vapour-grown carbon nanofiber. The impedance analysis for all three carbon nanomaterials in a 0.9% v/v concentration showed a similar modest increase in conductivity (final value 0.12 S m−1; the original conductivity of gellan gum is not mentioned here but is reported as 10−3 S m−1 in previous studies109). This concentration was deemed too low to have an effect on the conduction mechanism. The carbon filler concentration was further increased by selectively removing a part of the water content of the hydrogel, at a rate of 0.43 g h−1, in a controlled temperature and humidity chamber. It was reported that at MWNT concentration of 1.4% v/v the impedance was no longer dependent on frequency and the Warburg coefficient value rapidly decreased, witnessing the formation of a percolating network and the transition between transport dominated by ions to transport dominated by electrons.137
5.4 Hall effect
A Hall effect measurement system can be also used to measure a hydrogel's conductivity. When a sample is traversed by an electric current in one direction, and a magnetic field perpendicular to this direction is applied simultaneously, a potential difference will be produced along the sample.125,140 This potential difference is called the Hall voltage. The Hall effect measurement also provides information about the charge carrier concentration and mobility.125 Bu et al. prepared a sodium alginate and carboxymethyl chitosan hydrogel to use as a substrate for peripheral nerve regeneration. They doped the hydrogel with conductive PPy (In this case, not strictly a nanocomposite but a hybrid hydrogel) and measured its conductivity through a Hall effect testing system. The conductivity of the hydrogel increased from 7.35 × 10⁻⁶ to 8 × 10⁻³ S m−1 by increasing the PPy mass ratio from 0.02 to 0.4, but no information was given on the charge carrier concentration and mobility.865.5 Conductive atomic force microscopy
Conductive atomic force microscopy (C-AFM) is a mode in AFM that allows for simultaneous measurement of the topography of a material and the electric current flow at the contact point of the probe with the sample.141 In nanomaterials engineering, it can be used to evaluate the property-enhancement and dispersion of conductive nanomaterials on the surface of a sample. Annabi et al. fabricated an elastic, conductive hydrogel based on a human recombinant protein and GO. They dispersed 2 mg ml−1 GO nanomaterials in a methacryloyl-substituted tropoelastin prepolymer solution and then initiated UV photocrosslinking to obtain a biocompatible, highly elastic hydrogel for the regeneration of electroactive tissue. They conducted C-AFM measurements on a pristine and a nanocomposite hydrogel (Fig. 13). Impedance spectroscopy, C-AFM and excitation threshold measurements all confirmed the higher electrical conductivity of the nanocomposite hydrogel.142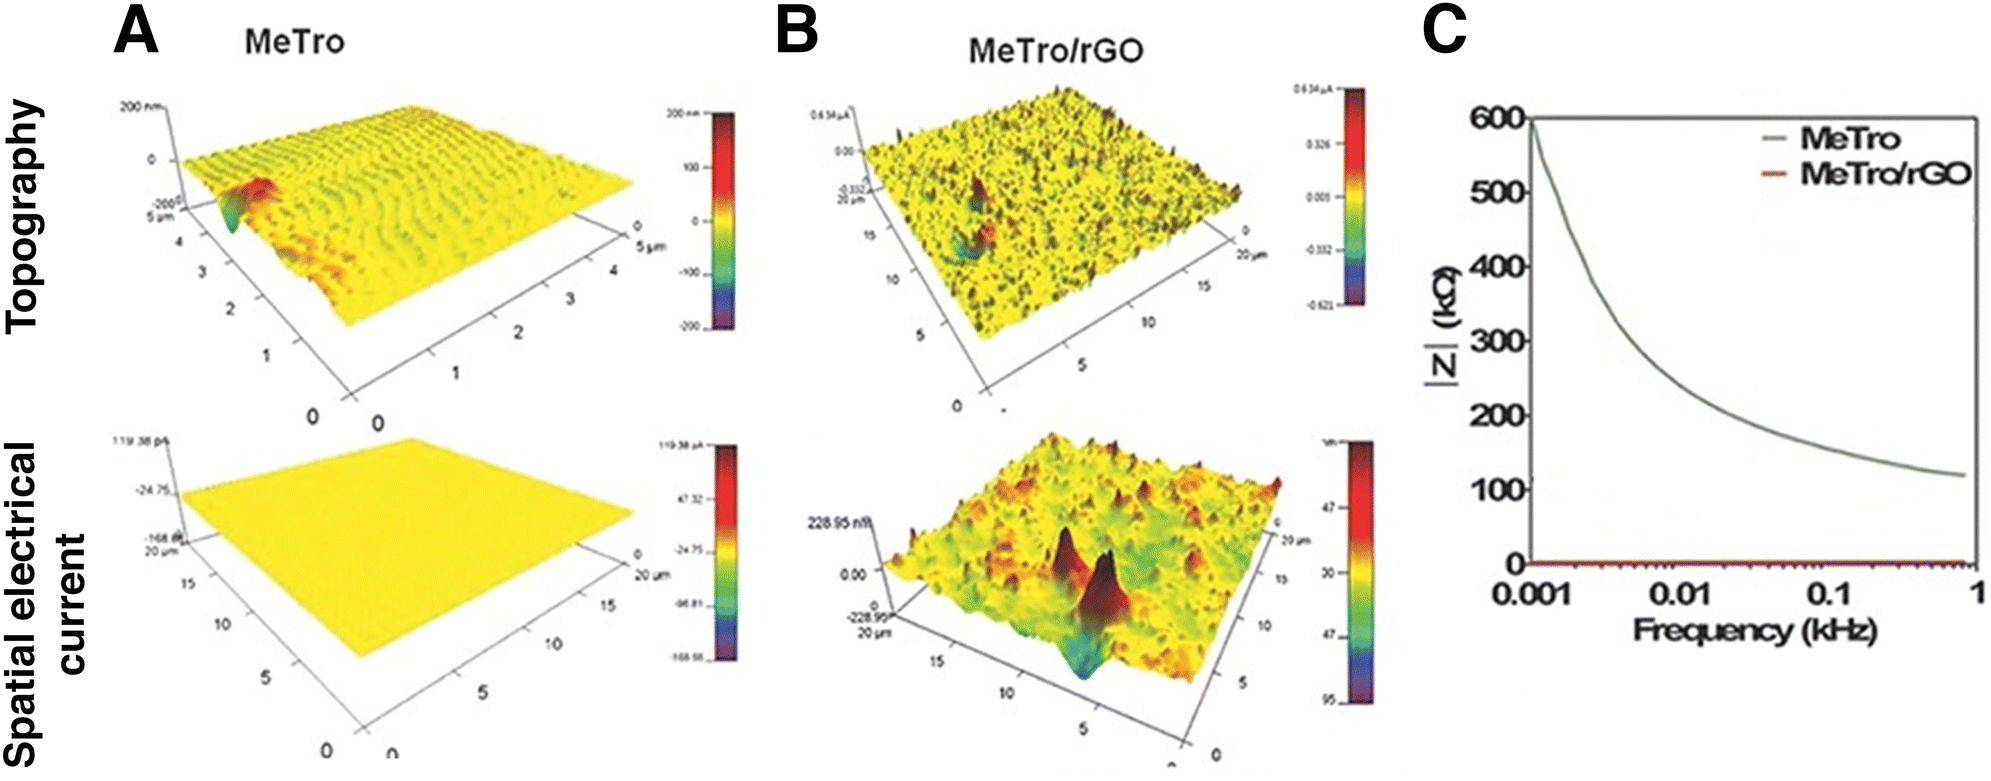 | ||
| Fig. 13 Conductive atomic force microscopy (C-AFM) and impedance spectroscopy of methacryloyl-substituted tropoelastin (MeTro) – rGO hydrogel. Surface topography and spatial conductivity of (A) pristine and (B) nanocomposite hydrogel. The nanomaterial affected both the topography and the electrical conductivity of the hydrogel. Current spikes are visible on the nanomaterials’ locations. (C). Impedance spectroscopy of pristine (green) and nanocomposite hydrogel (red). Reduced GO decreased impedance in all of the frequency range studied. Adapted with permission from ref. 142. Copyright 2015 Wiley. | ||
6. Discussion
6.1 Measured electrical conductivities of nanocomposite hydrogels
Conductive nanocomposite hydrogels are a relatively recent but rapidly expanding field of research. Virtually all publications covered in this review were published in the last 10 years. The main application that drives research are electrically conductive scaffolds for tissue engineering of electroactive cells. Other applications include strain sensors, biosensors, drug delivery, artificial skin, electrocardiography gel and electromagnetic interference shielding.74,143–145Table 2 presents a comprehensive summary of nanocomposite electrically conductive hydrogels, along with the nanomaterial concentrations employed and the highest conductivity value measured.| Nanomaterial | Polymer matrix | Application | Nanomaterial conc. | Hydrogel cond. σ0 (S m−1) | σ max (S m−1) | Notes | Ref. |
|---|---|---|---|---|---|---|---|
| CNT | OPF oligo(poly(ethylene glycol)fumarate) | Neural tissue engineering | 10 mg ml−1 | 3.7 × 10⁻⁴ (at 1 mg ml−1 CNT) | 2.04 × 10⁻³ | 72 | |
| CNT | PAM/PAA polyaclrylamide/polyacrylic acid | Biosignals/skin protection | 0.36% w/v | 0.25 | 8 | Glycerol + water hydrogels. CNTs functionalized with dopamine | 146 |
| CNT | Gelatin | Skin treatment | 0.4% w/w | 2.5 × 10⁻² | 7.2 × 10⁻² | CNTs functionalized with dopamine | 147 |
| CNT (SW) | Gelatin | Muscle tissue engineering | 1.5 mg ml−1 | 3 × 10⁻⁸ | 5 × 10⁻⁵ | Gelatin cross-linked with GA glutaraldehyde | 73 |
| CNT (SW) | Collagen type I | Tissue engineering | 4% w/w polymer | 0.3 | 0.7 | CNTs carboxylated. Collagen seeded with HDF human dermal fibroblast cells | 113 |
| CNT (SW) | Collagen type I | Neural tissue engineering | 0.01% w/w | 1.4 | 2.4 | CNTs oxidized. | 139 |
| Measured cond. in prepolymer solution form | |||||||
| CNT (SW) | Collagen type I | Muscle tissue engineering | 2% w/w polymer | 0.25 | 0.61 | 148 | |
| CNT (SW) | Agarose | Motion sensor | 15% w/w polymer | 0.1 (at 5% CNT w/w of polymer) | 0.3 | CNTs functionalized with dopamine | 145 |
| CNT (DW) | Agarose | Drug delivery | 40% w/w polymer | 7.4 × 10⁻⁴ | 2.7 × 10⁻² | 112 | |
| CNT (MW) | Agarose | Neural tissue engineering | 0.1% w/w | 0.94 | 1.46 | Hydrogels lyophylized and then placed in a PBS solution before conductivity measurements | 149 |
| CNT (MW) | Gellan gum | Tissue engineering | 0.1–0.5% w/v increased with drying | 10−3 | 10−2, up to 0.53 with decreasing water content | 109 | |
| CNT (MW) | Gelatin | Drug delivery | 8 mg ml−1 | 1.3 × 10⁻¹¹ | 2.6 × 10⁻¹¹ | 74 | |
| CNT (MW) | Alginate | Probe microbe electro-activity | Percolation at 0.5% w/w | 110 | |||
| CNT (MW) | PNIPAM poly N-isopropyl acrylamide | Motion sensor | 4 mg ml−1 | 0.13 | CNTs carboxylated. LAPONITE® nanoclay added for mechanical strength | 150 | |
| CNT (MW) | PAM/CS polyacrylamide/chitosan | Motion sensor | 0.125% w/v | 0.1 | 0.95 | CNTs carboxylated | 44 |
| CNT (MW) | PAM polyacrylamide | Artificial skin, Electromagnetic interference shielding | 1% w/w | 0.1 | 0.85 | CNTs dispersed with cellulose nanofiber | 143 |
| CNT (MW) | poly(EA-MAA) ethyl acrylate – methacrylic acid | 1% w/w | 4 × 10⁻² | 3 | 111 | ||
| CNT (MW) | PEG polyethylene glycol | Neural tissue engineering | 0.1% w/v | 1.14 | 1.6 | 151 | |
| CNT (MW) | PEG polyethylene glycol | Neural tissue engineering | 1.2% w/v | 1.14 | 2 | 152 | |
| CNT (MW) | PEG/DFA polyethylene glycol/dimer fatty acid | Tissue engineering | 6% w/w polymer | 2.4 × 10 | 1.6 × 10⁻² | CNTs oxidized | 153 |
| CNT (MW) + GO | OPF oligo(poly(ethylene glycol) fumarate) | Neural tissue engineering | 10 mg ml−1 rGO 10 mg ml−1 CNT | 2 × 10⁻⁴ | 7.9 × 10⁻⁴ | CNTs functionalized with PEGA poly(ethylene glycol)acrylate | 39 |
| Carbon black | PGMA poly(glycerol methacrylate) | Bioelectronics | 0.005% w/w | 10−4 | 0.1 | 154 | |
| Carbon black | PEGMA poly(ethylene glycol) dimethacrylate | Bioelectronics | 0.005% w/w | 9.3 × 10⁻⁵ | 1.8 × 10⁻² | 154 | |
| Carbon black | PDEGMA poly(diethylene glycol) dimethacrylate | Bioelectronics | 0.005% w/w | 8.9 × 10⁻⁵ | 1.2 × 10⁻² | 154 | |
| Carbon nanofibers | Chitosan | Muscle tissue engineering | 1% w/v | 0.03 | 0.04 | 155 | |
| GO | Chitosan | Tissue engineering | 0.05% w/w | 5.7 × 10⁻² | 1.22 × 10⁻¹ | GO functionalized with dopamine | 119 |
| GO | Chitosan | Neural tissue engineering | 3% w/w polymer | 10−8 | 4 × 10⁻² | 156 | |
| GO | Chitosan | Tissue engineering | 3% w/w polymer | 10−8 | 0.13 | GO reduced | 115 |
| GO | PVA/PEG poly(vinyl alcohol)/polyethylene glycol | ECG acquisition | 1.2% w/w | 8.5 × 10⁻⁴ | 5.1 × 10⁻³ | 144 | |
| GO + PEDOT:PSS | PU polyurethane | Neural tissue engineering | 14% w/w GO + PEDOT:PSS | 0.13 (at 2% w/w GO + PEDOT:PSS) | 0.62 | Liquid crystals of reduced GO + PEDOT:PSS | 157 |
| GO | OPF oligo(poly(ethylene glycol) fumarate) | Muscle tissue engineering | 1 mg ml−1 | 0.09 | 0.42 | 158 | |
| GO | PVA poly(vinyl alcohol) | 0.5% w/w PVA | 10−4 | 0.27 | GO reduced and functionalized with dopamine. | 79 | |
| GO | Sodium polyacrylate | 10% w/w polymer | 5.9 × 10⁻⁴ | 3.7 × 10⁻³ | GO reduced | 159 | |
| GO | PNIPAM poly N-isopropyl acrylamide | 0.23% v/v | 0.7 (at 0.05% v/v, 100 Hz) | 9 (at 100 Hz) | A reduced GO aerogel (monolith) is mixed with the polymer | 114 | |
| GO | PAM polyacrylamide | Muscle tissue engineering | 0.3% w/v | 1.8 × 10⁻³ | 1.3 × 10⁻² | GO reduced | 160 |
| GO | PAM polyacrylamide | 4% w/w polymer | 2.5 × 10⁻² | 10 | GO reduced and functionalized with dopamine | 161 | |
| Graphene | PAM polyacrylamide | 2% w/w polymer | – | 10−6 | 162 | ||
| Graphene | PAA poly(acrylic acid) | 1.25% v/v | 3 × 10⁻¹⁴ | 1.6 × 10⁻⁵ | 80 | ||
| Ag nanowires | Agarose | Motion sensor | 50 mg ml−1 | 0.01 (at 10 mg ml−1 Ag nanowires) | 300 | Patterned silver nanowires | 163 |
| Ag | Collagen | Tissue engineering | 2.7 × 10⁻⁷% w/w | 4 × 10⁻⁷ | 8 × 10⁻⁷ | 164 | |
| Au | Collagen | Tissue engineering | 4.9 × 10⁻⁷% w/w | 4 × 10⁻⁷ | 1.3 × 10⁻⁶ | 164 | |
| Au | Chitosan | Muscle tissue engineering | 1.5 w/w polymer | 0.08 | 0.13 | 91 | |
| PANI nanofibers | PAA poly(acrylic acid) | Muscle tissue engineering | 4.65% w/w | 0.14 | Doped with CSA camphor sulphonic acid | 122 | |
| PANI | PVP poly(N-vinyl-2-pyrrolidone) | 0.06% w/w | 5 × 10⁻⁴ | 10−3 | 138 | ||
| PEDOT:PSS | GelMA gelatin methacrylate | Motion sensor | 0.5% w/v | 0.03 | 0.09 | LAPONITE® nanoplatelets added for mechanical strength | 87 |
| PPy | GelMA gelatin methacrylate + PEGDA poly(ethylene glycol) diacrylate | Muscle tissue engineering | 4 mg ml−1 | 3.6 × 10⁻³ (at 1 mg ml−1 Ppy) | 1.2 × 10⁻² | 88 |
Impedance spectroscopy graphs give impedance or conductivity values over a range of AC frequencies. In some cases, when the low-frequency end of the graph forms a straight line, a DC conductivity value can be extrapolated (by expanding the line at 0 Hz). In most cases though, DC conductivity cannot be compared with AC impedance. Table 3 presents the nanocomposite hydrogels studied by impedance spectroscopy.
| Nanomaterial | Polymer matrix | Application | Nanomaterial conc. | Conductivity | Notes | Ref. |
|---|---|---|---|---|---|---|
| CNT | GelMA gelatin methacrylate | Muscle tissue engineering | 0.3 mg ml−1 | Impedance decreased with increased CNT content. Even more for aligned CNTs | CNTs carboxylated and aligned with dielectrophoresis | 165 |
| CNT (MW) | GelMA gelatin methacrylate | Muscle tissue engineering, actuator | 5 mg ml−1 | Increasing CNT content decreases impedance | CNTs carboxylated | 166 |
| CNT (MW) | GelMA gelatin methacrylate | Muscle tissue engineering | 1 mg ml−1 | Impedance decreased with increased CNT content. Aligned CNTs decreased impedance even at lower concentration (0.25 mg ml−1) | CNTs carboxylated and aligned with dielectrophoresis | 167 |
| GO | GelMA gelatin methacrylate | Tissue engineering | 2 mg ml−1 | 1 mg ml−1 GO did not affect impedance. 2 mg ml−1 GO decreased impedance | 168 | |
| GO | Methacryloyl-substituted tropoelastin | Muscle tissue engineering | 2 mg ml−1 | GO decreased impedance. rGO even more | 142 | |
| Au nanorods | GelMA gelatin methacrylate | Muscle tissue engineering | 1.5 mg ml−1 | Impedance decreased with increasing gold nanorod content | Gold nanorods aspect ratio 3.15 | 36 |
| PEDOT:PSS | PHEA poly(N-hydroxyethyl acrylamide) | Muscle tissue engineering | 0.3% w/v | Impedance decreased with increasing PEDOT:PSS content | 169 |
Some hydrogel studies incorporate conductive materials which are not strictly defined as nanomaterials, e.g. hydrogels with conductive oligomers. We provide a short table of such hydrogels as ESI† (Table S1). It contains hydrogels with the incorporation of aniline oligomers, hybrid hydrogels with polypyrrole polymer incorporation and metallic microwires.
The nanomaterial concentrations in hydrogels can be described in many ways: mg ml−1, % w/w, w/v, v/v on the total mass of the nanocomposite hydrogel or as a ratio over the polymer concentration, for example 5% CNT w/w of gelatin. Nanomaterial concentration expressed as a ratio over the total hydrogel mass or volume (water + polymer + nanomaterial) is more relevant for the electrical properties of the system (electrical percolation, for example, depends on the % v/v concentration) but does not remain stable over different conditions, since the water content of hydrogels may change due to evaporation or swelling. Nanomaterial concentration expressed as a ratio over the polymer concentration has the advantage of remaining stable on different conditions but is less relevant for the properties of the system as a whole. In the following tables, we have chosen to keep the nanomaterial concentration as reported by the original authors, due to a lack of sufficient data that would allow us to homogenize the concentrations (notably polymer concentrations and/or water content).
6.2 Processing methods to increase electrical conductivity
Small and Paunov elaborated an agarose – silver nanowire composite gel with anisotropic electrical conductivity.60 They dissolved 0.5% w/v agarose in hot water (70 °C) and added 0.5% w/v 50 nm long silver nanowires. An AC electric field of 50 to 300 V cm−1 and frequency of 5 kHz was applied to assemble and align the nanowires into percolating microwires in the direction of the applied field, while the temperature was kept at 55 °C. When the silver nanowires had aligned, the temperature was lowered to allow the agarose to form a gel, thus entrapping the nanowires. In a subsequent study by the same authors, the silver nanowires were functionalised with an antibody (thiolated biotin) and the electrically anisotropic hydrogel was used as a proof of concept for biosignal detection (Fig. 14(A)). An antigen (streptadivin) that binds on the antibody, induces tighter packing of the silver nanowires and limits their Brownian motion leading to an increased conductivity.60
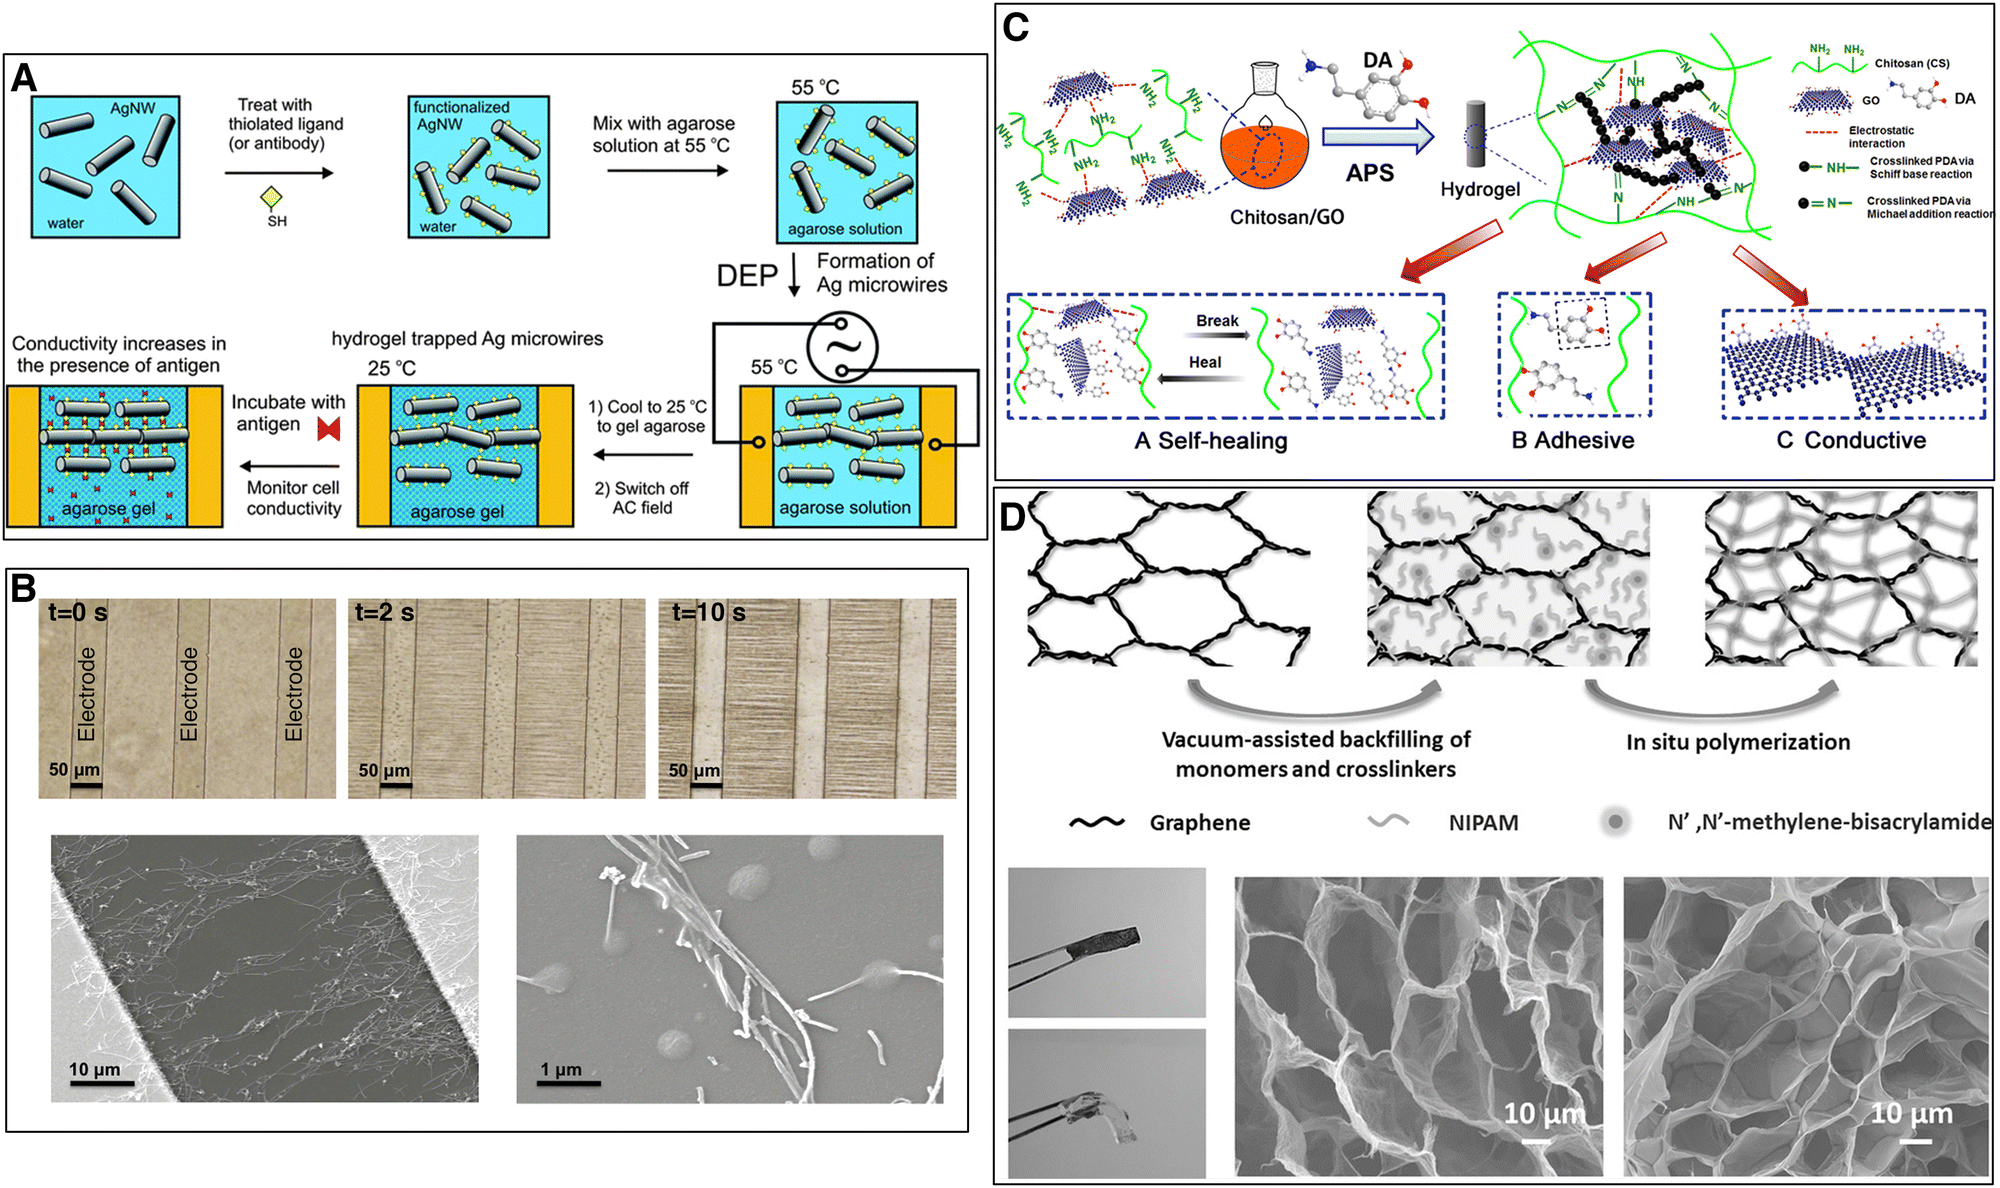 | ||
| Fig. 14 Processing methods to increase electrical conductivity of nanocomposite hydrogels. (A) Functionalized silver nanowires in warm water–agarose solution aligned through dielectrophoresis (DEP). After cooling down, agarose gelation occurs and a hydrogel with anisotropic electrical conductivity is formed. The conductivity increases in the presence of antigen due to the tighter packing of the functionalized silver nanowires. Reproduced from ref. 60 with permission from The Royal Society of Chemistry. (B) Nanocomposite hydrogel with chitosan, polydopamine and reduced GO. Self-healing mechanism attributable to the electrostatic interactions between GO and chitosan and the non-covalent bonding of catechol groups. Adhesiveness as a result of the catechol groups of polydopamine. Electrical conductivity through the reduced GO. Reprinted from ref. 119, Copyright 2016, with permission from Elsevier. Dielectrophoretic alignment of CNT between electrode bands. Phase images of CNT dielectrophoretic alignment over time. SEM images of dielectrophoretically aligned CNTs between two electrodes. Reprinted from ref. 167, Copyright 2017, with permission from Elsevier. (D) Graphene monolith – poly-N-isopropylacrylamide hydrogel. Photos of nanocomposite (dark and rigid) and pristine (transparent) hydrogel and SEM images of graphene monolith and freeze-dried nanocomposite hydrogel. Reprinted with permission from ref. 114. Copyright 2014 Wiley. | ||
Ramón-Azcón et al. prepared a gelatin methacrylate hydrogel with 0.3 mg ml−1 CNTs. An AC electric field of 20 Vpp and frequency of 2 MHz was applied to dielectrophoretically align the CNTs (Fig. 14(B)). The gelatin methacrylate was polymerised after aligning the CNTs, thus freezing their orientation.165 In further work, they showed how the nanocomposite hydrogel with aligned CNTs enhanced the cardiac differentiation of mouse embryoid bodies. An externally applied electric pulse stimulation (1 V, 10 ms, 1 Hz) significantly increased the beating frequency of embryoid bodies on the nanocomposite hydrogels with aligned CNTs, as compared to the pristine hydrogels or the nanocomposite hydrogels with randomly distributed CNTs.167
Polydopamine coating is inspired by adhesive proteins secreted by mussels to attach to wet surfaces. Dopamine is a simple structural mimic of Mytilus Edulis foot protein 5 (Mefp-5).177 In an alkaline solution, it self-polymerizes into a thin surface-adherent polydopamine film through oxidation by dissolved oxygen.147,178 Polydopamine adheres to a large number of varied surfaces through covalent (Michael reaction of catechol with an amine or thiol) and non-covalent (hydrogen bonds and π–π stacking) interactions.178 In nanocomposite hydrogels, polydopamine coating is used to facilitate nanomaterial dispersion and to confer self-healing and adhesive properties to the hydrogel.119,161
Han et al. exploited the surface properties of polydopamine to fabricate a conductive and adhesive nanocomposite hydrogel. They coated CNTs with polydopamine and noted that the coating facilitated the dispersion of CNTs in an aqueous suspension. Next, they dissolved aclrylamide and acrylic acid monomers in the suspension, before adding glycerol to form a glycerol–water binary solvent that allows the gel to be manipulated in a very wide range of temperatures (−20 °C to 60 °C). The glycerol–water gel was then formed in situ by UV-initiation of polyacrylamide/polyacrylic acid copolymerization. The gels with polydopamine coated CNTs showed a significant increase in electrical conductivity compared to gels without dopamine (from 5 to 8.2 S m−1 for hydrogels with 10% w/w of polymer CNTs). The resulting hydrogel can find applications in adhesive bioelectronics to detect biosignals.146
Jing et al. conceived a self-healing, adhesive and conductive nanocomposite hydrogel for cardiac tissue engineering. They used a chitosan polymer, reinforced with 0.5 mg ml−1 GO. Dopamine was added to cross-link the chitosan gel, partially reduce the graphene oxide (the oxidative polymerization of dopamine releases electrons) and facilitate its dispersion by coating it (Fig. 14(C)). The nanocomposite hydrogel showed a twofold increase in electrical conductivity (from 0.06 S m−1 to 0.12 S m−1 for chitosan-dopamine hydrogels) and enhanced the viability and proliferation of human stem cell-derived cardiomyocytes.119 Zhang et al. drew on the previous work and proposed a flexible, wearable sensor consisting of a poly(vinyl alcohol) hydrogel matrix embedded with GO. Dopamine was added to reduce and facilitate the dispersion of GO and the resulting hydrogel had a conductivity of 0.5 S m−1. Small-scale movements of the human body (from joint movements to breathing) applied strain to the hydrogel, changing its electrical conductivity.179
Other applications of mussel-inspired conductive hydrogels include a patch to repair myocardial infarction,88 wound dressing to promote the regeneration of infected skin,147,180 a self-rolling hydrogel film biosensor181 and an implantable biosensor for health monitoring.161
6.3 Comments and comparisons of electrical conductivities
Electrical conductivity of nanocomposite hydrogels varies by several orders of magnitude. The conductivity vs. nanomaterial concentration graph (Fig. 15) brings together the DC electrical conductivity values of nanocomposite hydrogels vs. nanomaterial concentration. It was compiled from the available literature data,44,72–74,87,88,91,109,111–115,119,144,146,147,151,152,155–160,164,183 when enough information was available. Some observations can be made from these graphs and Table 2.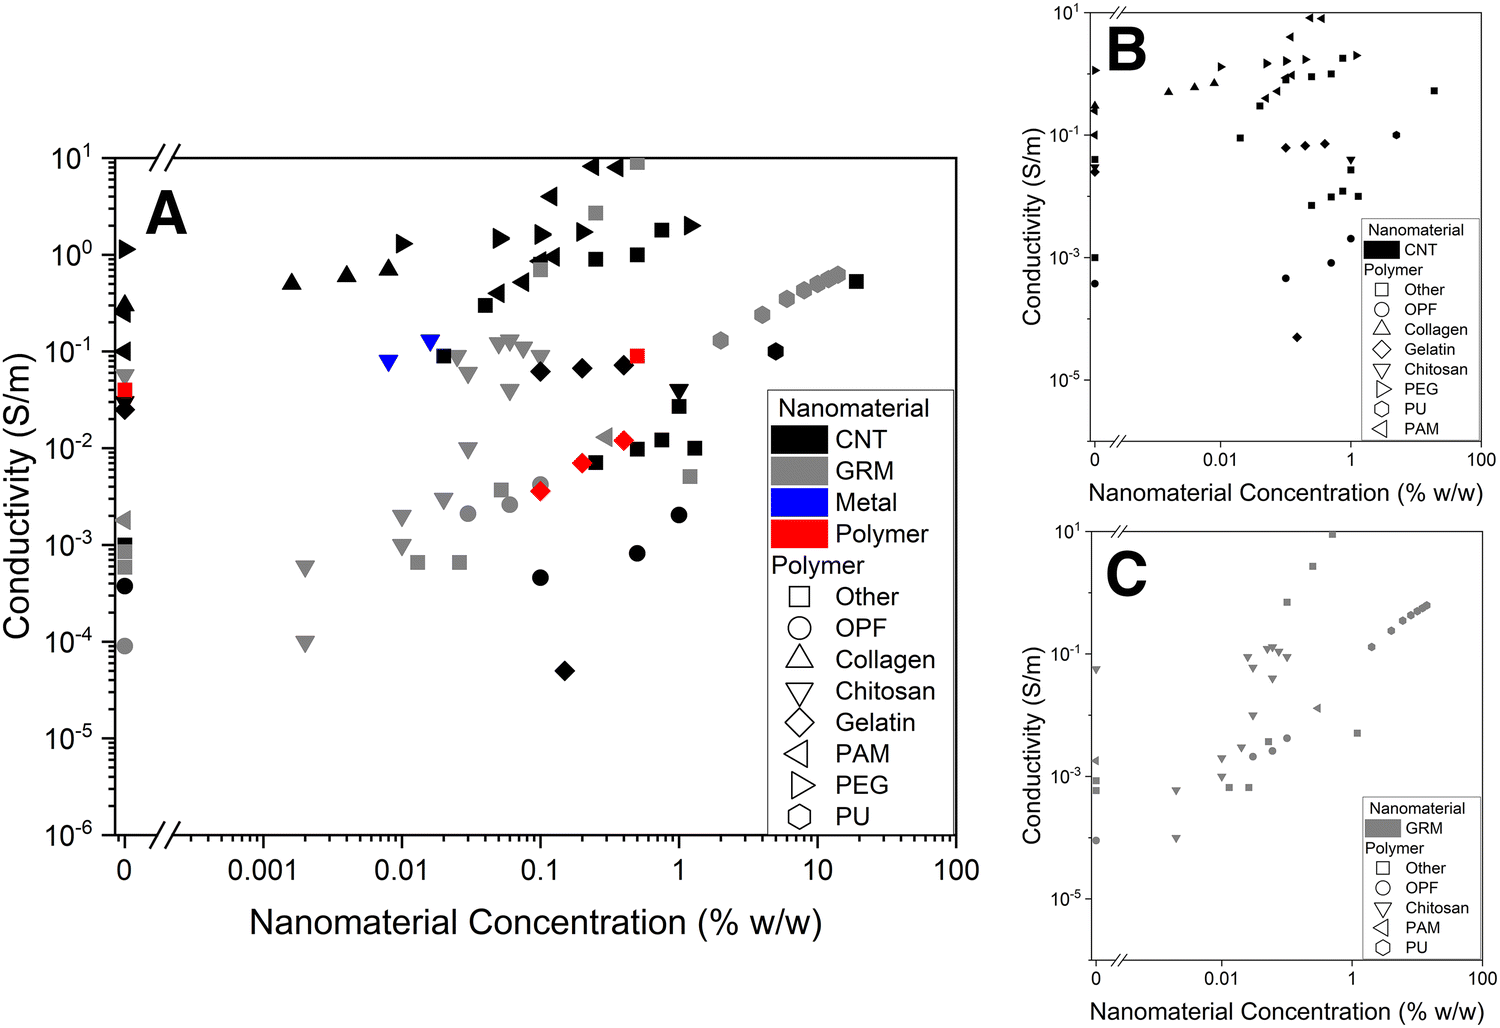 | ||
| Fig. 15 Nanocomposite hydrogel electrical conductivity vs. nanomaterial concentration. (A) All, (B) CNTs, (C) GRMs. A nanomaterial concentration of 0 represents the electrical conductivity of the pristine hydrogels (without conductive nanomaterials). OPF: oligo(poly(ethylene glycol) fumarate); PAM: polyacrylamide; PEG: polyethylene glycol; PU: polyurethane. Data extracted from ref. 44, 72–74, 87, 88, 91, 109, 111–115, 119, 144, 146, 147, 151, 152, 155–160, 164 and 183. | ||
Nanomaterial concentrations employed to increase the conductivity of hydrogels were mostly within the range of 0.01 to 1% w/w. Some higher concentrations seen in the graph represent studies where nanocomposite hydrogels were partially dried, thus importantly increasing nanomaterial concentration.
Nanocomposite hydrogels can be classified as semi-conductors with their electrical conductivity spanning 6 orders of magnitude, from 10−5 to 10 S m−1. The conductivities of hydrogels of different polymers, without nanomaterials, already show an important variability. We can distinguish two main groups. Firstly, the more insulating hydrogels, with conductivities of 10−6 up to 2 × 10⁻³ S m−1. These are hydrogels made from agarose, alginate, hyaluronan, poly(vinyl alcohol), oligo(poly(ethylene glycol) fumarate) and polyacrylic acid. A second group of hydrogels have higher conductivities, even without nanomaterials, with values ranging from 2 × 10⁻² up to 1.4 S m−1. They are made from polymers including chitosan, polyethylene glycol, collagen, gelatin and poly(ethyl acrylate). Some of these differences (though not all) can be explained on the basis of polymer material chemistry. Polymers with ionisable functional groups (like amines and carboxylic acids) will confer a higher ionic conductivity to the hydrogel and polymers with conjugated chains have free electrons that contribute to the electronic conductivity of the polymer. Different measuring methods and conditions also contribute to the observed variability. A third group, not presented here, concerns hydrogels of conducting polymers. Conducting polymers include PPy, PANI, polythiophene, aniline oligomers and PEDOT. The hydrogels formed from these polymers are conductive but are brittle, have poor mechanical properties and are not biodegradable.57
The majority of nanocomposite hydrogels use carbon-based nanoparticules. GRMs and CNTs combine superior mechanical strength and electrical conductivity with high aspect ratios, leading to low percolation thresholds. By plotting the conductivity vs. concentration of these two nanomaterials in separate graphs, a different story emerges. GRMs show a relatively linear relationship between concentration and conductivity, on a log–log graph (Fig. 15(C)). Higher concentrations lead to higher conductivities. In the case of CNTs, there is no dominant trend on the graph (Fig. 15(B)). This is accentuated by some hydrogels that have high conductivity even without nanomaterial percolation (collagen and polyethylene glycol) but even by removing them, the relationship between concentration and conductivity is less straightforward.
Our hypothesis is that CNT agglomeration partly explains this difference. CNTs are highly hydrophobic and tend to form agglomerates in aqueous suspensions. Hydrogels where the CNTs form bundles instead of uniformly dispersing in the hydrogel matrix do not form a percolation network, even in high concentrations. At the same time, CNTs have high aspect ratio (approximately 1000 or higher) and can, on the principle, form a percolating network even at low concentrations, if they are well dispersed. We maintain that, concerning the electrical conductivity of CNT-loaded hydrogels, dispersion is a parameter at least as important as concentration, if not more. In GRMs, hydrogels with rGO dominate the graph. GO is well dispersed in aqueous suspensions. The hydroxyl and carboxylic/carboxylate groups are hydrophilic, facilitating GO dispersion. GO has a much lower conductivity than graphene, but GO reduction can restore part of it. Better dispersions lead to a straightforward relationship between concentration and conductivity. We did not find in literature a sufficient number of hydrogels with polymer and metal nanomaterials to extend this reasoning.
7. Conclusion – perspectives
Nanocomposite hydrogels are complex, polyphasic materials, consisting of at least three components: water, a polymer matrix and the nanomaterials. In most cases additional components are also present: hybrid hydrogels with a second polymer, cross-linkers, dispersants and other impurities. All these components contribute to the electrical properties of the hydrogel through adding charge carriers (ions and electrons) and restricting or facilitating their mobility.Moreover, nanocomposite hydrogels are dynamic systems. In aqueous environments they reach a dynamic equilibrium and their mass remains constant. When removed from an aqueous environment, and if the atmosphere is not saturated with water vapours, hydrogels lose over time a part of their water content. The kinetics of drying depend on the nature of the polymer, the nanomaterials and the environmental conditions (temperature, humidity), but can be quite rapid for most hydrogels even in ambient conditions. Electrical characterization equipment is mostly adapted to either solid materials or liquids. Hydrogels are viscoelastic materials with a high water content, falling between these two categories. The water loss affects electrical conductivity in a number of ways. Water loss changes the organisation of the hydrogel, densifying the polymer matrix. This directly reduces ion mobility, decreasing ionic conductivity. At the same time, the concentration of all components increases, due to the water loss. The nanomaterial configuration changes and can lead to a more connected network, increasing electronic conductivity. An example of this complexity is that despite all the efforts that have been undertaken, the percolation studies for nanocomposite hydrogels fail to reproduce the clear cut-off values found in studies of solid nanocomposite materials.
Hydrogels find numerous applications in biomedicine thanks to their biocompatibility, high water content and resemblance to native tissues. Materials scientists have been working on tailoring their properties, such as mechanical strength, water absorption capacity, porosity, adhesiveness and self-healability to custom fit specific applications. In parallel, hydrogels can be made stimuli-responsive, reacting to environmental cues like temperature, pH, antigen presence, electromagnetic fields, and more. The incorporation of conductive nanomaterials can confer electrical conductivity to—otherwise insulating—hydrogels, expanding their field of application. These nanocomposite conductive hydrogels are widely used in tissue engineering, strain sensors and drug delivery where their electrical properties play a crucial role. Their applications will continue to expand as we further understand the link between the materials, the processing methods and their electrical properties.
Abbreviations
| CNT | Carbon nanotubes |
| SWNT | Single-wall carbon nanotubes |
| MWNT | Multi-wall carbon nanotubes |
| GRM | Graphene-related materials |
| GO | Graphene oxide |
| rGO | Reduced graphene oxide |
| PPy | Polypyrrole |
| PANI | Polyaniline |
| PEDOT | Poly-(3,4-ethylenedioxythiophene) |
| PSS | Poly(sodium-4-styrenesulfonate) |
Author contributions
G. Kougkolos: writing – original draft; M. Golzio: writing – review & editing; L. Laudebat: writing – review & editing, supervision; Z. Valdez-Nava: writing – review & editing, supervision; E. Flahaut: writing – review & editing, supervision, funding acquisition.Conflicts of interest
There are no conflicts to declare.Acknowledgements
The current work is funded by the French national research agency under the project CARBO2DERM –Carbon nanotubes for the transdermal delivery of therapeutic molecules (grant ANR-19-CE09-0007).References
- M. J. Lewis, in Physical Properties of Foods and Food Processing Systems, ed. M. J. Lewis, Woodhead Publishing, 1996, pp. 137–166 Search PubMed.
- Y. S. Zhang and A. Khademhosseini, Science, 2017, 356(6337), 1–10 CrossRef PubMed.
- K. Varaprasad, G. M. Raghavendra, T. Jayaramudu, M. M. Yallapu and R. Sadiku, Mater. Sci. Eng., C, 2017, 79, 958–971 CrossRef CAS PubMed.
- F. Ullah, M. B. H. Othman, F. Javed, Z. Ahmad and H. Md. Akil, Mater. Sci. Eng., C, 2015, 57, 414–433 CrossRef CAS PubMed.
- N. A. Peppas and A. S. Hoffman, in Biomaterials Science, ed. W. R. Wagner, S. E. Sakiyama-Elbert, G. Zhang and M. J. Yaszemski, Academic Press, 4th edn, 2020, pp. 153–166 Search PubMed.
- W. Wagermaier and P. Fratzl, in Polymer Science: A Comprehensive Reference, ed. K. Matyjaszewski and M. Möller, Elsevier, Amsterdam, 2012, pp. 35–55 Search PubMed.
- E. M. Ahmed, J. Adv. Res., 2015, 6, 105–121 CrossRef CAS PubMed.
- J. P. Gong, Soft Matter, 2006, 2, 544–552 RSC.
- H. Li, Y. S. Choi, M. W. Rutland and R. Atkin, J. Colloid Interface Sci., 2020, 563, 347–353 CrossRef CAS PubMed.
- A. S. Hoffman, Adv. Drug Delivery Rev., 2012, 64, 18–23 CrossRef.
- A. Dodero, L. Pianella, S. Vicini, M. Alloisio, M. Ottonelli and M. Castellano, Eur. Polym. J., 2019, 118, 586–594 CrossRef CAS.
- S. J. Buwalda, K. W. M. Boere, P. J. Dijkstra, J. Feijen, T. Vermonden and W. E. Hennink, J. Controlled Release, 2014, 190, 254–273 CrossRef CAS PubMed.
- D. Zhang, B. Ren, Y. Zhang, L. Xu, Q. Huang, Y. He, X. Li, J. Wu, J. Yang, Q. Chen, Y. Chang and J. Zheng, J. Mater. Chem. B, 2020, 8, 3171–3191 RSC.
- G. Isapour and M. Lattuada, Adv. Mater., 2018, 30, 1707069 CrossRef PubMed.
- I. Tokarev, V. Gopishetty, J. Zhou, M. Pita, M. Motornov, E. Katz and S. Minko, ACS Appl. Mater. Interfaces, 2009, 1, 532–536 CrossRef CAS PubMed.
- T. Distler and A. R. Boccaccini, Acta Biomater., 2020, 101, 1–13 CrossRef CAS PubMed.
- N. Chirani, L. Yahia, L. Gritsch, F. L. Motta, S. Chirani and S. Faré, J. Biomed. Sci., 2016, 4(2.13), 1–23 Search PubMed.
- B. W. Walker, R. P. Lara, E. Mogadam, C. H. Yu, W. Kimball and N. Annabi, Prog. Polym. Sci., 2019, 92, 135–157 CrossRef CAS PubMed.
- J. Stejskal, Chem. Pap., 2017, 71, 269–291 CrossRef CAS.
- K. Liu, S. Wei, L. Song, H. Liu and T. Wang, J. Agric. Food Chem., 2020, 68, 7269–7280 CrossRef CAS PubMed.
- A. Malti, J. Edberg, H. Granberg, Z. U. Khan, J. W. Andreasen, X. Liu, D. Zhao, H. Zhang, Y. Yao, J. W. Brill, I. Engquist, M. Fahlman, L. Wågberg, X. Crispin and M. Berggren, Adv. Sci., 2016, 3, 1500305 CrossRef PubMed.
- B. Guo and P. X. Ma, Biomacromolecules, 2018, 19, 1764–1782 CrossRef CAS PubMed.
- Q. Peng, J. Chen, T. Wang, X. Peng, J. Liu, X. Wang, J. Wang and H. Zeng, InfoMat, 2020, 2, 843–865 CrossRef CAS.
- D. Liang, G. Zhou, Y. Hu, C. Zhao and C. Chen, J. Mater. Sci., 2021, 56, 14531–14541 CrossRef CAS.
- X. Zhang, Y. Tang, P. Wang, Y. Wang, T. Wu, T. Li, S. Huang, J. Zhang, H. Wang, S. Ma, L. Wang and W. Xu, New J. Chem., 2022, 46, 13838–13855 RSC.
- C.-J. Lee, H. Wu, Y. Hu, M. Young, H. Wang, D. Lynch, F. Xu, H. Cong and G. Cheng, ACS Appl. Mater. Interfaces, 2018, 10, 5845–5852 CrossRef CAS PubMed.
- M. Hess, R. G. Jones, J. Kahovec, T. Kitayama, P. Kratochvíl, P. Kubisa, W. Mormann, R. F. T. Stepto, D. Tabak, J. Vohlídal and E. S. Wilks, Pure Appl. Chem., 2006, 78, 2067–2074 CAS.
- J. Cardoso, A. Huanosta and O. Manero, Macromolecules, 1991, 24, 2890–2895 CrossRef CAS.
- C.-G. Wang, N. E. B. Surat’man, J. J. Chang, Z. L. Ong, B. Li, X. Fan, X. J. Loh and Z. Li, Chem. – Asian J., 2022, 17, e202200604 CAS.
- S. Liu, J. Tang, F. Ji, W. Lin and S. Chen, Gels, 2022, 8, 46 CrossRef CAS PubMed.
- A. Khademhosseini and R. Langer, Nat. Protoc., 2016, 11, 1775–1781 CrossRef CAS PubMed.
- J. A. Hunt, R. Chen, T. van Veen and N. Bryan, J. Mater. Chem. B, 2014, 2, 5319–5338 RSC.
- Y. Luo, in Principles of Tissue Engineering, ed. R. Lanza, R. Langer, J. P. Vacanti and A. Atala, Academic Press, 5th edn, 2020, pp. 343–360 Search PubMed.
- M. Petreaca and M. Martins-Green, in Principles of Tissue Engineering, ed. R. Lanza, R. Langer, J. P. Vacanti and A. Atala, Academic Press, 5th edn, 2020, pp.93–117 Search PubMed.
- R. Dong, P. X. Ma and B. Guo, Biomaterials, 2020, 229, 119584 CrossRef CAS PubMed.
- A. Navaei, H. Saini, W. Christenson, R. T. Sullivan, R. Ros and M. Nikkhah, Acta Biomater., 2016, 41, 133–146 CrossRef CAS PubMed.
- Y. Li, L. Wei, L. Lan, Y. Gao, Q. Zhang, H. Dawit, J. Mao, L. Guo, L. Shen and L. Wang, Acta Biomater., 2022, 139, 157–178 CrossRef CAS PubMed.
- P. Zarrintaj, A. M. Urbanska, S. S. Gholizadeh, V. Goodarzi, M. R. Saeb and M. Mozafari, J. Colloid Interface Sci., 2018, 516, 57–66 CrossRef CAS PubMed.
- X. Liu, A. L. M. Ii, S. Park, B. E. Waletzki, A. Terzic, M. J. Yaszemski and L. Lu, J. Mater. Chem. B, 2016, 4, 6930–6941 RSC.
- R. Eivazzadeh-Keihan, A. Maleki, M. de la Guardia, M. S. Bani, K. K. Chenab, P. Pashazadeh-Panahi, B. Baradaran, A. Mokhtarzadeh and M. R. Hamblin, J. Adv. Res., 2019, 18, 185–201 CrossRef CAS PubMed.
- J. Pelto, M. Björninen, A. Pälli, E. Talvitie, J. Hyttinen, B. Mannerström, R. Suuronen Seppanen, M. Kellomäki, S. Miettinen and S. Haimi, Tissue Eng., Part A, 2012, 19, 882–892 CrossRef PubMed.
- L. Tang, S. Wu, J. Qu, L. Gong and J. Tang, Materials, 2020, 13, 3947 CrossRef CAS PubMed.
- Z. Chen, Y. Chen, M. S. Hedenqvist, C. Chen, C. Cai, H. Li, H. Liu and J. Fu, J. Mater. Chem. B, 2021, 9, 2561–2583 RSC.
- S. Xia, S. Song, F. Jia and G. Gao, J. Mater. Chem. B, 2019, 7, 4638–4648 RSC.
- M. Liao, P. Wan, J. Wen, M. Gong, X. Wu, Y. Wang, R. Shi and L. Zhang, Adv. Funct. Mater., 2017, 27, 1703852 CrossRef.
- P. He, J. Wu, X. Pan, L. Chen, K. Liu, H. Gao, H. Wu, S. Cao, L. Huang and Y. Ni, J. Mater. Chem. A, 2020, 8, 3109–3118 RSC.
- H. Yuk, B. Lu and X. Zhao, Chem. Soc. Rev., 2019, 48, 1642–1667 RSC.
- J. Li and D. J. Mooney, Nat. Rev. Mater., 2016, 1, 1–17 Search PubMed.
- H.-W. Liu, S.-H. Hu, Y.-W. Chen and S.-Y. Chen, J. Mater. Chem., 2012, 22, 17311–17320 RSC.
- K. Elkhoury, P. Koçak, A. Kang, E. Arab-Tehrany, J. Ellis Ward and S. R. Shin, Pharmaceutics, 2020, 12, 849 CrossRef CAS PubMed.
- S. Merino, C. Martín, K. Kostarelos, M. Prato and E. Vázquez, ACS Nano, 2015, 9, 4686–4697 CrossRef CAS PubMed.
- S. Murdan, J. Controlled Release, 2003, 92, 1–17 CrossRef CAS PubMed.
- A. Servant, V. Leon, D. Jasim, L. Methven, P. Limousin, E. V. Fernandez-Pacheco, M. Prato and K. Kostarelos, Adv. Healthcare Mater., 2014, 3, 1334–1343 CrossRef CAS PubMed.
- J. H. Lee, Y. C. Yoon, H. S. Kim, J. Lee, E. Kim, C. Findeklee and U. Katscher, Sci. Rep., 2022, 12, 73 CrossRef CAS PubMed.
- F. A. Duck, in Physical Properties of Tissues, ed. F. A. Duck, Academic Press, London, 1990, pp. 167–223 Search PubMed.
- T. W. Balmer, S. Vesztergom, P. Broekmann, A. Stahel and P. Büchler, Sci. Rep., 2018, 8, 8601 CrossRef PubMed.
- A. Saberi, F. Jabbari, P. Zarrintaj, M. R. Saeb and M. Mozafari, Biomolecules, 2019, 9, 448 CrossRef CAS PubMed.
- M. Rouabhia, H. Park, S. Meng, H. Derbali and Z. Zhang, PLoS One, 2013, 8, e71660 CrossRef CAS PubMed.
- S. Du, N. Zhou, Y. Gao, G. Xie, H. Du, H. Jiang, L. Zhang, J. Tao and J. Zhu, Nano Res., 2020, 13, 2525–2533 CrossRef CAS.
- W. R. Small and V. N. Paunov, J. Mater. Chem. B, 2013, 1, 5798–5805 RSC.
- J.-F. Guillet, E. Flahaut and M. Golzio, ChemPhysChem, 2017, 18, 2715–2723 CrossRef CAS PubMed.
- J. Simon, B. Jouanmiqueou, M.-P. Rols, E. Flahaut and M. Golzio, Pharmaceutics, 2021, 13, 1805 CrossRef CAS PubMed.
- G. Kougkolos, presented in part at SEEDS/JCGE22, Le Croisic, France, June 2022.
- ISO/TR 18401:2017(en), Nanotechnologies—Plain language explanation of selected terms from the ISO/IEC 80004 series, https://www.iso.org/obp/ui/#iso:std:iso:tr:18401:ed-1:v1:en, (accessed 4 July 2022).
- K. Zhou, Carbon Nanomaterials: Modeling, Design, and Applications, CRC Press, 2019 Search PubMed.
- M. Monthioux, P. Serp, E. Flahaut, M. Razafinimanana, C. Laurent, A. Peigney, W. Bacsa and J.-M. Broto, in Springer Handbook of Nanotechnology, ed. B. Bhushan, Springer, Berlin, Heidelberg, 2010, pp. 47–118 Search PubMed.
- M. F. L. D. Volder, S. H. Tawfick, R. H. Baughman and A. J. Hart, Science, 2013, 339, 535–539 CrossRef PubMed.
- J. Simon, E. Flahaut and M. Golzio, Materials, 2019, 12, 624 CrossRef CAS PubMed.
- C.-W. Nan, Y. Shen and J. Ma, Annu. Rev. Mater. Res., 2010, 40, 131–151 CrossRef CAS.
- T. W. Ebbesen, H. J. Lezec, H. Hiura, J. W. Bennett, H. F. Ghaemi and T. Thio, Nature, 1996, 382, 54–56 CrossRef CAS.
- F. Xie, P. Weiss, O. Chauvet, J. Le Bideau and J. F. Tassin, J. Mater. Sci. Mater. Med., 2010, 21, 1163–1168 CrossRef CAS PubMed.
- X. Liu, J. C. Kim, A. Lee Miller, B. E. Waletzki and L. Lu, New J. Chem., 2018, 42, 17671–17681 RSC.
- J. Zhou, J. Chen, H. Sun, X. Qiu, Y. Mou, Z. Liu, Y. Zhao, X. Li, Y. Han, C. Duan, R. Tang, C. Wang, W. Zhong, J. Liu, Y. Luo, M. (Mengqiu) Xing and C. Wang, Sci. Rep., 2014, 4, 3733 CrossRef PubMed.
- U. G. Spizzirri, S. Hampel, G. Cirillo, F. P. Nicoletta, A. Hassan, O. Vittorio, N. Picci and F. Iemma, Int. J. Pharm., 2013, 448, 115–122 CrossRef CAS PubMed.
- X. Du, I. Skachko, A. Barker and E. Y. Andrei, Nat. Nanotechnol., 2008, 3, 491–495 CrossRef CAS PubMed.
- P. Wick, A. E. Louw-Gaume, M. Kucki, H. F. Krug, K. Kostarelos, B. Fadeel, K. A. Dawson, A. Salvati, E. Vázquez, L. Ballerini, M. Tretiach, F. Benfenati, E. Flahaut, L. Gauthier, M. Prato and A. Bianco, Angew. Chem., Int. Ed., 2014, 53, 7714–7718 CrossRef CAS PubMed.
- J. Chen, B. Yao, C. Li and G. Shi, Carbon, 2013, 64, 225–229 CrossRef CAS.
- A. J. Marsden, D. G. Papageorgiou, C. Vallés, A. Liscio, V. Palermo, M. A. Bissett, R. J. Young and I. A. Kinloch, 2D Mater., 2018, 5, 032003 CrossRef.
- M. Wang, Y. Chen, R. Khan, H. Liu, C. Chen, T. Chen, R. Zhang and H. Li, Colloids Surf., A, 2019, 567, 139–149 CrossRef CAS.
- A. Alam, Q. Meng, G. Shi, S. Arabi, J. Ma, N. Zhao and H.-C. Kuan, Compos. Sci. Technol., 2016, 127, 119–126 CrossRef CAS.
- W. Humphrey, A. Dalke and K. Schulten, J. Mol. Graphics, 1996, 14, 33–38 CrossRef CAS PubMed.
- K. Momma and F. Izumi, J. Appl. Crystallogr., 2011, 44, 1272–1276 CrossRef CAS.
- R. Ravichandran, S. Sundarrajan, J. R. Venugopal, S. Mukherjee and S. Ramakrishna, J. R. Soc., Interface, 2010, 7, S559–S579 CrossRef CAS PubMed.
- J. Pecher and S. Mecking, Chem. Rev., 2010, 110, 6260–6279 CrossRef CAS PubMed.
- J. H. Min, M. Patel and W.-G. Koh, Polymers, 2018, 10, 1078 CrossRef PubMed.
- Y. Bu, H.-X. Xu, X. Li, W.-J. Xu, Y. Yin, H. Dai, X. Wang, Z.-J. Huang and P.-H. Xu, RSC Adv., 2018, 8, 10806–10817 RSC.
- Y. Li, X. Xiong, X. Yu, X. Sun, J. Yang, L. Zhu, G. Qin, Y. Dai and Q. Chen, Polym. Test., 2019, 75, 38–47 CrossRef CAS.
- L. Wang, J. Jiang, W. Hua, A. Darabi, X. Song, C. Song, W. Zhong, M. M. Q. Xing and X. Qiu, Adv. Funct. Mater., 2016, 26, 4293–4305 CrossRef CAS.
- P. Zhang, I. Wyman, J. Hu, S. Lin, Z. Zhong, Y. Tu, Z. Huang and Y. Wei, Mater. Sci. Eng., B, 2017, 223, 1–23 CrossRef CAS.
- T. Bruna, F. Maldonado-Bravo, P. Jara and N. Caro, Int. J. Mol. Sci., 2021, 22, 7202 CrossRef CAS PubMed.
- P. Baei, S. Jalili-Firoozinezhad, S. Rajabi-Zeleti, M. Tafazzoli-Shadpour, H. Baharvand and N. Aghdami, Mater. Sci. Eng., C, 2016, 63, 131–141 CrossRef CAS PubMed.
- M. Naguib, V. N. Mochalin, M. W. Barsoum and Y. Gogotsi, Adv. Mater., 2014, 26, 992–1005 CrossRef CAS PubMed.
- J.-C. Lei, X. Zhang and Z. Zhou, Front. Phys., 2015, 10, 276–286 CrossRef.
- Y.-Z. Zhang, J. K. El-Demellawi, Q. Jiang, G. Ge, H. Liang, K. Lee, X. Dong and H. N. Alshareef, Chem. Soc. Rev., 2020, 49, 7229–7251 RSC.
- A. S. Zeraati, S. A. Mirkhani, P. Sun, M. Naguib, P. V. Braun and U. Sundararaj, Nanoscale, 2021, 13, 3572–3580 RSC.
- Y. Zhang, M. Gong and P. Wan, Matter, 2021, 4, 2655–2658 CrossRef CAS.
- A. Bhat, S. Anwer, K. S. Bhat, M. I. H. Mohideen, K. Liao and A. Qurashi, npj 2D Mater. Appl., 2021, 5, 1–21 CrossRef.
- A. Aharony and D. Stauffer, Introduction To Percolation Theory: Second Edition, Taylor & Francis, 2018 Search PubMed.
- J. W. Essam, Rep. Prog. Phys., 1980, 43, 833 CrossRef CAS.
- W. Bauhofer and J. Z. Kovacs, Compos. Sci. Technol., 2009, 69, 1486–1498 CrossRef CAS.
- L. Berhan and A. M. Sastry, Phys. Rev. E: Stat., Nonlinear, Soft Matter Phys., 2007, 75, 041120 CrossRef CAS PubMed.
- J. R. Winkler and H. B. Gray, J. Am. Chem. Soc., 2014, 136, 2930–2939 CrossRef CAS PubMed.
- A. P. Chatterjee, J. Phys.: Condens. Matter, 2015, 27, 315303 CrossRef PubMed.
- A. P. Chatterjee, J. Chem. Phys., 2013, 139, 224904 CrossRef PubMed.
- G. Ambrosetti, C. Grimaldi, I. Balberg, T. Maeder, A. Danani and P. Ryser, Phys. Rev. B: Condens. Matter Mater. Phys., 2010, 81, 155434 CrossRef.
- V. Ambegaokar, B. I. Halperin and J. S. Langer, Phys. Rev. B: Solid State, 1971, 4, 2612–2620 CrossRef.
- L. Berhan and A. M. Sastry, Phys. Rev. E: Stat., Nonlinear, Soft Matter Phys., 2007, 75, 041121 CrossRef CAS PubMed.
- H.-B. Zhang, W.-G. Zheng, Q. Yan, Y. Yang, J.-W. Wang, Z.-H. Lu, G.-Y. Ji and Z.-Z. Yu, Polymer, 2010, 51, 1191–1196 CrossRef CAS.
- C. John Ferris and M. in het Panhuis, Soft Matter, 2009, 5, 3430–3437 RSC.
- L. Mottet, D. L. Cornec, J.-M. Noël, F. Kanoufi, B. Delord, P. Poulin, J. Bibette and N. Bremond, Soft Matter, 2018, 14, 1434–1441 RSC.
- Z. Cui, M. Zhou, P. J. Greensmith, W. Wang, J. A. Hoyland, I. A. Kinloch, T. Freemont and B. R. Saunders, Soft Matter, 2016, 12, 4142–4153 RSC.
- J.-F. Guillet, Z. Valdez-Nava, M. Golzio and E. Flahaut, Carbon, 2019, 146, 542–548 CrossRef CAS.
- R. A. MacDonald, C. M. Voge, M. Kariolis and J. P. Stegemann, Acta Biomater., 2008, 4, 1583–1592 CrossRef CAS PubMed.
- L. Qiu, D. Liu, Y. Wang, C. Cheng, K. Zhou, J. Ding, V.-T. Truong and D. Li, Adv. Mater., 2014, 26, 3333–3337 CrossRef CAS PubMed.
- S. Sayyar, E. Murray, B. C. Thompson, J. Chung, D. L. Officer, S. Gambhir, G. M. Spinks and G. G. Wallace, J. Mater. Chem. B, 2014, 3, 481–490 RSC.
- T. Chen, K. Hou, Q. Ren, G. Chen, P. Wei and M. Zhu, Macromol. Rapid Commun., 2018, 39, 1800337 CrossRef PubMed.
- P. Thoniyot, M. J. Tan, A. A. Karim, D. J. Young and X. J. Loh, Adv. Sci., 2015, 2, 1400010 CrossRef PubMed.
- A. Hajian, S. B. Lindström, T. Pettersson, M. M. Hamedi and L. Wågberg, Nano Lett., 2017, 17, 1439–1447 CrossRef CAS PubMed.
- X. Jing, H.-Y. Mi, B. N. Napiwocki, X.-F. Peng and L.-S. Turng, Carbon, 2017, 125, 557–570 CrossRef CAS.
- B. Lu, H. Yuk, S. Lin, N. Jian, K. Qu, J. Xu and X. Zhao, Nat. Commun., 2019, 10, 1043 CrossRef PubMed.
- J. Alam, L. A. Dass, M. S. Alhoshan, M. Ghasemi and A. W. Mohammad, Appl. Water Sci., 2012, 2, 37–46 CrossRef CAS.
- S. Hosseinzadeh, S. M. Rezayat, E. Vashegani-Farahani, M. Mahmoudifard, S. Zamanlui and M. Soleimani, Polymer, 2016, 97, 205–216 CrossRef CAS.
- A. Kisiel, D. Korol, A. Michalska and K. Maksymiuk, Electrochim. Acta, 2021, 390, 138787 CrossRef CAS.
- M. Pishvaei, F. Najafi and M. Salami-Kalajahi, J. Color Sci. Technol., 2016, 10, 145–154 Search PubMed.
- C. Kittel, Introduction to Solid State Physics, Wiley, 8th edn, 2005 Search PubMed.
- F.-C. Chiu, Adv. Mater. Sci. Eng., 2014, 204, e578168 Search PubMed.
- S. M. Sze and K. K. Ng, Physics of Semiconductor Devices, Wiley, 3rd edn, 2006 Search PubMed.
- H. L. Tuller and P. K. Moon, Mater. Sci. Eng., B, 1988, 1, 171–191 CrossRef.
- C. Lin and I. Gitsov, Macromolecules, 2010, 43, 3256–3267 CrossRef CAS.
- V. M. Gun’ko, I. N. Savina and S. V. Mikhalovsky, Gels, 2017, 3, 37 CrossRef PubMed.
- T. Hatakeyama and F. X. Quinn,Thermal analysis: fundamentals and applications to polymer science, Wiley, Chichester, New York, 2nd edn, 1999 Search PubMed.
- A. R. Khare and N. A. Peppas, Polymer, 1993, 34, 4736–4739 CrossRef CAS.
- H. B. Lee, M. S. Jhon and J. D. Andrade, J. Colloid Interface Sci., 1975, 51, 225–231 CrossRef CAS.
- J. R. Macdonald and W. B. Johnson, Impedance Spectroscopy, John Wiley & Sons, Ltd, 2018, pp. 1–20 Search PubMed.
- N. Bonanos, B. C. H. Steele, E. P. Butler, J. R. Macdonald, W. B. Johnson, W. L. Worrell, G. A. Niklasson, S. Malmgren, M. Strømme, S. K. Sundaram, M. C. H. McKubre, D. D. Macdonald, G. R. Engelhardt, E. Barsoukov, B. E. Conway, W. G. Pell, N. Wagner, C. M. Roland and R. S. Eisenberg, Impedance Spectroscopy, John Wiley & Sons, Ltd, 2018, pp. 175–478 Search PubMed.
- P. Pissis and A. Kyritsis, Solid State Ionics, 1997, 97, 105–113 CrossRef CAS.
- H. Warren, R. D. Gately, P. O’Brien, R. Gorkin and M. in het Panhuis, J. Polym. Sci., Part B: Polym. Phys., 2014, 52, 864–871 CrossRef CAS.
- C. Dispenza, C. L. Presti, C. Belfiore, G. Spadaro and S. Piazza, Polymer, 2006, 47, 961–971 CrossRef CAS.
- A. N. Koppes, K. W. Keating, A. L. McGregor, R. A. Koppes, K. R. Kearns, A. M. Ziemba, C. A. McKay, J. M. Zuidema, C. J. Rivet, R. J. Gilbert and D. M. Thompson, Acta Biomater., 2016, 39, 34–43 CrossRef CAS PubMed.
- E. H. Hall, Am. J. Math., 1879, 2, 287–292 CrossRef.
- G. Benstetter, A. Hofer, D. Liu, W. Frammelsberger and M. Lanza, Conductive Atomic Force Microscopy, John Wiley & Sons, Ltd, 2017, pp. 45–77 Search PubMed.
- N. Annabi, S. R. Shin, A. Tamayol, M. Miscuglio, M. A. Bakooshli, A. Assmann, P. Mostafalu, J.-Y. Sun, S. Mithieux, L. Cheung, X. (Shirley) Tang, A. S. Weiss and A. Khademhosseini, Adv. Mater., 2016, 28, 40–49 CrossRef CAS PubMed.
- W. Yang, B. Shao, T. Liu, Y. Zhang, R. Huang, F. Chen and Q. Fu, ACS Appl. Mater. Interfaces, 2018, 10, 8245–8257 CrossRef CAS PubMed.
- X. Xiao, G. Wu, H. Zhou, K. Qian and J. Hu, Polymers, 2017, 9, 259 CrossRef PubMed.
- Q. Han, A. Wang, W. Song, M. Zhang, S. Wang, P. Ren, L. Hao, J. Yin and S. Bai, ACS Appl. Bio Mater., 2021, 4(8), 6148–6156 CrossRef CAS PubMed.
- L. Han, K. Liu, M. Wang, K. Wang, L. Fang, H. Chen, J. Zhou and X. Lu, Adv. Funct. Mater., 2018, 28, 1704195 CrossRef.
- Y. Liang, X. Zhao, T. Hu, Y. Han and B. Guo, J. Colloid Interface Sci., 2019, 556, 514–528 CrossRef CAS PubMed.
- H. Sun, J. Zhou, Z. Huang, L. Qu, N. Lin, C. Liang, R. Dai, L. Tang and F. Tian, Int. J. Nanomed., 2017, 12, 3109–3120 CrossRef CAS PubMed.
- Z. Liu, M. Yushan, Y. Alike, Y. Liu, S. Wu, C. Ma and A. Yusufu, BioMed Res. Int., 2020, 2020, e4794982 Search PubMed.
- Z. Deng, T. Hu, Q. Lei, J. He, P. X. Ma and B. Guo, ACS Appl. Mater. Interfaces, 2019, 11, 6796–6808 CrossRef CAS PubMed.
- M. Imaninezhad, K. Pemberton, F. Xu, K. Kalinowski, R. Bera and S. P. Zustiak, J. Neural Eng., 2018, 15, 056034 CrossRef PubMed.
- K. Shah, D. Vasileva, A. Karadaghy and S. P. Zustiak, J. Mater. Chem. B, 2015, 3, 7950–7962 RSC.
- M. Mihajlovic, M. Mihajlovic, P. Y. W. Dankers, R. Masereeuw and R. P. Sijbesma, Macromol. Biosci., 2019, 19, 1800173 CrossRef PubMed.
- P. Dutta, N. N. Dass and N. S. Sarma, React. Funct. Polym., 2015, 90, 25–35 CrossRef CAS.
- A. M. Martins, G. Eng, S. G. Caridade, J. F. Mano, R. L. Reis and G. Vunjak-Novakovic, Biomacromolecules, 2014, 15, 635–643 CrossRef CAS PubMed.
- M. Jafarkhani, Z. Salehi and T. Nematian, Mater. Today Proc., 2018, 5, 15620–15628 CrossRef CAS.
- M. Javadi, Q. Gu, S. Naficy, S. Farajikhah, J. M. Crook, G. G. Wallace, S. Beirne and S. E. Moulton, Macromol. Biosci., 2018, 18, 1700270 CrossRef PubMed.
- J. Zhou, X. Yang, W. Liu, C. Wang, Y. Shen, F. Zhang, H. Zhu, H. Sun, J. Chen, J. Lam, A. G. Mikos and C. Wang, Theranostics, 2018, 8, 3317–3330 CrossRef CAS PubMed.
- R. Peng, Y. Yu, S. Chen, Y. Yang and Y. Tang, RSC Adv., 2014, 4, 35149–35155 RSC.
- H. Jo, M. Sim, S. Kim, S. Yang, Y. Yoo, J.-H. Park, T. H. Yoon, M.-G. Kim and J. Y. Lee, Acta Biomater., 2017, 48, 100–109 CrossRef CAS PubMed.
- L. Han, X. Lu, M. Wang, D. Gan, W. Deng, K. Wang, L. Fang, K. Liu, C. W. Chan, Y. Tang, L.-T. Weng and H. Yuan, Small, 2017, 13, 1601916 CrossRef PubMed.
- S. Das, F. Irin, L. Ma, S. K. Bhattacharia, R. C. Hedden and M. J. Green, ACS Appl. Mater. Interfaces, 2013, 5, 8633–8640 CrossRef CAS PubMed.
- Q. Han, Y. Chen, W. Song, M. Zhang, S. Wang, P. Ren, L. Hao, A. Wang, S. Bai and J. Yin, Bio-Des. Manuf., 2019, 2, 269–277 CrossRef CAS.
- K. Hosoyama, M. Ahumada, C. D. McTiernan, J. Bejjani, F. Variola, M. Ruel, B. Xu, W. Liang, E. J. Suuronen and E. I. Alarcon, RSC Adv., 2017, 7, 47704–47708 RSC.
- J. Ramón-Azcón, S. Ahadian, M. Estili, X. Liang, S. Ostrovidov, H. Kaji, H. Shiku, M. Ramalingam, K. Nakajima, Y. Sakka, A. Khademhosseini and T. Matsue, Adv. Mater., 2013, 25, 4028–4034 CrossRef PubMed.
- S. R. Shin, S. M. Jung, M. Zalabany, K. Kim, P. Zorlutuna, S. Bok Kim, M. Nikkhah, M. Khabiry, M. Azize, J. Kong, K. Wan, T. Palacios, M. R. Dokmeci, H. Bae, X. (Shirley) Tang and A. Khademhosseini, ACS Nano, 2013, 7, 2369–2380 CrossRef CAS PubMed.
- S. Ahadian, S. Yamada, J. Ramón-Azcón, M. Estili, X. Liang, K. Nakajima, H. Shiku, A. Khademhosseini and T. Matsue, Acta Biomater., 2016, 31, 134–143 CrossRef CAS PubMed.
- S. R. Shin, B. Aghaei-Ghareh-Bolagh, T. T. Dang, S. N. Topkaya, X. Gao, S. Y. Yang, S. M. Jung, J. H. Oh, M. R. Dokmeci, X. (Shirley) Tang and A. Khademhosseini, Adv. Mater., 2013, 25, 6385–6391 CrossRef CAS PubMed.
- A. R. Spencer, A. Primbetova, A. N. Koppes, R. A. Koppes, H. Fenniri and N. Annabi, ACS Biomater. Sci. Eng., 2018, 4, 1558–1567 CAS.
- S. J. Lee, G. L. Pishko, G. W. Astary, T. H. Mareci and M. Sarntinoranont, J. Appl. Polym. Sci., 2009, 114, 1992–2002 CrossRef CAS PubMed.
- S. Ahadian, J. Ramón-Azcón, M. Estili, X. Liang, S. Ostrovidov, H. Shiku, M. Ramalingam, K. Nakajima, Y. Sakka, H. Bae, T. Matsue and A. Khademhosseini, Sci. Rep., 2014, 4, 4271 CrossRef PubMed.
- Z. J. Han, A. E. Rider, M. Ishaq, S. Kumar, A. Kondyurin, M. M. M. Bilek, I. Levchenko and K. (Ken) Ostrikov, RSC Adv., 2013, 3, 11058–11072 RSC.
- S. Namgung, K. Y. Baik, J. Park and S. Hong, ACS Nano, 2011, 5, 7383–7390 CrossRef CAS PubMed.
- C. M. Voge, M. Kariolis, R. A. MacDonald and J. P. Stegemann, J. Biomed. Mater. Res., Part A, 2008, 86A, 269–277 CrossRef CAS PubMed.
- Y. Wu, L. Wang, B. Guo and P. X. Ma, ACS Nano, 2017, 11, 5646–5659 CrossRef CAS PubMed.
- W. R. Small and V. N. Paunov, J. Mater. Chem., 2008, 18, 2082–2084 RSC.
- H. Lee, S. M. Dellatore, W. M. Miller and P. B. Messersmith, Science, 2007, 318, 426–430 CrossRef CAS PubMed.
- J. H. Ryu, P. B. Messersmith and H. Lee, ACS Appl. Mater. Interfaces, 2018, 10, 7523–7540 CrossRef CAS PubMed.
- Y. Zhang, B. Liang, Q. Jiang, Y. Li, Y. Feng, L. Zhang, Y. Zhao and X. Xiong, Smart Mater. Struct., 2020, 29, 075027 CrossRef CAS.
- Y. Yang, Y. Liang, J. Chen, X. Duan and B. Guo, Bioact. Mater., 2022, 8, 341–354 CrossRef CAS PubMed.
- J. Jiang, Y. Huang, Y. Wang, H. Xu, M. Xing and W. Zhong, Materials, 2017, 10, 964 CrossRef PubMed.
- L. Qiu, J. Z. Liu, S. L. Y. Chang, Y. Wu and D. Li, Nat. Commun., 2012, 3, 1241 CrossRef PubMed.
- J. W. Cho, J. W. Kim, Y. C. Jung and N. S. Goo, Macromol. Rapid Commun., 2005, 26, 412–416 CrossRef CAS.
Footnotes |
| † Electronic supplementary information (ESI) available. See DOI: https://doi.org/10.1039/d2tb02019j |
| ‡ More on electrical percolation in Section 3. |
| This journal is © The Royal Society of Chemistry 2023 |