 Open Access Article
Advances in photo-assisted seawater splitting promoted by green iron oxide-carbon nitride photoelectrocatalysts†
Mattia
Benedet
ab,
Gian Andrea
Rizzi
*ab,
Oleg I.
Lebedev
c,
Vladimir
Roddatis
d,
Cinzia
Sada
 e,
Jan-Lucas
Wree
f,
Anjana
Devi
f,
Chiara
Maccato
 *ab,
Alberto
Gasparotto
 ab and
Davide
Barreca
 b
b
aDepartment of Chemical Sciences, Padova University and INSTM, 35131 Padova, Italy
bCNR-ICMATE and INSTM, Department of Chemical Sciences, Padova University, 35131 Padova, Italy. E-mail: gianandrea.rizzi@unipd.it; chiara.maccato@unipd.it
cLaboratoire CRISMAT, UMR 6508 Normandie Université, CNRS, ENSICAEN, UNICAEN, 14050 Caen, Cedex 4, France
dGFZ German Research Centre for Geosciences, 14473, Potsdam, Germany
eDepartment of Physics and Astronomy, Padova University and INSTM, 35131 Padova, Italy
fInorganic Materials Chemistry, Ruhr University Bochum, 44801 Bochum, Germany
First published on 14th September 2023
Abstract
Solar-driven seawater electrolysis for hydrogen fuel production holds an outstanding potential towards the development of a carbon-neutral and sustainable energy infrastructure, but the development of green, efficient and stable photoelectrocatalysts selectively promoting oxygen evolution remains a formidable challenge. Motivated by this issue, in this work we propose a tailored combination of two economically viable materials, α-Fe2O3 and graphitic carbon nitride (gCN), to fabricate promising anodes – eventually decorated with cobalt phosphate (CoPi) particles – for alkaline seawater photosplitting. The target systems were fabricated via an original multi-step route, involving the plasma-enhanced chemical vapor deposition of iron(III) oxide on conducting glasses, the introduction of gCN in very small amounts by a rapid and facile electrophoretic process, and final annealing in air. A comprehensive characterization revealed the successful fabrication of composites featuring a tailored surface defectivity, a controlled nano-organization, and a close Fe2O3/gCN interfacial contact. After decoration with CoPi, the best performances corresponded to a Tafel slope of ≈100 mV dec−1 and overpotential values enabling us to rule out the competitive hypochlorite formation. In addition, photocurrent densities at 1.23 V vs. RHE showed a nearly 7-fold increase upon Fe2O3 functionalization with both gCN and CoPi. These amenable results, directly dependent on the electronic interplay at Fe2O3/gCN heterojunctions and on CoPi beneficial effects, are accompanied by a remarkable long-term stability, and may open up attractive avenues for clean energy production using natural resources.
1. Introduction
Molecular hydrogen (H2) is expected to play an important role in driving mankind on the road to carbon neutrality, a foremost challenge to achieve ‘‘net-zero emissions’’ by 2050.1–11 Differently from H2 produced from fossil fuels (‘grey hydrogen’), in conflict with the achievement of these objectives, ‘green hydrogen’ obtained by electrochemical water splitting, possibly activated by sunlight, is environmentally friendly and renewable, and has gained remarkable interest to solve the global energy crisis and shape a sustainable energy economy.1,12–19 Nonetheless, the water splitting efficiency is limited by the kinetic barrier of the anodic oxygen evolution reaction (OER), possessing a high overpotential (η).9,14,17,20–23 The current benchmark OER electrocatalysts based on noble-metal (e.g., Ir and Ru) oxides suffer from scarcity, high cost and modest long-term stability, limiting their large-scale use and commercialization.1,12,14,24,25 Therefore, significant efforts have been devoted to the development of non-precious metal (photo)electrocatalysts including oxides, hydroxides, and nitrides.5,6,8,14,26,27In view of real-world exploitation, one of the less discussed, though important, requirements is the availability of water feedstocks. Although freshwater is readily available on a laboratory scale, the need for significant freshwater feeds for practical applications may become a bottleneck especially in hot/arid coastal regions, which, however, have immediate access to seawater.1,9,11,28 In fact, the use of the latter, an almost endless natural resource, representing ≈97% of the total Earth water reservoirs, could substantially help to alleviate freshwater shortage.1,24,28–32 In this regard, coupling seawater electrolysis with renewable energy sources,1,28,33 such as solar light,2,8,15,34,35 opens up attractive avenues for the large-scale generation and conversion of sustainable energy through natural capital exploitation.36
Although much progress has been achieved so far in designing efficient OER seawater (photo)electrocatalysts in various ways,1,10,11,20,30,37 there are still various open issues to be properly tackled for seawater deployment in real-world environments:38 (i) optimization of catalyst's long-term stability,30 as required for industrial applications, possibly coupled to the utilization of low cost, largely abundant and eco-friendly materials and (ii) manufacturing of anodes selective towards OER against the competitive hypochlorite formation (Cl− + 2OH− → ClO− + H2O + 2e−), the latter being thermodynamically more demanding, but kinetically favoured.1,10,22,28,39,40 In this regard, it is worth highlighting that, if OER is carried out in alkaline solutions at an overpotential <0.48 V, ClO− generation from chloride oxidation can be favourably suppressed.1,20,39,41
In the broad scenario of OER photoelectrocatalysts, hematite (α-Fe2O3), the most stable iron(III) oxide polymorph,4,15,16,23,42 is one of the most promising platforms due to its natural abundance, biocompatibility, low cost, good stability, and band gap (EG ≈ 2.1 eV) enabling the absorption of a large solar spectrum portion.2,6,12,16,23,43,44 These advantages are partially eclipsed by its small exciton diffusion length (≈2–4 nm), as well as by the poor mobility and low lifetime of photogenerated charge carriers (<10 ps), restricting its practical applications.6,7,13,16,43,45,46 Among the strategies proposed to overcome these shortfalls,23,47,48 a valuable alternative is offered by the construction of heterojunctions with staggered band alignment, yielding improved sunlight harvesting and more efficient electron–hole separation.13–17,36,42,49
In this regard, a very attractive candidate to be combined with Fe2O3 is graphitic carbon nitride (gCN), a research hotspot in recent years.3,15,17,18,42,43,48,50 gCN, a 2D metal-free material endowed with high chemical stability, structural flexibility, tuneable defectivity and moderate band gap energy (EG ≈ 2.4–2.8 eV),5,19,34,35,49,51–55 has been widely explored as a Vis-light-active photocatalyst.45,46,49,56–58 Recent studies have demonstrated that Fe2O3/gCN heterostructured systems hold a significant potential as Vis-light photo(electro)catalysts for pollutant degradation26,42,51,54,59 and CO2 reduction,47,53 as well as for H2 production by direct photocatalysis2–4,17,18,44,49,60 and electrochemically assisted processes in freshwater.12–14,19,34,45,50,56
Up to date, the use of Fe2O3- and gCN-containing materials for seawater splitting has been reported in photocatalytic,31,32,61,62 electrochemical22,24,41 and photoelectrochemical processes.6,21,36,37,63 Nevertheless, to the best of our knowledge, no literature works employing Fe2O3-gCN composites for such end-uses are available so far. Therefore, the interplay between the chemico-physical characteristics of similar nanomaterials and their functional behaviour requires further studies to develop stable and selective anodes for OER in seawater.
In view of the target application, an imperative issue is the implementation of a highly controllable preparation route affording a convenient modulation of material properties20 and an effective component interfacial contact, to promote electron–hole separation, improve photostability, and boost light absorption.3,13 Thus far, Fe2O3-gCN catalysts for various end-uses have been prepared either in a powdered form, or through powder immobilization on substrates using additives/binders.4,12,18,19,44,47,51–53,57,60,64 In a different way, modern frontiers for research development focus on the direct growth of Fe2O3-gCN materials onto suitable substrates.20,35,48 Related examples include: (i) Fe2O3-gCN preparation by Fe2O3 sputtering, followed by gCN drop-casting and spreading;56 (ii) Fe2O3 electro-/solvo-/hydrothermal deposition and vapor phase/electrochemical functionalization with gCN;42,43,45,48,49 and (iii) chemical vapor deposition (CVD) of Fe2O3 and subsequent gCN spin coating.13
In the present work, we report on the fabrication of stable and efficient Fe2O3-gCN photoanodes selectively promoting oxygen evolution during seawater electrolysis. The target materials were developed for the first time by a multi-step fabrication strategy (Scheme 1), involving the initial plasma-enhanced CVD (PE-CVD) of α-Fe2O3 on fluorine-doped tin oxide (FTO)-coated glass substrates, the functionalization with tiny amounts of graphitic carbon nitride by electrophoretic deposition (EPD), and final thermal treatment in air. Both PE-CVD and EPD offer various degrees of freedom to tailor the characteristics of the resulting nanomaterials, due to the peculiar features of cold-plasmas in Fe2O3 synthesis (PE-CVD),25,65 and the possibility of obtaining exfoliated gCN systems formed by micro/nano-sheets (EPD).66 In fact, EPD processes were performed starting from two kinds of gCN powders with different active areas,66–68 to investigate the interrelations between gCN characteristics and the functional performances of the obtained composites.
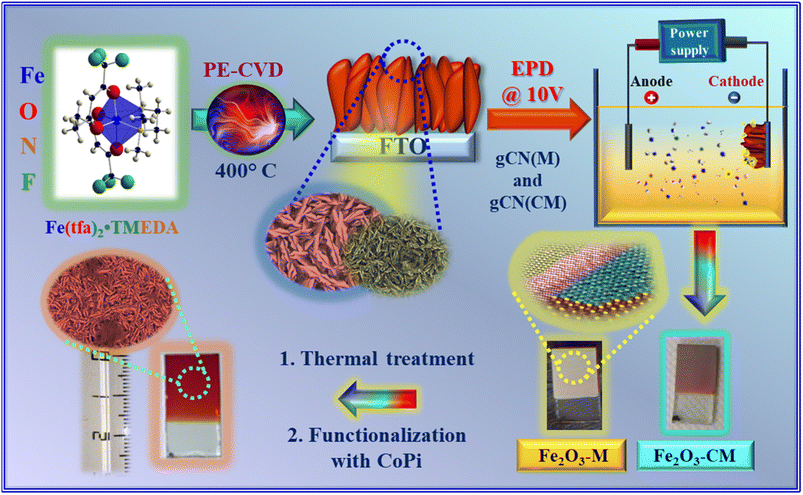 | ||
| Scheme 1 Schematic illustration of the strategy used to fabricate Fe2O3 specimens functionalized with gCN. | ||
The adopted procedure enabled us to obtain an intimate Fe2O3/gCN interfacial contact, yielding, in turn, a reduced charge resistance, an improved OER photoactivity, and an enhanced operational stability. The developed nanocomposites were subjected to functional tests in both simulated and real seawater under alkaline conditions, analogous to those employed in the operation of industrial electrolyzers.10,27,33 Besides material characterization by standard electrochemical techniques, we present and discuss the results obtained by intensity-modulated photocurrent spectroscopy (IMPS), which yielded accurate kinetic constants for charge recombination/transfer processes on the surface and into the solution.69,70 To our knowledge, similar data are not available to date for Fe2O3-gCN nanocomposites. The best performing system, obtained after functionalization with cobalt(II) phosphate (CoPi), a well-known oxidation co-catalyst,35,71 yielded an overpotential (η) < 350 mV and a Tafel slope of ≈ 100 mV dec−1, comparing favourably with Fe2O3- or gCN-containing materials tested in seawater splitting up to date. The photocurrent density values at 1.2 V vs. RHE showed a nearly 7-fold increase upon Fe2O3 functionalization with both gCN and CoPi. These outcomes, accompanied by the good material selectivity and durability, offer a promising route towards the production of sustainable and green photoelectrocatalysts for the integration of renewable fuels into a grid system.
2. Experimental
2.1 Material preparation
The adopted synthetic strategy for the preparation of Fe2O3-gCN composite materials is summarized in Scheme 1. The PE-CVD of Fe2O3 was performed on FTO glass substrates (Aldrich®; ≈7 Ω sq−1; FTO thickness ≈600 nm) from Ar–O2 plasmas at 400 °C, a temperature chosen on the basis of preliminary optimization (see ESI, Section S-2.1†).The synthesis of two types of carbon nitride powders, namely gCN(M) and gCN(CM), obtained from melamine and from a melamine + cyanuric acid adduct, respectively, is described in the ESI (Section S-1.1.2).† Subsequently, the EPD of gCN powders on FTO-supported specimens was carried out following a previous route.72 In a typical experiment, a suspension containing pre-grinded carbon nitride powders (40 mg), acetone (50 mL) and 10 mg of I2 was sonicated for 20 min. The EPD of gCN on iron(III) oxide was performed adopting a two-electrode setup, in which the FTO-Fe2O3 sample and a carbon paper slide were used as the deposition electrode and counter-electrode, respectively. In addition, CoPi electrodeposition on selected samples was subsequently performed, with the aim to improve their OER photoelectrocatalytic activity (see ESI,† Section S-1.1.3).
In the following, specimens are labelled as Fe2O3–X–(Y), where X = M or CM, and Y = CoPi. For comparison purposes, bare Fe2O3 (with no gCN) was also prepared and analysed, either as such or after functionalization with CoPi.
2.2 Chemico-physical characterization
Field emission-scanning electron microscopy (FE-SEM) and energy-dispersive X-ray spectroscopy (EDXS) analyses were performed using a Zeiss SUPRA 40 VP apparatus equipped with an INCA x-act PentaFET Precision spectrometer, using primary electron beam voltages between 10 and 20 kV. The mean particle sizes were evaluated using the ImageJ® software.73 An NT-MDT SPM Solver P47H-PRO instrument operated in tapping mode was used for atomic force microscopy (AFM) characterization. After background subtraction and plane fitting, root-mean-square roughness (RMS) values (see Fig. 1) were obtained from 2 × 2 μm2 micrographs, as reported previously.66 X-ray photoelectron spectroscopy (XPS) was carried out using a PHI 5000 VersaProbe instrument at a pressure <10−8 mbar, employing a monochromatic AlKα excitation source (hν = 1486.6 eV). No preliminary sputtering was carried out. Binding energies (BEs) were corrected for charging phenomena by assigning a position of 284.8 eV to the adventitious C 1s component. Curve fitting was carried out using the XPSPEAK software, with Gaussian–Lorentzian functions.74 Atomic percentages (at%) were calculated from peak area integration using PHI XPS V1.3.6 sensitivity factors. Secondary ion mass spectrometry (SIMS) measurements were carried out using an IMS 4f mass spectrometer (Cameca), with a Cs+ primary beam (14.5 keV, 30 nA; stability = 0.2%) and an electron gun for charge compensation. Analyses were performed in beam blanking mode, rastering over a 150 × 150 μm2 region and sampling secondary ions from a 7 × 7 μm2 sub-area in order to avoid crater effects. The sputtering time was converted into depth based on the deposit thickness values measured by FE-SEM analyses. Transmission electron microscopy (TEM) including high-resolution TEM (HRTEM), bright-field scanning TEM (BF-STEM), high angle annular dark-field scanning TEM (HAADF-STEM), electron diffraction (ED), and EDXS elemental mapping were performed using a JEOL ARM200F cold FEG double aberration corrected microscope, equipped with a large-angle CENTURIO EDX detector, an Orius CCD camera, and a Quantum GIF. Electron energy loss spectroscopy (EELS) and additional EDXS measurements were performed using a Thermo Fisher Scientific Themis Z 80-300 microscope equipped with a spherical aberration corrector at the probe side, a SuperX G2 EDX spectrometer, and a Gatan Continuum 1065 electron energy loss spectrometer.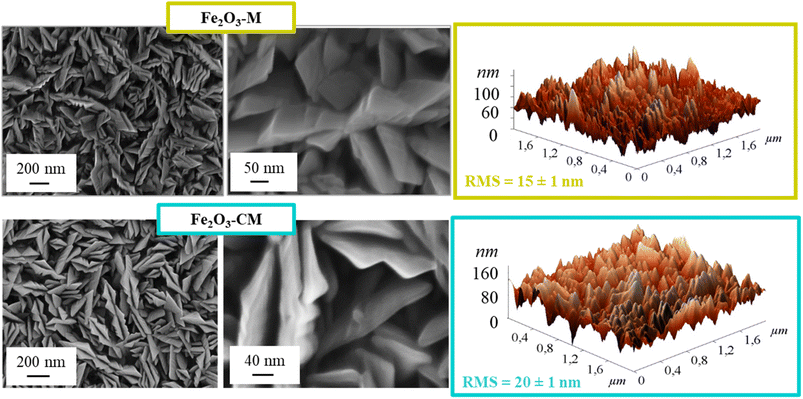 | ||
| Fig. 1 Morphological characterization of Fe2O3 deposits functionalized with gCN(M) (top panel) and gCN(CM) (bottom panel): FE-SEM (left) and AFM micrographs (right). | ||
2.3 Electrochemical functional tests
Photoelectrocatalytic activity tests were performed at room temperature using an integrated system consisting of a Zennium-PRO and a PP212 unit from Zahner GmbH, coupled with an optical bench containing a Zahner photoelectrochemical cell (Fig. S1†). FTO-supported Fe2O3-gCN systems were used as working electrodes, whereas a Pt coil and a Ag/AgCl electrode were used as the counter and reference electrodes, respectively. Linear sweep voltammetry (LSV; scan rate = 5 mV s−1) measurements were first performed in alkaline-simulated seawater (0.5 M KOH + 0.5 M NaCl),20,40 and subsequently, in Adriatic seawater picked up at the seaside of Rosolina (RO), Italy. The latter was preliminarily treated by adding KOH and filtering the precipitate [mainly formed by Mg(OH)2; final pH = 13.6].20The overpotential (η) for the oxygen evolution reaction was calculated as follows:20,25
| η (V) = ERHE − 1.23 | (1) |
The applied bias photon-to-current efficiency (ABPE) (%) curves were obtained using the following equation:42,75
| ABPE (%) = ([j × (1.23 − E)]/P) × 100 | (2) |
The incident photon-to-current conversion efficiency (IPCE) is a measure of the ratio of the photocurrent (converted to an electron transfer rate) vs. the rate of incident photons (converted from the calibrated power of a light source) as a function of wavelength. The IPCE (%) takes into account the efficiencies for photon absorption/charge excitation and separation (ηe−/h+), charge transport within the solid to the solid–liquid interface transport (ηtransport), and interfacial charge transfer across the solid–liquid interface (ηinterface).76 The IPCE was measured in the potential interval 0.85–1.55 V vs. RHE, and the values were calculated as follows:37,63
 | (3) |
Chronoamperometry (CA) analyses were carried out at 1.45 V (vs. RHE). Iodometric titration was used for the determination of hypochlorite species generated during OER (see ESI,† Section S-1.3).
Additional details on material preparation and characterization are reported in the ESI.†
3. Results and discussion
3.1 Material chemico-physical characterization
Preliminary attention was paid to the structural, optical and morphological characterization of Fe2O3 deposits (Fig. S2–S4† and related observations), based on which an optimal iron oxide growth temperature of 400 °C was identified, as indicated in Scheme 1. Under these conditions, an α-Fe2O3 (hematite) deposit with a porous lamellar structure and a thickness of 450 nm was obtained. After functionalization with gCN (Fig. 1), the system morphology did not undergo significant modifications with respect to bare iron(III) oxide. This evidence pinpointed that the adopted functionalization procedure was mild enough to maintain unaltered the original Fe2O3 nano-organization. EDXS analyses on Fe2O3-gCN systems (Fig. S5†) revealed an even distribution of both carbon and nitrogen over the whole analyzed areas, indicating a high lateral compositional homogeneity. AFM analyses (Fig. 1) yielded an enhanced roughness on passing from Fe2O3–M to Fe2O3–CM, suggesting a parallel increase of material active area, beneficial for the target application.66X-ray diffraction (XRD) patterns of Fe2O3–M and Fe2O3–CM (Fig. S6a†) ruled out any significant structural variation after gCN introduction in comparison to the pristine iron(III) oxide. No signals due to graphitic carbon nitride could ever be detected, due to its low overall amount, as well as to its high dispersion into Fe2O3 (see below). Optical spectra (Fig. S6b†) evidenced an increased light harvesting of composite systems with respect to bare Fe2O3.
The corresponding band gap values (Fig. S6c†) were almost the same as those of pristine iron(III) oxide (≈2.1 eV, compare Fig. S2†), Fe2O3 being the predominant system component. FE-SEM and EDXS results for the composite system after functionalization with CoPi are reported in Fig. S7† (see also related observations).
To investigate the composition and elemental chemical states of the target materials, XPS analyses were carried out (see also Fig. S8†). The C 1s signals resulted from the contribution of three distinct components (Fig. 2a, S9 and Table S1;† see also Fig. 2f): C0, related to adventitious carbon;35,45,55,62,66,77,78 C1, ascribed to C–NHx groups (x = 1 and 2) located on gCN heptazine ring edges;2,52,62,66,75,77,79 C2, due to N–C![[double bond, length as m-dash]](https://www.rsc.org/images/entities/char_e001.gif) N carbon atoms in the aromatic rings of the gCN framework.37,43,48,54,58,59,62 As regards the N 1s photoelectron peaks (Fig. 2b, c, S10a and Table S2†), component N1 was assigned to bi-coordinated nitrogen centres (C
N carbon atoms in the aromatic rings of the gCN framework.37,43,48,54,58,59,62 As regards the N 1s photoelectron peaks (Fig. 2b, c, S10a and Table S2†), component N1 was assigned to bi-coordinated nitrogen centres (C![[double bond, length as m-dash]](https://www.rsc.org/images/entities/char_e001.gif) N–C).2,21,43,46,47,79 Signal N2 corresponded to tertiary N atoms [N–(C)3, N3c] in the gCN network,3,14,51,54,59,64 and signal N3 was related to uncondensed -NHx groups18,26,37,44,52,58,64,77 (compare also Fig. 2f). Upon going from the M-derived sample (Fe2O3–M) to CM-containing ones (Fe2O3–CM and Fe2O3–CM–CoPi), N3 component contribution to the overall N 1s photopeak underwent a more than two-fold increase (Fig. 2e and Table S2†). The higher content of uncondensed amino groups in CM-derived systems highlighted their lower polymerization degree in comparison to melamine-derived samples.66 As a matter of fact, an increased amino-group content can favourably influence the anchoring of carbon nitride to the underlying Fe2O3 deposits. Besides improving material stability, an important pre-requisite for practical end-uses, this issue can, in turn, promote charge transfer from gCN to Fe2O3 and directly affect the ultimate material activity (see below).5 In fact, defects resulting from –NHx presence may act as hole capturing sites, suppressing the detrimental recombination processes of photogenerated electrons and holes.5,66,75,79
N–C).2,21,43,46,47,79 Signal N2 corresponded to tertiary N atoms [N–(C)3, N3c] in the gCN network,3,14,51,54,59,64 and signal N3 was related to uncondensed -NHx groups18,26,37,44,52,58,64,77 (compare also Fig. 2f). Upon going from the M-derived sample (Fe2O3–M) to CM-containing ones (Fe2O3–CM and Fe2O3–CM–CoPi), N3 component contribution to the overall N 1s photopeak underwent a more than two-fold increase (Fig. 2e and Table S2†). The higher content of uncondensed amino groups in CM-derived systems highlighted their lower polymerization degree in comparison to melamine-derived samples.66 As a matter of fact, an increased amino-group content can favourably influence the anchoring of carbon nitride to the underlying Fe2O3 deposits. Besides improving material stability, an important pre-requisite for practical end-uses, this issue can, in turn, promote charge transfer from gCN to Fe2O3 and directly affect the ultimate material activity (see below).5 In fact, defects resulting from –NHx presence may act as hole capturing sites, suppressing the detrimental recombination processes of photogenerated electrons and holes.5,66,75,79
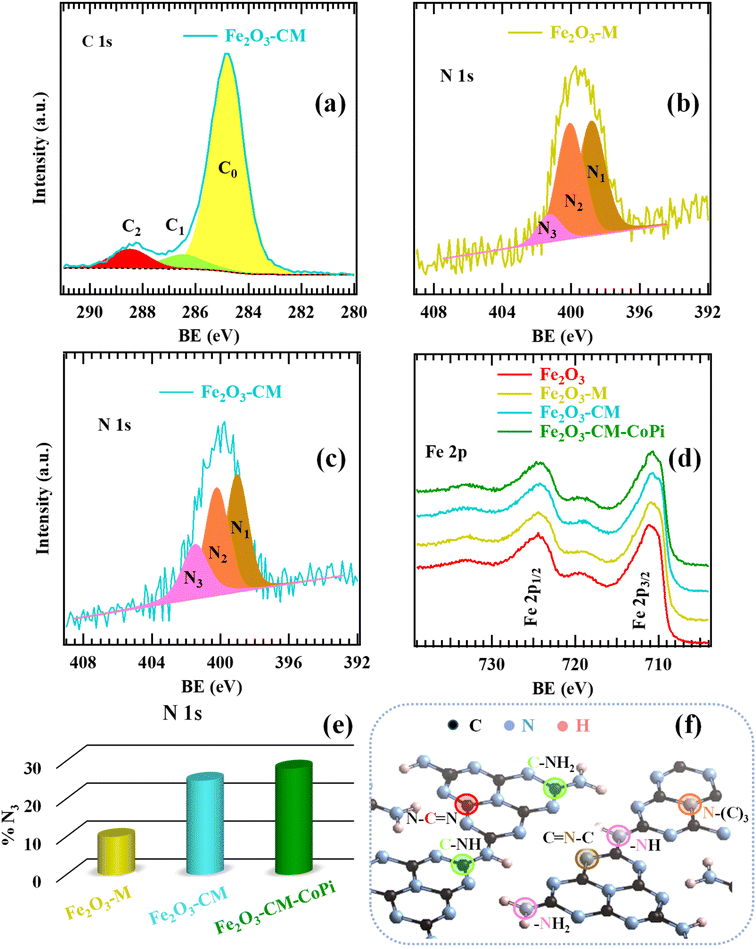 | ||
| Fig. 2 XPS surface characterization: C 1s (a), N 1s (b and c) and Fe 2p (d) photoelectron peaks for Fe2O3–M and Fe2O3–CM specimens. In panel (d), signals pertaining to bare Fe2O3 and to Fe2O3–CM functionalized with CoPi are also reported for comparison. (e) Percentage contribution of the N3 component (related to amino groups) to the overall N 1s signal for the investigated samples. (f) Sketch of graphitic carbon nitride structure,66,75 in which non-equivalent carbon and nitrogen sites are marked. Color codes are the same as in panels (a–c), in Fig. S9 and S10, and in Tables S1, S2†. | ||
It is worthwhile noticing that BEs of components C1 and C2, as well as of the three bands contributing to the N 1s signal, show an increase in comparison to the reported values for bare gCN18,26,31,32,48,60,63,77,78 (+0.2 eV, for Fe2O3–M, and + 0.3 eV, for Fe2O3–CM and Fe2O3–CM–CoPi; see Tables S1 and S2†). Such BE shifts reveal a strong Fe2O3-gCN interaction3,14,43,53,54 due to the formation of Fe2O3/gCN heterojunctions,49 with gCN → Fe2O3 interfacial electron transfer,42,43 promoted by the intimate contact between the single system constituents. The slightly higher shift observed for CM-derived systems in comparison to the M-derived one (see BE values in Tables S1–S2†) suggested a more efficient charge transfer in the former case. These conclusions were supported by the analysis of Fe 2p photopeaks (Fig. 2d). In fact, for bare iron oxide, both the signal shape and its energy position confirmed that phase-pure Fe2O3 was obtained [see also Table S3;† BE (Fe 2p3/2) = 711.2 eV; spin–orbit splitting (SOS) = 13.5 eV].6,7,13,18,25,46,47,50,58 For composite Fe2O3-gCN systems, the Fe 2p position underwent a red shift, more marked for CM-derived specimens (corresponding to a BE decrease of −0.2 eV, for Fe2O3–M, and −0.3 eV, for Fe2O3–CM and Fe2O3–CM–CoPi). O 1s fitting results are reported in Fig. S11 and Table S4.†
Complementary information on material in-depth composition, with particular regard to gCN spatial distribution, was gained by SIMS profiling (Fig. 3). For all the investigated systems, oxygen ionic yield did not undergo remarkable variations as a function of depth. The parallel Fe and O signal trends highlighted their common chemical origin, in line with the presence of iron(III) oxide as the predominant system component. The tailing of tin signals into the deposits was ascribed to Sn diffusion from the FTO substrate promoted by thermal treatment. This phenomenon, already observed in previous studies, might result in an improved electrical conductivity, favourably affect the ultimate material performances.6,7,20 The similarity between carbon and nitrogen ionic profiles revealed that the predominant contribution to the C signal arose from gCN presence, rather than from adventitious contamination. Indeed, the trends of C and N ionic yields as a function of depth suggested the presence of gCN throughout the entire Fe2O3 deposits. This result, related, in turn, to the iron(III) oxide open morphology (see Fig. 1 and S4† and pertaining observations), evidenced an intimate contact between the system components, of key importance for the target functional applications. A careful inspection of the profiles reported in Fig. 3 revealed that the outermost material region was gCN-rich, a phenomenon more evident for Fe2O3–M and Fe2O3–M–CoPi (Fig. 3b and d). Conversely, this effect was less marked for CM-derived specimens, indicating a good dispersion of gCN into the underlying Fe2O3. The resulting enhanced Fe2O3/gCN contact can boost the system activity due to the higher density of heterojunctions (see below).20 After CoPi introduction, Fe and Co profiles presented a close resemblance (Fig. 3c and d). In particular, for specimens Fe2O3–M–CoPi and Fe2O3–CM–CoPi, Co content was similar within an uncertainty of ±6%, and CoPi distribution was uniform within ±3%. The latter result might synergistically contribute to an additional performance improvement (see below).
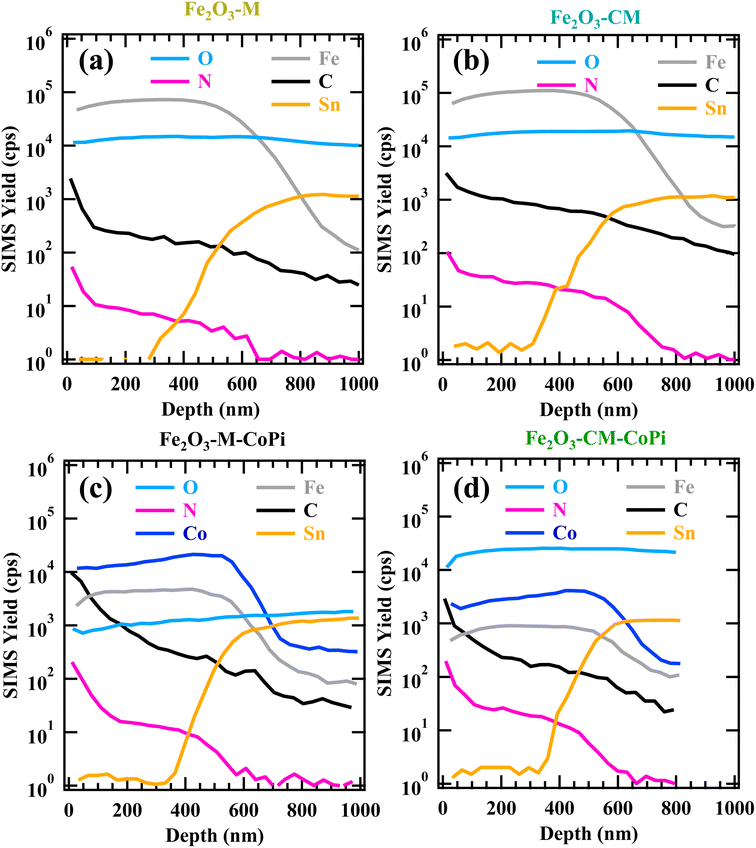 | ||
| Fig. 3 SIMS depth profiles of specimens: Fe2O3–M (a), Fe2O3–CM (b), Fe2O3–M–CoPi (c), and Fe2O3–CM–CoPi (d). | ||
To shed light into the system nanostructure, efforts were dedicated to a detailed characterization by TEM and related techniques. In particular, ED, HRTEM, and HAADF-STEM were used for phase identification, whereas complementary information on the composition and electronic structure at the nanoscale was gained by EDXS and EELS analyses. Fig. 4 displays the TEM results obtained for specimen Fe2O3–CM. The α-Fe2O3 deposit exhibited a columnar structure (Fig. 4a; typical grain size = 50 ÷ 70 nm; overall thickness ≈450 nm). Similar features were exhibited even by sample Fe2O3–M (see also Fig. S12†). Low-magnification cross-section HAADF-STEM and BF-STEM images, together with EDXS-STEM elemental maps (Fig. 4a), did not clearly show gCN presence. Nevertheless, the dark contrast on the grain surface (see Fig. 4c) suggested the formation of a very thin gCN layer. In fact, integration of EDXS signals over the whole sample thickness (Fig. 4b) revealed the occurrence of carbon and nitrogen signals. These results confirmed the faceted structure of hematite grains, in line with the FE-SEM results (see above), along with a uniform gCN distribution over iron oxide surface. These outcomes, together with XPS and SIMS ones (see above), point out to the presence of an ultrathin gCN layer covering the underlying iron oxide, a favourable feature to maximize interfacial Fe2O3/gCN interactions and promote hole migration to the gCN surface for water oxidation.80
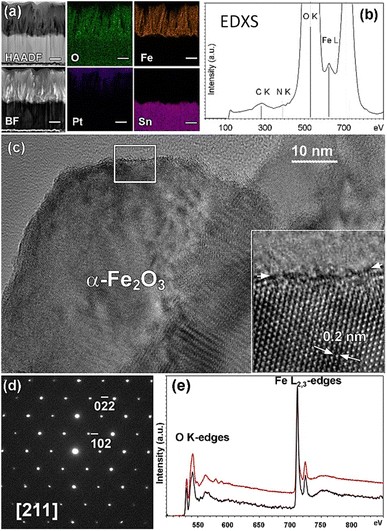 | ||
| Fig. 4 (a) Cross-section HAADF-STEM, BF-STEM images and EDXS-STEM elemental maps for O K, Fe K, Pt M, and Sn L collected on sample Fe2O3–CM. Scale bar is 200 nm. (b) EDXS spectra integrated over the full thickness of the iron oxide deposit. (c) Bright field [211] HRTEM image of an α-Fe2O3 single grain. A magnified image of the region framed by the white box is shown in the inset, where white arrows indicate α-Fe2O3 interplanar spacing. (d) SAED pattern corresponding to the above HRTEM image, indexed based on Fe2O3 hexagonal structure (ICSD 40142). (e) Integrated EELS spectrum (black) and α-Fe2O3 reference spectrum (red).83 | ||
The HRTEM characterization of iron(III) oxide is reported for sample Fe2O3–CM in Fig. 4c, whereas Fig. 4d displays the corresponding SAED pattern. The latter is in full agreement with the hexagonal α-Fe2O3 structure (space group: R![[3 with combining macron]](https://www.rsc.org/images/entities/char_0033_0304.gif) c (167); a = 0.5035 nm, c = 1.3747 nm), in line with XRD results (see Fig. S2†). The observed crystalline grains appear free from any defect. Such material characteristics, along with the columnar structure and nanosized morphology of the iron oxide deposit, are expected to be beneficial for photoelectrochemical applications.71,81 Fe2O3 presence was further confirmed by EELS analyses (Fig. 4e), exhibiting an optimal match with reference α-Fe2O3 regarding both O K and Fe L2,3 features and the overall spectral shape.82
c (167); a = 0.5035 nm, c = 1.3747 nm), in line with XRD results (see Fig. S2†). The observed crystalline grains appear free from any defect. Such material characteristics, along with the columnar structure and nanosized morphology of the iron oxide deposit, are expected to be beneficial for photoelectrochemical applications.71,81 Fe2O3 presence was further confirmed by EELS analyses (Fig. 4e), exhibiting an optimal match with reference α-Fe2O3 regarding both O K and Fe L2,3 features and the overall spectral shape.82
3.2 Electrochemical characterization
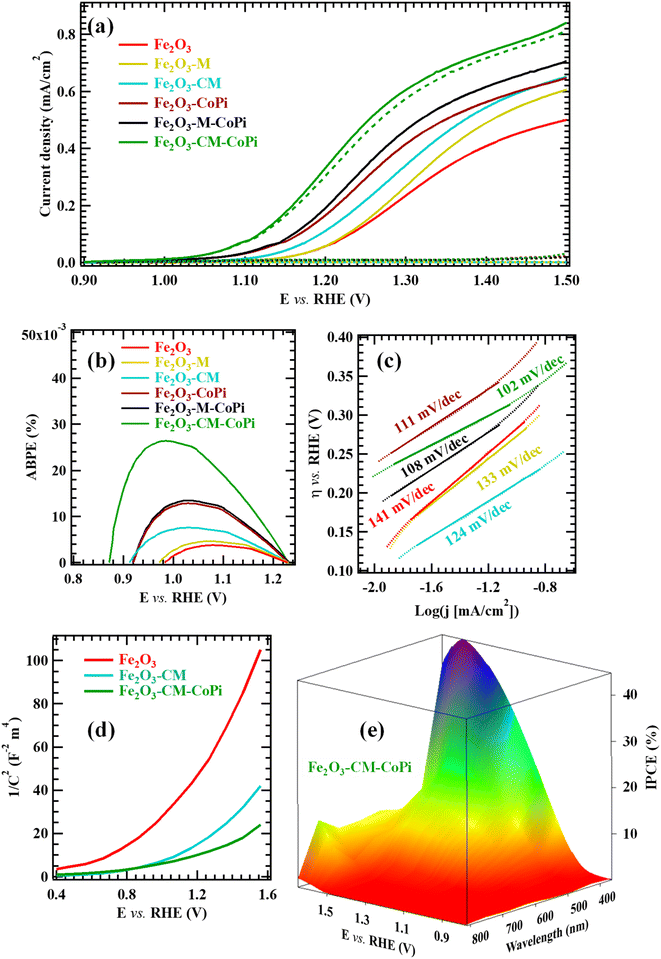
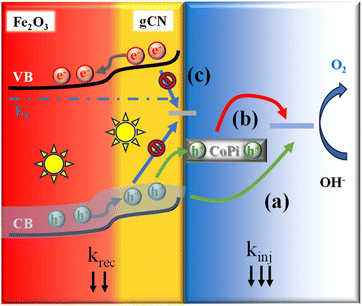
Fig. 5 reports the most relevant electrochemical results for the target samples, acquired in simulated seawater. As far as LSV curves are concerned (Fig. 5a), all specimens featured modest current density values in the darkness. In a different way, upon illumination a systematic current density increase took place, accompanied by a significant decrease in onset potential values. As can be observed, OER performances under irradiation improved upon gCN introduction, and further increased when Fe2O3-gCN composites were decorated with CoPi. The actual photoelectrocatalytic performances (Tables S5 and S6†) are in line, or even better, than those exhibited in saline/seawater splitting by other Fe2O3- or gCN-containing electrocatalysts (compared with literature results summarized in Tables S7 and S8†). As can be observed in Fig. 5a and Table S5,† both composites yielded current density values higher than those of bare Fe2O3, revealing that even small gCN amounts are sufficient to boost the photoelectrocatalytic activity. In particular, the functional performances of Fe2O3–CM-based materials were systematically better than those of Fe2O3–M ones.The observed improvement can be mainly ascribed to the electronic interplay occurring at the Fe2O3/gCN interface. In particular, as sketched in Fig. 6, charge transfer across Fe2O3/gCN interfaces occurs due to a staggered type-II heterojunction mechanism,13 at variance with literature reports on α-Fe2O3/gCN photocatalysts, for which a Z-scheme junction has been reported.2–4,17–19,42,47–49,51–54,58,60,64 As can be observed in Fig. 6, upon irradiation, valence-to-conduction band electron excitation occurs. Thanks also to the intimate Fe2O3/gCN contact, as revealed by SIMS and TEM data (see above),45 electrons from the more negative gCN conduction band are transferred to the less negative Fe2O3 one, whereas holes flow from the Fe2O3 valence band to the gCN one, thus yielding enhanced electron–hole separation.43,46,57,84 Subsequently, under the action of the applied bias voltage, electrons in the Fe2O3 conduction band are injected in the external circuit through the FTO substrate34 and are transported towards the cathode, while holes are progressively accumulated at gCN sites, where water is directly oxidized to O2. Consequently, electrons and holes participate in hydrogen evolution reaction (HER) and OER, respectively. Owing to this type-II configuration, charge carrier recombination is suppressed and their extraction and utilization can be significantly improved, leading to superior photoelectrocatalytic performances of nanocomposite systems in comparison to their single-phase counterparts.
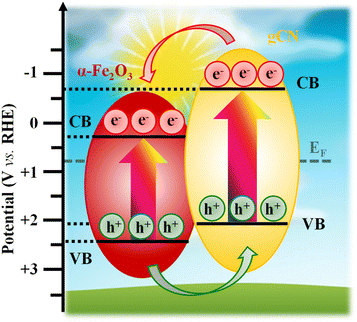 | ||
| Fig. 6 Representation of the interfacial band structure at the carbon nitride/Fe2O3 heterojunction.5,20,26,43,56,57,59,66 CB and VB mark the conduction and valence band edges, respectively. VB and CB energy levels related to gCN and Fe2O3 have been obtained by photoelectron spectroscopy measurements (Fig. S13†) and optical band gap values. The optical band gap value for Fe2O3 is reported in Fig. S3,† while the ones for gCN(M) and gCN(CM) are referred to published data.66 The marked Fermi level energy (EF) has been obtained by Mott–Schottky analyses (see Section S-1.3†). | ||
At this stage, the question to be answered is: why do gCN(CM)-derived systems exhibit better performances with respect to the homologous M-derived ones? The reasons accounting for this phenomenon are: (i) the higher content of defects related to amino-group presence (see XPS data) and (ii) the more homogeneous in-depth dispersion of gCN(CM) into Fe2O3 in comparison to gCN(M) (compare SIMS results in Fig. 3), resulting in a more efficient Fe2O3/gCN contact and improved separation of photogenerated electrons and holes.66 In fact, ABPE profiles76 (Fig. 5b) indicate that Fe2O3–CM specimens are more efficient with respect to bare Fe2O3 and Fe2O3–M ones. Furthermore, samples decorated with CoPi particles show higher ABPE values than the corresponding CoPi-free ones, with Fe2O3–CM–CoPi yielding the best performances. An additional figure of merit to assess the material activity, with particular regard to the electrode reaction kinetics,20–22,25,41 is the Tafel slope. In the case of OER, for which low overpotentials are needed, lower Tafel slopes are highly desirable. In this regard, Fig. 5c reveals that the decoration of Fe2O3-gCN composites with CoPi further improves the OER kinetics. Moreover, all samples functionalized with gCN(CM) are characterized by lower Tafel slopes in comparison to gCN(M)-containing ones.
Altogether, data reported in Fig. 5a–c indicate that the best performing photoanode is Fe2O3–CM–CoPi. The same conclusion is corroborated by a comparative examination of results obtained from Mott–Schottky analyses (see Fig. 5d and S15†). In fact, Table S9† indicates a negative shift of the flat band potential (VFB; see Section S-1.3†) upon going from Fe2O3, to Fe2O3–M, to Fe2O3–CM, accompanied by a parallel increase in charge carrier concentration (ND). An analogous trend is exhibited by CoPi-functionalized samples, which feature systematically lower (higher) VFB (ND) values with respect to the previous ones. Since a deeper VFB (i.e., a deeper Fermi level energy) allows us to achieve the OER onset using a lower bias, Fe2O3–CM–CoPi is confirmed to be the best performing system among the investigated ones. The corresponding IPCE analysis (Fig. 5e) yielded a value of ≈40% at 1.6 V vs. RHE (compare also with Fig. S16†).
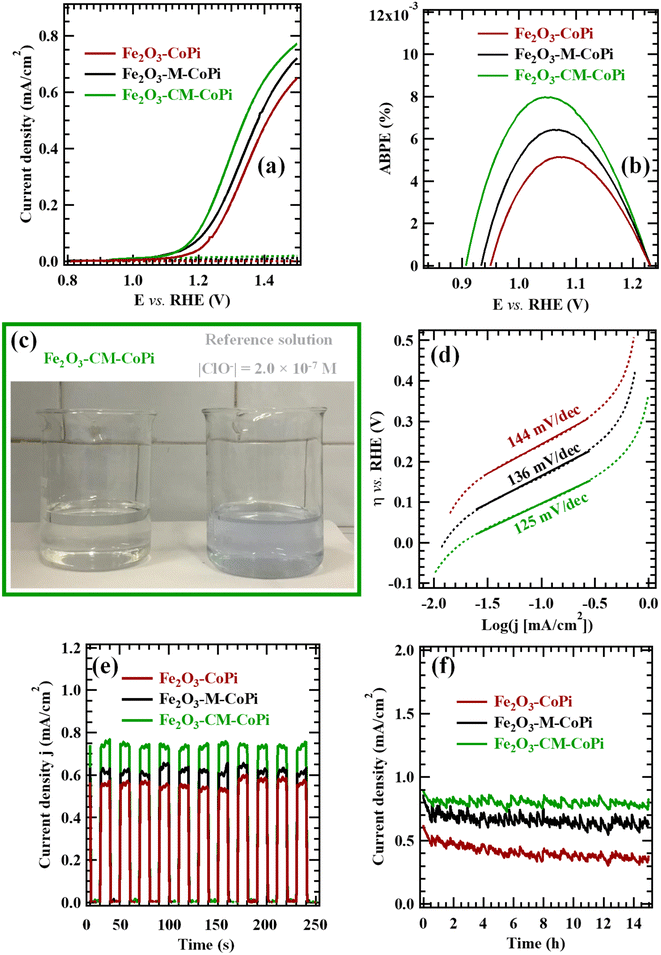
Subsequently, the electrochemical activity of CoPi-decorated specimens was also tested in real alkaline seawater. Fig. 7a displays the related LSV curves for specimens Fe2O3–CoPi, Fe2O3–M–CoPi, and Fe2O3–CM–CoPi. The above observed activity trend was still maintained, though the obtained photocurrent density values were appreciably lower than those reported in Fig. 5a, due to the different electrolyte composition.85 ABPE curves (Fig. 7b) and Tafel slopes (Fig. 7d) present an analogous trend. Taken together, these data suggest the occurrence of a cooperative effect between the type-II Fe2O3/gCN junction (see Fig. 6) and the CoPi electrocatalytic activity.86 In this regard, as already mentioned, the accumulation of electrons and holes in Fe2O3 CB and gCN VB, respectively, suppresses e−/h+ recombination at low biases, thus improving the charge injection efficiency. The introduction of CoPi particles and their electrocatalytic action towards OER87 result in favorable improvement of the overall performances.86 It is also important highlighting that seawater electrolysis led to a very modest ClO− production, as can be deduced from Fig. 7c, comparing two beakers containing seawater after electrolysis for 1 h (left) and a 1.0 × 10⁻⁷ M ClO− solution (right) after KI introduction in both cases (see Section S-1.3† for further details).
The time stability of CoPi-containing Fe2O3 and Fe2O3-gCN samples was tested by CA measurements at 1.45 V vs. RHE (Fig. 7e–f). As far as prolonged CA experiments are concerned (Fig. 7f), for pristine Fe2O3–CoPi a current density loss of ≈26% took place after 15 h of operation, and the presence of carbon nitride, in spite of its low amount, afforded a very favorable stability improvement (for Fe2O3–M–CoPi and Fe2O3–CM–CoPi, j losses of ≈14 and ≈4% respectively). The very limited photocurrent density decrease observed for Fe2O3–CM–CoPi was comparable, or lower, than those reported in analogous seawater splitting tests for various gCN or Fe2O3-based electrocatalysts (namely, Ru,Ni-doped Fe2O3,41 NiFe layered double hydroxides (LDH)/Mo-doped g-C3N4,21 and Fe2O3/NiO on Ni-foams24), as well as for NiOx-FeOx@g-C3N4,![[thin space (1/6-em)]](https://www.rsc.org/images/entities/char_2009.gif) 22 TiO2@g-C3N4–CoPi,37 WO3@g-C3N4,63 and In2S3–C3N4
22 TiO2@g-C3N4–CoPi,37 WO3@g-C3N4,63 and In2S3–C3N4![[thin space (1/6-em)]](https://www.rsc.org/images/entities/char_2009.gif) 88 photoelectrocatalysts. A similar result, far from being straightforward especially upon using seawater as electrolyte, emphasizes the applicative potential of the developed nanocomposites in the framework of an improved sustainability.
88 photoelectrocatalysts. A similar result, far from being straightforward especially upon using seawater as electrolyte, emphasizes the applicative potential of the developed nanocomposites in the framework of an improved sustainability.
Additional information on the charge transfer processes occurring in the target systems was gained by IMPS analyses (ESI, Section S-2.3 and Fig. S17†). The synergistic action of gCN and CoPi in boosting functional performances is evidenced by the comparison of data acquired for Fe2O3–CoPi, Fe2O3–M–CoPi and Fe2O3–CM–CoPi samples before electrochemical testing in seawater. The kinetic constants and normalized IMPS Nyquist plots (Fig. S18†) indicate that the co-presence of gCN and CoPi is very effective in decreasing the recombination rate constants89 (krec), yielding lower values than those measured for Fe2O3–CoPi. In a different way, charge injection constants (kinj) present an increasing trend up to 1.00–1.05 V. gCN-containing samples are characterized by the highest kinj values and best charge injection efficiencies (Fig. S18†).
Fig. 8 reports the results obtained from IMPS analysis after electrochemical testing in seawater. The kinjvs. potential trend (Fig. 8a; see also Fig. S18a†) suggests, at least for Fe2O3–CoPi, a Fermi level pinning caused by surface states at the material/electrolyte interface, where holes are accumulated.70,90,91 In a different way, for both Fe2O3–M–CoPi and Fe2O3–CM–CoPi, these surface states are passivated by the remaining CoPi particles,92,93 which extract photogenerated holes. Co(II) centers can, in fact, easily trap holes on the oxide surface.91 In this regard, the recombination frequency is also reduced by the presence of a type-II Fe2O3/gCN junction, since krec values for Fe2O3–M–CoPi and Fe2O3–CM–CoPi samples are appreciably lower than those for Fe2O3–CoPi in the whole potential range.13 The introduction of CoPi also leads to an increase in kinj values up to ≈ 1.1 V, in line with previous results.89 Interestingly, the kinj values for Fe2O3–M–CoPi and Fe2O3–CM–CoPi are higher than those found for Fe2O3–CoPi only at low potentials, whereas a decrease is observed at biases higher than 1.1 V (Fig. 8a). This kinj behaviour can be related to a progressive change in the OER mechanism as the bias is increased, from direct water oxidation at the Fe2O3/gCN surface to oxidation via CoPi. Such a phenomenon can be explained considering that the exposed Fe2O3/gCN surface can no longer keep up with the increasing flux of photogenerated holes and, therefore, a higher hole fraction will oxidize CoPi as the potential is increased. As a result, a decrease in kinj values occurs upon increasing the applied potential. Overall, these data indicate the presence of two paths for OER: direct injection of holes from gCN VB or, for potentials higher than ≈1.1 V, injection through CoPi particles (Fig. 9).
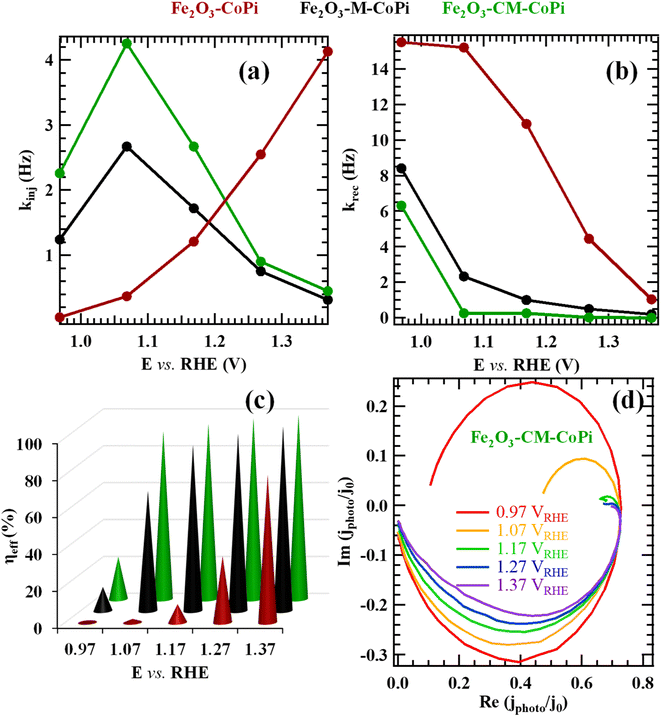 | ||
| Fig. 8 (a) kinj, (b) krec, and (c) charge transfer efficiency [ηeff = kinj/(krec + kinj)] values obtained from IMPS experiments performed after photoelectrochemical work in seawater for Fe2O3–CoPi, Fe2O3–M–CoPi and Fe2O3–CM–CoPi. (d) Normalized Nyquist plots of IMPS data for Fe2O3–CM–CoPi. The corresponding plots for Fe2O3–CoPi and Fe2O3–M–CoPi are reported in Fig. S19.† | ||
Importantly, the good performances of gCN-containing samples are not appreciably deteriorated by the action of seawater in comparison with the freshly prepared ones. This conclusion was also testified by post-operando XPS analyses on Fe2O3–M and Fe2O3–CM, enabling us to rule out any significant dissolution/degradation upon photoelectrochemical testing (see Fig. S20 and S21†; compare with Fig. 2 and S9–S11†). In fact, none of the relevant photopeaks showed any appreciable difference with respect to the original situation, and even quantitative analyses were very similar to those of freshly prepared samples (Fig. S22†). In excellent agreement with these outcomes, XRD and FE-SEM analyses yielded results very similar to the ones related to freshly prepared materials (compare Fig. S6a with Fig. S23, and Fig. S7a–d with Fig. S24†).
4. Conclusions
In summary, this work has been focused on the development of eco-friendly photoanodes for seawater splitting based on iron(III) oxide and graphitic carbon nitride. After the plasma-enhanced chemical vapor deposition of Fe2O3 onto FTO substrates, the systems were functionalized with gCN by electrophoresis, annealed in air, and eventually decorated with CoPi particles. Material structure–property interplay was elucidated by a multi-technique investigation using complementary analytical tools, among which IMPS provided valuable mechanistic insights into the photocharge dynamics. The proposed synthesis route was found to be very versatile for the fabrication of Fe2O3-gCN nanocomposites with controllable morphology, tailored surface defectivity, and an intimate Fe2O3/gCN interfacial contact. After decoration with CoPi, the most appealing material featured a Tafel slope of ≈ 100 mV dec−1 and overpotentials lower than the ClO− formation onset. In addition, photocurrent density values at 1.23 V vs. RHE showed a nearly 7-fold increase upon Fe2O3 functionalization with gCN and CoPi.The present photoelectrocatalytic activities were rationalized based on the formation of staggered type-II Fe2O3/gCN heterojunctions, coupled with CoPi as a passivating co-catalyst, promoting the transfer and separation of photogenerated electron–hole pairs. This favourable behaviour was accompanied by an appreciable selectivity towards O2 evolution, which, along with the remarkable material durability in alkaline environments, makes the obtained systems promising candidates for use as green, low-cost and robust electrodes for seawater splitting under solar illumination.
The present study demonstrated the importance of nanostructure engineering to develop photoanodes for the sustainable and efficient conversion of sunlight into chemical energy. These issues are of key importance to utilize water resources properly, alleviating energy shortage and environmental issues. Additional perspectives for a future sustainable development may concern the use of the present materials as photocatalysts for simultaneous water purification and energy generation, enabling us to conveniently transform wastes into resources under ambient conditions.
Author contributions
Mattia Benedet: investigation, writing-reviewing and editing. Gian Andrea Rizzi: methodology, conceptualization and investigation. Oleg I. Lebedev and Vladimir Roddatis: investigation and data curation. Cinzia Sada: methodology, data curation, writing – reviewing, and editing. Jan-Lucas Wree and Anjana Devi: methodology, investigation, data curation, writing-original draft preparation. Chiara Maccato: conceptualization, writing-original draft preparation, writing – reviewing, and editing, supervision and resources. Alberto Gasparotto: methodology, investigation, data curation, writing-reviewing and editing. Davide Barreca: methodology, investigation, supervision and resources, writing – reviewing and editing. All authors contributed to the data acquisition, discussed the results, and commented on the manuscript.Conflicts of interest
There are no conflicts to declare.Acknowledgements
This research was funded by Progetti di Ricerca @CNR – avviso 2020 – ASSIST), Padova University (P-DiSC#04BIRD2020-UNIPD EUREKA, DOR 2021–2023), and INSTM Consortium (INSTM21PDGASPAROTTO-NANOMAT, INSTM21PDBARMAC-ATENA). The authors are grateful to Dr A. Banzato for technical support. V. R. thanks the European Regional Development Fund and the State of Brandenburg for the Themis Z TEM (part of PISA). We also thank A. Schreiber (GFZ) for her help with FIB specimen preparation.References
- C. Huang, Q. Zhou, D. Duan, L. Yu, W. Zhang, Z. Wang, J. Liu, B. Peng, P. An, J. Zhang, L. Li, J. Yu and Y. Yu, Energy Environ. Sci., 2022, 15, 4647–4658 RSC.
- S. A. Hassanzadeh-Tabrizi, C.-C. Nguyen and T.-O. Do, Appl. Surf. Sci., 2019, 489, 741–754 CrossRef CAS.
- Q. Xu, B. Zhu, C. Jiang, B. Cheng and J. Yu, Sol. RRL, 2018, 2, 1800006 CrossRef.
- C. Zhao, M. Zheng, D. Wang, Q. Li and B. Jiang, Energy Technol., 2020, 8, 2000108 CrossRef CAS.
- X. Zou, Z. Sun and Y. H. Hu, J. Mater. Chem. A, 2020, 8, 21474–21502 RSC.
- D. Barreca, G. Carraro, A. Gasparotto, C. Maccato, M. E. A. Warwick, K. Kaunisto, C. Sada, S. Turner, Y. Gönüllü, T.-P. Ruoko, L. Borgese, E. Bontempi, G. Van Tendeloo, H. Lemmetyinen and S. Mathur, Adv. Mater. Interfaces, 2015, 2, 1500313 CrossRef.
- G. Carraro, C. Maccato, A. Gasparotto, K. Kaunisto, C. Sada and D. Barreca, Plasma Processes Polym., 2016, 13, 191–200 CrossRef CAS.
- A. Pei, R. Xie, Y. Zhang, Y. Feng, W. Wang, S. Zhang, Z. Huang, L. Zhu, G. Chai, Z. Yang, Q. Gao, H. Ye, C. Shang, B. H. Chen and Z. Guo, Energy Environ. Sci., 2023, 16, 1035–1048 RSC.
- W. Tong, M. Forster, F. Dionigi, S. Dresp, R. Sadeghi Erami, P. Strasser, A. J. Cowan and P. Farràs, Nat. Energy, 2020, 5, 367–377 CrossRef CAS.
- J. Juodkazytė, B. Šebeka, I. Savickaja, M. Petrulevičienė, S. Butkutė, V. Jasulaitienė, A. Selskis and R. Ramanauskas, Int. J. Hydrogen Energy, 2019, 44, 5929–5939 CrossRef.
- Y. Yao, X. Gao and X. Meng, Int. J. Hydrogen Energy, 2021, 46, 9087–9100 CrossRef CAS.
- O. Alduhaish, M. Ubaidullah, A. M. Al-Enizi, N. Alhokbany, S. M. Alshehri and J. Ahmed, Sci. Rep., 2019, 9, 14139 CrossRef PubMed.
- N. A. Arzaee, M. F. Mohamad Noh, N. S. H. Mohd Ita, N. A. Mohamed, S. N. F. Mohd Nasir, I. N. Nawas Mumthas, A. F. Ismail and M. A. Mat Teridi, Dalton Trans., 2020, 49, 11317–11328 RSC.
- L. Kong, J. Yan, P. Li and S. F. Liu, ACS Sustainable Chem. Eng., 2018, 6, 10436–10444 CrossRef CAS.
- M. Mishra and D.-M. Chun, Appl. Catal., A, 2015, 498, 126–141 CrossRef CAS.
- P. Sharma, J.-W. Jang and J. S. Lee, ChemCatChem, 2019, 11, 157–179 CrossRef CAS.
- X. She, J. Wu, H. Xu, J. Zhong, Y. Wang, Y. Song, K. Nie, Y. Liu, Y. Yang, M.-T. F. Rodrigues, R. Vajtai, J. Lou, D. Du, H. Li and P. M. Ajayan, Adv. Energy Mater., 2017, 7, 1700025 CrossRef.
- Y. Li, S. Zhu, Y. Liang, Z. Li, S. Wu, C. Chang, S. Luo and Z. Cui, Mater. Des., 2020, 196, 109191 CrossRef CAS.
- V. D. Dang, T. Annadurai, A. P. Khedulkar, J.-Y. Lin, J. Adorna, W.-J. Yu, B. Pandit, T. V. Huynh and R.-A. Doong, Appl. Catal., B, 2023, 320, 121928 CrossRef CAS.
- L. Bigiani, D. Barreca, A. Gasparotto, T. Andreu, J. Verbeeck, C. Sada, E. Modin, O. I. Lebedev, J. R. Morante and C. Maccato, Appl. Catal., B, 2021, 284, 119684 CrossRef CAS.
- Y. Du, Y. Zhang, X. Pu, X. Fu, X. Li, L. Bai, Y. Chen and J. Qian, Chemosphere, 2023, 312, 137203 CrossRef CAS PubMed.
- T. u. Haq and Y. Haik, ACS Sustainable Chem. Eng., 2022, 10, 6622–6632 CrossRef CAS.
- Y. Kumar, R. Kumar, P. Raizada, A. A. P. Khan, A. Singh, Q. V. Le, V.-H. Nguyen, R. Selvasembian, S. Thakur and P. Singh, J. Environ. Chem. Eng., 2022, 10, 107427 CrossRef CAS.
- L. Li, G. Zhang, B. Wang, D. Zhu, D. Liu, Y. Liu and S. Yang, ACS Appl. Mater. Interfaces, 2021, 13, 37152–37161 CrossRef CAS PubMed.
- C. Maccato, L. Bigiani, L. Girardi, A. Gasparotto, O. I. Lebedev, E. Modin, D. Barreca and G. A. Rizzi, Adv. Mater. Interfaces, 2021, 8, 2100763 CrossRef CAS.
- X. Liu, A. Jin, Y. Jia, J. Jiang, N. Hu and X. Chen, RSC Adv., 2015, 5, 92033–92041 RSC.
- L. Zeng, K. Zhou, L. Yang, G. Du, L. Liu and W. Zhou, ACS Appl. Energy Mater., 2018, 1, 6279–6287 CrossRef CAS.
- S. Dresp, F. Dionigi, M. Klingenhof and P. Strasser, ACS Energy Lett., 2019, 4, 933–942 CrossRef CAS.
- S. Khatun, H. Hirani and P. Roy, J. Mater. Chem. A, 2021, 9, 74–86 RSC.
- J. Zhang, W. Hu, S. Cao and L. Piao, Nano Res., 2020, 13, 2313–2322 CrossRef CAS.
- H. V. Dang, Y. H. Wang and J. C. S. Wu, Appl. Surf. Sci., 2022, 572, 151346 CrossRef CAS.
- H. Sun, Y. Shi, W. Shi and F. Guo, Appl. Surf. Sci., 2022, 593, 153281 CrossRef CAS.
- S. Dresp, F. Dionigi, S. Loos, J. Ferreira de Araujo, C. Spöri, M. Gliech, H. Dau and P. Strasser, Adv. Energy Mater., 2018, 8, 1800338 CrossRef.
- Y. Liu, F.-Y. Su, Y.-X. Yu and W.-D. Zhang, Int. J. Hydrogen Energy, 2016, 41, 7270–7279 CrossRef CAS.
- W. Xiong, F. Huang and R.-Q. Zhang, Sustainable Energy Fuels, 2020, 4, 485–503 RSC.
- Y. Li, J. Feng, H. Li, X. Wei, R. Wang and A. Zhou, Int. J. Hydrogen Energy, 2016, 41, 4096–4105 CrossRef CAS.
- Y. Li, R. Wang, H. Li, X. Wei, J. Feng, K. Liu, Y. Dang and A. Zhou, J. Phys. Chem. C, 2015, 119, 20283–20292 CrossRef CAS.
- H. Xie, Z. Zhao, T. Liu, Y. Wu, C. Lan, W. Jiang, L. Zhu, Y. Wang, D. Yang and Z. Shao, Nature, 2022, 612, 673–678 CrossRef CAS PubMed.
- S. Fukuzumi, Y.-M. Lee and W. Nam, ChemSusChem, 2017, 10, 4264–4276 CrossRef CAS PubMed.
- Y. Kuang, M. J. Kenney, Y. Meng, W.-H. Hung, Y. Liu, J. E. Huang, R. Prasanna, P. Li, Y. Li, L. Wang, M.-C. Lin, M. D. McGehee, X. Sun and H. Dai, Proc. Natl. Acad. Sci. U.S.A., 2019, 116, 6624–6629 CrossRef CAS PubMed.
- T. Cui, X. Zhai, L. Guo, J.-Q. Chi, Y. Zhang, J. Zhu, X. Sun and L. Wang, Chin. J. Catal., 2022, 43, 2202–2211 CrossRef CAS.
- L. Zhang, X. Zhang, C. Wei, F. Wang, H. Wang and Z. Bian, Chem. Eng. J., 2022, 435, 134873 CrossRef CAS.
- F. Wang, R. Ou, H. Yu, Y. Lu, J. Qu, S. Zhu, L. Zhang and M. Huo, Appl. Surf. Sci., 2021, 565, 150597 CrossRef CAS.
- J. K. George, A. Bhagat, B. Bhaduri and N. Verma, Catal. Lett., 2023, 153, 419–431 CrossRef CAS.
- Y. Liu, Y.-X. Yu and W.-D. Zhang, Int. J. Hydrogen Energy, 2014, 39, 9105–9113 CrossRef CAS.
- K. C. Christoforidis, T. Montini, E. Bontempi, S. Zafeiratos, J. J. D. Jaén and P. Fornasiero, Appl. Catal., B, 2016, 187, 171–180 CrossRef CAS.
- Z. Jiang, W. Wan, H. Li, S. Yuan, H. Zhao and P. K. Wong, Adv. Mater., 2018, 30, 1706108 CrossRef PubMed.
- S. Lee and J.-W. Park, Sustainability, 2020, 12, 2866 CrossRef CAS.
- S. Kang, J. Jang, R. C. Pawar, S.-H. Ahn and C. S. Lee, RSC Adv., 2018, 8, 33600–33613 RSC.
- N. Wang, L. Wu, J. Li, J. Mo, Q. Peng and X. Li, Sol. Energy Mater. Sol. Cells, 2020, 215, 110624 CrossRef CAS.
- C. Kim, K. M. Cho, K. Park, K. H. Kim, I. Gereige and H.-T. Jung, ChemPlusChem, 2020, 85, 169–175 CrossRef CAS.
- J. Wang, X. Zuo, W. Cai, J. Sun, X. Ge and H. Zhao, Dalton Trans., 2018, 47, 15382–15390 RSC.
- Y. Shen, Q. Han, J. Hu, W. Gao, L. Wang, L. Yang, C. Gao, Q. Shen, C. Wu, X. Wang, X. Zhou, Y. Zhou and Z. Zou, ACS Appl. Energy Mater., 2020, 3, 6561–6572 CrossRef CAS.
- Y. Geng, D. Chen, N. Li, Q. Xu, H. Li, J. He and J. Lu, Appl. Catal., B, 2021, 280, 119409 CrossRef CAS.
- C. Yang, J. Qin, S. Rajendran, X. Zhang and R. Liu, ChemSusChem, 2018, 11, 4077–4085 CrossRef CAS PubMed.
- P. Arora, A. P. Singh, B. R. Mehta and S. Basu, Vacuum, 2017, 146, 570–577 CrossRef CAS.
- J. Theerthagiri, R. A. Senthil, A. Priya, J. Madhavan, R. J. V. Michael and M. Ashokkumar, RSC Adv., 2014, 4, 38222–38229 RSC.
- Y. Wu, J. Ward-Bond, D. Li, S. Zhang, J. Shi and Z. Jiang, ACS Catal., 2018, 8, 5664–5674 CrossRef CAS.
- R. Khurram, Z. U. Nisa, A. Javed, Z. Wang and M. A. Hussien, Molecules, 2022, 27, 1442 CrossRef CAS PubMed.
- Z. Pan, G. Zhang and X. Wang, Angew. Chem., Int. Ed., 2019, 58, 7102–7106 CrossRef CAS PubMed.
- Y. Yang, L. Liu, Q. Qi, F. Chen, M. Qiu, F. Gao and J. Chen, Catal. Commun., 2020, 143, 106047 CrossRef CAS.
- M. Guo, M. Chen, J. Xu, C. Wang and L. Wang, Chem. Eng. J., 2023, 461, 142046 CrossRef CAS.
- Y. Li, X. Wei, X. Yan, J. Cai, A. Zhou, M. Yang and K. Liu, Phys. Chem. Chem. Phys., 2016, 18, 10255–10261 RSC.
- S. Xiong, X. Liu, X. Zhu, G. Liang, Z. Jiang, B. Cui and J. Bai, Ecotoxicol. Environ. Saf., 2021, 208, 111519 CrossRef CAS PubMed.
- A. Gasparotto, D. Barreca, D. Bekermann, A. Devi, R. A. Fischer, C. Maccato and E. Tondello, J. Nanosci. Nanotechnol., 2011, 11, 8206–8213 CrossRef CAS PubMed.
- M. Benedet, G. A. Rizzi, A. Gasparotto, O. I. Lebedev, L. Girardi, C. Maccato and D. Barreca, Chem. Eng. J., 2022, 448, 137645 CrossRef CAS.
- Y.-S. Jun, E. Z. Lee, X. Wang, W. H. Hong, G. D. Stucky and A. Thomas, Adv. Funct. Mater., 2013, 23, 3661–3667 CrossRef CAS.
- W. Liu, Z. Zhang, D. Zhang, R. Wang, Z. Zhang and S. Qiu, RSC Adv., 2020, 10, 28848–28855 RSC.
- L. Girardi, G. A. Rizzi, L. Bigiani, D. Barreca, C. Maccato, C. Marega and G. Granozzi, ACS Appl. Mater. Interfaces, 2020, 12, 31448–31458 CrossRef CAS PubMed.
- J. E. Thorne, J.-W. Jang, E. Y. Liu and D. Wang, Chem. Sci., 2016, 7, 3347–3354 RSC.
- M. E. A. Warwick, K. Kaunisto, D. Barreca, G. Carraro, A. Gasparotto, C. Maccato, E. Bontempi, C. Sada, T.-P. Ruoko, S. Turner and G. Van Tendeloo, ACS Appl. Mater. Interfaces, 2015, 7, 8667–8676 CrossRef CAS PubMed.
- S. Zhang, J. Yan, S. Yang, Y. Xu, X. Cai, X. Li, X. Zhang, F. Peng and Y. Fang, Chin. J. Catal., 2017, 38, 365–371 CrossRef CAS.
- http://imagej.nih.gov/ij/, Accessed January, 2023.
- https://xpspeak.software.informer.com/4.1/, Accessed December, 2022.
- M. Benedet, G. A. Rizzi, A. Gasparotto, N. Gauquelin, A. Orekhov, J. Verbeeck, C. Maccato and D. Barreca, Appl. Surf. Sci., 2023, 618, 156652 CrossRef CAS.
- Z. B. Chen, H. N. Dinh and E. Miller, Photoelectrochemical Water Splitting: Standards, Experimental Methods, and Protocols, Springer, 2013 Search PubMed.
- M. Benedet, A. Gasparotto, G. A. Rizzi, D. Barreca and C. Maccato, Surf. Sci. Spectra, 2022, 29, 024001 CrossRef CAS.
- M. Benedet, G. A. Rizzi, D. Barreca, A. Gasparotto and C. Maccato, Surf. Sci. Spectra, 2023, 30, 014004 CrossRef CAS.
- S. Benedoue, M. Benedet, A. Gasparotto, N. Gauquelin, A. Orekhov, J. Verbeeck, R. Seraglia, G. Pagot, G. A. Rizzi, V. Balzano, L. Gavioli, V. D. Noto, D. Barreca and C. Maccato, Nanomaterials, 2023, 13, 1035 CrossRef CAS PubMed.
- C. Feng, Z. Wang, Y. Ma, Y. Zhang, L. Wang and Y. Bi, Appl. Catal., B, 2017, 205, 19–23 CrossRef CAS.
- M. E. A. Warwick, D. Barreca, E. Bontempi, G. Carraro, A. Gasparotto, C. Maccato, K. Kaunisto, T. P. Ruoko, H. Lemmetyinen, C. Sada, Y. Gönüllü and S. Mathur, Phys. Chem. Chem. Phys., 2015, 17, 12899–12907 RSC.
- H. Tan, J. Verbeeck, A. Abakumov and G. Van Tendeloo, Ultramicroscopy, 2012, 116, 24–33 CrossRef CAS.
- https://eels.info/atlas .
- F. Ge, X. Li, M. Wu, H. Ding and X. Li, RSC Adv., 2022, 12, 8300–8309 RSC.
- F. J. Millero, R. Feistel, D. G. Wright and T. J. McDougall, Deep Sea Res., Part I, 2008, 55, 50–72 CrossRef.
- X. An, C. Hu, H. Lan, H. Liu and J. Qu, ACS Appl. Mater. Interfaces, 2018, 10, 6424–6432 CrossRef CAS PubMed.
- Y. Surendranath, M. W. Kanan and D. G. Nocera, J. Am. Chem. Soc., 2010, 132, 16501–16509 CrossRef CAS PubMed.
- M. D. Sharma and M. Basu, Langmuir, 2022, 38, 12981–12990 CrossRef CAS PubMed.
- C. Zachäus, F. F. Abdi, L. M. Peter and R. van de Krol, Chem. Sci., 2017, 8, 3712–3719 RSC.
- L. M. Peter, K. G. U. Wijayantha and A. A. Tahir, Faraday Discuss., 2012, 155, 309–322 RSC.
- B. Klahr, S. Gimenez, F. Fabregat-Santiago, T. Hamann and J. Bisquert, J. Am. Chem. Soc., 2012, 134, 4294–4302 CrossRef CAS PubMed.
- M. Barroso, A. J. Cowan, S. R. Pendlebury, M. Grätzel, D. R. Klug and J. R. Durrant, J. Am. Chem. Soc., 2011, 133, 14868–14871 CrossRef CAS PubMed.
- D. R. Gamelin, Nat. Chem., 2012, 4, 965–967 CrossRef CAS PubMed.
Footnote |
| † Electronic supplementary information (ESI) available. See DOI: https://doi.org/10.1039/d3ta04363k |
| This journal is © The Royal Society of Chemistry 2023 |

