Regulating the selective adsorption of OH* over the equatorial position of Co3O4via doping of Ru ions for efficient water oxidation reaction†
Ragunath
Madhu
 ab,
Arun
Karmakar
 ab,
Preethi
Arunachalam‡
c,
Jaisakthi
Muthukumar‡
c,
Pradeep
Gudlur
d and
Subrata
Kundu
 *ab
*ab
aAcademy of Scientific and Innovative Research (AcSIR), Ghaziabad 201002, India. E-mail: skundu@cecri.res.in; kundu.subrata@gmail.com; Fax: +91 4565-241487; Tel: +91 4565-241487
bElectrochemical Process Engineering (EPE) Division, CSIR-Central Electrochemical Research Institute (CECRI), Karaikudi 630003, Tamil Nadu, India
cCentre for Education (CFE), CSIR-Central Electrochemical Research Institute (CECRI), Karaikudi 630 003, Tamil Nadu, India
dDepartment of Mechanical Engineering, Union College, 807 Union Street, Schenectady, NY 12308, USA
First published on 18th September 2023
Abstract
The fabrication of highly active and durable electrocatalysts for the oxygen evolution reaction (OER) in alkaline and acidic environments is highly desirable. Herein, Co based benzene tricarboxylic acid derived Co3O4 nanorods doped with Ru3+ ions (Ru-Co3O4) are reported as an efficient electrocatalyst for the OER in both alkaline and acidic media. The highly porous network and distortion by electronic structural modulation in Co3O4 after doping of Ru3+ ions provide more active sites and ease the penetration of electrolyte, thereby enhancing the electron transport over exposed active metal sites. Operando/in situ Raman and electrochemical impedance spectroscopy (EIS) studies further reveal that optimal doping of Ru3+ ions over Co3O4 allowed the OER with a low applied potential. Moreover, Ru-Co3O4 15 delivers a lower overpotential of 292 and 365 mV to drive 10 mA cm−2 current density in alkaline and acidic media. Also, Ru-Co3O4 15 shows a high durability for 33 and 16.5 h in alkaline (1 M KOH) and acidic (0.5 M H2SO4) media, respectively, under potentiostatic conditions. The higher activity of Ru-Co3O4 15 is further evident from the volcanic relationship between the electronic charge and current density at 1.55 V, which demonstrates that the catalyst (Ru-Co3O4 15) will efficiently catalyze the OER by adhering to the Sabatier principle of ion adsorption at the ideal concentration of Ru3+ ions. Structural observation from density functional theory (DFT) reveals that after doping of Ru, the bond length between the Ru adjacent Co and O (Co–O) is increased (1.95 Å) compared to the Co–O bond in Co3O4 (1.92 Å). This favors the OER process by promoting the selective adsorption of OH− ions in the equatorial position of the dx2−y2 orbital with the least amount of energy.
Introduction
Due to the technological revolution and latest inventions and development, there is an immense need for energy in this modern society. Energy can be from both renewable and non-renewable sources. A large portion of non-renewable energy is obtained from carbon derived fuels like natural gas, petroleum, and coal. Continuous and overexploitation of these energy sources by mankind leads to the depletion of fossil fuels. This has an adverse effect on the environment and prompts researchers to find an alternative source of energy. Recently, hydrogen has been considered to be the building block of universe because of its high energy density and zero carbon dioxide (CO2) emission.1–3 Hydrogen can be produced by catalytic and partial oxidation of hydrocarbons, steam reforming of hydrocarbons, electrocatalytic and photo-electrocatalytic water splitting and gasification of coal.4–8 Among these methods, steam reforming and electrocatalytic water splitting are considered to be the most efficient ways of H2 production. The steam reforming process involves maintenance of high temperature and pressure conditions with the emission of carbon dioxide greenhouse gas (CO2). Electrocatalytic water splitting generates pure hydrogen without the emission of greenhouse gas CO2. It consists of two half-cell reactions; the anode is the site of oxidation, where the water oxidises to produce oxygen called the oxygen evolution reaction (OER) and the cathode is the site of reduction where the water undergoes reduction to produce hydrogen called the hydrogen evolution reaction (HER). Owing to the sluggish kinetics of the OER (4e−–4H+ process) compared to the HER, it requires an extra potential to overcome the activation energy barrier.9–11 Hence, proper selection of homogeneous or heterogeneous catalysts is required to increase the rate of the reaction by several orders of magnitude by lowering the activation energy barrier. Due to the high cost and low abundance of state-of-the-art catalysts IrO2/RuO2 for the OER and Pt/C for the HER, researchers are focusing on non-noble metal-based catalysts with low cost, more abundance, high activity, and long-term stability. Especially, acidic OER is highly challenging, because of the significant energy loss during the total water splitting, compared to overall water splitting in alkaline medium.Over the past few decades, transition metal-based materials such as metal oxides, sulphides, selenides, phosphides and so on, have been attractive as substantial electrocatalysts for the OER.3,9,12–17 Among them, transition metal-based oxides have been regarded as reliable OER electrocatalysts because of their outstanding catalytic activity and good electrochemical durability. Their limited intrinsic electrical conductivity, however, restricts their large scale applications than other noble metal-based catalysts.18–20 These flaws can be conquered by adapting structural modifications like doping and intercalation of foreign atoms, creation of heterostructures and oxygen vacancies, etc. Several Co-based catalysts like CoFePbOx, Co2TiO4, Co3O4/CeO2, Ba[Co-POM] and Ba-Co3O4 are considered as promising catalysts in acidic medium.21–25 For alkaline OER also, Co-based oxides like Fe-Co3O4, Ag@ Co3O4, Mn-Co3O4, Ru, Ni-Co3O4 and RuO2/Ru-Co3O4 will be excellent electrocatalysts.26–31 Recently, our group has developed CoCr2O4 and Co doped RuO2 as an efficient electrocatalyst for both alkaline and acid OER.32,33 In continuation of that study, we have engineered/modified the electronic structure of Co3O4via doping of Ru3+ ions and tested the OER in both alkaline and acidic environments.
Here in this study, rod shaped BTC derived Ru doped Co3O4 was synthesised by simple co-precipitation followed by annealing in an air atmosphere and doping of Ru3+ ions via hydrothermal treatment.32 The prepared Ru-Co3O4 15 delivers a good catalytic performance with a lower overpotential of 292 mV and 365 mV to reach a current density of 10 mA cm−2 in both alkaline and acidic media respectively. According to Sabatier principle of ion adsorption at the ideal concentration of Ru3+ ions, the catalyst (Ru-Co3O4 15) will efficiently catalyse the OER by adhering to volcanic relationship of the electronic charge vs. current densities at 1.55 V. Structure optimization studies proposed that after doping of Ru, the bond length between Co and O (Co–O) is increased (1.95 Å) compared to the Co–O bond in Co3O4 (1.92 Å). This favours the OER process by promoting the localized/selective adsorption of OH- ions in the equatorial position of the dx2−y2 orbital with the least amount of energy.
Results and discussion
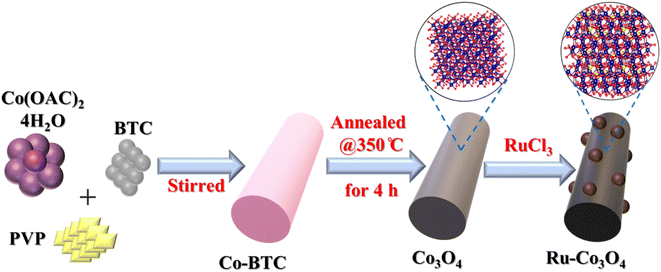
The BTC derived Ru doped Co3O4 was synthesised by a simple co-precipitation method followed by annealing and Ru doping via hydrothermal treatment. The schematic representation of the synthetic protocol is portrayed in Scheme 1. The synthesised materials are initially subjected to powder X-ray diffraction analysis (XRD) and the obtained high intense PXRD pattern of Co-BTC (benzene tricarboxylic acid) is displayed in Fig. S1.†.32,34 As a precursor, Co3O4 was prepared by annealing Co-BTC in an air atmosphere. The diffraction planes obtained (Fig. 1a) like (111), (022), (113), (222), (004), (224), (115) and (044) are attributed to Co3O4, which is exactly matched with the ICDD card no:98-010-3093, which confirms the material formation. After doping of different concentrations of RuCl3·XH2O (0.01, 0.015 and 0.02 g L−1), all the above obtained diffraction planes of Co3O4 exist and match with the same ICDD card no. Interestingly, after doping of Ru into Co3O4, the planes of (022) and (113) are slightly shifted towards higher 2θ values, suggesting the successful doping of Ru with the lattice contraction of Co3O4. For better understanding of shifting of planes (022) and (113) after Ru doping, the enlarged PXRD pattern is given in Fig. 1b.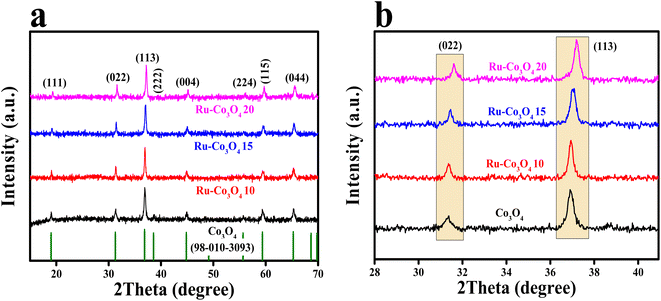 | ||
| Fig. 1 (a) PXRD patterns of Co-BTC derived Co3O4, Ru-Co3O4 10, Ru-Co3O4 15 and Ru-Co3O4 20; (b) enlarged PXRD pattern of (022) and (113) planes. | ||
The surface morphology of the as-prepared materials was analysed through field emission electron microscopy (FE-SEM) and the observed images are depicted in Fig. 2. From the obtained results, Co-BTC displayed a distorted rod-like morphology (Fig. 2a) and after annealing of Co-BTC, a porous nano-rod like structure of Co3O4 was obtained, as seen from Fig. 2b. After doping of Ru ions, the rod-like structure was retained as identified from the low and high magnification FE-SEM images of Ru-Co3O4 10, Ru-Co3O4 15 and Ru-Co3O4 20 in Fig. 2c–h respectively.
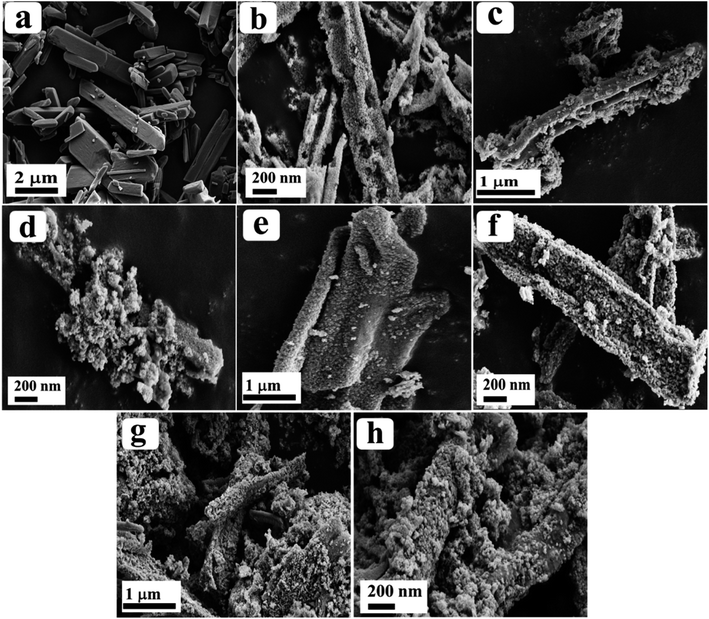 | ||
| Fig. 2 (a and b) FE-SEM images of Co-BTC and Co3O4; (c–h) low and high magnification FE-SEM images of Ru-Co3O4 10, Ru-Co3O4 15 and Ru-Co3O4 20, respectively. | ||
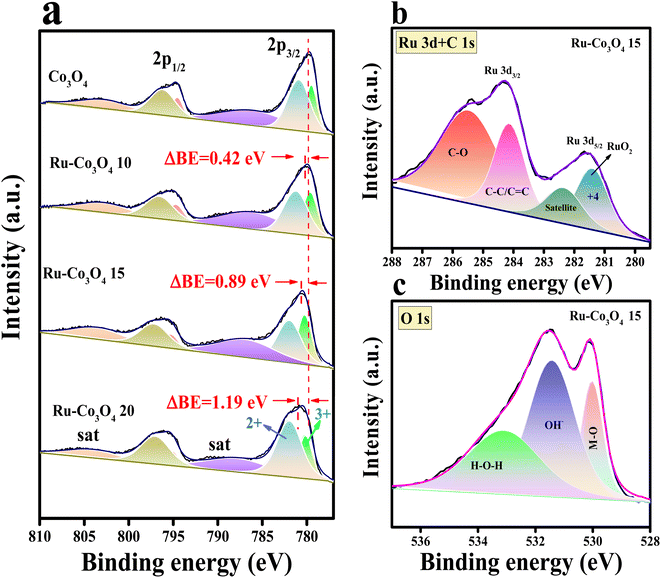
Furthermore, to obtain more insight into the morphological features, high resolution-transmission electron microscopy (HR-TEM) analysis was carried out for our best catalyst Ru-Co3O4 15 (in terms of activity) and the outcomes are provided in Fig. 3. Fig. 3a–c show the low to high magnification HR-TEM images of the nano-rod like structure of Ru-Co3O4 15, which is well consistent with the FE-SEM images (Fig. 2e and f). The high magnification HR-TEM images in Fig. 3d showed lattice fringes with a d-spacing value of 1.52 and 2.89 Å corresponding to the (022) and (115) planes of Co3O4 and mixed phases of RuCoOx respectively. Moreover, the dotted red and yellow lines distinguish the interface between Co3O4 and RuCoOx, which will promote the electron transfer during the OER process.19 These results evident the successful doping of Ru3+ ions into the lattice of Co3O4. Furthermore, selected area electron diffraction (SAED) in Fig. 3e displays a randomly arranged dotted diffraction pattern, suggesting the polycrystalline nature of Ru-Co3O4 15. The color mapping results portrayed in Fig. 3f–i reveal that all the expected elements like mixed elements, Ru, Co, and O respectively, are present over the rod-like structure. Furthermore, X-ray photoelectron spectroscopy (XPS) was employed to study the chemical composition and chemical state of the as-prepared catalyst and the obtained results are given in Fig. 4. Fig. 4a shows the comparison of the deconvoluted XPS spectra of Co 2p orbitals and the obtained two spin–orbit doublets around 780.62 and 796.11 eV correspond to the 2p3/2 and 2p1/2 orbitals respectively. Also, the peaks observed at a binding energy of 780.11 and 782.03 eV of 2p3/2 and 795.18 and 797.096 eV of 2p1/2 are indexed to the +3 and +2 oxidation states of Co in Co3O4.31,35 The corresponding satellite peaks are observed at 788.36 and 804.94 eV binding energy. Moreover, after doping of different concentrations of Ru3+ ions, the 2p3/2 and 2p1/2 orbitals are slightly shifted to a lower binding energy with a difference of 0.42, 0.89 and 1.19 eV for Ru-Co3O4 10, Ru-Co3O4 15 and Ru-Co3O4 20 compared to bare Co3O4. This shifting suggests that electron density around the Co site is reduced (Co3+), which might be due to the higher electronegativity of Ru (2.2) than Co (1.88). Notably, the calculated Co3+/Co2+ ratio by comparing the relative peaks is in the order of Co3O4 (0.91) < Ru-Co3O4 10 (1.018) < Ru-Co3O4 15 (1.032) > Ru-Co3O4 20 (1.011). This increase in the ratio of Co3+/Co2+ is mainly due to partial oxidation of Co2+ to Co3+ in the presence of Ru4+ ions (Co3+ active sites for the OER) which will promote the OER process. Fig. 4b displays the high-resolution XPS spectrum of Ru 3d in Ru-Co3O4 15 partially overlapped with the C 1s spectra. The two spin–orbit coupling maxima were observed at a binding energy of 281.55 and 284.31 eV corresponding to Ru 3d5/2 and 3d3/2, respectively. The deconvoluted Ru 3d5/2 evidences a +4-oxidation state of Ru (RuO2) at a binding energy of 281.43 eV with a corresponding satellite peak at 282.37 eV in all Ru doped Co3O4 materials.
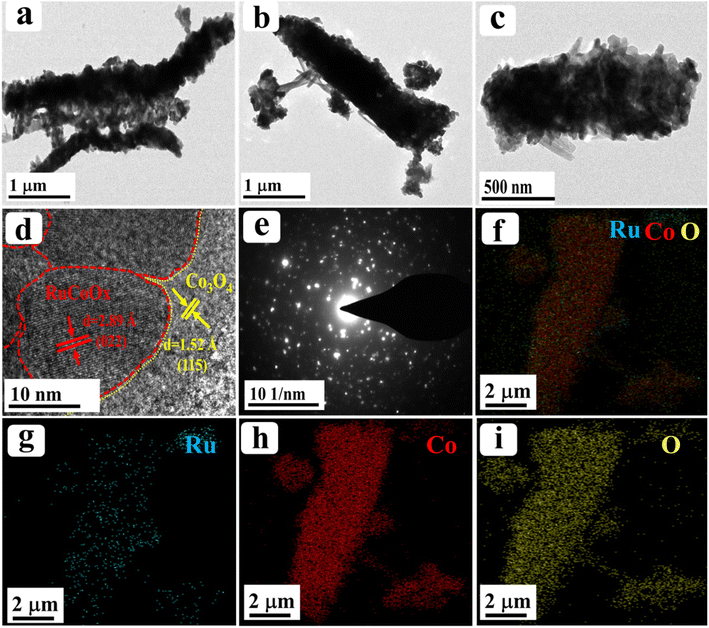 | ||
| Fig. 3 (a–d) Low and high magnification HR-TEM images of Ru-Co3O4 15; (e) corresponding SAED pattern; (f–i) elemental mapping results of mixed elements, Ru, Co, and O, respectively. | ||
Moreover, the other two peaks at 284.16 and 285.50 eV belong to the C–C/C![[double bond, length as m-dash]](https://www.rsc.org/images/entities/char_e001.gif) C and C–O of the overlapped C 1s spectrum.36–39 The deconvoluted O 1s spectrum of Ru-Co3O4 15 shows three characteristic peaks at a binding energy of 529.41, 531.44 and 533.14 eV attributed to metal oxide, hydroxide and surface adsorbed water molecules respectively.40 In addition, the comparison of the O 1s orbital of all as-prepared catalysts is shown in Fig. S2.† These results demonstrate that with the increase in the concentration of Ru ions, the bond length between M and oxide (M–O) is varied, as evident from the higher binding energy shifting of the M–O bond when compared with Co3O4. From this binding energy shift, it was observed that Ru-Co3O4 15 is shifted more (0.13 eV) towards the higher binding side than the other catalysts (Ru-Co3O4 10 (0.11 eV) and Ru-Co3O4 20 (0.08 eV)), which possess a moderate adsorption/desorption energy of reagent OH− and H2O molecules. From the above results, it was expected that Ru-Co3O4 10 will exhibit a better catalytic OER performance. Later, to determine the specific surface area of all as-prepared catalysts, N2 adsorption–desorption isotherm analysis was carried out and the observed isotherms are given in Fig. S3a–d.† From these results it was observed that the catalysts Co3O4, Ru-Co3O4 10, Ru-Co3O4 15 and Ru-Co3O4 20 possess a type-II isotherm with a specific surface area of 20.012, 35.712, 44.129 and 27.881 m2 g−1 respectively. These results evidence that Ru-Co3O4 15 hold a high specific surface area, thereby providing more active sites for the conversion of O2 molecules in both acidic and alkaline media.
C and C–O of the overlapped C 1s spectrum.36–39 The deconvoluted O 1s spectrum of Ru-Co3O4 15 shows three characteristic peaks at a binding energy of 529.41, 531.44 and 533.14 eV attributed to metal oxide, hydroxide and surface adsorbed water molecules respectively.40 In addition, the comparison of the O 1s orbital of all as-prepared catalysts is shown in Fig. S2.† These results demonstrate that with the increase in the concentration of Ru ions, the bond length between M and oxide (M–O) is varied, as evident from the higher binding energy shifting of the M–O bond when compared with Co3O4. From this binding energy shift, it was observed that Ru-Co3O4 15 is shifted more (0.13 eV) towards the higher binding side than the other catalysts (Ru-Co3O4 10 (0.11 eV) and Ru-Co3O4 20 (0.08 eV)), which possess a moderate adsorption/desorption energy of reagent OH− and H2O molecules. From the above results, it was expected that Ru-Co3O4 10 will exhibit a better catalytic OER performance. Later, to determine the specific surface area of all as-prepared catalysts, N2 adsorption–desorption isotherm analysis was carried out and the observed isotherms are given in Fig. S3a–d.† From these results it was observed that the catalysts Co3O4, Ru-Co3O4 10, Ru-Co3O4 15 and Ru-Co3O4 20 possess a type-II isotherm with a specific surface area of 20.012, 35.712, 44.129 and 27.881 m2 g−1 respectively. These results evidence that Ru-Co3O4 15 hold a high specific surface area, thereby providing more active sites for the conversion of O2 molecules in both acidic and alkaline media.
Electrocatalytic OER performance in alkaline medium (1 M KOH)
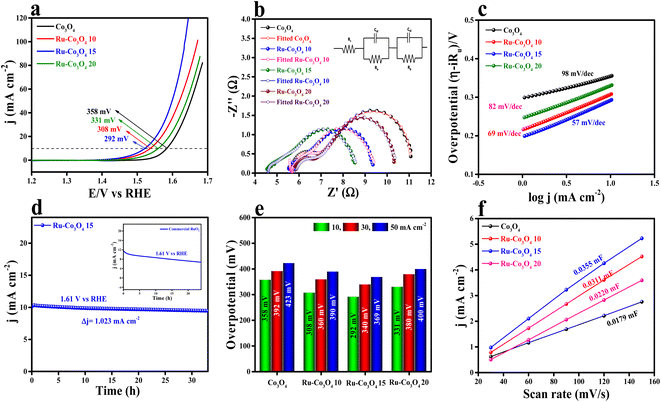
The electrochemical study of all the BTC derive Ru doped Co3O4 materials was carried out in a conventional three-electrode system (see the ESI†) in 1 M aqueous KOH solution and the results are displayed in Fig. 5. Forward linear sweep voltammetry (LSV) was utilized (80% iR-compensated) to characterize the overpotential of all the as-prepared catalysts. LSV polarization outcomes depicted in Fig. 5a show that Ru-Co3O4 15 exhibits a superior catalytic OER performance with a lower overpotential of 292 mV to attain a 10 mA cm−2 current density. The catalysts Ru-Co3O4 10, Ru-Co3O4 20 and Co3O4 exhibit an overpotential of 308, 331 and 358 mV to reach an equivalent 10 mA cm−2 current density. For comparison, commercial RuO2 was taken, which showed an overpotential of 330 mV to reach the same benchmarking current density (Fig. S4†). Later, electrochemical impedance spectroscopy (EIS) was carried out at an applied potential of 0.7 V (vs. Hg/HgO) to examine the charge transfer resistance (Rct) of all the catalysts (Fig. 5b). From the EIS results, it was observed that Ru-Co3O4 15 exhibits a lower Rct of 3.38 Ω, whereas Ru-Co3O4 10, Ru-Co3O4 20 and Co3O4 show a Rct of 3.94 Ω, 4.56 Ω, and 5.49 Ω respectively. The lower Rct value of Ru-Co3O4 15 signifies a lower resistance towards the electron transfer at the electrode–electrolyte interface. The inset of Fig. 5b shows the fitted equivalent circuit diagram of all the catalysts.To determine the electron transfer kinetics at the electrode interface, the Tafel slope was derived from the iR drop free LSV polarization outcomes and the determined Tafel slope results are given in Fig. 5c. From Fig. 5c, it was observed that Ru-Co3O4 15 shows a lower Tafel slope value of 57 mV dec−1 than Ru-Co3O4 10 (69 mV dec−1), Ru-Co3O4 20 (82 mV dec−1) and Co3O4 (98 mV dec−1). These results propose that around the electrode–electrolyte interface the electron transfer kinetics would be faster in the case of Ru-Co3O4 15. Moreover, the long-term static stability of Ru-Co3O4 15 was tested by chronoamperometric analysis. The chronoamperometric analysis in Fig. 5d insists that Ru-Co3O4 15 is highly stable up to 33 h with an applied potential of 0.69 V (vs. Hg/HgO) with a very minimal degradation from the initial current density (3.23 mA cm−2). Moreover, the stability was compared with that of commercial RuO2, which was stable up to only 24 h in the same electrolyte medium with a very high dissolution rate from the initial current density. In addition, we have evaluated the overpotential at different current densities (10, 30 and 50 mA cm−2), which is portrayed as a bar diagram in Fig. 5e. The bar diagram also evidences that Ru-Co3O4 15 exhibits superior OER performance even at higher current densities to the other catalysts. Apart from extrinsic activities, the intrinsic activities of all the electrocatalysts were evaluated. Firstly, double layered capacitance (Cdl) was calculated by recording the CVs at different scan rates (30, 60, 90, 120 and 150 mV s−1) in a potential range between 1.07 and 1.27 V (vs. RHE) for all the catalysts and the recorded CVs are presented in Fig. S5a–d.† As shown in Fig. 5f, Cdl values were determined by calculating the slope of cathodic and anodic current densities obtained from the CVs. The calculated Cdl values are 0.0179, 0.0311, 0.0355 and 0.0220 mF cm−2 for Co3O4, Ru-Co3O4 10, Ru-Co3O4 15 and Ru-Co3O4 20 respectively. Besides, the electrochemically active surface area (ECSA) was determined from the obtained Cdl values by employing the formula: ECSA = Cdl/Cs, where Cs is the specific capacitance of the flat electrode surface (0.040 mF cm−2).41 The calculated ECSA values are 0.4475, 0.7775, 0.8875 and 0.55 cm2 for Co3O4, Ru-Co3O4 10, Ru-Co3O4 15 and Ru-Co3O4 20, respectively. As evident from the BET analysis, these results put forward that Ru-Co3O4 15 possesses a large number of active sites for the generation of oxygen molecules at lower applied potential. The specific activity (Fig. S6a†) of all the catalyst was analysed by normalizing the geometrical LSV polarization outcomes with the obtained ECSA values. The ECSA normalized LSV results obey the same activity trend with the geometrical LSV results with an overpotential of 285, 296, 305 and 331 mV for Ru-Co3O4 15, Ru-Co3O4 10, Ru-Co3O4 20 and Co3O4 respectively to reach the same current density. Moreover, a mass dependent activity study was performed by normalizing the geometrical LSV results with the catalyst loading and the corresponding results are given in Fig. S6b.† The performed mass dependent activity study shows that Ru-Co3O4 15 delivers a better OER performance with an overpotential of 289 mV than the other catalysts Ru-Co3O4 10 (307 mV), Ru-Co3O4 20 (330 mV) and Co3O4 (355 mV) with a very small amount of loading of ∼1.0 mg cm−2.
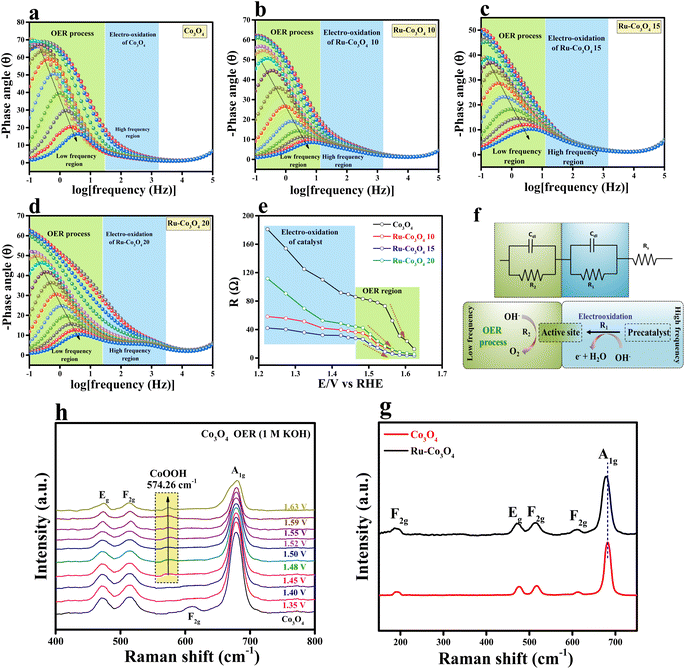
Furthermore, to understand the electron transfer kinetics at the electrode–electrolyte boundary operando-EIS analysis was carried out at different potentials and the obtained Nyquist plots are provided in Fig. S7a–d.† The accompanying Nyquist plot illustrates the various electrochemical behaviours of all electrocatalysts. In addition, we have analysed the Bode plot for all catalysts and the recorded plots are provided in Fig. 6a–d. The reagent (OH−) that has been adsorbed or desorbed on the electrode surface is depicted in the Bode plot's regions. The oxidation of the electrocatalyst is perceived in the high-frequency zone (HF), while the uneven distribution of the oxidising agent at the electrode interface is exposed in the low-frequency zone (LF).42,43 From Fig. 6e, it is seen that from 1.22 to 1.46 V (vs. RHE) applied voltage, the phase angle in the HF region starts to decrease, signifying the oxidation of the electrocatalyst. Moreover, above 1.48 V (vs. RHE), a significant drop in the phase angle in the LF area denotes the commencement of the OER process. A two-equivalent circuit (R1 and R2) which is connected consecutively was employed for fitting the EIS data. A simplified representation of the OER process occurring at the electrode interface with respect to EIS analysis is given in Fig. 6f. From these results, it is understood that Ru-Co3O4 15 catalyses the OER at a lower applied potential by unveiling low interface resistance than the remaining catalysts. Later, Raman spectra were analysed for Co3O4 and Ru-Co3O4 samples to understand the local environment of the catalyst and the obtained results are provided in Fig. 6g. The Raman results displayed five characteristic peaks at a Raman shift value of 191.76, 476.48, 516.40, 613.10, and 682.84 cm−1 ascribed to the 3 × F2g, E2g and A1g phonon modes of typically structured Co3O4, respectively. The obtained Raman shift at 191.76 cm−1 (F2g) is attributed to the tetrahedral site of CoO4 and ascribed to Co2+–O2−. The Raman shift at 682.8 cm−1 is attribute to the A1g species of the octahedral sites of CoO6, which corresponds to Co3+–O2−.44,45 In the case of Ru-Co3O4, the Raman shift at around 682.8 cm−1 (A1g) shows a red-shift, suggesting an increase in crystallinity and reduction of the crystalline size compared to Co3O4. On the other hand, the E2g (476.48 cm−1) and F2g modes are combinedly related to the tetrahedral and octahedral oxygen sites. Besides, the moderate increase in the intensity of A1g is due to the variation of the Co2+/Co3+ ratio on the surface of the catalyst.46 Moreover, with the gradual increase of potential by using the chronoamperometric technique, the in situ/Operando Raman spectra of Ru-Co3O4 15 were collected and are depicted in Fig. 6h. From these results, it was observed that up to 1.45 V (vs. RHE) there is no structural change (i.e., no OER) and the initial condition of the Ru-Co3O4 15 electrode is retained during the OER process. Interestingly, beyond 1.46 V a new peak (574.26 cm−1) corresponding to CoOOH was observed, indicating the evolution of oxygen.45,47,48 Moreover, as seen in Fig. 6h, with the rise of applied potential (above 1.46 V vs. RHE) the intensity of CoOOH increases with the simultaneous reduction of other characteristic peaks. These in situ results further evident that the OER commences at lower applied potential with Co as the active site, which is more easily oxidised to CoOOH at low applied potential.49–51
Furthermore, to gain deep knowledge about the intrinsic activity, the turnover frequencies of all the catalysts were calculated and are given as a bar diagram in Fig. 7a. The calculated TOF at two different overpotentials (350 and 370 mV) demonstrates that Ru-Co3O4 15 exhibits higher TOF values (4.47478 and 6.64403 × 10⁻⁵ s−1) than the residual catalyst, respectively. The higher TOF values put forward that Ru-Co3O4 15 generates a large number of O2 molecules per second per unit area. The bar diagram showed a TOF value trend like an inverted parabolic curve and the calculated TOF values are listed in Table S1†. Also, through a rotating ring-disk electrode (RRDE) experiment, the faradaic efficiency (FE) of the most effective catalyst (Ru-Co3O4 15) is evaluated. The obtained result (Fig. S8†) showed a desirable efficiency of 95.31% in alkaline medium. The oxygen bubbles generated at the disc were reduced by the Pt ring at a constant potential of −0.3 V. This remarkable FE demonstrates that the Ru-Co3O4 15 catalyst possesses high selectivity towards the OER. The dynamic stability of Ru-Co3O4 15 was analysed by performing an accelerated degradation (AD) study for 1000 CV cycles at a scan rate of 150 mV s−1 and LSV polarization curves were recorded after CV cycling, as provided in Fig. S9a.† The AD study outcomes evidence the highly robust nature of Ru-Co3O4 15, where a very less degradation of overpotential (22 mV) was observed after the 1000 CV cycles. Also, EIS analysis exhibits the same in well accordance with the LSV outcomes (Fig. S9b†). The decrease of OER activity with the gradual increase of CV cycles might be due to accumulation of charge over the electrode surface during the OER process, which simultaneously decreases the adsorption of the reagent (OH−). In addition, the electrochemical performance of Ru-Co3O4 15 was compared with that of similar reported electrocatalysts (Table S3†).
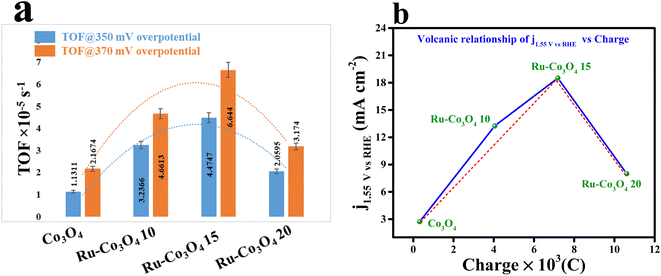 | ||
| Fig. 7 (a) TOF values of all the catalysts at 350 and 370 mV overpotentials; (b) volcanic relationship of current density at 1.55 V (vs.) RHE vs. charge. | ||
Influence of Ru3+ ion concentration on OER performance
It is worth noting that the accumulation of charge over the electrode surface will greatly differ based on the surface engineering of the nanostructure throughout the OER process. The adsorption and desorption of electroactive surfaces are significantly influenced by this charge accumulation over the electrode surface. By using the redox features (oxidation peak), the accumulation of charge over the electrode surface of all four catalysts was estimated and is presented in Fig. S10a–d.† These redox features suggest that with the increase in the concentration of Ru ions the charge accumulated over the electrode surface was considerably increased. Therefore, the increased charge over the electrode surface will facilitate the OH− adsorption and thereby increase the performance towards the OER. But interestingly it is observed that Ru-Co3O4 15 will exhibit a superior OER performance to the other electrocatalysts. In this regard, it is significant to remember that while an increase in the number of positive charges may improve OH− adsorption, it would hinder the release of O2 in the last stage. As a result, an ideal accumulation of positive charge would constantly provide a balance with the processes of adsorption and desorption.52 To further prove this, the calculated charge from the redox features is plotted against the current density measured at 1.55 V (vs. RHE) (Fig. 7b), demonstrating a volcanic relationship, where Ru-Co3O4 15 holds a highest peak position compared to the other catalysts. This result suggests that Ru-Co3O4 15 will obey the Sabatier adsorption principle in heterogeneous catalysis and provides the moderate accumulation of charge over the electrode surface during the adsorption/desorption process.53–55 Therefore, the optimized concentration of foreign ions will moderately optimize the energy for balancing the adsorption and desorption of intermediates during the OER process.Electrocatalytic OER performance in acidic medium (0.5 M H2SO4)
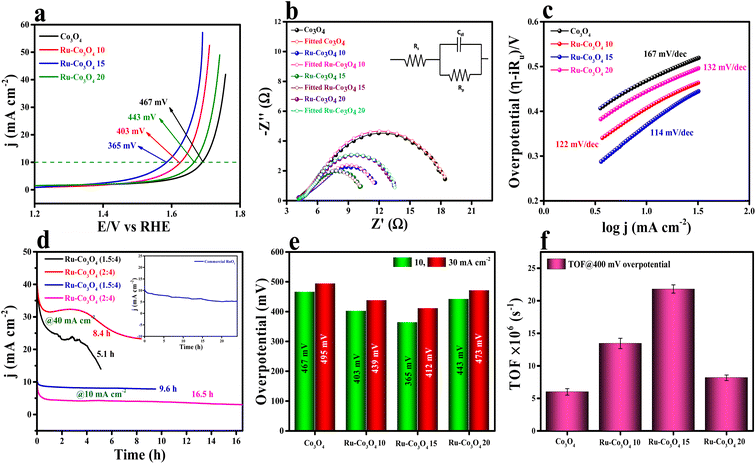
The electrocatalytic studies of all the as-prepared catalysts were again performed in acidic medium (0.5 M H2SO4) by using a conventional three-electrode system (see the ESI†). The LSV polarization study (75% iR compensation) shown in Fig. 8a reveals that Ru-Co3O4 15 delivers a better catalytic performance with a lower overpotential of 365 mV to reach a current density of 10 mA cm−2. Besides Ru-Co3O4 10, Ru-Co3O4 20 and Co3O4 exhibit an overpotential of 403, 443 and 467 mV to reach the same current density. For comparison, commercial RuO2 was taken and showed an overpotential of 349 mV to reach 10 mA cm−2 current density (Fig. S11†). EIS analysis results in Fig. 8b also well agree with the LSV outcomes, where Ru-Co3O4 15 (6.22 Ω) possess a lower Rct value than Ru-Co3O4 10 (7.76 Ω), Ru-Co3O4 20 (9.82 Ω) and Co3O4 (15.25 Ω). The lower Rct value of Ru-Co3O4 15 demonstrates low resistance towards electron transfer at the electrode interface during the OER in 0.5 M H2SO4. Furthermore, the inset of Fig. 5b shows the fitted equivalent circuit diagram of all the catalysts. Moreover, the Tafel slope has been derived from the iR compensated LSV outcomes and the obtained slope with a linear fitting is provided in Fig. 8c. The obtained Tafel plot shows that Ru-Co3O4 15 displays a low Tafel slope value of 114 mV dec−1, whereas Ru-Co3O4 10, Ru-Co3O4 20 and Co3O4 possess a Tafel slope of 122, 132 and 167 mV dec−1 respectively. The lower Tafel slope value of Ru-Co3O4 15 facilitates the OER by exhibiting faster electron transfer kinetics at the electrode–electrolyte interface than the other catalysts. Furthermore, the long-term static stability (Fig. 8d) of the catalyst (Ru-Co3O4 15) was tested by chronoamperometric analysis at two different current densities of 10 and 40 mA cm−2. At 10 mA cm−2 Ru-Co3O4 15 showed a better stability of 16.5 h and 9.6 with a binder and catalyst loading ratio of (2![[thin space (1/6-em)]](https://www.rsc.org/images/entities/char_2009.gif) :
:![[thin space (1/6-em)]](https://www.rsc.org/images/entities/char_2009.gif) 4) and (1.5
4) and (1.5![[thin space (1/6-em)]](https://www.rsc.org/images/entities/char_2009.gif) :
:![[thin space (1/6-em)]](https://www.rsc.org/images/entities/char_2009.gif) 4) respectively. At 40 mA cm−2 current density we observed stability for only 8.4 and 5.1 h for (2
4) respectively. At 40 mA cm−2 current density we observed stability for only 8.4 and 5.1 h for (2![[thin space (1/6-em)]](https://www.rsc.org/images/entities/char_2009.gif) :
:![[thin space (1/6-em)]](https://www.rsc.org/images/entities/char_2009.gif) 4) and (1.5
4) and (1.5![[thin space (1/6-em)]](https://www.rsc.org/images/entities/char_2009.gif) :
:![[thin space (1/6-em)]](https://www.rsc.org/images/entities/char_2009.gif) 4) ratios, respectively. This suggests that our catalyst showed better stability at 10 mA cm−2 current density. Moreover, the stability was compared with that of commercial RuO2 (inset of Fig. 8d), which was stable for only up to 24 hours in the same electrolyte medium. In addition, we have determined an overpotential at two different current densities (10 and 30 mA cm−2) and found that even at higher current density Ru-Co3O4 15 delivered a better catalytic performance with a low overpotential than the other catalysts (Fig. 8e). To determine the intrinsic activity of the catalyst in acidic medium, CV curves were recorded in a potential window of 1.0 to 1.1 V (vs. RHE) at different scan rates and the obtained CV curves are provided in Fig. S12a–d.† From the recorded CV curves, double layered capacitance (Cdl) was determined (Fig. S12e†) and the Cdl values are 0.0113, 0.01289, 0.01356 and 0.01253 mF for Co3O4, Ru-Co3O4 10, Ru-Co3O4 15 and Ru-Co3O4 20, respectively. The ECSA values are determined from the above obtained Cdl values and are 0.2825, 0.3225, 0.339 and 0.3132 cm2, suggesting that Ru-Co3O4 15 has a larger number of active sites for the adsorption/desorption of the reagent (H2O). From the calculated ECSA values, the geometrical LSV results are normalized and the specific activity of all the catalysts was determined, as seen in Fig. S13a.† The obtained specific activity showed a similar trend to geometrical LSV results with a much lower overpotential of 233, 280, 309 and 314 mV for Ru-Co3O4 15, Ru-Co3O4 10, Ru-Co3O4 20 and Co3O4 to reach a current density of 10 mA cm−2, respectively.
4) ratios, respectively. This suggests that our catalyst showed better stability at 10 mA cm−2 current density. Moreover, the stability was compared with that of commercial RuO2 (inset of Fig. 8d), which was stable for only up to 24 hours in the same electrolyte medium. In addition, we have determined an overpotential at two different current densities (10 and 30 mA cm−2) and found that even at higher current density Ru-Co3O4 15 delivered a better catalytic performance with a low overpotential than the other catalysts (Fig. 8e). To determine the intrinsic activity of the catalyst in acidic medium, CV curves were recorded in a potential window of 1.0 to 1.1 V (vs. RHE) at different scan rates and the obtained CV curves are provided in Fig. S12a–d.† From the recorded CV curves, double layered capacitance (Cdl) was determined (Fig. S12e†) and the Cdl values are 0.0113, 0.01289, 0.01356 and 0.01253 mF for Co3O4, Ru-Co3O4 10, Ru-Co3O4 15 and Ru-Co3O4 20, respectively. The ECSA values are determined from the above obtained Cdl values and are 0.2825, 0.3225, 0.339 and 0.3132 cm2, suggesting that Ru-Co3O4 15 has a larger number of active sites for the adsorption/desorption of the reagent (H2O). From the calculated ECSA values, the geometrical LSV results are normalized and the specific activity of all the catalysts was determined, as seen in Fig. S13a.† The obtained specific activity showed a similar trend to geometrical LSV results with a much lower overpotential of 233, 280, 309 and 314 mV for Ru-Co3O4 15, Ru-Co3O4 10, Ru-Co3O4 20 and Co3O4 to reach a current density of 10 mA cm−2, respectively.
Moreover, the specific activity of Ru-Co3O4 15 was 1.56 times the geometrical activity. In addition, mass dependent activity analysis in Fig. S13b† also evidences that Ru-Co3O4 15 delivers a superior activity with an overpotential of 359 mV to the catalysts Ru-Co3O4 10 (339 mV), Ru-Co3O4 20 (438 mV) and Co3O4 (461 mV) at a very small amount of ∼1.0 mg cm−2 catalyst loading. Later, the TOFs (Fig. 8f) of all the catalysts were determined at 400 mV overpotential and were 6.00845, 13.44289, 21.8065 and 8.17688 × 10⁻⁶ s−1 for Co3O4, Ru-Co3O4 10, Ru-Co3O4 15 and Ru-Co3O4 20, respectively. The TOF values again suggest that Ru-Co3O4 15 will evolve a large number of O2 molecules per second per unit area compared to the other catalysts. Moreover, the robustness of the catalyst was tested by an AD study for 500 CV cycles in a 0.5 M H2SO4 solution and the recorded LSV curve is provided in Fig. S14a.† The LSV results show that upon continuous CV cycles the charge accumulated over the surface of the electrode is reduced and leads to reduction in the OER activity with an overpotential difference of 33 mV to attain an equivalent current density. After the LSV study, EIS analysis (Fig. S14b†) showed a similar trend with a reduction of the Rct (1.86 Ω) value compared to that before CV cycling. Furthermore, we have compared the electrochemical performance of Ru-Co3O4 15 with that of similar reported electrocatalysts, as seen in Table S4†.
Post-characterisation of Ru-Co3O4 15
Furthermore, under harsh anodic conditions, the composition, morphology and chemical nature of the catalyst Ru-Co3O4 15 have been analysed. To know the structural composition of the Ru-Co3O4 initially, XRD analysis (Fig. S15a†) was done and from the results it was observed that Ru-Co3O4 15 is structurally exist with the respective planes as evident from the ICDD card no: 00-010-3093. In addition, two other peaks at a 2θ value of 18.32 and 25.9° were observed, corresponding to substrate carbon. Unfortunately, we have not observed any peak for CoOOH or it may be masked by the highly intense substrate carbon peak. Besides, after OER analysis, a shift in two planes (022) and (113) was observed in both alkaline and acidic media (Fig. S15b†). Interestingly, from Raman analysis, we have observed a new characteristic peak of CoOOH (569.97 cm−1) under harsh anodic conditions in 0.5 M H2S O4 solution along with other characteristic peaks of Ru-Co3O4 15 (Fig. S16†). Like in alkaline medium (Fig. 6h), these results also suggest that Co acts an active site and participated in the OER process in acidic medium. XPS analysis in Fig. S17a† shows that Co is present in +2 and +3 states after OER analysis in alkaline and acidic environments. Besides, after OER analysis the +3-oxidation state is shifted towards lower binding energy with a difference of 0.44 and 0.29 eV in alkaline and acidic environments, respectively. This suggests that Co3+ highly participates in the water oxidation reaction under both alkaline and acidic conditions. Furthermore, combined XPS spectra of Ru 3d + C1s are depicted in Fig. S17b.† From the XPS results, a RuO2 peak was observed only after the post OER in alkaline medium and not in the case of post acidic OER. This suggests the leaching of RuO2 (evident from ICP-MS) as RuO4 in 0.5 M H2SO4 acidic electrolyte in the continuous chronoamperometric analysis, which limited the long-term static stability of the catalyst Ru-Co3O4 15. Furthermore, in the O 1s XPS spectrum in Fig. S17c,† a shift in the binding energy of the M–O bond in both alkaline and acidic environments was observed, suggesting the oxidation of metal during the OER process. Furthermore, the nanorod-like structure of Ru-Co3O4 15 was evident from the HR-TEM analysis (Fig. S18a and b†) even after prolonged OER analysis in 1 M KOH solution. Moreover, the lattice fringes depicted in Fig. S18c† showed lattice fringes with a d spacing value of 1.54 (115) and 1.42 Å (044) corresponding to the mixed phase of RuCoOx and Co3O4, respectively. The polycrystalline nature of Ru-Co3O4 15 was evident from the SAED pattern (Fig. S18d†). Besides, the color mapping results (Fig. S18e–h†) confirmed the presence of all the expected elements like Co, Ru, O and K, respectively. In the case of acidic OER also, the nano-rod like structure was retained (Fig. S19a and b†). Furthermore, the polycrystalline nature was evident from Fig. S19c.† The elemental mapping results displayed the presence of all the expected elements like Co, Ru and O (Fig. S19c–e†). But the concertation of Ru is very less, when compared to before the stability study, which might be due to the leaching of Ru as RuO4 during the prolonged OER process in a highly corrosive environment. To further confirm this, ICP-MS analysis was carried out and the corresponding results are given in Table S5 and S6.† From these results, it is clear that 3.5 ppm of Ru is leached from the sample, whereas Co is 0.05 ppm after OER analysis in 0.5 M H2SO4 solution. The above post-characterisation outcomes suggest that Ru-Co3O4 15 is highly stable in alkaline medium rather than acidic medium.Ru doping influence on the selective adsorption of OH− ions
The above experimental results suggest that Ru doped Co3O4 more predominantly catalyzes the OER process in both alkaline and acidic media than bare Co3O4. The high performance of Ru doped Co3O4 is predicted by structural optimization studies. Fig. S20a and b† depict the optimized structure of bare Co3O4 and Ru-Co3O4. After the doping of Ru over Co3O4 the bond length between the Ru adjacent Co and O (Co–O) is increased (1.95 Å) compared to the Co–O bond in Co3O4 (1.92 Å) (Fig. S21a and b†). This increase in the bond length of the octahedral dz2 orbital (Co–O) leads to localized/selective adsorption of OH− ions, where OH− will easily get adsorbed by the low energy dx2−y2 orbital at an equatorial position with a minimal amount of external energy. But, when compared to bare Co3O4, there is no elongation of the dz2 orbital (Co–O) and it leads to degenerate adsorption of OH− ions (non-selective adsorption) by demanding more external energy than Ru-Co3O4. The possible splitting of d orbitals and selective adsorption of OH− during the OER are schematically shown in Fig. 9. The localized availability of the adsorbing orbital as a result of distortion leads to specific adsorption of OH− with high selectivity and favored energetics. On the other hand, the degenerate availability of optional orbitals would lead to marginal decrease in energy and favor the OH− adsorption.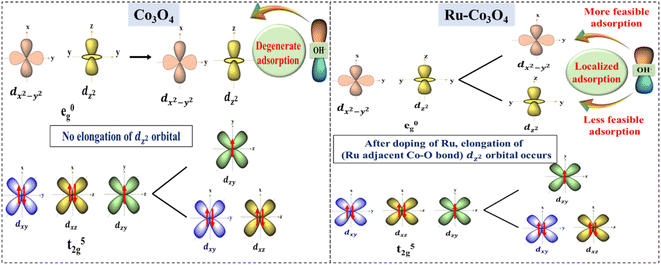 | ||
| Fig. 9 Predicted possible electronic modulation of Co3O4 (left) after doping with Ru ions (right) towards high performance OER. | ||
Conclusion
In summary, we have synthesized Co based benzene tricarboxylic acid (BTC) derived Co3O4 nanorods doped with Ru3+ ions (Ru-Co3O4) and subjected them to the OER in both alkaline and acidic media. The highly porous nature and distortion of the electronic structure after doping of Ru3+ ions will offer more exposed active sites. Operando/in situ Raman and electrochemical impedance spectroscopy (EIS) studies further reveal that optimal doping of Ru3+ will instigates the OER at a lower applied potential. Moreover, Ru-Co3O4 15 delivers a much lower overpotential of 292 and 365 mV to reach 10 mA cm−2 current density, with a static stability of 33 and 16.5 h in alkaline and acidic media, respectively. The higher activity of Ru-Co3O4 15 is further evidenced by the volcanic relationship between the electronic charge and current density at 1.55 V vs. RHE. This volcano relationship demonstrates that the catalyst may efficiently catalyze the OER by adhering to the Sabatier principle of ion adsorption at the ideal concentration of Ru3+ ions. Moreover, a DFT study reveals that after doping of Ru over Co3O4, the bond length between the Ru adjacent Co and O (Co–O) is increased (1.95 Å) compared to the Co–O bond in Co3O4 (1.92 Å). This leads to localized/selective adsorption of OH− ions at the equatorial position of the dx2−y2 orbital with a minimal amount of energy and favors the OER process. Moreover, post-studies revealed the stable nature of Ru-Co3O4 15 in alkaline medium rather than acidic medium. This study may pave the way for cutting-edge nanostructured materials that are efficiently employed for electrochemical energy conversion.Conflicts of interest
There are no conflicts to declare.Acknowledgements
Ragunath Madhu wishes to acknowledge the Department of Science and Technology (DST) for the Inspire Fellowship (SRF). Arun Karmakar wishes to acknowledge CSIR-HRDG for the SRF fellowship. S Kundu acknowledges DST, New Delhi for HCF (Hydrogen and Fuel Cell) research funding DST/TMD/HFC/2K18/60 and for CRG research funding # CRG/2021/001089. Moreover, authors want to thank Dr N. Lakshminarashiman, Head PPMG section, CSIR-CECRI for providing suggestion of the work. Also, the authors want to thank D. Mahendiran and P. Murugan for the structural optimization. CSIR-CECRI Manuscript number: CECRI/PESVC/Pubs/2023-081.References
- J. O. M. Bockris, Int. J. Hydrogen Energy, 2002, 27, 731–740 CrossRef.
- S. Anantharaj, S. R. Ede, K. Karthick, S. Sam Sankar, K. Sangeetha, P. E. Karthik and S. Kundu, Energy Environ. Sci., 2018, 11, 744–771 RSC.
- R. Madhu, A. Karmakar, K. Bera, S. Nagappan, H. N. Dhandapani, A. De, S. S. Roy and S. Kundu, Mater. Chem. Front., 2023, 7, 2120–21524 RSC.
- P. P. Edwards, V. L. Kuznetsov, W. I. F. David and N. P. Brandon, Energy Policy, 2008, 36, 4356–4362 CrossRef.
- S. Chen, C. Pei and J. Gong, Energy Environ. Sci., 2019, 12, 3473–3495 RSC.
- R. D. Cortright, R. R. Davda and J. A. Dumesic, Nature, 2002, 418, 964–967 CrossRef CAS.
- S. Anantharaj, S. R. Ede, K. Sakthikumar, K. Karthick, S. Mishra and S. Kundu, ACS Catal., 2016, 6, 8069–8097 CrossRef CAS.
- J. Cheng, S. Chen, D. Chen, L. Dong, J. Wang, T. Zhang, T. Jiao, B. Liu, H. Wang, J. J. Kai, D. Zhang, G. Zheng, L. Zhi, F. Kang and W. Zhang, J. Mater. Chem. A, 2018, 6, 20254–20266 RSC.
- R. Gao, J. Zhu and D. Yan, Nanoscale, 2021, 13, 13593–13603 RSC.
- N. T. Suen, S. F. Hung, Q. Quan, N. Zhang, Y. J. Xu and H. M. Chen, Chem. Soc. Rev., 2017, 46, 337–365 RSC.
- A. Karmakar, K. Karthick, S. S. Sankar, S. Kumaravel, R. Madhu and S. Kundu, J. Mater. Chem. A, 2021, 9, 1314–1352 RSC.
- M. Wang, C. L. Dong, Y. C. Huang, Y. Li and S. Shen, Small, 2018, 14, 1–10 CAS.
- S. Kumaravel, K. Karthick, S. S. Sankar, A. Karmakar, R. Madhu, K. Bera and S. Kundu, Sustainable Energy Fuels, 2021, 5, 6215–6268 RSC.
- F. Song, L. Bai, A. Moysiadou, S. Lee, C. Hu, L. Liardet and X. Hu, J. Am. Chem. Soc., 2018, 140, 7748–7759 CrossRef CAS.
- S. Anantharaj and V. Aravindan, Adv. Energy Mater., 2020, 10, 1–30 Search PubMed.
- S. Li, Y. Gao, N. Li, L. Ge, X. Bu and P. Feng, Energy Environ. Sci., 2021, 14, 1897–1927 RSC.
- S. Sanati, A. Morsali and H. García, Energy Environ. Sci., 2022, 15, 3119–3151 RSC.
- J. Zhou, Y. Dou, A. Zhou, L. Shu, Y. Chen and J. R. Li, ACS Energy Lett., 2018, 3, 1655–1661 CrossRef CAS.
- C. Wang and L. Qi, Angew. Chem., Int. Ed., 2020, 59, 17219–17224 CrossRef CAS PubMed.
- J. S. Kim, B. Kim, H. Kim and K. Kang, Adv. Energy Mater., 2018, 8, 1–26 Search PubMed.
- M. Blasco-Ahicart, J. Soriano-Lopez, J. J. Carbo, J. M. Poblet and J. R. Galan-Mascaros, Nat. Chem., 2018, 10, 24–30 CrossRef CAS PubMed.
- M. Chatti, J. L. Gardiner, M. Fournier, B. Johannessen, T. Williams, T. R. Gengenbach, N. Pai, C. Nguyen, D. R. MacFarlane, R. K. Hocking and A. N. Simonov, Nat. Catal., 2019, 2, 457–465 CrossRef CAS.
- S. Anantharaj, K. Karthick and S. Kundu, Inorg. Chem., 2019, 58, 8570–8576 CrossRef CAS PubMed.
- J. Huang, H. Sheng, R. D. Ross, J. Han, X. Wang, B. Song and S. Jin, Nat. Commun., 2021, 12, 3036 CrossRef CAS.
- N. Wang, P. Ou, R. K. Miao, Y. Chang, Z. Wang, S. F. Hung, J. Abed, A. Ozden, H. Y. Chen, H. L. Wu, J. E. Huang, D. Zhou, W. Ni, L. Fan, Y. Yan, T. Peng, D. Sinton, Y. Liu, H. Liang and E. H. Sargent, J. Am. Chem. Soc., 2023, 14, 7829–7836 CrossRef.
- K. Min, M. Hwang, S. E. Shim, D. Lim and S. H. Baeck, Chem. Eng. J., 2021, 424, 130400 CrossRef CAS.
- K. L. Yan, J. Q. Chi, J. Y. Xie, B. Dong, Z. Z. Liu, W. K. Gao, J. H. Lin, Y. M. Chai and C. G. Liu, Renewable Energy, 2018, 119, 54–61 CrossRef CAS.
- Y. Ma, M. Zha, Y. Dong, L. Li and G. Hu, Mater. Res. Express, 2019, 6, 115033 CrossRef CAS.
- B. Guo, R. Ma, Z. Li, J. Luo, M. Yang and J. Wang, Mater. Chem. Front., 2020, 4, 1390–1396 RSC.
- C. Wang, H. Shang, J. Li, Y. Wang, H. Xu, C. Wang, J. Guo and Y. Du, Chem. Eng. J., 2021, 420, 129805 CrossRef CAS.
- B. Y. Guo, X. Y. Zhang, X. Ma, T. S. Chen, Y. Chen, M. L. Wen, J. F. Qin, J. Nan, Y. M. Chai and B. Dong, Int. J. Hydrogen Energy, 2020, 45, 9575–9582 CrossRef CAS.
- R. Madhu, A. Karmakar, S. Kumaravel, S. S. Sankar, K. Bera, S. Nagappan, H. N. Dhandapani and S. Kundu, ACS Appl. Mater. Interfaces, 2022, 14, 1077–1091 CrossRef CAS.
- R. Madhu, A. Karmakar and S. Kundu, Inorg. Chem., 2023, 62, 2726–2737 CrossRef CAS PubMed.
- N. S. Punde, C. R. Rawool, A. S. Rajpurohit, S. P. Karna and A. K. Srivastava, ChemistrySelect, 2018, 3, 11368–11380 CrossRef CAS.
- T. Wang, Z. Li, H. Jang, M. G. Kim, Q. Qin and X. Liu, ACS Sustain. Chem. Eng., 2023, 13, 5155–5163 CrossRef.
- D. J. Morgan, Surf. Interface Anal., 2015, 47, 1072–1079 CrossRef CAS.
- L. O. Paulista, J. Albero, R. J. E. Martins, R. A. R. Boaventura, V. J. P. Vilar, T. F. C. V. Silva and H. García, Catalysts, 2021, 11, 461 CrossRef CAS.
- H. Qi, X. Guan, G. Lei, M. Zhao, H. He, K. Li, G. Zhang, F. Zhang, X. Fan, W. Peng and Y. Li, Nanomaterials, 2021, 11, 1228 CrossRef CAS PubMed.
- Y. Qiao, S. Guo, K. Zhu, P. Liu, X. Li, K. Jiang, C. J. Sun, M. Chen and H. Zhou, Energy Environ. Sci., 2018, 11, 299–305 RSC.
- G. A. Sycheva and T. G. Kostyreva, Physics and Chemistry of Glass, 2019, 45, 56–64 Search PubMed.
- C. C. L. McCrory, S. Jung, I. M. Ferrer, S. M. Chatman, J. C. Peters and T. F. Jaramillo, J. Am. Chem. Soc., 2015, 137, 4347–4357 CrossRef CAS PubMed.
- Y. Li, Y. Wu, M. Yuan, H. Hao, Z. Lv, L. Xu and B. Wei, Appl. Catal., B, 2022, 318, 121825 CrossRef CAS.
- H. Y. Wang, S. F. Hung, H. Y. Chen, T. S. Chan, H. M. Chen and B. Liu, J. Am. Chem. Soc., 2016, 138, 36–39 CrossRef CAS.
- I. Lopes, N. El Hassan, H. Guerba, G. Wallez and A. Davidson, Chem. Mater., 2006, 18, 5826–5828 CrossRef CAS.
- Z. Xiao, Y. C. Huang, C. L. Dong, C. Xie, Z. Liu, S. Du, W. Chen, D. Yan, L. Tao, Z. Shu, G. Zhang, H. Duan, Y. Wang, Y. Zou, R. Chen and S. Wang, J. Am. Chem. Soc., 2020, 142, 12087–12095 CrossRef CAS.
- Y. Wang, X. Wei, X. Hu, W. Zhou and Y. Zhao, Catal. Lett., 2019, 149, 1026–1036 CrossRef CAS.
- Y. Hu, C. Hu, A. Du, T. Xiao, L. Yu, C. Yang and W. Xie, Anal. Chem., 2023, 95, 1703–1709 CAS.
- K. Jayaramulu, J. Masa, D. M. Morales, O. Tomanec, V. Ranc, M. Petr, P. Wilde, Y. T. Chen, R. Zboril, W. Schuhmann and R. A. Fischer, Adv. Sci., 2018, 5, 1–9 Search PubMed.
- Y. Zhu, H. C. Chen, C. S. Hsu, T. S. Lin, C. J. Chang, S. C. Chang, L. D. Tsai and H. M. Chen, ACS Energy Lett., 2019, 4, 987–994 CrossRef CAS.
- E. Budiyanto, C. Ochoa-Hernández and H. Tüysüz, Adv. Sustainable Syst., 2023, 2200499 CrossRef CAS.
- W. H. Lee, M. H. Han, Y. J. Ko, B. K. Min, K. H. Chae and H. S. Oh, Nat. Commun., 2022, 13, 1–10 Search PubMed.
- A. Karmakar, R. Jayan, A. Das, A. Kalloorkal, M. Islam and S. Kundu, ACS Appl. Mater. Interfaces, 2023, 15, 26928–26938 CrossRef CAS.
- A. J. Medford, A. Vojvodic, J. S. Hummelshøj, J. Voss, F. Abild-Pedersen, F. Studt, T. Bligaard, A. Nilsson and J. K. Nørskov, J. Catal., 2015, 328, 36–42 CrossRef CAS.
- D. Y. Kuo, H. Paik, J. Kloppenburg, B. Faeth, K. M. Shen, D. G. Schlom, G. Hautier and J. Suntivich, J. Am. Chem. Soc., 2018, 140, 17597–17605 CrossRef CAS.
- M. T. M. Koper and E. Bouwman, Angew. Chem., Int. Ed., 2010, 49, 3723–3725 CrossRef CAS.
Footnotes |
| † Electronic supplementary information (ESI) available: The information on reagents and instruments used in the study, electrochemical characterization, electrochemical studies, XRD, EDS, XPS, ECSA, Cdl values, post-studies, comparison table, and references. See DOI: https://doi.org/10.1039/d3ta03822j |
| ‡ These authors have contributed equally to this work. |
| This journal is © The Royal Society of Chemistry 2023 |

