
 Open Access Article
 This Open Access Article is licensed under a
 Creative Commons Attribution 3.0 Unported Licence
Role of the energy offset in the charge photogeneration and voltage loss of nonfullerene acceptor-based organic solar cells†
Yasunari
Tamai
 *ab,
Rei
Shirouchi
a,
Toshiharu
Saito
a,
Kazuki
Kohzuki
a and
Shin-ichiro
Natsuda
a
*ab,
Rei
Shirouchi
a,
Toshiharu
Saito
a,
Kazuki
Kohzuki
a and
Shin-ichiro
Natsuda
a
aDepartment of Polymer Chemistry, Graduate School of Engineering, Kyoto University, Katsura, Nishikyo, Kyoto 615-8510, Japan. E-mail: tamai@photo.polym.kyoto-u.ac.jp
bJapan Science and Technology Agency (JST), PRESTO, 4-1-8 Honcho, Kawaguchi, Saitama 332-0012, Japan
First published on 21st June 2023
Abstract
The trade-off between short-circuit current density (JSC) and open-circuit voltage (VOC) has been one of the largest challenges in improving the power conversion efficiencies (PCEs) of organic solar cells (OSCs). Although the energy offset between the excited and charge transfer (CT) states should remain minimal to achieve a high VOC, a very small energy offset typically leads to degradation of JSC, even when novel nonfullerene acceptors (NFAs), such as Y6, are used. Therefore, understanding the limit to what extent the energy offset can be minimized and the physics underlying the trade-off relationship is important to optimize the design of new materials and further improve the PCEs. This study provides a threshold energy that can ensure high charge photogeneration quantum efficiencies for Y-series NFA-based OSCs and discusses the role of the energy offset in device performances. We found that an insufficient energy offset led to not only slow hole transfer at the donor:acceptor interfaces, but also inefficient long-range spatial dissociation of the CT states and degradation of the fill factor (FF). This study also discusses the interplay of the energy levels of the two NFAs that constitute ternary blend OSCs. We found that, by introducing a low-efficiency NFA into a high-efficiency donor:acceptor blend, the voltage loss can be reduced while maintaining a high charge photogeneration quantum efficiency. Our findings highlight the importance of overcoming the trade-off between FF and VOC for further improving the PCE.
 Yasunari Tamai | Yasunari Tamai received his PhD degree from Kyoto University in 2013 in the excited-state dynamics in nanostructured polymer systems. He joined the Optoelectronics group at the University of Cambridge as a postdoctoral fellow under the supervision of Prof. Sir Richard Friend, where his research focused on the ultrafast charge separation at organic semiconductor heterojunctions. Since 2016, he has been an Assistant Professor at Kyoto University. From 2018 to 2022, he was also a JST PRESTO researcher. His current research interests include exciton and charge dynamics in organic semiconductors, particularly conjugated polymers. |
Introduction
The power conversion efficiencies (PCEs) of organic solar cells (OSCs) have rapidly improved in recent years and now exceed 19%.1–7 Nevertheless, a large voltage loss ΔV, which is defined as the difference between the optical bandgap Eg and open-circuit voltage VOC (ΔV = Eg/q − VOC, where q is the elementary charge), is a significant disadvantage of OSCs, restricting further improvement in the PCEs of OSCs.8,9 Although ΔV has continuously decreased in the past decade, state-of-the-art OSCs still exhibit ΔVs of ∼0.5 V or more, which remains considerably larger than those of their inorganic and perovskite counterparts, where ΔV of less than 0.4 V can be achieved.10Large voltage losses in OSCs primarily originate from the following two sources. The first source is the voltage loss incurred during the charge generation process as OSCs require donor:acceptor (D:A) heterointerfaces to split excitons into holes on the donors and electrons on the acceptors. The voltage loss associated with the charge generation process had been greater than 0.3 V because a large offset between the Eg and the charge transfer (CT) state energy ECT of larger than 0.3 eV had been presumed to be required for efficient charge separation.8,11–14 In contrast, recent studies have shown that efficient charge separation with an energy offset of less than 0.3 eV can be achieved for various nonfullerene acceptor (NFA)-based devices. We have revealed that a representative high-efficiency NFA-based OSC consisting of PBDB-T-2F (also referred to as PM6) and Y6 as an electron donor and acceptor, respectively, exhibits a near-unity and temperature-independent charge separation efficiency despite a small energy offset of ∼0.12 eV.15 However, to what extent the energy offset can be minimized, while maintaining a high charge photogeneration quantum efficiency is unclear. Within the Marcus description for charge transfer,8,14,16 reduction of energy offset is inevitably disadvantageous for efficient charge separation.17–19 In fact, an OSC consisting of PBDB-T-2F paired with Y5 exhibited a poor photovoltaic external quantum efficiency (EQEPV) of 36.1%, whereas ΔV of this device was ∼80 mV smaller than that of the PBDB-T-2F:Y6 device owing to the smaller energy offset of the former.20
The other source for the large ΔVs in OSCs is because of the voltage loss incurred during the charge recombination process. In the Shockley–Queisser (SQ) framework,21 nonradiative charge recombination leads to a non-ideal extra voltage loss ΔVnr.9,17,20,22–26 Conventional fullerene-based OSCs typically exhibit ΔVnrs of approximately 0.4 V,25 which are substantially larger than those of their inorganic and perovskite counterparts. The origin of the large ΔVnr can be rationalized by the extremely low photoluminescence quantum yields (PLQYs) of the CT states. When a free carrier encounters an opposite charge at the D:A interface, a CT state is regenerated at the interface followed by deactivation to the ground state. As CT states predominantly decay nonradiatively due to their significantly small oscillator strengths, charge recombination in fullerene-based OSCs leads to a large ΔVnrs. This is also valid for NFA-based OSCs. For instance, the PBDB-T-2F:Y6 device exhibits a relatively large ΔVnr of ∼0.25 V.20 Recent studies have highlighted the importance of reducing the energy offset in minimizing not only the voltage loss incurred during charge generation, but also the ΔVnr.17,20,27,28 We have demonstrated that the ΔVnrs of OSCs continuously decreased with a decrease in energy offset, and the abovementioned PBDB-T-2F:Y5 device exhibited a small ΔVnr of 0.145 V while the PCE of this device was poor due to the low EQEPV.17,20
On the other hand, some recent reports have claimed that self-ionization of excitons without a heterojunction occurs in Y6 pristine films,29,30 and hence, donor polymers, such as PBDB-T-2F, only serve as hole transport materials to suppress the bimolecular charge recombination. If this is true and is an intrinsic property of the Y-series NFAs, the low EQEPV of the abovementioned PBDB-T-2F:Y5 device may stem from other processes than charge separation. Therefore, again, it is crucial to unveil whether a D:A interface with a certain amount of energy offset is necessary for efficient charge separation and to what extent the energy offset can be minimized.
The ternary blend concept has been widely applied to OSCs to enhance the PCEs. Indeed, many state-of-the-art OSCs are ternary blend systems consisting of a common donor polymer and two NFAs (and vice versa).1–6 In ternary blend systems, upon changing the blend ratio of the two NFAs, VOC continuously varies between VOCs of the corresponding binary reference systems.31,32 In addition, several studies have shown that when the two NFAs form co-crystals, the ionization energies (IEs) of the co-crystals can be continuously tuned between the IEs of the two NFAs, enabling precise control of the energy offset.33 However, the role of the energy offsets of corresponding binary reference systems in the charge photogeneration and voltage loss has not been fully elucidated.
Herein, we studied the relationship between the energy offset and EQEPV of NFA-based OSCs to discuss to what extent the energy offset can be minimized. We used PBDB-T-based donor polymers and Y-series NFAs with different highest occupied molecular orbital (HOMO) energies (Fig. 1) to ensure similar photon absorption efficiencies and Egs with minimal difference in their chemical structures. This allowed us to focus on the impacts of energy offsets on the charge photogeneration and voltage losses. We prepared OSCs using 24 D:A combinations and examined the corresponding EQEPVs and voltage losses. The EQEPV sharply decreased when the voltage loss was less than 0.52 V. We found that an insufficient energy offset led to slow charge transfer at the D:A interfaces, as has been expected by Marcus theory. Surprisingly, the insufficient energy offset also resulted in poor long-range spatial dissociation of the CT states. This is contrary to the expectations derived from recent studies,34 wherein the band bending near the D:A interface driven by the large quadrupole moments of NFAs was supposed to accelerate long-range charge dissociation once the CT states were formed, resulting in barrier-less efficient charge dissociation. Degradation of the fill factor (FF) with a decrease in the energy offset was also observed because of the inefficient charge dissociation. We also discuss the interplay of the energy levels of the two NFAs that constitute ternary blend OSCs. We found that combining two NFAs enables us to reduce the voltage loss overcoming the abovementioned threshold, while maintaining a high charge photogeneration quantum efficiency.
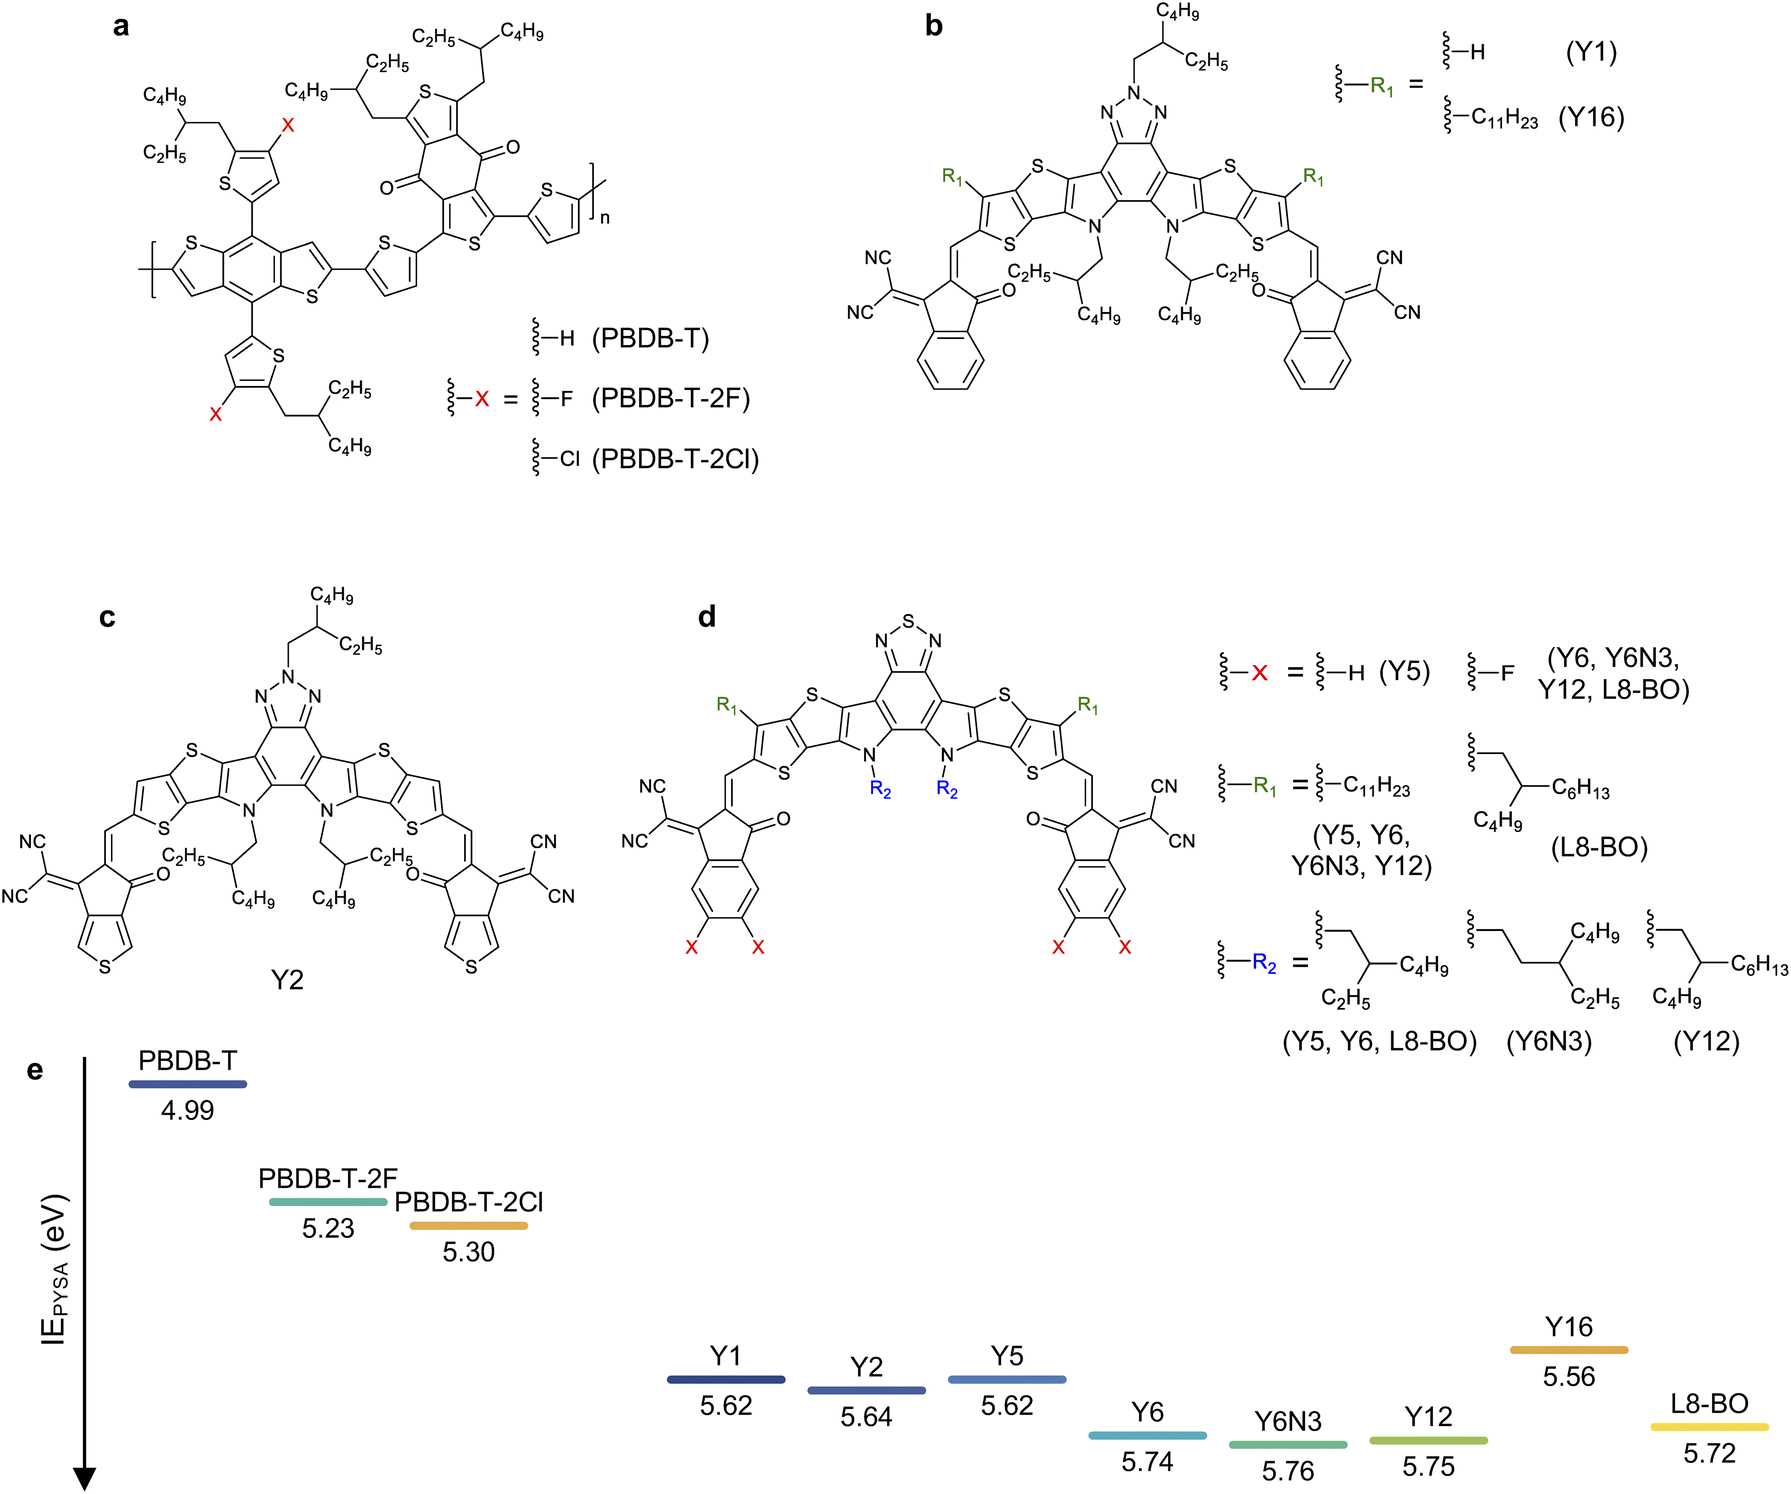 | ||
| Fig. 1 Chemical structures of (a) donor and (b–d) acceptor materials employed in this study. PBDB-T-2F and PBDB-T-2Cl are also referred to as PM6 and PM7, respectively. (e) Ionization energies (IEs) of pristine donor and acceptor films determined by photoelectron yield spectroscopy in air (PYSA). | ||
Results and discussion
Materials and ionization energies
We used three PBDB-T-based donors paired with eight Y-series acceptors (the chemical structure of the materials employed in this study can be found in Fig. 1), resulting in 24 combinations of D:A blends. We stress that the Egs and absorption properties are similar among all the devices (steady-state absorption spectra are provided in Fig. S1, ESI†), allowing us to focus on the role of energy offset in the charge photogeneration and voltage loss. In contrast, the HOMO energy difference between the donor and acceptor can be substantially tuned with minimal differences in the chemical structure and associated changes in physical properties.The HOMO energies (or IEs) of organic semiconductors are usually evaluated by photoelectron spectroscopic techniques, such as ultraviolet photoelectron spectroscopy (UPS) and photoelectron yield spectroscopy in air (PYSA), or by electrochemical techniques, such as cyclic voltammetry (CV). Recent studies have pointed out that the HOMO energy differences between the donor and NFA determined by the photoelectron spectroscopies were significantly larger than those determined by CV.34–36 For instance, the HOMO energy difference between PBDB-T-2F and Y6 determined using CV was only ∼0.1 eV,35 whereas the IE differences of the same blend determined by UPS and PYSA were >0.5 eV.34,36 The origin of the large discrepancy between these was likely due to differences in sample morphology. Photoelectron spectroscopies probe the IEs of solid states (especially, near the surface). In contrast, materials used for CV measurements are more disordered than those used for photoelectron spectroscopies even when film samples are applied to CV measurements because the film is swollen by solvents or sometimes dissolves into solvents during measurements. This leads to large variations in the contributions caused by charge–permanent multipole (mainly quadrupole) interactions to the observed HOMO (IE),34,37 resulting in a large discrepancy in the measured values. Therefore, photoelectron spectroscopies are considered more reliable for determining the IEs of the “pure” donor and acceptor materials in the solid state; hence, this study determined the IE differences between the donor and acceptor materials in their pristine film state using PYSA (ΔIEPYSA). In contrast, it should be emphasized that the actual D:A interfaces in bulk heterojunction blends are more disordered than pristine films. Therefore, the actual HOMO differences at the D:A interface likely differ from those determined for pristine films using photoelectron spectroscopies because the charge–permanent multipole interactions are supposedly weaker in the interfacial D:A mixed region. In fact, time-resolved spectroscopic techniques have shown that the energy offset between Eg and ECT of the PBDB-T-2F:Y6 blend is only ∼0.12 eV.15 This value is considerably smaller than the abovementioned IE difference determined using photoelectron spectroscopies, but similar to the value determined by CV measurements. Therefore, ΔIEPYSA should be significantly larger than the actual HOMO energy difference at the D:A interface. Nevertheless, ΔIEPYSA remains an effective quantitative measure of the energy offset. Fig. 1e shows the IEs of materials employed in this study determined by PYSA (experimental data can be found in Fig. S2, ESI†). These values are consistent with those reported previously with minor variations (see Fig. S3† for more details).36 Note that the lowest unoccupied molecular orbital (LUMO) energies were estimated using IEs and excited state energies (Fig. S4, ESI†); thereby, these values only serve as a rough estimate for relative comparison. The LUMO energy differences between the donor and acceptor materials were sufficiently large. However, because efficient energy transfer from the donor to the acceptor occurs, the LUMO energy difference was not related to device performances (vide infra).
Trade-off between charge generation and voltage loss
Fig. 2a and b show the current density–voltage (J–V) characteristics and EQEPV spectra of four representative solar cell devices employed in this study (the experimental results and photovoltaic device parameters for all devices can be found in Fig. S5, S6 and Tables S4–S6, ESI†). We found a clear trade-off relationship between short-circuit current density (JSC) and VOC; VOC increased with a decrease in JSC. EQEPV also decreased with an increase in VOC. These results suggest that the charge separation efficiency decreases with a decrease in the energy offset (i.e., a decrease in ΔIEPYSA), as was observed for the conventional fullerene-based OSCs.13,38 Interestingly, the EQEPV spectra followed well with the absorption spectra, indicating that the internal quantum efficiencies (IQEs) of these devices were less sensitive to the excitation wavelength despite large LUMO energy differences between the donor and acceptor. This is also confirmed using Fig. 2c, wherein the maximum EQEPV in the near-IR region (>650 nm), which corresponds to the acceptor absorption region, is plotted against the maximum EQEPV over the entire wavelength region (most devices showed the maximum EQEPV in the visible region). Owing to the large spectral overlap between donor fluorescence and acceptor absorption, energy transfer from the donor to the acceptor is likely to outcompete the electron transfer (Fig. S7, ESI†)39 This leads to predominant acceptor exciton formation regardless of the excitation wavelength, rendering EQEPV insensitive to the excitation wavelength. Therefore, the maximum EQEPV over the entire wavelength region is plotted against ΔV. Using the maximum EQEPV value allows us to minimize the influence of imperfect photon absorption. As shown in Fig. 2d, EQEPV drops sharply when ΔV is less than 0.52 V. The maximum EQEPV is also plotted against the IE difference ΔIEPYSA (Fig. S8, ESI†), where we found that the threshold value of ΔIEPYSA that ensured efficient charge photogeneration was ∼0.42 eV. We underline that the ΔIEPYSA used here, which was determined by the PYSA measurements for the pristine thin films, is considerably larger than the energy offset between Eg and ECT owing to the contribution caused by charge–permanent multipole (mainly quadrupole) interactions, as mentioned above.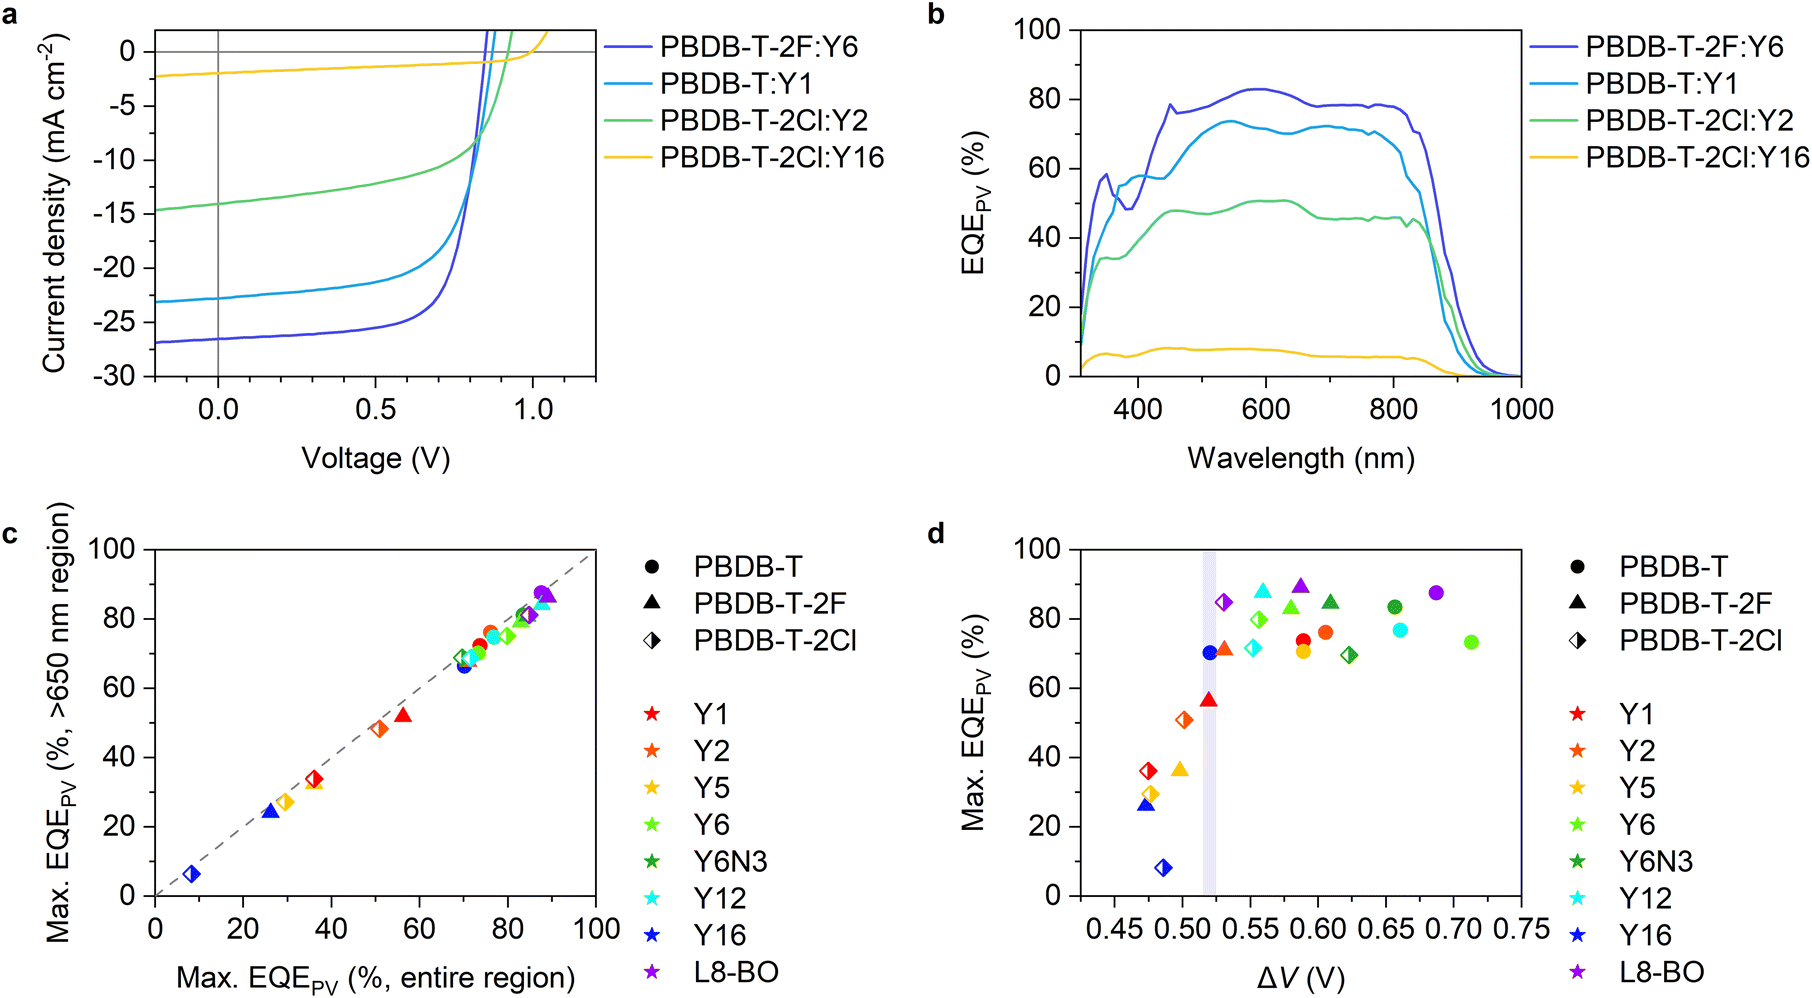 | ||
| Fig. 2 (a) J–V characteristics and (b) EQEPV spectra of the four representative devices. (c) Maximum EQEPVs in the >650 nm region plotted against those over the entire wavelength region. (d) Maximum EQEPV over the entire wavelength region plotted against ΔV (= Eg/q − VOC). Eg was determined from the EQEPV spectra using the method proposed earlier,24 wherein the first derivative of the EQEPV spectrum is assumed to be a probability distribution function of the photovoltaic bandgap energy, and the mean value of the distribution is used for Eg. The shape and color of the legends in (c) and (d) identify donors and acceptors, respectively. | ||
A similar trend was also observed for fullerene-based OSCs. However, the threshold value obtained in this study is lower than that observed for fullerene-based OSCs (see Fig. S10, ESI† for more details),13,38 indicating that Y-series NFAs can achieve an efficient charge photogeneration with a lower threshold voltage loss.
To obtain deeper insights, VOC was divided into two parts, as follows:
| VOC = VradOC − ΔVnr | (1) |
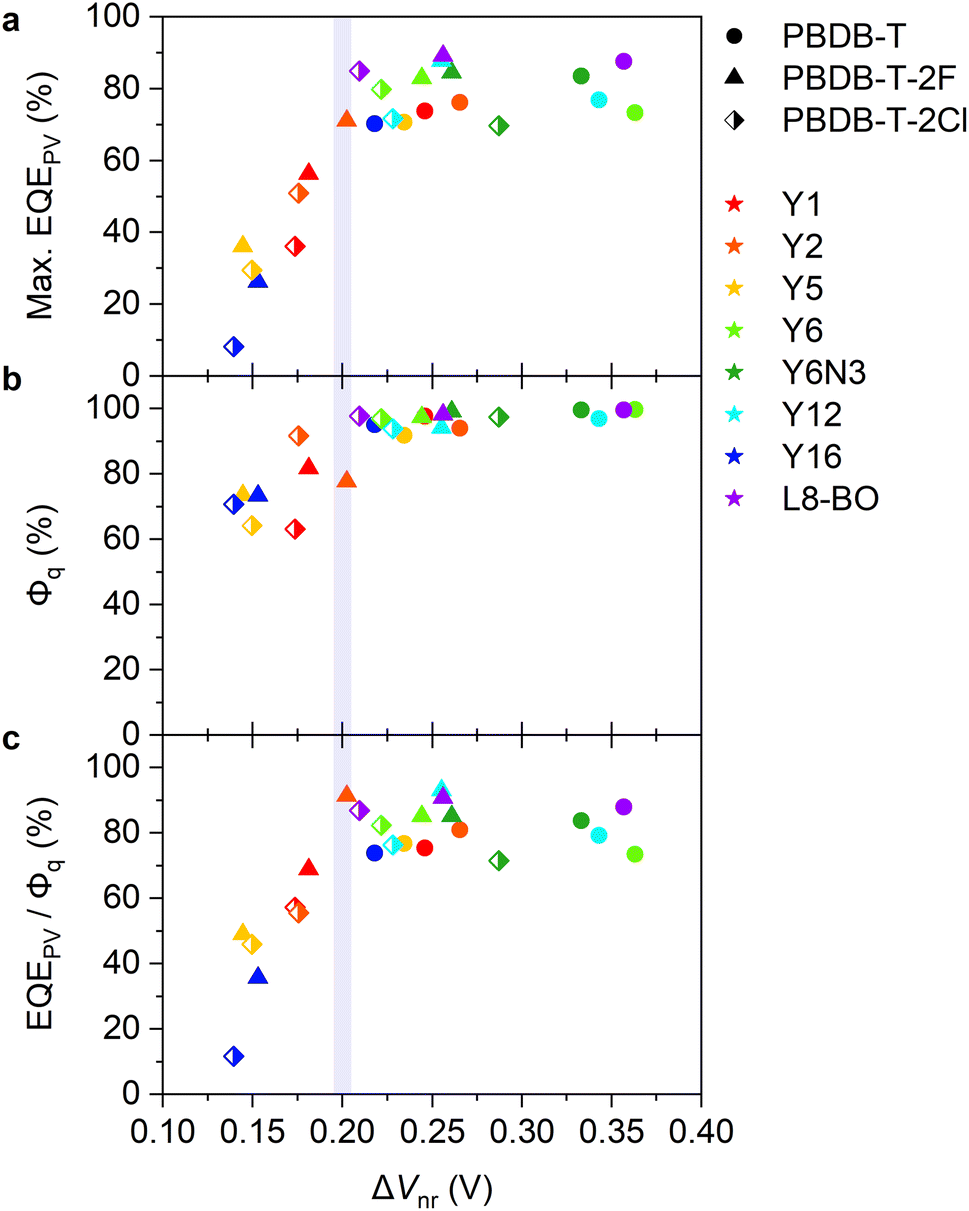 | ||
| Fig. 3 (a) Maximum EQEPV, (b) PL quenching yield Φq, and (c) EQEPV/Φq plotted against ΔVnr. | ||
Ideally, it is the most straightforward to discuss the relationship between EQEPV and the energy offset between Eg and ECT; however, accurately determining the ECT of some blends is challenging.8 For instance, ECT can be determined by time-resolved PL measurements if the CT emission can be distinguished from the corresponding prompt emission.15 However, this requires a near-unity exciton dissociation and reasonable CT emission intensity. Hence, CT emission is buried under the corresponding prompt emission when any of these are not satisfied, making it impossible to determine ECT from emission measurements. Therefore, we will use ΔVnr as an alternative quantitative measure for the energy offset in the following sections. Plots using ΔIEPYSA can be found in the ESI.† The use of ΔVnr and ΔIEPYSA has their advantages and disadvantages. The former is determined from the actual device, and hence, the value reflects the nature of the D:A interface; however, the value is not directly related to the energy offset. In contrast, the latter can be easily measured, although the value may be overestimated relative to the actual HOMO energy difference at the D:A interface owing to the contribution caused by charge–permanent multipole interactions, which are weakened at the interfacial mixed region. Because ΔV is a less direct measure of the energy offset than the others, it is not discussed hereinafter. Note that, as an alternative approach, temperature-dependent VOC measurements allow us to estimate ECT at 0 K by linear extrapolation.19,38,40,41 However, ECT at room temperature is typically 0.1–0.2 eV higher than that at 0 K.40,41 Because we discuss the effect of slight energy offset differences, the uncertainty of 0.1–0.2 eV is undesirable; hence, the temperature-dependent VOC measurements were not applied in this study.
Charge separation efficiency
We next measured the PL quenching yield Φq of the D:A blends after selective excitation of acceptors (Fig. S13–S15, ESI†). Fig. 3b shows the Φqs plotted against ΔVnr. The Φq was close to unity when the energy offset was satisfactory (as a rule of thumb, in the region where ΔVnr is larger than 0.2 V). Because the Φq is a product of the efficiencies of exciton harvesting at the D:A interfaces and charge transfer at the interface, the near-unity Φq indicates that all the excitons generated in the acceptor domains can reach the interface and quantitatively dissociate into the CT states. We have previously observed Y6 singlet exciton dynamics in PBDB-T-2F:Y6 blends using transient absorption (TA) spectroscopy.15 Upon selective photoexcitation of Y6, singlet excitons were generated in Y6 domains, which subsequently reached the D:A interface with a time constant of ∼6 ps. Although the discussion on the intrinsic lifetime of Y6 singlet excitons is controversial,8,42 it is expected to be at least 200 ps, which is sufficient for all the excitons to reach the interface. Strikingly, the hole transfer from Y6 to PBDB-T-2F occurs with a sub-picosecond time scale despite the small energy offset of only 0.12 eV, resulting in the quantitative conversion of excitons to the CT states. In contrast, the quenching yield decreased in the region where ΔVnr was less than 0.2 V. Because the exciton harvesting efficiency is independent of the energy offset,8,43 this result indicates that the hole transfer rate decreases with a decrease in the energy offset, as is expected by Marcus theory in the normal region,14,16 leading to inefficient CT state formation.To confirm this, we performed TA measurements for inefficient PBDB-T-2F-based blend films. The PBDB-T-2F:Y5 blend is a representative low-EQEPV system (yellow triangles in Fig. 3) and suitable for comparison with the adequately investigated PBDB-T-2F:Y6 blend;15,44,45 thereby, the results for the PBDB-T-2F:Y5 blend are shown in the main text, whereas the results for other inefficient blends (Y1, Y2, and Y16) can be found in Fig. S16, ESI.† Since TA data for the inefficient blends are scarce (whereas there are quite a few for the efficient blends), these results will further deepen our understanding. Fig. 4a shows the TA spectra of the PBDB-T-2F:Y5 blend film after selective photoexcitation of Y5 at 800 nm. In analogy with the assignments for the PBDB-T-2F:Y6 system,15,42,44 the large photoinduced absorption (PIA) band observed at around 900 nm immediately after the photoexcitation can be attributable to Y5 singlet excitons, which gradually decayed thereafter. The broad negative signal observed in the 500–800 nm region is assigned to ground-state bleaching (GSB). In the case of the PBDB-T-2F:Y6 blend, the PBDB-T-2F GSB was observed in the 500–650 nm region already at 0 ps, evidencing the sub-picosecond hole transfer (Fig. S16a, ESI†). In contrast, close inspection of the GSB signal of the PBDB-T-2F:Y5 blend (Fig. 4b) revealed that the spectral shape in the 500–650 nm region at early times was different from that at later times, meaning that the GSB signal in this region at 0 ps should mainly be ascribed to Y5 due to slow hole transfer. In addition, a rise in the PBDB-T-2F GSB signal was not observed in the PBDB-T-2F:Y5 blend, in sharp contrast to the PBDB-T-2F:Y6 blend, where the PBDB-T-2F GSB signal increased with a time constant of ∼6 ps (Fig. S16a†).15 The rise in the PBDB-T-2F GSB signal was also not observed in other inefficient PBDB-T-2F-based blends (Fig. S16b–d†), indicating slower hole transfer in these inefficient blends than in the PBDB-T-2F:Y6 blend. Fig. 4c shows the time evolution of the TA signals monitored at 550 nm, where the TA signal was initially positive and then turned negative at later times, representing the decay of the Y5 excitons and the generation of the PBDB-T-2F GSB. The growth of the PBDB-T-2F GSB signal continued until at least 100 ps, again indicating slow hole transfer. Note that the later time TA kinetics at this wavelength includes the contribution of the geminate recombination of the CT states (vide infra); thereby, it is possible that the hole transfer occurred even after the appearance of the apparent peak at ∼100 ps. These results confirmed that the slow hole transfer from Y5 (and also Y1, Y2, and Y16) to PBDB-T-2F was due to insufficient energy offsets.
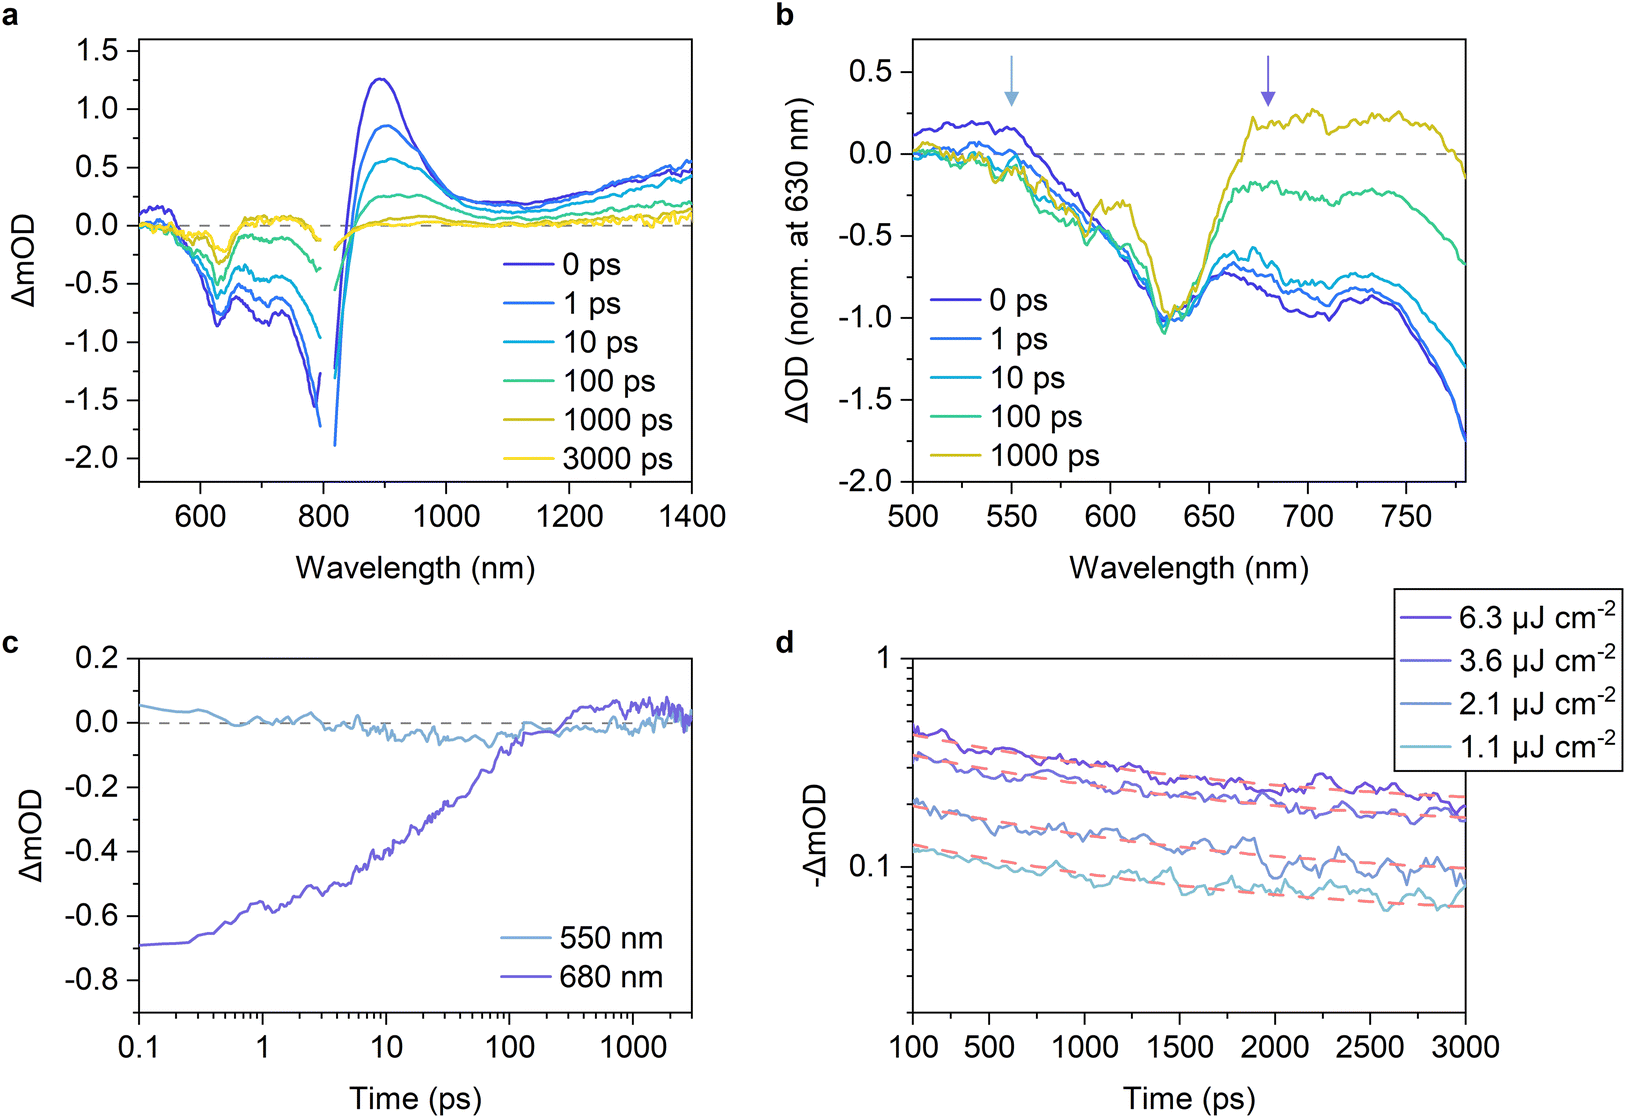 | ||
Fig. 4 (a) TA spectra of a PBDB-T-2F:Y5 blend film. The excitation wavelength was 800 nm with a fluence of 6.3 μJ cm−2. (b) Normalized TA spectra of (a) at 630 nm (GSB peak of PBDB-T-2F). (c) Time evolution of the TA signals monitored at 550 and 680 nm. (d) Excitation-fluence dependence of the TA decays monitored at 630 nm. The red dashed lines represent the best fitting curves with the sum of an exponential function and a constant fraction, ΔmOD = a![[thin space (1/6-em)]](https://www.rsc.org/images/entities/char_2009.gif) exp(−t/τ) + b, where a, τ, and b are the fitting parameters and τ is shared for all the four decay curves. The charge dissociation efficiency was determined as b/(a + b). exp(−t/τ) + b, where a, τ, and b are the fitting parameters and τ is shared for all the four decay curves. The charge dissociation efficiency was determined as b/(a + b). | ||
To further deepen our understanding, EQEPV was divided by Φq. Fig. 3c shows EQEPV/Φq plotted against ΔVnr. Interestingly, EQEPV/Φq sharply decreased in the same region (ΔVnr < 0.2 V). EQEPV can be expressed as:
| EQEPV = ηabs × ηED × ηCT × ηCD × ηCC | (2) |
To confirm this, we measured the excitation-fluence dependence of the TA decays. Fig. 4d shows the recoveries of the PBDB-T-2F GSB under various excitation fluences. The decay kinetics were almost independent of the excitation fluence, indicating that the geminate recombination of the CT states was dominant under these excitation fluences.48–51 This is in sharp contrast to what we previously observed for the PBDB-T-2F:Y6 blend, where the geminate recombination was negligible and bimolecular recombination was significant even at low excitation fluences.15Fig. 4c also shows the time evolution of the TA signals monitored at 680 nm. The negative signal, which is assigned to the Y5 GSB, slowly recovered and finally turned positive after 300 ps. This behavior was also observed for the other PBDB-T-2F-based blends, whereas the signal amplitude and the time at which the TA signal turned positive depended on the acceptors (Fig. S16, ESI†). We found that the positive signals at 680 nm of the inefficient blends were significantly small compared with that of the PBDB-T-2F:Y6 blend (Fig. 4c and S16, ESI†). In the PBDB-T-2F:Y6 blend, the TA signal turned positive already at 10 ps after photoexcitation and increased further. The positive signal at this wavelength is assigned to the transient electroabsorption (EA) signal of PBDB-T-2F.15,44,45,52 When an exciton dissociates into an electron–hole pair (CT state) at the D:A interface, the electron–hole pair generates a local electric field in the surroundings. This causes a Stark shift in the steady-state absorption of surrounding molecules, leading to the addition of a transient EA signal to the TA spectra.53,54 Because the transient EA signal increases with an increase in the separation distance of the electron–hole pair, our findings for the inefficient blends indicate that the charge dissociation in these blends is slow and inefficient. Therefore, the decay kinetics were fitted using an exponential function to determine the charge dissociation efficiency. The TA decay kinetics of the PBDB-T-2F:Y5 blend monitored at 630 nm (PBDB-T-2F GSB) were well fitted with the exponential function with a CT state lifetime of ∼1.3 ns and the charge dissociation efficiency of only ∼42% (Fig. 4d). Note that the charge dissociation efficiency obtained herein was lower than EQEPV/Φq of the same blend (∼46%) because TA measurements were performed under open-circuit condition, as will be discussed later.
We then measured the TA spectra of a PBDB-T:Y5 blend film to elucidate whether the low charge dissociation efficiency of the PBDB-T-2F:Y5 blend stems from the intrinsic nature of Y5 itself. The PBDB-T:Y5 blend exhibits a ΔVnr of 0.234 V, which is above the threshold, and hence, comparison between the large-offset PBDB-T:Y5 and small-offset PBDB-T-2F:Y5 blends allows us to elucidate the origin of the inefficient charge dissociation in the PBDB-T-2F:Y5 blend. Fig. 5a shows the TA spectra of the PBDB-T:Y5 blend film in the visible region, where the assignments of the TA signals are the same as those of the abovementioned PBDB-T-2F-based blends. We found that the hole transfer occurred in a sub-picosecond time scale in the PBDB-T:Y5 blend owing to the sufficient energy offset. Strikingly, the PBDB-T:Y5 blend exhibited considerably larger transient EA signals compared with the PBDB-T-2F:Y5 blend (Fig. 5b). In addition, the decay kinetics of the PBDB-T GSB depended on the excitation-fluence due to the contribution of the bimolecular recombination (Fig. S17, ESI†), which is indicative of efficient free carrier generation. These results are consistent with the relatively high JSC of the PBDB-T:Y5 device. Therefore, we conclude that the low charge dissociation efficiency of the PBDB-T-2F:Y5 blend does not stem from the intrinsic nature of Y5 itself, but rather stems from the absence of sufficient energy offset at the D:A interface.
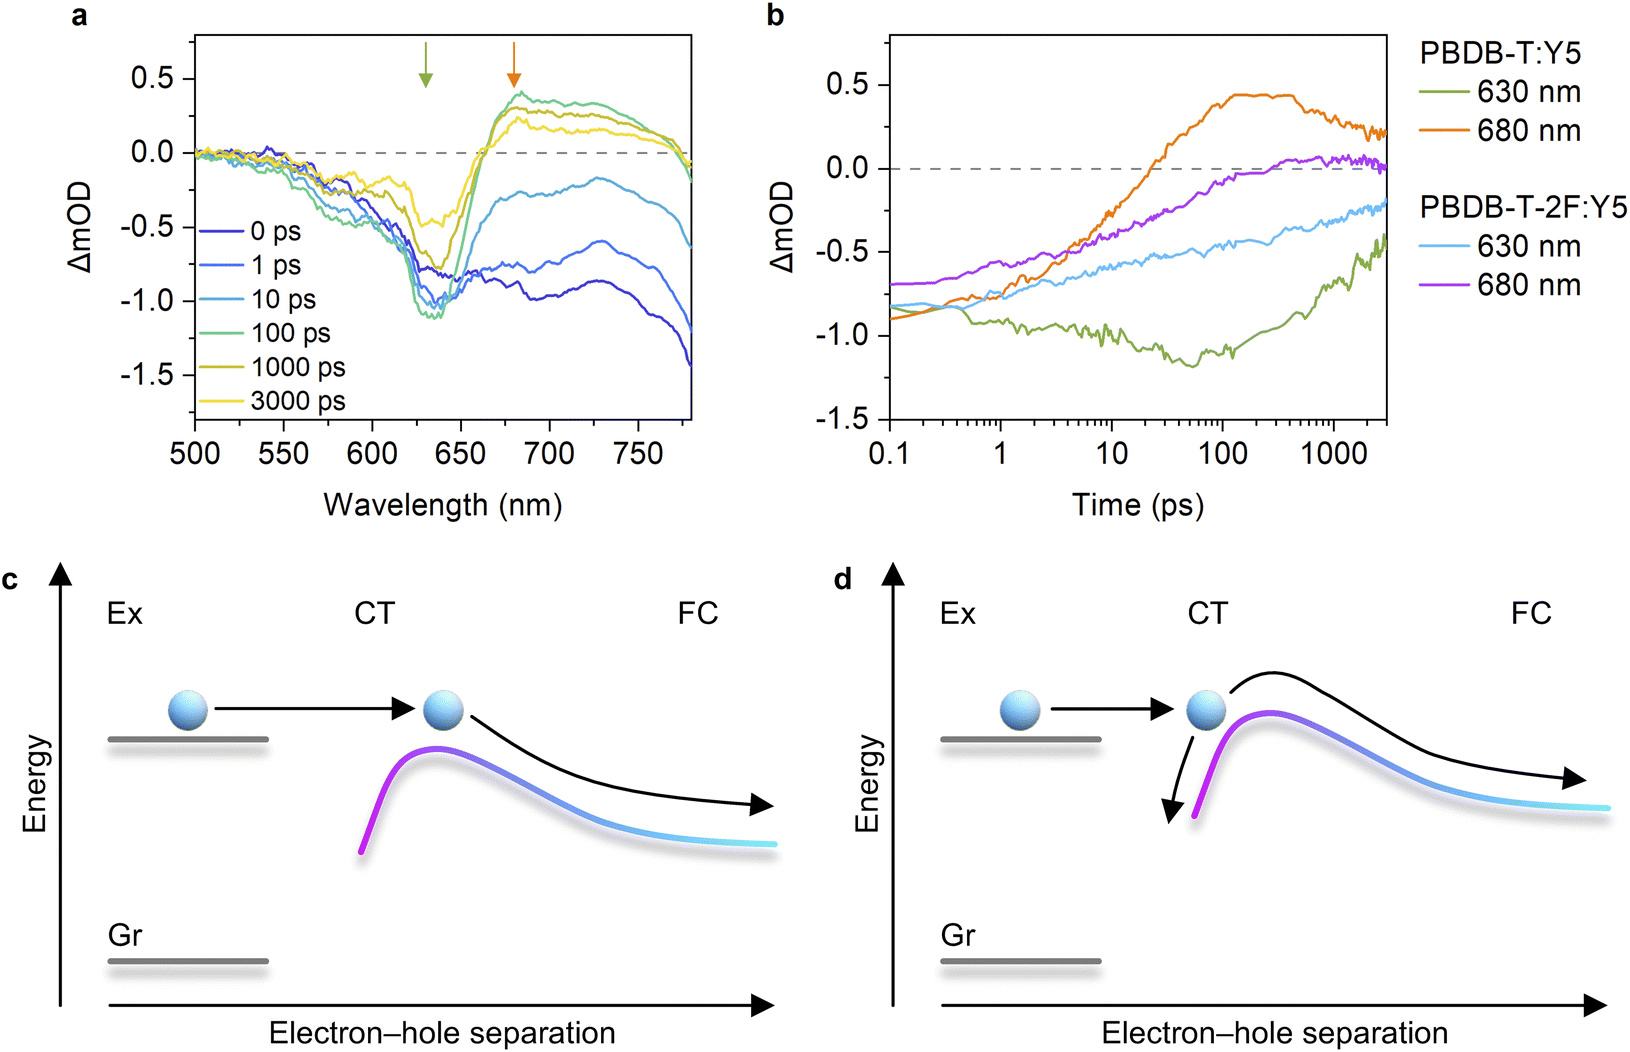 | ||
| Fig. 5 (a) TA spectra of a PBDB-T:Y5 blend film. The excitation wavelength was 800 nm with a fluence of 6.2 μJ cm−2. (b) Time evolutions of the TA signals of the PBDB-T:Y5 and PBDB-T-2F:Y5 blend films monitored at 630 nm (GSB peak of donor polymers) and 680 nm (transient EA). The excitation wavelength was 800 nm with fluences of 6.2 μJ cm−2 (PBDB-T:Y5) and 6.3 μJ cm−2 (PBDB-T-2F:Y5). Schematic showing the charge separation process in (c) efficient D:A blends and (d) inefficient D:A blends. Ex, CT, FC, and Gr refer to the excited state, CT state, free carrier, and ground state, respectively. (c) When the energy offset is sufficient, the initial separation distance between the electron and hole after isoenergetic charge transfer is satisfactory to overcome the activation barrier, resulting in barrier-less charge dissociation. (d) In contrast, when the energy offset is insufficient, charges need to overcome the activation barrier, resulting in poor charge dissociation efficiency. | ||
Our finding that the long-range spatial dissociation of CT states is inefficient when the energy offset is too small is very interesting. A key driver for the efficient charge dissociation in the representative efficient PBDB-T-2F:Y6 blend is attributed to the formation of a cascaded energy landscape near the D:A interface,15 which enables charges moving away from the interface without experiencing activation barriers because the attracting Coulomb barrier is compensated by the cascaded energy landscape. A possible explanation for the origin of the formation of the cascaded energy landscape relies on the large quadrupole moments of NFAs.34,37 Owing to a concentration gradient of NFAs near the D:A interface, charge–quadrupole interaction continuously increases with an increase in the distance from the interface, leading to the formation of a cascaded energy landscape (also referred to as band bending). Previous studies claimed that the drawback of the band bending was attributed to hole transfer becoming inefficient when the energy offset is too small.34 In contrast, within the model proposed in ref. 34, once the CT states are formed through hole transfer, they are expected to efficiently dissociate into free carriers because the band bending is beneficial for charge dissociation. However, this study reveals that the decrease in the charge dissociation efficiency was more significant than the decrease in the hole transfer efficiency when the energy offset is too small (Fig. 3).
This is because decreasing the hole transfer rate does not necessarily result in low hole transfer efficiency as the hole transfer efficiency is determined by the competition with the intrinsic exciton decay rate. The hole transfer rate in the PBDB-T-2F:Y6 blend is more than 1012 s−1, despite the small energy offset of 0.12 eV, as mentioned above. Therefore, even if we assume that the hole transfer rate becomes an order of magnitude lower than that in the PBDB-T-2F:Y6 blend, the hole transfer rate remains on the order of 1011 s−1, which is still larger than the intrinsic decay rate of acceptor excitons (<5 × 10⁹ s−1), leading to maintaining a relatively high hole transfer efficiency. In contrast, if the hole transfer becomes two orders of magnitude slower than that in the PBDB-T-2F:Y6 blend, the hole transfer efficiency should be significantly decreased. We estimated to what extent the hole transfer rate is decreased in the inefficient blends compared with the PBDB-T-2F:Y6 blend and found that the hole transfer rate supposedly remains only an order of magnitude lower (Fig. S18, ESI†).8,55
We found that the CT state lifetime in the representative inefficient PBDB-T-2F:Y5 blend (∼1.3 ns) was considerably shorter than that in the representative efficient PBDB-T-2F:Y6 blend (∼2.6 ns, determined by the time-resolved PL spectroscopy15). This result implies that the CT states generated in the inefficient blends are more localized and tightly bound at the D:A interface.51 Therefore, we propose that, as schematically shown in Fig. 5c and d, there exists an activation barrier for charge dissociation, and hence, the QY of the long-range spatial dissociation depends on the initial separation distance of the CT states, which is affected by the energy offset. When the energy offset is sufficient, the initial separation distance between electron and hole after isoenergetic charge transfer is satisfactory for charges to overcome the activation barrier, resulting in barrier-less charge dissociation. In contrast, when the energy offset is insufficient, charges need to overcome the activation barrier, resulting in poor charge dissociation efficiency. This model is similar to those developed for fullerene-based OSCs,11,12,53,56 except that the origin of the cascaded energy landscape in this model is attributed to the large quadrupole moment of NFAs. Although no clear experimental evidence that supports our hypothesis is yet available at the moment, our findings encourage us to further investigate the charge separation mechanism in future studies.
Impact of voltage loss on fill factor
We move our attention to the impact of voltage loss on FF. In general, a large VOC is expected to provide a high FF.9,57,58 Nevertheless, as shown in Fig. 6a, the FFs of our devices decreased in the high VOC region. To deepen our understanding, FF was plotted against ΔVnr (Fig. 6b, see also Fig. S19, ESI†), where FF dropped in the ΔVnr < 0.2 V region, similar to the case of EQEPV. This phenomenon can be rationalized by the following reasons. As is discussed in the previous section, the efficiency of the long-range charge dissociation is insufficient when the energy offset is too small. The charge dissociation efficiency ηCD of the PBDB-T-2F:Y5 blend obtained by TA measurements was lower than EQEPV/Φq (= ηabs × ηCD × ηCC), as mentioned above. This indicates that the charge dissociation efficiency exhibits bias dependence because TA measurements were performed under open-circuit condition, whereas EQEPV was measured under short-circuit condition, where charge dissociation is accelerated with the aid of a large internal electric field.8,11,59,60 Therefore, the charge dissociation efficiency obtained by TA measurements being less than EQEPV/Φq indicates that charge dissociation in inefficient devices becomes less efficient with an increase in the applied voltage in the forward direction, resulting in a poor FF.50,61 In addition, these devices may be more prone to suffer from bimolecular recombination loss. When a charge carrier encounters an opposite charge at the interface, a CT state is regenerated. If the CT state deactivates to the ground or lower-lying local triplet states, charge decay ultimately occurs. Instead, if the CT state redissociates into free carriers, bimolecular recombination is suppressed.46,47 With decreasing energy offset, the rate of radiative decay of the CT state and the rate of back charge transfer to the excited state are expected to increase, resulting in a less efficient redissociation of the CT state. Therefore, bimolecular recombination loss should be more severe for low-energy offset devices.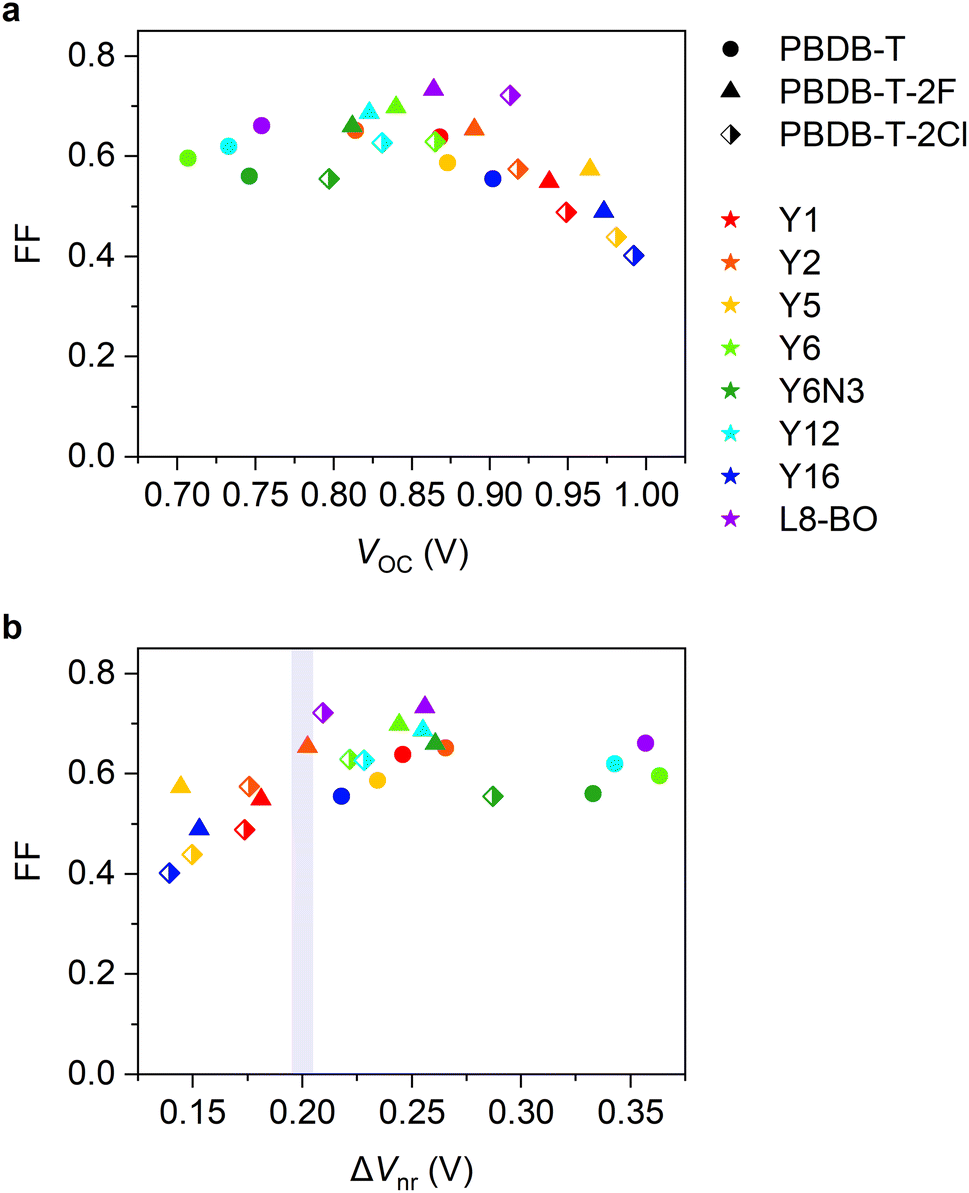 | ||
| Fig. 6 FF plotted against (a) VOC, and (b) ΔVnr. | ||
Our findings suggest that the trade-off between not only JSC and VOC, but also FF and VOC should be managed. FFs of state-of-the-art OSCs have increased to ∼0.8, which significantly contributed to the improvement in the PCEs in the last two years.9 However, to the best of our knowledge, no OSCs with ΔVnr far less than 0.2 V exhibited a FF of 0.8. This is probably due to the trade-off between FF and VOC. Therefore, future research should focus more on overcoming the trade-off between FF and VOC.
Ternary blend system
Finally, we demonstrated ternary blend OSCs consisting of two NFAs paired with a common donor to deepen our understanding on the interplay of the energy levels of the two NFAs. The two NFAs were selected based on the following criteria. The majority NFA was chosen such that a high EQEPV and ΔVnr being as close as possible to the threshold were achieved when paired with the common donor in the binary reference system. In contrast, the minority NFA was selected to achieve a low ΔVnr of less than 0.18 V when paired with the common donor in the binary reference system. EQEPV can be low in this case (all acceptors satisfying the criterion for ΔVnr exhibit low EQEPVs, as mentioned above). We stress that two NFAs in typical ternary OSCs are selected in a way such that reasonable device performances are obtained in binary references with the donor (and vice versa).1–6 In other words, two NFAs in typical ternary OSCs are selected such that both binary references exhibit ΔVnrs of approximately or larger than 0.2 V and high EQEPVs. In contrast, the minority NFA in this study was unique as it was chosen with only a small ΔVnr, ignoring EQEPV. In this way, the role of the two NFAs was emphasized, improving the clarity of future material design concepts.The PBDB-T-2Cl:L8-BO device exhibited a high EQEPV (maximum EQEPV of 84.9% at 580 nm) with a moderate ΔVnr of 0.209 V, which is approximately the threshold value that ensures a high EQEPV (Fig. 3). In contrast, the PBDB-T-2Cl:Y1 device exhibited a low ΔVnr of 0.174 V, whereas the EQEPV was low (maximum EQEPV was 36.1% at 580 nm). Therefore, we prepared ternary blend OSCs consisting of PBDB-T-2Cl, L8-BO, and Y1 as a common donor, majority NFA, and minority NFA, respectively, to understand the role of the two NFAs. Fig. 7a shows the EQEPV spectra of the PBDB-T-2Cl:L8-BO:Y1 ternary blend devices with different blend ratios (J–V characteristics and device parameters can be found in Fig. S20, S21 and Table S9, ESI†). The blend ratios were varied over 1:1.2–x:x, as indicated in the figure. Strikingly, EQEPV remained almost unchanged even when x was varied from 0 to 0.3. EQEPV was decreased when x was 0.4, although it was still considerably higher than that of the PBDB-T-2Cl:Y1 binary system (x = 1.2). The fact that the addition of a small amount of Y1 will not degrade the charge separation efficiency, despite the poor charge separation efficiency of the PBDB-T-2Cl:Y1 binary reference (Fig. 3 and S16, ESI†), suggests that charge separation preferentially occurs at the PBDB-T-2Cl:L8-BO interface, as schematically shown in Fig. 7d. When a Y1 exciton reaches the D:A interface, it will likely return to the bulk because the hole transfer is slow. On the other hand, the Y1 exciton can move to the L8-BO domain without a large energetic barrier because of similar excited state energies of L8-BO and Y1 (1.45 and 1.43 eV for L8-BO and Y1, respectively, Fig. S4, ESI†). Once the excitons are transferred to the L8-BO domains, they can quickly dissociate into the CT states. Therefore, charge separation preferentially occurs at the PBDB-T-2Cl:L8-BO interface, resulting in a high EQEPV despite the addition of a small amount of Y1.
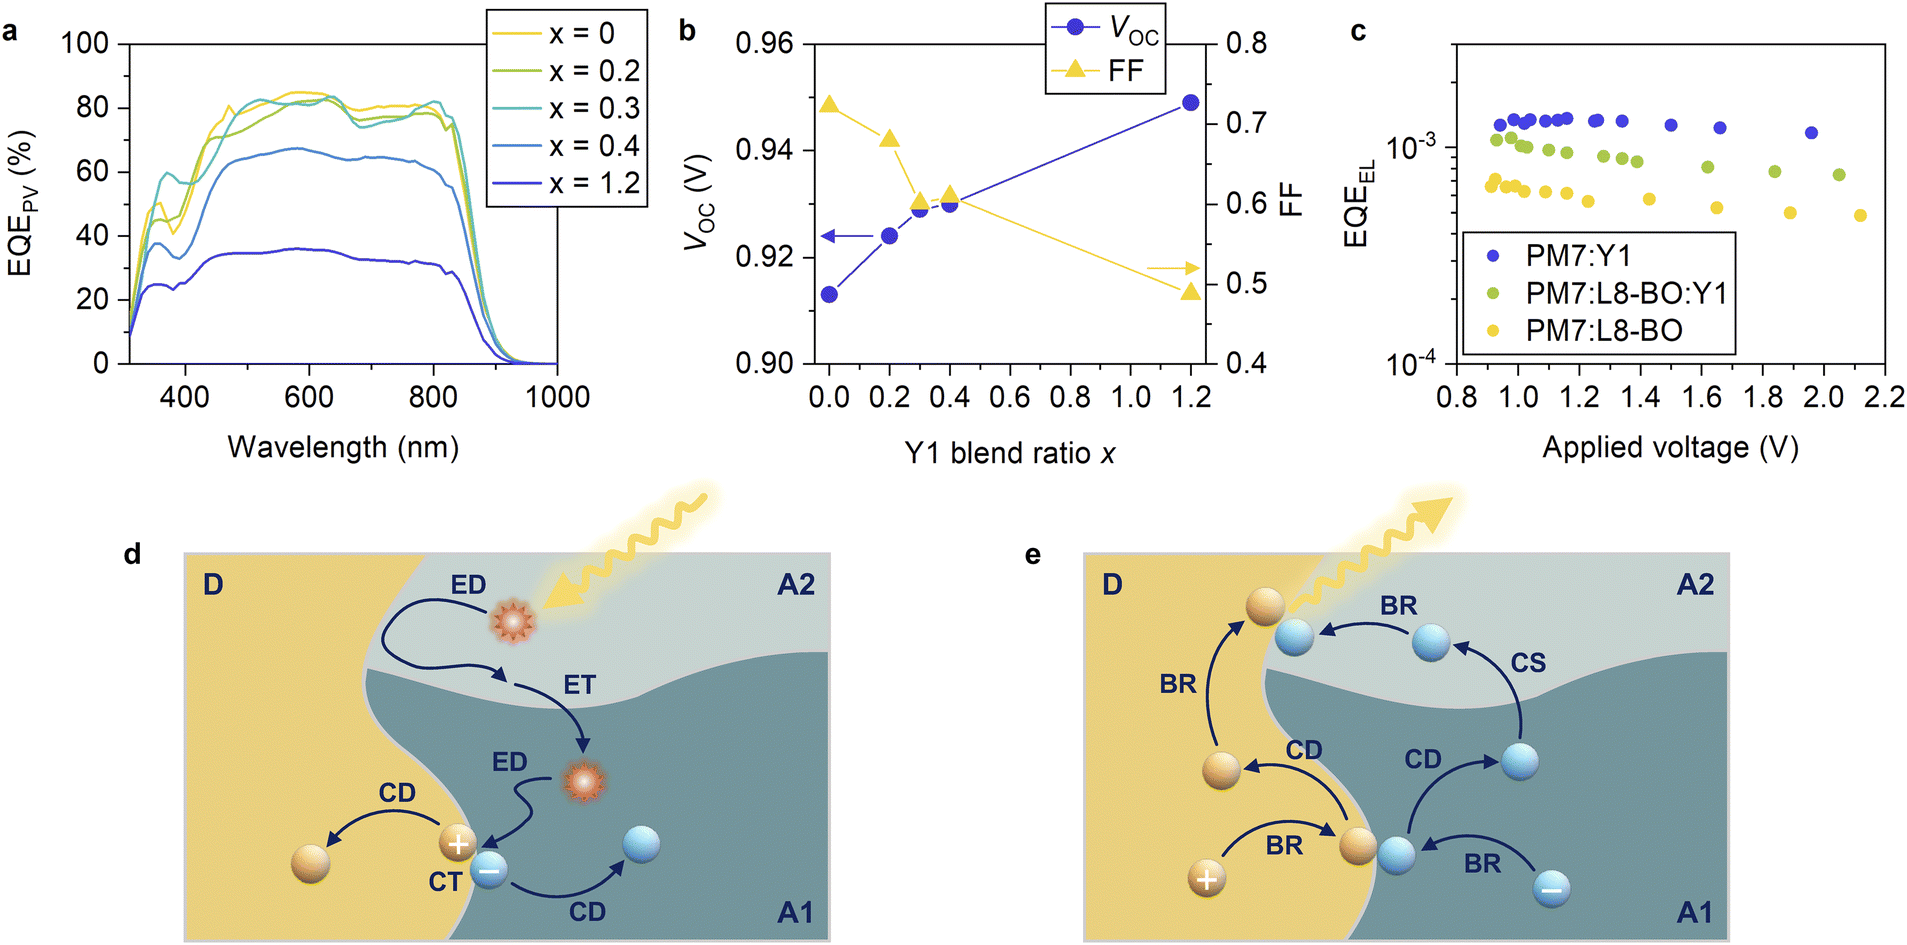 | ||
| Fig. 7 (a) EQEPV spectra of PBDB-T-2Cl:L8-BO:Y1 ternary blend devices with different blend ratios. The blend ratios were varied over 1:1.2–x:x, as indicated in the figure. (b) Blend ratio dependence of VOC (blue circles, left axis) and FF (yellow triangles, right axis). (c) EQEEL of the PBDB-T-2Cl:L8-BO:Y1 (1:1:0.2) ternary blend device as well as its binary references. (d) Schematic showing the charge separation process. Hole transfer is slow at the donor:minority NFA (D:A2) interface, and the CT states are not likely to form. On the other hand, excitons can move between the majority and minority NFA domains without a large energetic barrier. Therefore, charge separation preferentially occurs at the donor:majority NFA (D:A1) interface following exciton (energy) transfer from the minority to majority NFAs. ED, ET, CT, and CD refer to exciton diffusion, energy (exciton) transfer, charge transfer, and charge dissociation, respectively. (e) Schematic showing the charge recombination process. Because the redissociation of the CT state is less efficient at the D:A2 interface compared to that at the D:A1 interface, charge recombination is expected to be more likely to occur at the former. Because the EQEEL of the D:A2 blend is higher than that of the D:A1 blend, the preferential recombination at the former leads to an increase in the EQEEL of the ternary blend. BR and CS refer to bimolecular charge recombination to regenerate the CT states, and charge shift between A1 and A2, respectively. | ||
In contrast, VOC continuously increased with an increase in the Y1 blend ratio. The detailed voltage loss analysis revealed that the ΔVnr of the ternary blend device (x = 0.2) was 0.199 V, which was lower than that of the PBDB-T-2Cl:L8-BO binary reference (0.209 V) (Table S10, ESI†). To confirm this, we measured the external quantum efficiency of electroluminescence (EQEEL) of an OSC device at forward biases because ΔVnr is directly related to EQEEL as follows:
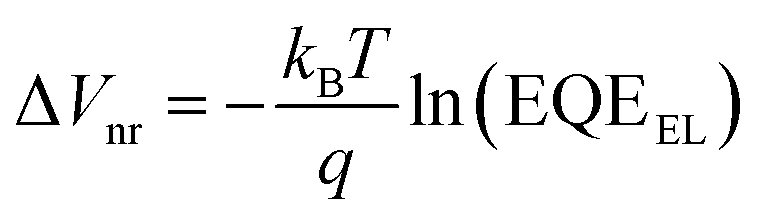 | (3) |
Conclusions
We have investigated the threshold to what extent the energy offset can be minimized for Y-series NFA-based OSCs. We found that the Y-series OSCs exhibited a clear threshold ΔVnr of 0.2 V, below which EQEPV sharply decreased. This is the reason why the ΔVnrs of state-of-the-art OSCs remains approximately 0.2 V and very few studies have reported that ΔVnr can be exceeded beyond the 0.2 V threshold while maintaining a high EQEPV. It is easily expected from Marcus theory that the hole transfer rate from the NFA to donor decreases with a decrease in the energy offset. In contrast, what is surprising in our findings is that the quantum efficiency of the long-range spatial dissociation of the CT states also decreased with a decrease in the energy offset. This behavior cannot be rationalized only by the recently proposed model wherein charge dissociation occurs via the downhill relaxation of charges through the cascaded energy landscape. We propose that there still exists an activation barrier for charge dissociation even when a NFA with a large quadrupole moment is used and the quantum efficiency of the long-range spatial dissociation depends on the initial separation distance of the CT states. If the initial separation distance between the electron and hole after isoenergetic charge transfer is satisfactory, barrier-less charge dissociation can be achieved; otherwise, charges need to overcome the activation barrier, resulting in poor charge dissociation efficiency. Another interesting finding of this study is the observation of a clear trade-off between FF and VOC caused by the deterioration of the charge dissociation efficiency when the energy offset is too small. This may be another reason why the ΔVnrs of state-of-the-art OSCs remained at approximately 0.2 V.Although we have focused on PBDB-T:Y-series blends to minimize the difference in the chemical structure and associated changes in physical properties, the observed trends can be considered as general for other NFA systems.34 As the threshold energy that can ensure high charge photogeneration quantum efficiencies may depend on the chemical structure,13,34,38 more efforts should be dedicated to unveiling the complete details of the charge separation mechanism. Extending a similar study to other donor:acceptor systems can reveal what determines the threshold energy and how the threshold energy can be reduced. In this way, clear material design guidelines can be obtained for further improving the PCE.
The role of the two NFAs in ternary blend OSCs was also elucidated. In this study, the majority NFA was selected such that a high EQEPV and ΔVnr being as close as possible to the threshold were achieved, whereas the minority NFA was chosen such that a low ΔVnr of less than 0.18 V was achieved, ignoring EQEPV. In this way, the role of the two NFAs was emphasized. We found that by introducing the minority NFA, VOC could be increased while maintaining a high EQEPV. This is likely because charge separation preferentially occurs at the donor:majority NFA interface, whereas charge recombination is more likely to occur at the donor:minority NFA interface. One drawback of this ternary blend concept is the decrease in FF upon the introduction of the minority NFA because of the same reason as that for the decrease in FF in binary blends with a too small energy offset. Therefore, future research should focus more on overcoming the trade-off between FF and VOC. If this challenge can be overcome, the PCE of our ternary blend device can be further improved.
Author contributions
Y. T. conceived and directed the project. R. S., T. S. and K. K. fabricated the devices and measured their performances. R. S., S. N. and K. K. performed steady-state optical measurements. Y. T. performed time-resolved optical measurements. R. S., T. S. and Y. T. analysed the data. Y. T. wrote the original version of the manuscript and all authors contributed to revising the manuscript. All authors have given approval to the final version of the manuscript.Conflicts of interest
There are no conflicts to declare.Acknowledgements
This study was partly supported by the JSPS KAKENHI grant numbers 21H02012, 21H05394, 22K19065, and 23H03951, JST PRESTO program grant number JPMJPR1874, and Ogasawara Toshiaki Memorial Foundation.References
- P. Bi, S. Zhang, Z. Chen, Y. Xu, Y. Cui, T. Zhang, J. Ren, J. Qin, L. Hong, X. Hao and J. Hou, Joule, 2021, 5, 2408–2419 CrossRef CAS.
- W. Gao, F. Qi, Z. Peng, F. R. Lin, K. Jiang, C. Zhong, W. Kaminsky, Z. Guan, C.-S. Lee, T. J. Marks, H. Ade and A. K.-Y. Jen, Adv. Mater., 2022, 34, 2202089 CrossRef CAS PubMed.
- L. Zhu, M. Zhang, J. Xu, C. Li, J. Yan, G. Zhou, W. Zhong, T. Hao, J. Song, X. Xue, Z. Zhou, R. Zeng, H. Zhu, C.-C. Chen, R. C. I. MacKenzie, Y. Zou, J. Nelson, Y. Zhang, Y. Sun and F. Liu, Nat. Mater., 2022, 21, 656–663 CrossRef CAS PubMed.
- C. He, Y. Pan, Y. Ouyang, Q. Shen, Y. Gao, K. Yan, J. Fang, Y. Chen, C.-Q. Ma, J. Min, C. Zhang, L. Zuo and H. Chen, Energy Environ. Sci., 2022, 15, 2537–2544 RSC.
- R. Sun, Y. Wu, X. Yang, Y. Gao, Z. Chen, K. Li, J. Qiao, T. Wang, J. Guo, C. Liu, X. Hao, H. Zhu and J. Min, Adv. Mater., 2022, 34, 2110147 CrossRef CAS PubMed.
- L. Zhan, S. Li, Y. Li, R. Sun, J. Min, Z. Bi, W. Ma, Z. Chen, G. Zhou, H. Zhu, M. Shi, L. Zuo and H. Chen, Joule, 2022, 6, 662–675 CrossRef CAS.
- Y. Wei, Z. Chen, G. Lu, N. Yu, C. Li, J. Gao, X. Gu, X. Hao, G. Lu, Z. Tang, J. Zhang, Z. Wei, X. Zhang and H. Huang, Adv. Mater., 2022, 34, 2204718 CrossRef CAS PubMed.
- Y. Tamai, Aggregate, 2022, 3, e280 CAS.
- Y. Tamai, Adv. Energy Sustainability Res., 2023, 4, 2200149 CrossRef CAS.
- M. A. Green and A. W. Y. Ho-Baillie, ACS Energy Lett., 2019, 4, 1639–1644 CrossRef CAS.
- T. M. Clarke and J. R. Durrant, Chem. Rev., 2010, 110, 6736–6767 CrossRef CAS PubMed.
- F. Gao and O. Inganäs, Phys. Chem. Chem. Phys., 2014, 16, 20291–20304 RSC.
- W. W. Li, K. H. Hendriks, A. Furlan, M. M. Wienk and R. A. J. Janssen, J. Am. Chem. Soc., 2015, 137, 2231–2234 CrossRef CAS PubMed.
- H. Imahori, Y. Kobori and H. Kaji, Acc. Mater. Res., 2021, 2, 501–514 CrossRef CAS.
- S.-i. Natsuda, T. Saito, R. Shirouchi, Y. Sakamoto, T. Takeyama, Y. Tamai and H. Ohkita, Energy Environ. Sci., 2022, 15, 1545–1555 RSC.
- R. A. Marcus, Rev. Mod. Phys., 1993, 65, 599–610 CrossRef CAS.
- T. Saito, S.-i. Natsuda, K. Imakita, Y. Tamai and H. Ohkita, Sol. RRL, 2020, 4, 2000255 CrossRef CAS.
- T. F. Hinrichsen, C. C. S. Chan, C. Ma, D. Palecek, A. Gillett, S. Chen, X. Zou, G. Zhang, H. L. Yip, K. S. Wong, R. H. Friend, H. Yan, A. Rao and P. C. Y. Chow, Nat. Commun., 2020, 11, 5617 CrossRef CAS PubMed.
- A. Karki, J. Vollbrecht, A. J. Gillett, P. Selter, J. Lee, Z. Peng, N. Schopp, A. L. Dixon, M. Schrock, V. Nádaždy, F. Schauer, H. Ade, B. F. Chmelka, G. C. Bazan, R. H. Friend and T.-Q. Nguyen, Adv. Energy Mater., 2020, 10, 2001203 CrossRef CAS.
- T. Saito, S.-i. Natsuda, R. Shirouchi, K. Imakita, K. Kohzuki and Y. Tamai, Phys. Status Solidi A, 2023 DOI:10.1002/pssa.202300121.
- W. Shockley and H. J. Queisser, J. Appl. Phys., 1961, 32, 510–519 CrossRef CAS.
- U. Rau, Phys. Rev. B: Condens. Matter Mater. Phys., 2007, 76, 085303 CrossRef.
- J. Yao, T. Kirchartz, M. S. Vezie, M. A. Faist, W. Gong, Z. He, H. Wu, J. Troughton, T. Watson, D. Bryant and J. Nelson, Phys. Rev. Appl., 2015, 4, 014020 CrossRef.
- U. Rau, B. Blank, T. C. M. Müller and T. Kirchartz, Phys. Rev. Appl., 2017, 7, 044016 CrossRef.
- J. Benduhn, K. Tvingstedt, F. Piersimoni, S. Ullbrich, Y. Fan, M. Tropiano, K. A. McGarry, O. Zeika, M. K. Riede, C. J. Douglas, S. Barlow, S. R. Marder, D. Neher, D. Spoltore and K. Vandewal, Nat. Energy, 2017, 2, 17053 CrossRef CAS.
- M. Azzouzi, J. Yan, T. Kirchartz, K. Liu, J. Wang, H. Wu and J. Nelson, Phys. Rev. X, 2018, 8, 031055 CAS.
- F. D. Eisner, M. Azzouzi, Z. Fei, X. Hou, T. D. Anthopoulos, T. J. S. Dennis, M. Heeney and J. Nelson, J. Am. Chem. Soc., 2019, 141, 6362–6374 CrossRef CAS PubMed.
- X.-K. Chen, D. Qian, Y. Wang, T. Kirchartz, W. Tress, H. Yao, J. Yuan, M. Hülsbeck, M. Zhang, Y. Zou, Y. Sun, Y. Li, J. Hou, O. Inganäs, V. Coropceanu, J.-L. Bredas and F. Gao, Nat. Energy, 2021, 6, 799–806 CrossRef CAS.
- L. Zhu, J. Zhang, Y. Guo, C. Yang, Y. Yi and Z. Wei, Angew. Chem., Int. Ed., 2021, 60, 15348–15353 CrossRef CAS PubMed.
- M. B. Price, P. A. Hume, A. Ilina, I. Wagner, R. R. Tamming, K. E. Thorn, W. Jiao, A. Goldingay, P. J. Conaghan, G. Lakhwani, N. J. L. K. Davis, Y. Wang, P. Xue, H. Lu, K. Chen, X. Zhan and J. M. Hodgkiss, Nat. Commun., 2022, 13, 2827 CrossRef CAS PubMed.
- Z. Jia, Z. Chen, X. Chen, L. Bai, H. Zhu and Y. M. Yang, J. Phys. Chem. Lett., 2021, 12, 151–156 CrossRef CAS PubMed.
- F. Liu, L. Zhou, W. Liu, Z. Zhou, Q. Yue, W. Zheng, R. Sun, W. Liu, S. Xu, H. Fan, L. Feng, Y. Yi, W. Zhang and X. Zhu, Adv. Mater., 2021, 33, 2100830 CrossRef CAS PubMed.
- J. Zhang, W. Liu, G. Zhou, Y. Yi, S. Xu, F. Liu, H. Zhu and X. Zhu, Adv. Energy Mater., 2020, 10, 1903298 CrossRef CAS.
- S. Karuthedath, J. Gorenflot, Y. Firdaus, N. Chaturvedi, C. S. P. De Castro, G. T. Harrison, J. I. Khan, A. Markina, A. H. Balawi, T. A. D. Peña, W. Liu, R.-Z. Liang, A. Sharma, S. H. K. Paleti, W. Zhang, Y. Lin, E. Alarousu, D. H. Anjum, P. M. Beaujuge, S. De Wolf, I. McCulloch, T. D. Anthopoulos, D. Baran, D. Andrienko and F. Laquai, Nat. Mater., 2021, 20, 378–384 CrossRef CAS PubMed.
- J. Yuan, Y. Q. Zhang, L. Y. Zhou, G. C. Zhang, H. L. Yip, T. K. Lau, X. H. Lu, C. Zhu, H. J. Peng, P. A. Johnson, M. Leclerc, Y. Cao, J. Ulanski, Y. F. Li and Y. P. Zou, Joule, 2019, 3, 1140–1151 CrossRef CAS.
- J. Bertrandie, J. Han, C. S. P. De Castro, E. Yengel, J. Gorenflot, T. Anthopoulos, F. Laquai, A. Sharma and D. Baran, Adv. Mater., 2022, 34, 2202575 CrossRef CAS PubMed.
- L. Perdigón-Toro, H. Zhang, A. Markina, J. Yuan, S. M. Hosseini, C. M. Wolff, G. Zuo, M. Stolterfoht, Y. Zou, F. Gao, D. Andrienko, S. Shoaee and D. Neher, Adv. Mater., 2020, 32, 1906763 CrossRef PubMed.
- K. Kawashima, Y. Tamai, H. Ohkita, I. Osaka and K. Takimiya, Nat. Commun., 2015, 6, 10085 CrossRef CAS PubMed.
- T. Umeyama, K. Igarashi, D. Sasada, Y. Tamai, K. Ishida, T. Koganezawa, S. Ohtani, K. Tanaka, H. Ohkita and H. Imahori, Chem. Sci., 2020, 11, 3250–3257 RSC.
- K. Vandewal, K. Tvingstedt, A. Gadisa, O. Inganäs and J. V. Manca, Phys. Rev. B: Condens. Matter Mater. Phys., 2010, 81, 125204 CrossRef.
- K. Vandewal, K. Tvingstedt, J. V. Manca and O. Inganäs, IEEE J. Sel. Top. Quantum Electron., 2010, 16, 1676–1684 CAS.
- S.-i. Natsuda, Y. Sakamoto, T. Takeyama, R. Shirouchi, T. Saito, Y. Tamai and H. Ohkita, J. Phys. Chem. C, 2021, 125, 20806–20813 CrossRef CAS.
- Y. Tamai, H. Ohkita, H. Benten and S. Ito, J. Phys. Chem. Lett., 2015, 6, 3417–3428 CrossRef CAS PubMed.
- A. Karki, J. Vollbrecht, A. J. Gillett, S. S. Xiao, Y. Yang, Z. Peng, N. Schopp, A. L. Dixon, S. Yoon, M. Schrock, H. Ade, G. N. M. Reddy, R. H. Friend and T.-Q. Nguyen, Energy Environ. Sci., 2020, 13, 3679–3692 RSC.
- A. J. Gillett, A. Privitera, R. Dilmurat, A. Karki, D. Qian, A. Pershin, G. Londi, W. K. Myers, J. Lee, J. Yuan, S.-J. Ko, M. K. Riede, F. Gao, G. C. Bazan, A. Rao, T.-Q. Nguyen, D. Beljonne and R. H. Friend, Nature, 2021, 597, 666–671 CrossRef CAS PubMed.
- G. Lakhwani, A. Rao and R. H. Friend, Annu. Rev. Phys. Chem., 2014, 65, 557–581 CrossRef CAS PubMed.
- T. Fukuhara, Y. Tamai and H. Ohkita, Sustainable Energy Fuels, 2020, 4, 4321–4351 RSC.
- Y. Tamai, K. Tsuda, H. Ohkita, H. Benten and S. Ito, Phys. Chem. Chem. Phys., 2014, 16, 20338–20346 RSC.
- Y. Tamai, Polym. J., 2020, 52, 691–700 CrossRef CAS.
- Y. Sakamoto, S. Izawa, H. Ohkita, M. Hiramoto and Y. Tamai, Commun. Mater., 2022, 3, 76 CrossRef CAS.
- S.-i. Natsuda, T. Saito, R. Shirouchi, K. Imakita and Y. Tamai, Polym. J., 2022, 54, 1345–1353 CrossRef CAS.
- P. Wan, X. Chen, Q. Liu, S. Mahadevan, M. Guo, J. Qiu, X. Sun, S.-W. Tsang, M. Zhang, Y. Li and S. Chen, J. Phys. Chem. Lett., 2021, 12, 10595–10602 CrossRef CAS PubMed.
- S. Gélinas, A. Rao, A. Kumar, S. L. Smith, A. W. Chin, J. Clark, T. S. van der Poll, G. C. Bazan and R. H. Friend, Science, 2014, 343, 512–516 CrossRef PubMed.
- Y. Tamai, Y. Fan, V. O. Kim, K. Ziabrev, A. Rao, S. Barlow, S. R. Marder, R. H. Friend and S. M. Menke, ACS Nano, 2017, 11, 12473–12481 CrossRef CAS PubMed.
- Y. Zhong, M. Causa, G. J. Moore, P. Krauspe, B. Xiao, F. Gunther, J. Kublitski, R. Shivhare, J. Benduhn, E. BarOr, S. Mukherjee, K. M. Yallum, J. Rehault, S. C. B. Mannsfeld, D. Neher, L. J. Richter, D. M. DeLongchamp, F. Ortmann, K. Vandewal, E. Zhou and N. Banerji, Nat. Commun., 2020, 11, 833 CrossRef CAS PubMed.
- A. A. Bakulin, A. Rao, V. G. Pavelyev, P. H. van Loosdrecht, M. S. Pshenichnikov, D. Niedzialek, J. Cornil, D. Beljonne and R. H. Friend, Science, 2012, 335, 1340–1344 CrossRef CAS PubMed.
- M. A. Green, Solid-State Electron., 1981, 24, 788–789 CrossRef CAS.
- J. Hou, O. Inganäs, R. H. Friend and F. Gao, Nat. Mater., 2018, 17, 119–128 CrossRef CAS PubMed.
- L. Onsager, Phys. Rev., 1938, 54, 554–557 CrossRef CAS.
- C. L. Braun, J. Chem. Phys., 1984, 80, 4157–4161 CrossRef CAS.
- S. Izawa and M. Hiramoto, Nat. Photonics, 2021, 15, 895–900 CrossRef CAS.
Footnote |
| † Electronic supplementary information (ESI) available. See DOI: https://doi.org/10.1039/d3ta01928d |
| This journal is © The Royal Society of Chemistry 2023 |