
Studying the droplet sliding velocity and charge transfer at a liquid–solid interface†
Xuejiao
Wang‡
ab,
Jinyang
Zhang‡
bc,
Xin
Liu
bd,
Shiquan
Lin
bc and
Zhong Lin
Wang
 *bce
*bce
aCenter on Nanoenergy Research, School of Physical Science and Technology, Guangxi University, Nanning 530004, Guangxi, P.R. China
bBeijing Institute of Nanoenergy and Nanosystems, Chinese Academy of Sciences, Beijing 100083, P. R. China
cSchool of Nanoscience and Technology, University of Chinese Academy of Sciences, Beijing 100049, P. R. China
dCollege of Engineering, Zhejiang Normal University, Zhejiang 321000, P. R. China
eGeorgia Institute of Technology, Atlanta, GA 30332-0245, USA. E-mail: zlwang@gatech.edu
First published on 9th February 2023
Abstract
The contact electrification between liquid and solid has attracted widespread attention in the fields of energy, physics and chemistry, but its basic mechanism still remains unclear, especially for charge transfer at a liquid–solid interface. Here, the droplet triboelectric nanogenerator (droplet-TENG) was used as a probe to measure the charge transfer at different sliding speeds of a moving droplet. By varying the sliding speed and concentration of the moving droplet, the transferred charges generated at a liquid–solid interface are found to be highly dependant on the sliding velocity of the droplet on the hydrophobic surface: the faster sliding speed leads to more transferred charges. However, such effect is not obvious when the droplet has higher concentration, which provides direct evidence of a “two-step” model for the formation of the electric double-layer (EDL): where electron transfer occurs when the liquid droplet contacts a hydrophobic surface for the very first time, and then ion adsorption follows. The process of surface charge transfer is probed by droplet-TENG. This work is significant for better understanding of the charge transfer at a liquid–solid interface, and devises a method to maximize tribocharging in droplet-TENG, describing a concept potentially suitable for velocity sensing applications based on the self-powered droplet-TENG.
Introduction
The contact and separation of two materials generates electrical charge, termed contact electrification,1–3 and is a well-known subject occurring in everyday life. Recent studies show that contact electrification occurs not only at a solid–solid interface,4–6 but also at liquid–solid7,8 and liquid–liquid interfaces.9,10 Although applications based on contact electrification in energy,11–13 physics14 and surface chemistry,15–18 such as triboelectric nanogenerators, have been widely studied, the exact mechanism of the triboelectric effect is still controversial and unclear.19,20 How the charges are transferred between the two contacting materials, whether this involves electrons21–24 or adsorbed ions,25 is still debated, especially for liquid–solid cases.Most studies involving contact electrification at liquid–solid interfaces, have been for harvesting water energy26–30 and improving the output performance of a triboelectric nanogenerator (TENG)28,31,32 by modification of the electronic properties of the contacting materials.33–35 However, contact electrification involves not only the electronic properties of the contacting materials,36,37 but also the state of motion of the droplet.38,39 Notably, physical properties such as the velocity of the moving droplet is rarely accounted for when trying to maximize (or minimize) the electrification of liquid–solid contacts. In recent work, we have developed a simple self-powered droplet-TENG with spatially arranged metallic electrodes as a probe for measuring the charge transfer between liquid and solid surfaces at different positions.40 It is revealed that the transferred charges are not the same at different positions of the tribocharged solid surface. However, the detailed explanation still needs to be explored and there is no doubt that the charge transfer at different positions is related to the state of motion of the droplet, such as sliding speed, but its mechanism is still not clear.
In this work, we have used a simple droplet-TENG as a probe for quantifying the transferred charge when the water droplet moves on a hydrophobic fluorinated ethylene propylene (FEP) surface. By varying the sliding speed and concentration of the droplet, we have studied quantitatively the relationship between the sliding speed of the moving droplet and transferred charge at the liquid–solid interface. Our study reveals that the transferred charge generated at a liquid–solid interface is highly dependant on the velocity of the droplet, but this effect is reduced when the droplet has higher concentration. Moreover, we have also investigated the velocity effect on the charge saturation phenomenon. A two-step model of electron and ion transfer is proposed, where the ions adsorbed shield the net surface on the solid surface. This study may provide a new strategy for velocity sensor development.
Results and discussion
Fig. 1a shows the experimental setup, where the droplet-TENG is inserted at an angle using a fixed holder. Each droplet (60 μL) is released from a grounded stainless-steel syringe (3.5 mm diameter) by a syringe pump in a vertical drop at a fixed angle (60°) at a certain height above the surface. The water contact angle of the FEP film is 103° as shown in Fig. 1b, and exhibits a certain degree of hydrophobicity, thus, the liquid droplets are easier to slide. As shown in Fig. 1c, the droplet-TENG used in the experiments consists of three layers. The top layer is the FEP film generating contact electrification with the droplet, the middle layer is the copper electrode used for electrostatic induction, and the bottom layer is the PMMA plate for support. When the droplet slides through the FEP surface, the copper electrode under the FEP film, which is connected to the grounded electrometer, measures the induced current obtained by the interaction between the droplet and the FEP film. The peak currents and charges generated when the droplets are in contact with and separated from, the FEP film are expressed as jc, js and qc, qs, respectively. As shown in Fig. 1d, when the first water droplet flows through the FEP film at a slow sliding rate, the induced current jc and js can be measured as −39 nA and 16 nA, respectively. After integrating the current peak, the corresponding transferred charges qc and qs can be calculated as −0.71 nC and 0.53 nC, respectively. Similarly, we can obtain both induced currents (−66 nA and 15.9 nA) and transferred charges (0.9 nC and 0.55 nC) with the fast-sliding rate (Fig. 1e). The difference between qc and qs (‖qc| − |qs‖) indicates the transferred charges Q at two different speeds, which are 0.18 nC and 0.35 nC, respectively.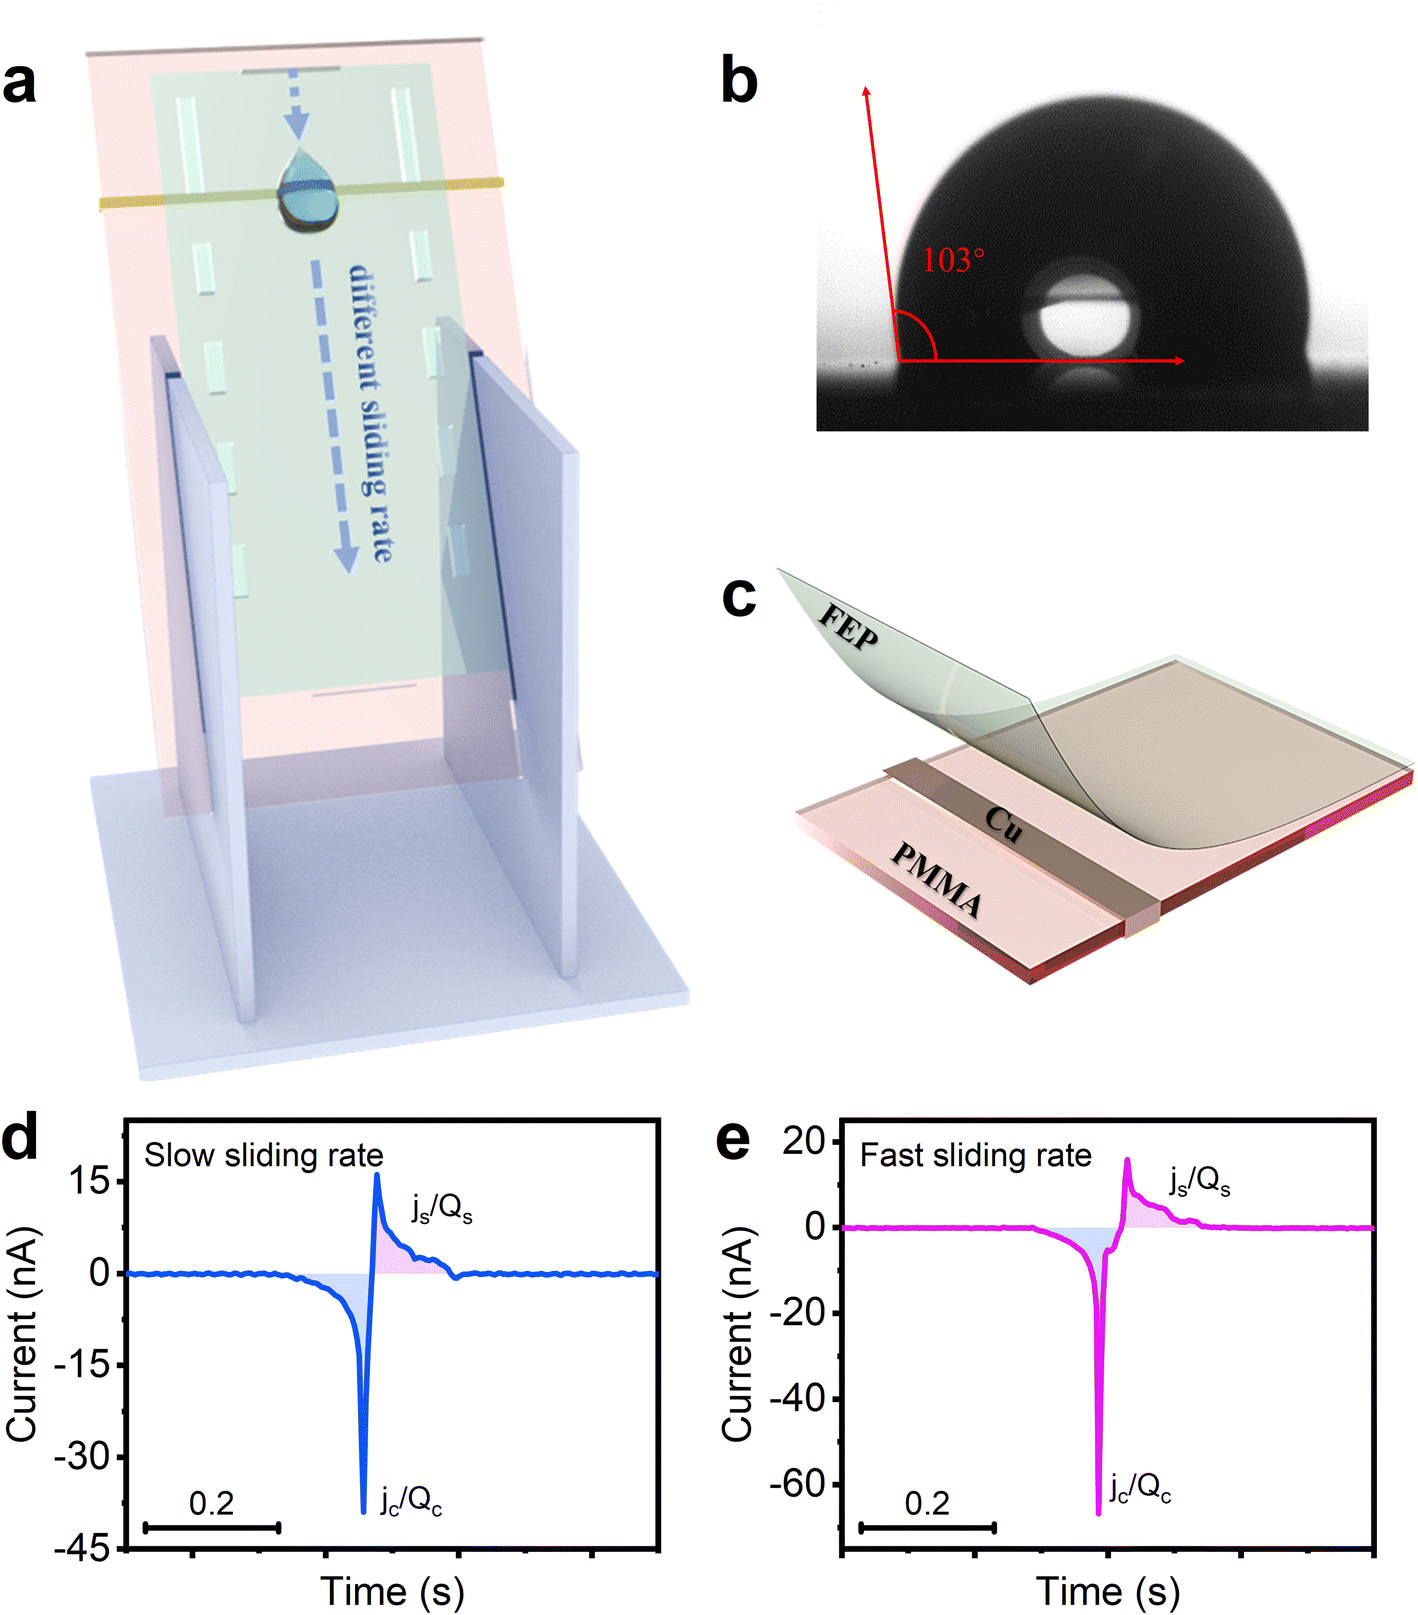 | ||
| Fig. 1 Experimental setup. (a) Experimental schematic of the droplet-TENG: when a drop of liquid slides down the FEP surface at different speeds, charge transfer occurs between the liquid and the solid, and the current signal is measured by an electrometer. (b) Contact angle of static water on the FEP film. (c) Droplet-TENG structure: the bottom layer is a PMMA plate for support, the copper electrode in the middle is used for electrostatic induction, and the top layer is a FEP film used to generate contact electrification with the droplet. (d and e) Typical current output curves at relatively slow and fast sliding speeds when a water droplet falls to contact with and separate from, the FEP film on the copper electrode. jc and js refer to the induced currents, while Qc and Qs refer to the induced charges during the contact or separation of the water drop, respectively. | ||
In order to better understand the role of sliding speed of the droplet on the charge transfer at a liquid–solid interface, we tried to vary the initial velocity, as well as the speed past the copper electrode. First, we tried to change the initial velocity by varying the drop height of the water droplet. Our data in Fig. 2a show that the amount of transferred charge Q, is proportional to the drop height when the droplet is dropped from different heights of 8 mm, 15 mm, 20 mm, 25 mm, and 30 mm. The current is also related to the drop height, as shown in Fig. 2b and S1.† Fig. S2† demonstrates the relationship between sliding velocity and drop height. The average velocity is obtained by a high-speed camera in Fig. S3,† and it can be observed that the sliding velocity increases with the increase of the drop height, showing that varying the drop height of the water droplet is an effective way to change the sliding speed of the droplet. We also investigated the effect of sliding velocity on the process of charge transfer at different sliding positions. As we all known, the process of the droplet sliding down the surface is an accelerating movement. Thus, the velocity should be different at different sliding positions. Our data in Fig. 2c quantify the transferred charges by contact charging between the FEP film and the water droplet at the sliding distance of 2, 4, 6, 8 and 10 cm. Note that the sliding distance refers to the distance between the droplet’s falling position and the copper electrode. The transferred charges scale in proportion to the sliding distance as shown in Fig. 2c, and the transferred charge increases with the increasing sliding distance. Also, Fig. 2d shows that the detection time (the time for the droplet to slide across the copper electrode), is decreased when the sliding distance is increased, which proves the movement of the water droplet on the FEP surface is definitely an accelerating movement. The photographs captured by the high-speed camera can also support this, as shown in Fig. 2e. And we found the velocity effects also exist on water–PTFE contacts (Fig. S4†), not only limited to FEP. The above results all prove the transferred charges generated at a liquid–solid interface are highly dependant on the velocity of the droplet on the hydrophobic surface: the faster the sliding speed, the higher the transferred charge.
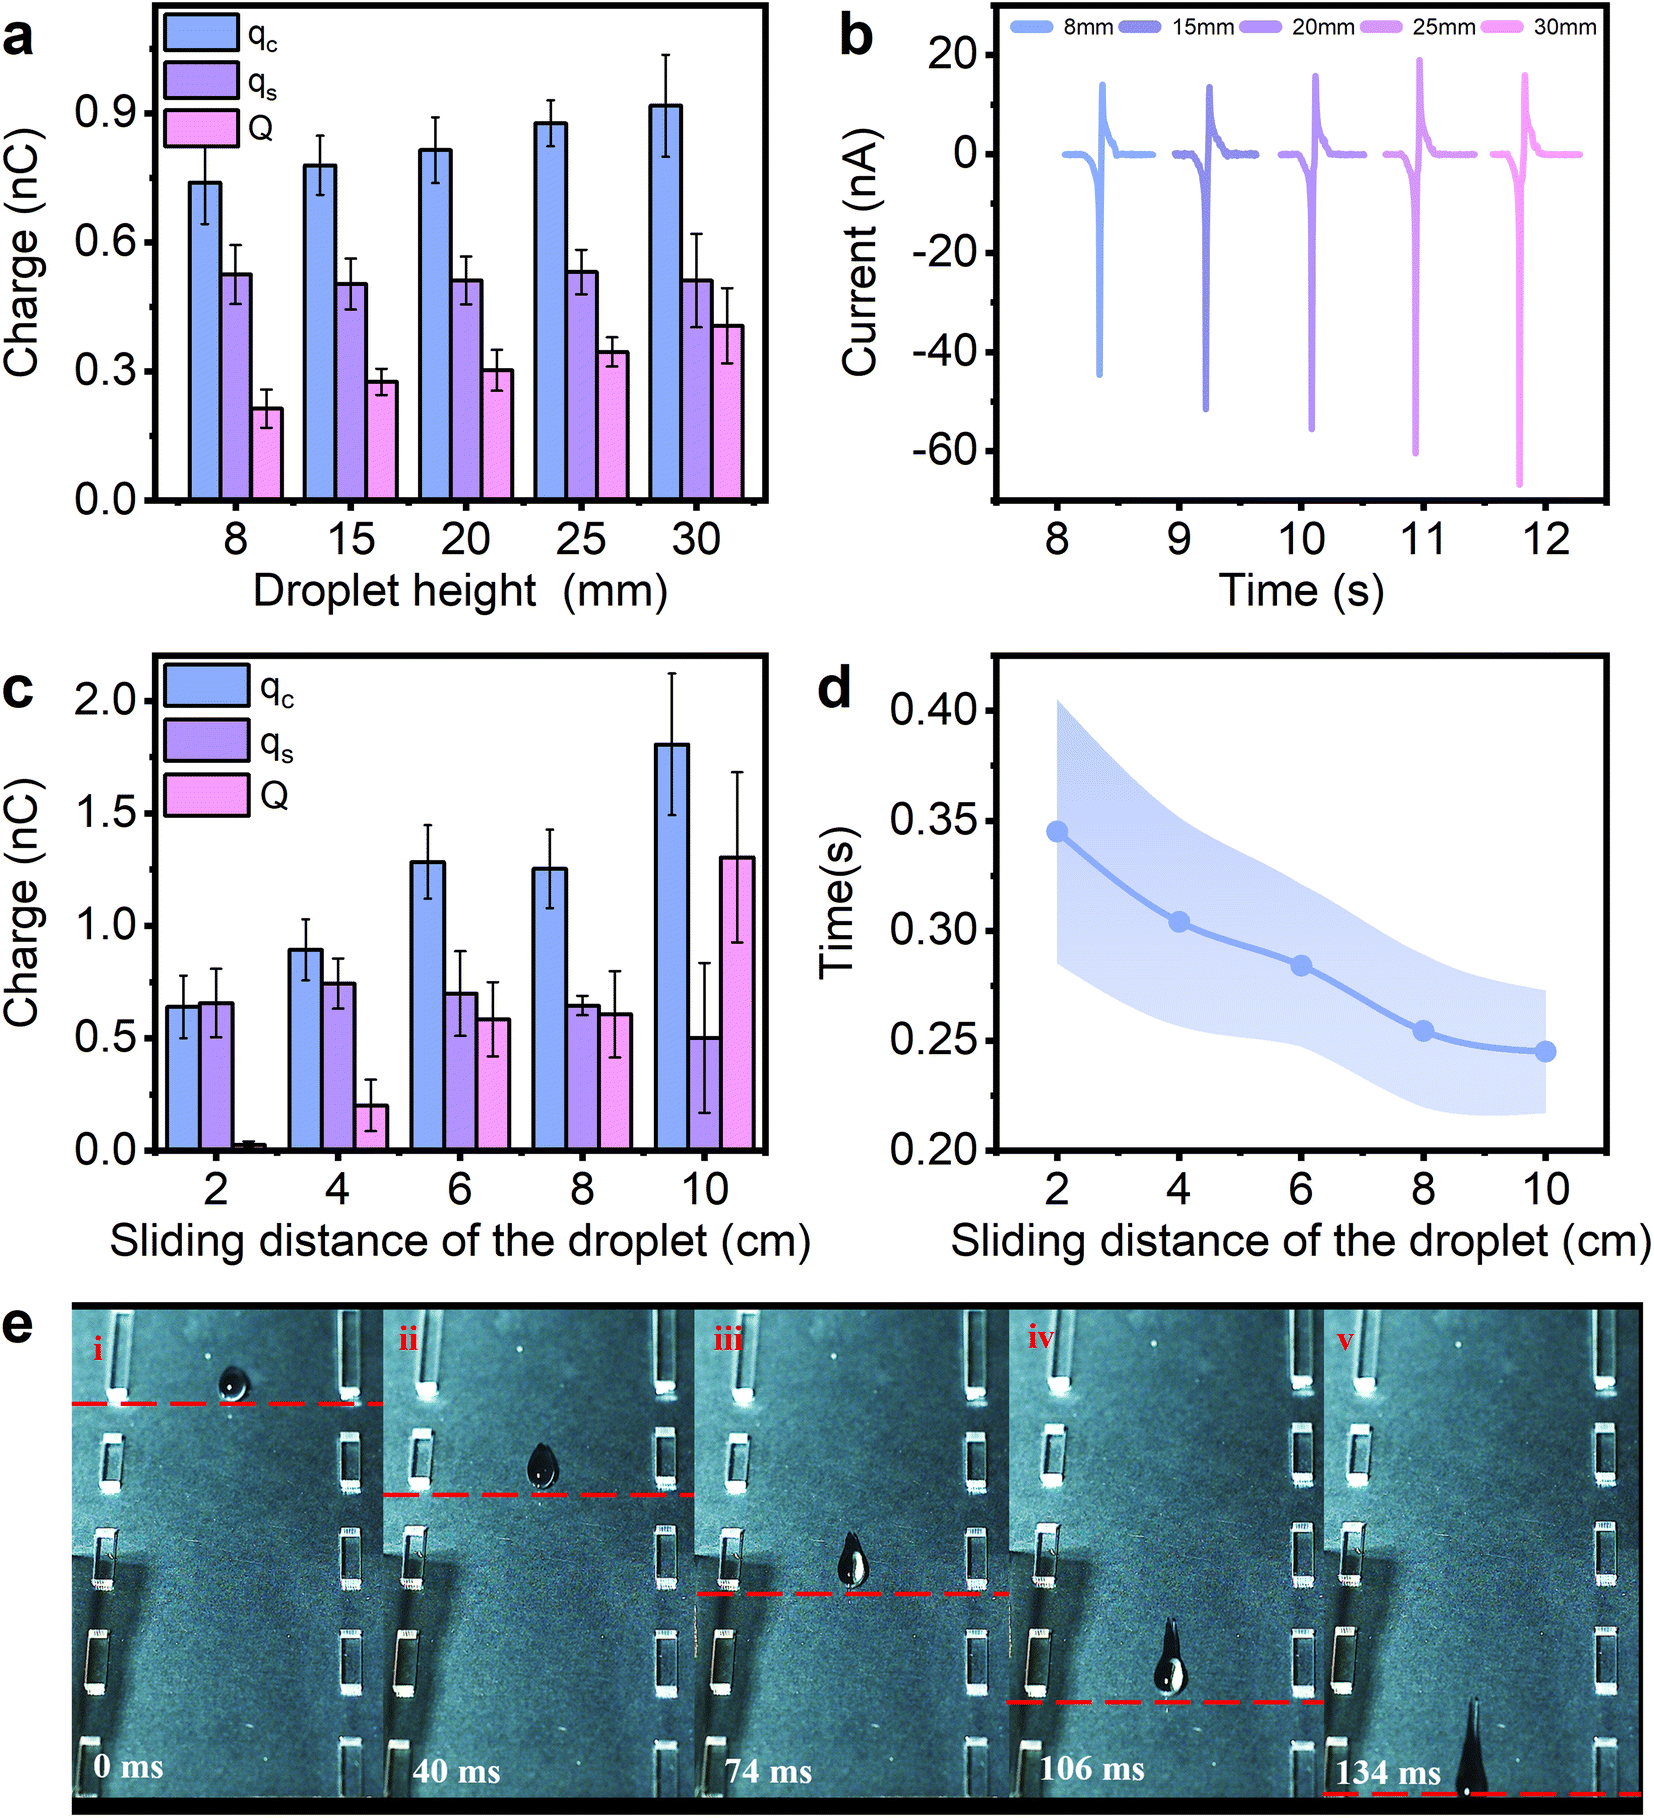 | ||
| Fig. 2 Electricity generation performance of liquid droplets sliding at different speeds on FEP films. (a and b) The transfer charge Q = ‖qc| − |qs‖ and the induced current measured for water droplets falling at different drop heights. (c and d) The amount of transferred charge obtained at different sliding positions and the corresponding time. The time here is for the droplet to slide across the copper electrode. (e) Snapshots showing the motion of a water droplet sliding over the FEP film. The droplet height here was set at 8 mm. | ||
The influence of the sliding velocity on the charge saturation process was also studied. The different sliding speeds in the charge saturation experiments were achieved by changing the drop height. The results in Fig. 3a–c show that the unsaturated blue region lasted 84 s at a drop height of 8 mm, 146 s at a drop height of 15 mm, and 1114 s when the drop height was 30 mm, which means the charge saturation rate decreases with the increase of sliding speed of the water droplet. In the investigation of the voltage saturation rate (Fig. 3d–f), the same trend was observed. The slopes of the saturation curves for charge and voltage at different sliding speeds are shown in Fig. S5.† However, although the charge/voltage saturation rates at different sliding speeds are different, the amount of final saturation charge/voltage are almost the same, which are reached at approximately −155 nC and 160 V. This reveals that the sliding velocity only influences the charge/voltage saturation rate, but not the amount of final saturation charge/voltage.
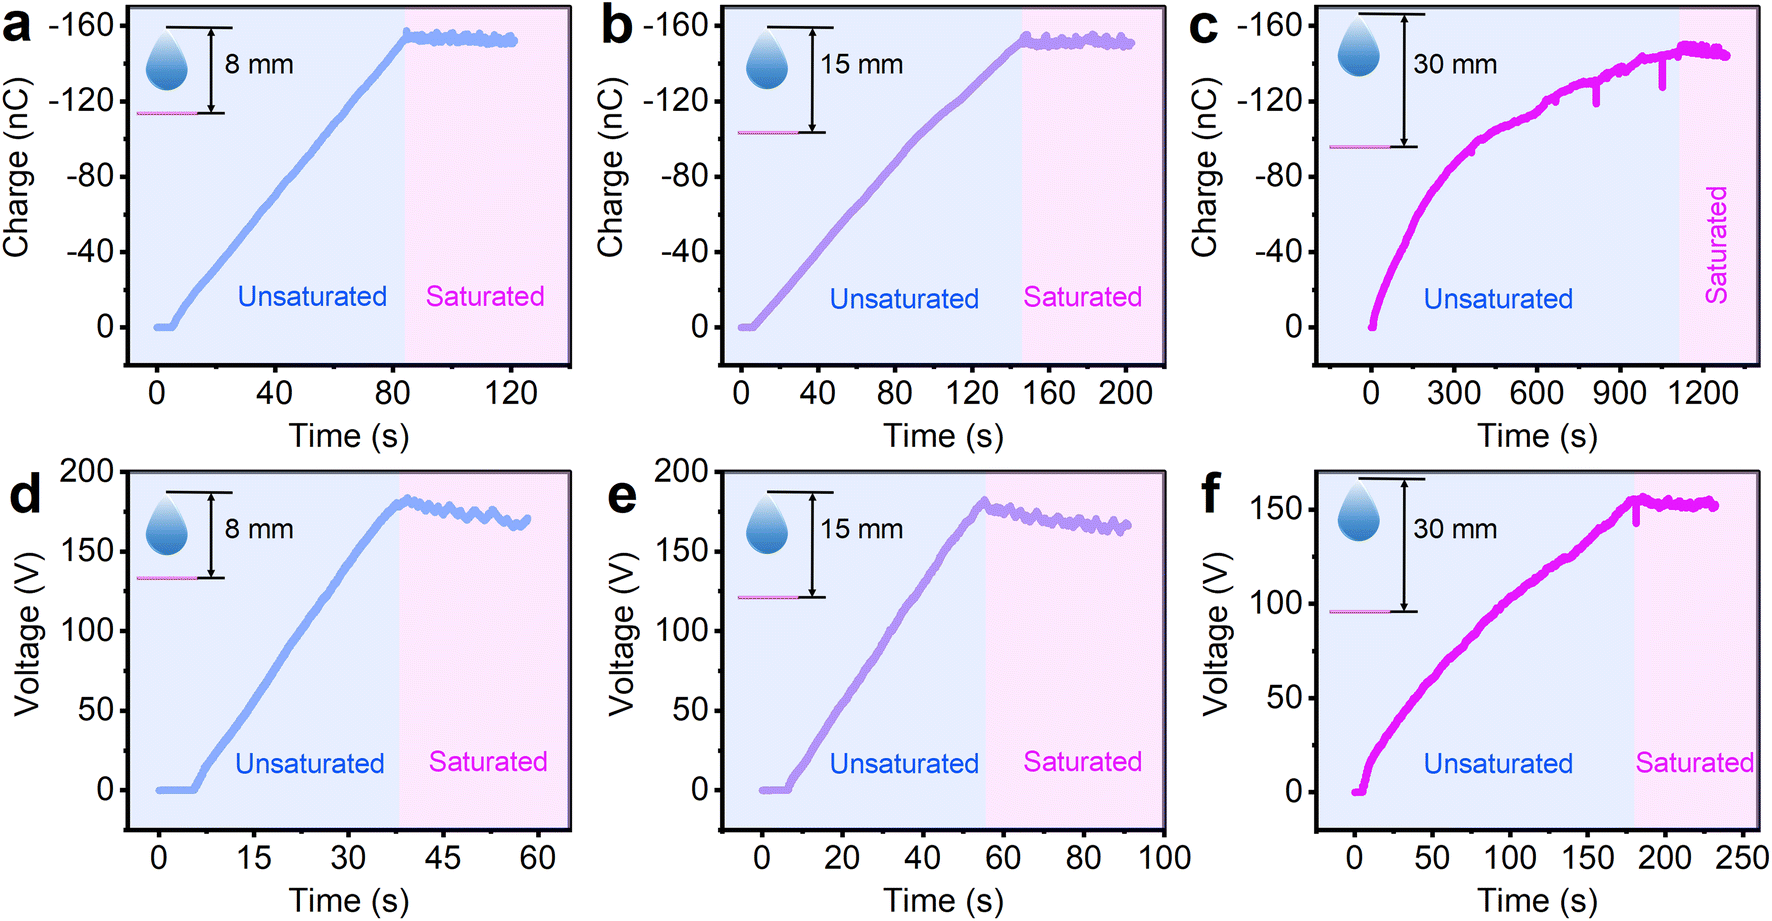 | ||
| Fig. 3 The influence of the sliding velocity on the charge saturation process. (a–c) The transferred charges are recorded when the droplet falls at a height of 8, 15 and 30 mm. The blue area on the left shows the unsaturated region, and the purple color on the right shows the charge in the dynamic saturation state. (d–f) The voltage from unsaturated to dynamic saturation curves at three different drop heights. | ||
To further verify the velocity effect, droplets with various concentrations of ions are also tested in experiments. As seen in Fig. 4a, the water droplet (here 0 mol L−1 NaCl, drop from a height of 8 mm) generated the highest transferred charge (0.21 nC in Fig. 4a), while the amount of transferred charge gradually decrease (from 0.21 nC to 0.07 nC) when the concentration of NaCl increases from 0 to 1 mol L−1. This is consistent with our previous work40 and the reason is attributed to the adsorbed ions on the FEP surface shielding the net surface measured. When the NaCl droplet with lower concentration is separated from the FEP surface, only a small amount of Na+ is left on the FEP surface and thus the higher net charges are detected. However, when the NaCl droplet with higher concentration is sliding through the FEP surface, more Na+ is adsorbed on the FEP surface, leading to a higher shielding effect and thus the lower net charges measured. We also performed this experiment at different sliding speeds when the concentration of NaCl is 0.01 mol L−1 as shown in Fig. 4b, and a similar trend was observed: the maximum charge transfer is obtained when the drop height is 30 mm, which is the fastest sliding speed compared with the drop heights of 8 mm and 15 mm. This shows that the effect of velocity on the transferred charge is not limited to water, but also to solutions with abundant ions. In Fig. 4c, the relationship between the ion concentrations, transferred charges, and different sliding speeds is further investigated. Meanwhile, the slope of the fitted line can be obtained in Fig. S6.† Although the amount of the transferred charge all decrease when the concentration of NaCl increases at different sliding speeds, the velocity effect is reduced when the droplet has higher concentration, for example, 1 mol L−1 NaCl solution. From Fig. 4c, as the velocity increases, the amount of transferred charge remains almost constant when the concentration of NaCl is as high as 1 mol L−1. In other words, when the ion concentration reaches a certain level, the effect of sliding velocity on the transferred charges is negligible. This can also be explained by the adsorbed ions on the FEP surface which shield the transferred charges measured. When a droplet with high ion concentration slides over the FEP surface, a large number of ions remain on the FEP surface.22 In this case, the change in ion residues is almost the same at different sliding speeds and thus similar transferred charge is detected.
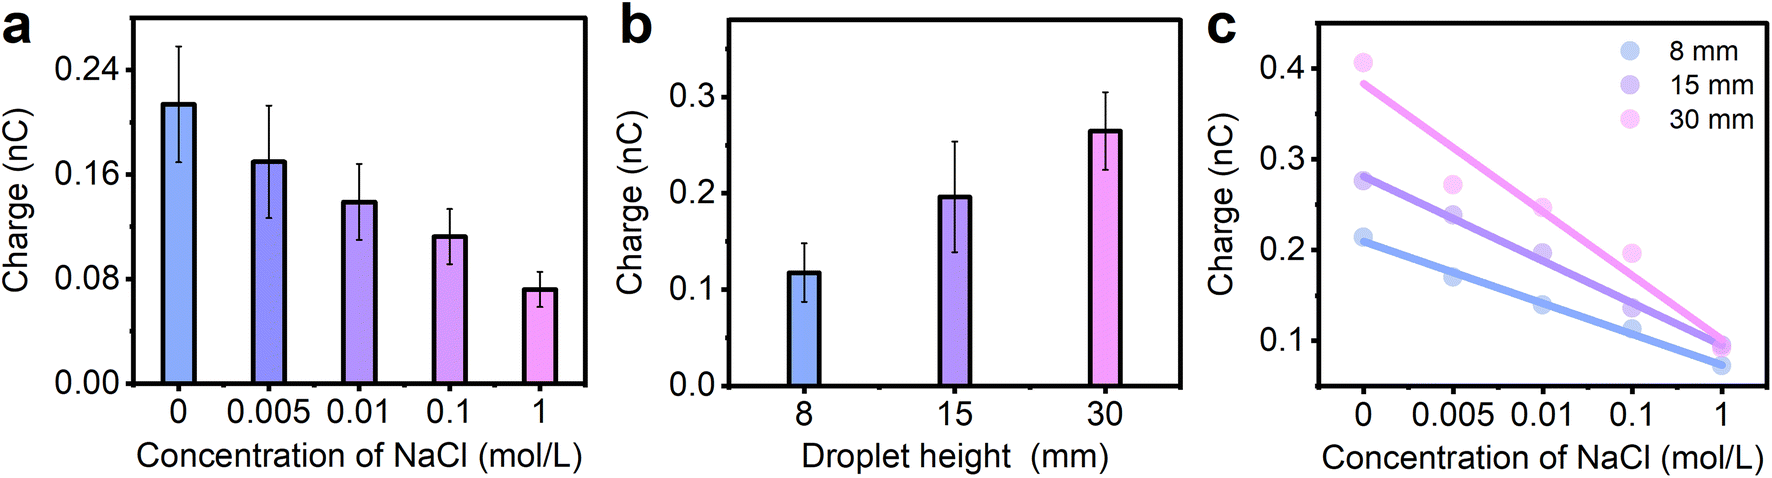 | ||
| Fig. 4 Contact electrification between NaCl droplets and the FEP film. (a) Transferred charges measured at different concentrations of NaCl solution sliding on the FEP film. (b) The amount of transferred charges at different drop heights when the concentration of NaCl is 0.01 mol L−1. (c) The effect of two parameters – NaCl concentration and drop height – on the transferred charges. | ||
When the liquid droplet contacts the FEP surface, electrons will transfer first from the water to FEP and this process is very fast, leading to the negatively charged FEP surface. And in the second step due to electrostatic interactions, opposite free ions in the liquid are attracted to the charged FEP surface.21,41 After the droplet separated from the FEP surface, the adsorbed ions left on the FEP surface will shield the transferred charges measured. In this way, the longer the contact time between the droplet and FEP, the more ions have chance to adsorb on the FEP, and thus the stronger shielding effect should be observed. In our experiments, when the droplet is moving slowly on the FEP surface, more Na+ has chance to adsorb on the FEP surface, leading to a strong shielding effect and the reduction of the net charges measured by the electrometer (Fig. 5a). In contrast, fast droplet sliding leads to less cations adsorbing on the FEP surface and higher net charges detected (Fig. 5b). For saturation phenomenon, the fast sliding of the water droplet results in a slower accumulation of ions adsorbed on the FEP surface, thus affecting the charge saturation rate.
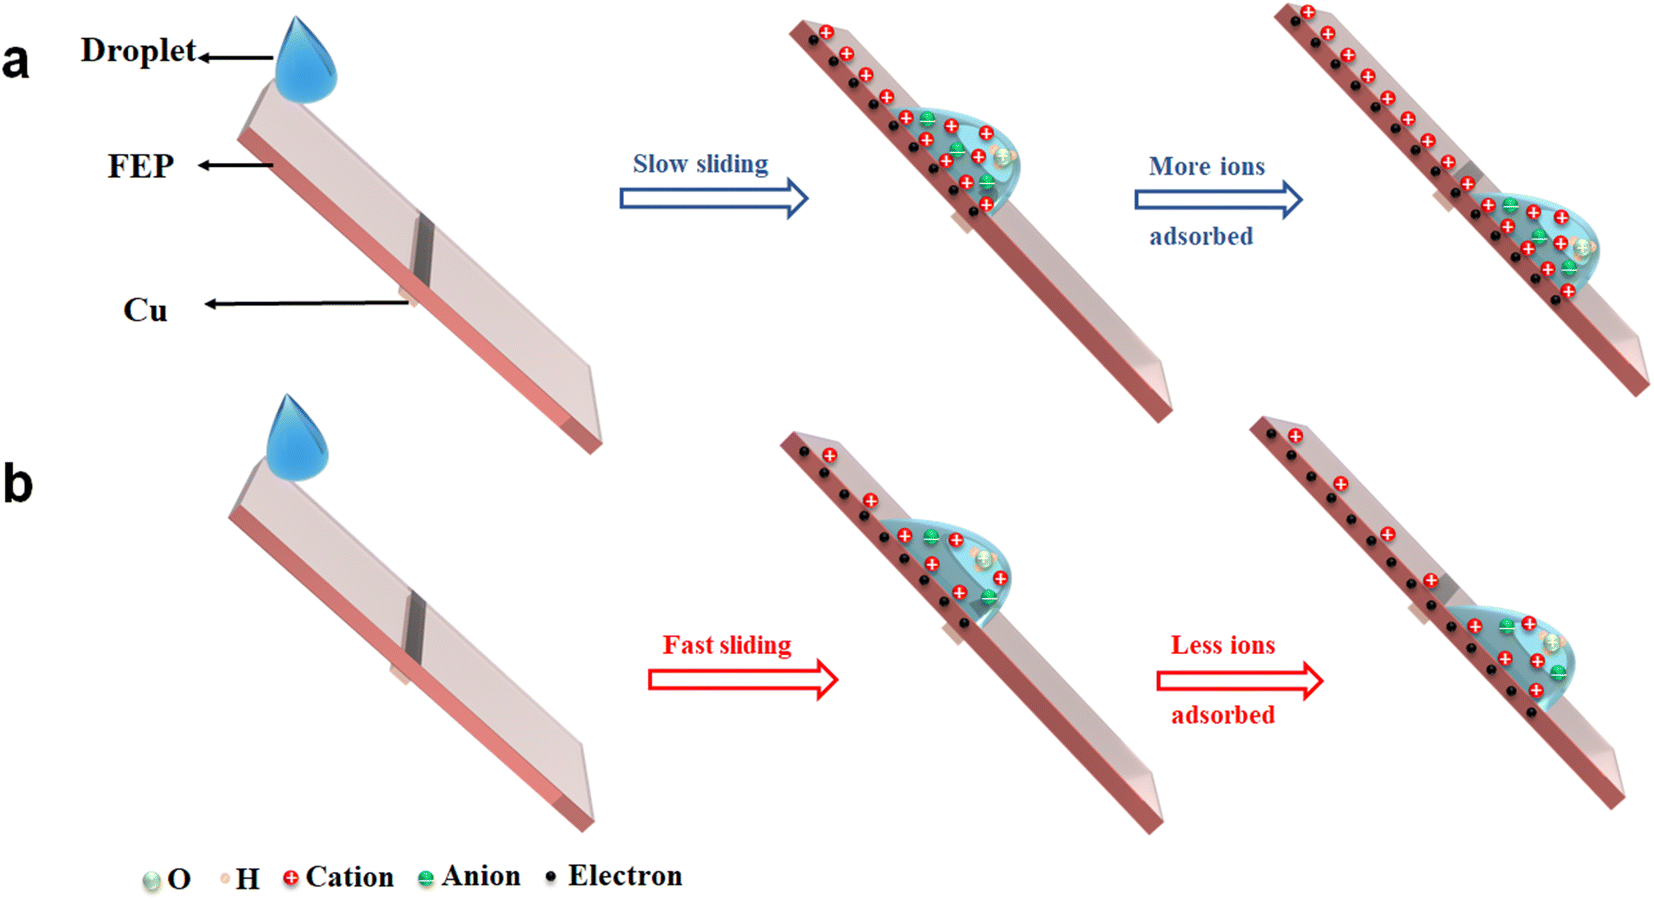 | ||
| Fig. 5 Schematic illustration of the working principle of the droplet-TENG for sensing sliding speed. The liquid droplet moves on a FEP surface at a slow (a) or fast (b) sliding rate. When the droplet is moving slow on the FEP surface, more Na+ adsorbs on the FEP surface, leading to a strong shielding effect and the reduction of the net charge measured by the electrometer. However, when the speed is fast, the story is completely the opposite. | ||
Conclusions
In this study, a droplet-TENG with a copper electrode as a probe was used to explore the effect of droplet sliding velocity on charge transfer. By varying both the drop height and the electrode position, it is verified that the sliding velocity is proportional to the transferred charges measured at the liquid–solid interface: the faster sliding speed leads to higher transferred charges measured. However, such effect is no longer obvious when the droplet has higher concentration. The influence of the sliding velocity on the charge saturation process is also studied and reveals that the sliding velocity only influences the charge saturation rate, but not the amount of final saturation charge. A mechanism based on the ions adsorbed and shielding effect is proposed. The relationship between the sliding rate and concentration of inorganic solution, with the transferred charge upon contact electrification, were studied in detail, which further supports this mechanism. Moreover, these results confirm the existence of Wang’s hybrid layer, which is where electrons transfer first and then the ions are adsorbed. This work expands our understanding of contact electrification at the liquid–solid interface and devises a physical method to maximize contact charging at a liquid–solid interface, as well as outlining a new concept suitable for the velocity sensing based on the probe, droplet-TENG.Experimental section
Materials
The FEP film (thickness = 30 μm) was bought from DAIKIN (Japan). The films are cut to a rectangle of size 75 × 135 mm2, and used as the contact with the liquid droplet. Deionized water with a conductivity of 18 MΩ cm¬1 which can exclude ionic interference was used to prepare solutions and for substrate cleaning. NaCl was purchased from Aladdin, and the salt solution was prepared with deionized water to a concentration of 1 mol L−1 and then diluted to different concentrations for the experiments. It is worth noting that all film samples were first washed with deionized water, then sprayed with alcohol to evaporate naturally on the surface, and finally dried on an electrostatic blower for three minutes. The purpose is to remove the excess charge from the sample surface before use.Fabrication of droplet-TENG
The copper film (thickness 30 μm) is cut to a width of only 2 mm for the copper electrode. Smooth and clean PMMA plates (80 × 150 × 3 mm3) with 1 cm length reference lines engraved on both sides were used as the backboards. A thin line 0.5 mm wide was engraved on the PMMA plate tip as the starting point for droplet contact, which ensured that the droplet remained in the same position as the droplet-TENG contact each time. The copper electrode was first attached to the PMMA plate, and then the film was carefully attached to both. Note that the attached film should cover all areas of the copper film to avoid chemical corrosion and electrical interference. The water droplet can be treated as a resistor (Rd). When the water droplet contacts the FEP surface, the EDL is formed between the droplet and FEP surface, which can be treated as a capacitor (C2). The FEP surface and bottom Cu electrode can be seen as C1. At this time, the S is in a “switched-on” state and stored charges in C2 are instantly released, meanwhile, the C1 in the loop are charged (see Fig. S7†).Electrical measurement
The droplet-TENG was placed on a support that can provide a fixed incline angle (60°). The entire device was located inside a grounded Faraday cage to avoid interference from external environmental signals. Droplets were dripped by a syringe pump (PHD ULTRA Series, Harvard Apparatus) placed vertically and grounded above the Faraday cage. The copper electrode attached on the PMMA plate was connected to the Keithley 6514 electrometer. The electrometer was attached to a Labview program on a computer to show the induced currents when a droplet slides through the copper electrode. It is important to note that the syringe pump injected at a uniform rate of 1 mL per minute, providing a volume of 60 μL per droplet. The ambient humidity was maintained at about 35% throughout the experiment.Conflicts of interest
The authors declare no conflicts of interest.Acknowledgements
Research was supported by the National Natural Science Foundation of China (Grant No. 22102010), and the National Key R&D Project from the Minister of Science and Technology (2021YFA1201601).References
- J. Y. Zhang and S. Ciampi, ACS Cent. Sci., 2020, 6, 611–612 CrossRef CAS PubMed.
- J. Y. Zhang, C. Su, F. J. M. Rogers, N. Darwish, M. L. Coote and S. Ciampi, Phys. Chem. Chem. Phys., 2020, 22, 11671–11677 RSC.
- J. Y. Zhang, S. Ferrie, S. Zhang, Y. B. Vogel, C. R. Peiris, N. Darwish and S. Ciampi, ACS Appl. Nano Mater., 2019, 2, 7230–7236 CrossRef CAS.
- J. X. Zhu, X. Y. Guo, D. H. Meng, M. Cho, I. Park, R. Huang and W. X. Song, J. Mater. Chem. A, 2018, 6, 16548–16555 RSC.
- J. Chung, H. Cho, H. Yong, D. Heo, Y. S. Rim and S. Lee, Sci. Technol. Adv. Mater., 2020, 21, 139–146 CrossRef CAS PubMed.
- J. Wu, Y. H. Xi and Y. J. Shi, Nano Energy, 2020, 72, 104659 CrossRef CAS.
- J. Y. Zhang, S. Q. Lin and Z. L. Wang, J. Phys. Chem. B, 2022, 126, 2754–2760 CrossRef CAS PubMed.
- K. Q. Wang and J. J. Li, J. Mater. Chem. A, 2021, 9, 8870–8895 RSC.
- Y. Lu, L. L. Jiang, Y. Yu, D. H. Wang, W. T. Sun, Y. Liu, J. Yu, J. Zhang, K. Wang, H. Hu, X. Wang, Q. M. Ma and X. X. Wang, Nat. Commun., 2022, 13, 5316 CrossRef CAS PubMed.
- R. T. Zhang, H. S. Lin, Y. Pan, C. Li, Z. Y. Yang, J. X. Tian and H. C. Shum, Adv. Funct. Mater., 2022, 2022, 2202805 Search PubMed.
- X. H. Yu, J. Pan, J. Zhang, H. Sun, S. S. He, L. B. Qiu, H. Q. Lou, X. M. Sun and H. S. Peng, J. Mater. Chem. A, 2017, 5, 6032–6037 RSC.
- M. Sahu, V. Vivekananthan, S. Hajra, K. S. Abisegapriyan, N. Raj and S. J. Kim, J. Mater. Chem. A, 2020, 8, 22257–22268 RSC.
- M. Y. Lian, J. X. Sun, D. W. Jiang, Q. Sun, Z. M. El-Bahy, H. M. Abo-Dief, M. A. Salem, H. M. Ali, Q. Xu and Z. H. Guo, J. Mater. Chem. A, 2022, 10, 24353–24361 RSC.
- X. Y. Wang, C. Q. Zhu, M. W. Wu, J. L. Zhang, P. F. Chen, H. Chen, C. X. Jia, X. Liang and M. Y. Xu, Sens. Actuators, A, 2022, 344, 113727 CrossRef CAS.
- Y. Q. Liu, X. M. Wang, Y. J. Yan, Z. C. Rao, H. P. Chen and T. L. Guo, J. Mater. Chem. A, 2020, 8, 6328–6336 RSC.
- K. Lee, S. Mhin, H. Han, O. Kwon, W. B. Kim, T. Song, S. Kang and K. M. Kim, J. Mater. Chem. A, 2022, 10, 1299–1308 RSC.
- J. Y. Zhang, M. L. Coote and S. Ciampi, J. Am. Chem. Soc., 2021, 143, 3019–3032 CrossRef CAS PubMed.
- X. P. Yu, Z. Z. Liu, X. Y. Yang, Y. D. Wang, J. H. Zhang, J. L. Duan, L. M. Liu and Q. W. Tang, ACS Appl. Mater. Interfaces, 2021, 13, 26196–26203 CrossRef CAS PubMed.
- D. K. Davies, J. Phys. D: Appl. Phys., 1969, 2, 1533–1537 CrossRef.
- A. F. Diaz and J. Guay, IBM J. Res. Dev., 1993, 37, 249–259 CAS.
- S. Q. Lin, L. Xu, A. C. Wang and Z. L. Wang, Nat. Commun., 2020, 11, 399 CrossRef CAS PubMed.
- F. Zhan, A. C. Wang, L. Xu, S. Q. Lin, J. J. Shao, X. Y. Chen and Z. L. Wang, ACS Nano, 2020, 14, 17565–17573 CrossRef CAS PubMed.
- J. H. Nie, Z. W. Ren, L. Xu, S. Q. Lin, F. Zhan, X. Y. Chen and Z. L. Wang, Adv. Mater., 2020, 32, 1905696 CrossRef CAS PubMed.
- Z. Tang, S. Q. Lin and Z. L. Wang, Adv. Mater., 2021, 33, 2102886 CrossRef CAS PubMed.
- J. Y. Zhang, F. J. M. Rogers, N. Darwish, V. R. Goncales, Y. B. Vogel, F. Wang, J. J. Gooding, M. C. R. Peiris, G. H. Jia, J. P. Veder, M. L. Coote and S. Ciampi, J. Am. Chem. Soc., 2019, 141, 5863–5870 CrossRef CAS PubMed.
- Z. H. Lin, G. Cheng, S. Lee, K. C. Pradel and Z. L. Wang, Adv. Mater., 2014, 26, 4690–4696 CrossRef CAS PubMed.
- Q. Zhang, Q. J. Liang, Q. L. Liao, M. Y. Ma, F. F. Gao, X. Zhao, Y. D. Song, L. J. Song, X. C. Xun and Y. Zhang, Adv. Funct. Mater., 2018, 28, 1803117 CrossRef.
- Y. Q. Liu, N. Sun, J. W. Liu, Z. Wen, X. H. Sun, S. T. Lee and B. Q. Sun, ACS Nano, 2018, 12, 2893–2899 CrossRef CAS PubMed.
- B. Q. Wang, Y. Wu, Y. Liu, Y. B. Zheng, Y. P. Liu, C. G. Xu, X. Kong, Y. G. Feng, X. L. Zhang and D. A. Wang, ACS Appl. Mater. Interfaces, 2020, 12, 31351–31359 CrossRef CAS PubMed.
- L. B. Huang, W. Xu, C. H. Zhao, Y. L. Zhang, K. L. Yung, D. F. Diao, K. H. Fung and J. H. Hao, ACS Appl. Mater. Interfaces, 2020, 12, 24030–24038 CrossRef CAS PubMed.
- X. Y. Li, J. Tao, X. D. Wang, J. Zhu, C. F. Pan and Z. L. Wang, Adv. Energy Mater., 2018, 8, 1800705 CrossRef.
- M. F. Lin, K. Parida, X. Cheng and P. S. Lee, Adv. Mater. Technol., 2017, 2, 1600186 CrossRef.
- X. J. Li, L. Q. Zhang, Y. G. Feng, X. L. Zhang, D. A. Wang and F. Zhou, Adv. Funct. Mater., 2019, 29, 1903587 CrossRef.
- J. W. Lee and W. Hwang, Nano Energy, 2018, 52, 315–322 CrossRef CAS.
- J. H. Lee, S. Kim, T. Y. Kim, U. Khan and S. W. Kim, Nano Energy, 2019, 58, 579–584 CrossRef CAS.
- H. Y. Lin, T. W. Wang, Z. H. Lin and D. J. Yao, IEEE Trans. NanoBiosci., 2022, 21, 358–362 Search PubMed.
- B. Q. Wang, Y. Wu, Y. Liu, Y. B. Zheng, Y. P. Liu, C. G. Xu, X. Kong, Y. G. Feng, X. L. Zhang and D. A. Wang, ACS Appl. Mater. Interfaces, 2020, 12, 31351–31359 CrossRef CAS PubMed.
- L. L. Zhao, L. Q. Liu, X. Y. Yang, H. X. Hong, Q. M. Yang, J. W. Wang and Q. W. Tang, J. Mater. Chem. A, 2020, 8, 7880–7888 RSC.
- W. H. Xu, H. X. Zheng, Y. Liu, X. F. Zhou, C. Zhang, Y. X. Song, X. Deng, M. Leung, Z. B. Yang, R. X. Xu, Z. L. Wang, X. C. Zeng and Z. K. Wang, Nature, 2020, 578, 392–396 CrossRef CAS PubMed.
- J. Y. Zhang, S. Q. Lin, M. L. Zheng and Z. L. Wang, ACS Nano, 2021, 15, 14830–14837 CrossRef CAS PubMed.
- J. Y. Zhang, S. Q. Lin and Z. L. Wang, ACS Nano, 2023, 17, 1646–1652 CAS.
Footnotes |
| † Electronic supplementary information (ESI) available. See DOI: https://doi.org/10.1039/d2ta09797d |
| ‡ These authors contributed equally to this work. |
| This journal is © The Royal Society of Chemistry 2023 |