
Outstanding visible light photocatalysis using nano-TiO2 hybrids with nitrogen-doped carbon quantum dots and/or reduced graphene oxide†
Ioan-Alexandru
Baragau
 a,
John
Buckeridge
a,
Kiem G.
Nguyen
a,
Tobias
Heil
b,
Muhammad Tariq
Sajjad
a,
Stuart A. J.
Thomson
c,
Alistair
Rennie
c,
David J.
Morgan
d,
Nicholas P.
Power
e,
Sabina Alexandra
Nicolae
fg,
Maria-Magdalena
Titirici
h,
Steve
Dunn
a and
Suela
Kellici
*a
a,
John
Buckeridge
a,
Kiem G.
Nguyen
a,
Tobias
Heil
b,
Muhammad Tariq
Sajjad
a,
Stuart A. J.
Thomson
c,
Alistair
Rennie
c,
David J.
Morgan
d,
Nicholas P.
Power
e,
Sabina Alexandra
Nicolae
fg,
Maria-Magdalena
Titirici
h,
Steve
Dunn
a and
Suela
Kellici
*a
aSchool of Engineering, London South Bank University, 103 Borough Road, London, SE1 0AA, UK. E-mail: kellicis@lsbu.ac.uk; Web: http://www.nano2d.co.uk
bDepartment of Colloid Chemistry, Max Planck Institute of Colloids and Interfaces, Am Mühlenberg 1, 14476, Potsdam, Germany
cEdinburgh Instruments Ltd, 2 Bain Square, Livingston, EH54 7DQ, UK
dCardiff Catalysis Institute, School of Chemistry, Cardiff University, Park Place, Cardiff, CF10 3AT, UK
eSchool of Life Health & Chemical Sciences, The Open University, Walton Hall, Milton Keynes, MK7 6AA, UK
fSchool of Engineering and Materials Science, Queen Mary University of London, Mile End Road, London E1 4NS, UK
gNational Institute of Materials Physics, Atomistilor 405A, 077125 Magurele, Ilfov, Romania
hDepartment of Chemical Engineering, Imperial College, South Kensington, London, SW7 2AZ, UK
First published on 20th March 2023
Abstract
Historically, titanium dioxide (TiO2) has been one of the most extensively studied metal oxide photocatalysts; however, it suffers from a large bandgap and fast charge recombination. We report the use of green, rapid, single-step continuous hydrothermal flow synthesis for the preparation of TiO2, and TiO2 hybrids with reduced graphene oxide (rGO) and/or N-doped carbon quantum dots (NCQDs) with significant enhancement in photocatalytic activity. Using a solar light generator under ambient conditions with no extra oxygen gas added, we observed the evolution reaction of the model pollutant (methylene blue) in real time. Tailoring of the light absorption to match that of the solar spectrum was achieved by a combination of materials of nano-TiO2 hybrids of nitrogen-doped carbon quantum dots and graphene in its reduced form with a photocatalytic rate constant of ca. 25 × 10−5 s−1. Using a diversity of state-of-the-art techniques including high-resolution transmission electron microscopy, transient photoluminescence, X-ray photoelectron spectroscopy and high accuracy, sophisticated hybrid density functional theory calculations we have gained substantial insight into the charge transfer and modulation of the energy band edges of anatase due to the presence of graphene or carbon dots, parameters which play a key role in improving drastically the photocatalytic efficiencies when compared to pristine titania. More importantly, we prove that a combination of features and materials displays the best photocatalytic behaviour. This performance is delivered in a greener synthetic process that not only produces photocatalytic materials with optimised properties and tailored visible light absorption and efficiency but also provides a path to industrialization.
1. Introduction
The continued exponential population growth and consequential industrial expansion and demands on planetary resources have unleashed unprecedented and unsustainable pressure on the environment as reflected by global water contamination (for instance, 80–90% of wastewater is released untreated in Asia and Pacific regions into surface-water bodies).1 This is compounded by advancing climate change, and is of great concern, thus prompting urgent scientific research into renewable, effective, and sustainable solutions. In this regard, photocatalysis can readily harness freely available clean solar energy to degrade organic contaminants,2 reduce CO2 into renewable solar hydrocarbon fuels,3 and generate hydrogen and oxygen by the splitting of water when exposed to sunlight.4Since the first report of the photocatalytic bleaching of dyes in 1938,5 titanium dioxide (TiO2) has been one of the most extensively studied metal oxides and remains currently the most feasible photocatalyst for industrial-scale applications. It does, however, feature a large band gap energy (3.2 eV for its anatase form), which remains a challenge in meeting the requirements of visible-light applications. Integration with an active catalytic surface which allows for efficient charge transfer and kinetics, is additionally identified as a limiting factor in achieving outstanding photocatalytic performance.
Overcoming these challenges has led to the design of new materials that has propagated the development of hybrid (e.g., with metal co-catalysts)4 and/or heteroatom-doped nanostructures that deliver visible light-responsive photocatalysts. For example, the addition of carbonaceous material to the surface of TiO2 can induce and enhance visible-light photocatalytic activity.6 Graphene, the first 2D material made of a single or a few layers of sp2 carbon atoms arranged in a hexagonal array and conjugated electronic structure, with a large surface area, can be hybridised in its reduced oxide form with TiO2, to provide a photocatalytic system. These can be developed to offer enhanced charge separation in electron transfer processes and increases surface-adsorption of chemical substrates (via π–π interactions) including pollutant molecules.7 An alternative approach has been found in the application of the critically small carbon quantum dots (CQDs) with dimensions < 10 nm. CQDs are composed of an sp2 graphitic carbon core with a shell surface consisting of a mixture of sp2 and sp3 carbon decorated entanglements with a variety of oxygen (and optional nitrogen) functionalities, with a poorly defined electronic structure. The CQDs offer a variety of advantages that include conductivity, a tuneable size-dependent bandgap (1.8–3.1 eV) tailored to match solar light absorption, that along with their small size facilitates short charge transfer.8 As such, when hybridised with TiO2, energy levels are aligned forming heterojunctions (between π states of the CQDs and the conduction band of the semiconductor) resulting in enhancement of the charge lifetime separation.9
Configuring new arrangements of carbonaceous mixtures with a catalytic support (TiO2) can provide unique solutions to the photocatalytic challenges discussed via novel mechanisms. The sp2 carbon atoms from the CQD core and graphene in its reduced oxide form could be very efficient in storing and shuttling electrons, and the oxygen functional groups/dangling bonds can play an important role in interconnecting the solid components through hydrogen bonds and other physical interactions, whilst nitrogen functionalities can manipulate the ability of TiO2 to harvest visible light.10,11 These can be achieved by using a unique, versatile, continuous synthetic technology that produces consistently high quality and large quantities of nano-hybrids of choice, which would also offer a solution to one of the challenges in photocatalytic material industrialization:12 scale-up.
The primary focus of this research was to establish a suitable, fast, and effective strategy for the discovery of highly efficient visible light photocatalysts. Herein, we report the rapid and tailored synthesis of nano-TiO2 hybrids with nitrogen-doped carbon quantum dots and/or reduced graphene oxide (rGO), and their enhanced photocatalytic performance under solar light using methylene blue dye as a model pollutant. The materials were produced in continuous mode using a hydrothermal flow process that mixed supercritical water (450 °C, 24.8 MPa) with precursor solution(s) in a reactor to give the product in fractions of a second. From the perspective of a green, adaptive and economically efficient synthetic method, continuous hydrothermal flow synthesis (CHFS) has attracted growing interest for the production of a new generation of nanomaterials such as graphene, graphene quantum dots, carbon quantum dots and their nanocomposites, offering enhancement of their properties and expanding their area of applications.13 Reproducibility, an assurance of real-time full control over of the reaction parameters, and delivering materials with optimised properties are just a few of the benefits of CHFS.2,13–16 Our research has previously applied these particular synthetic properties to the production of different metal oxides,13 and various carbonaceous materials (reduced graphene oxide,19 carbon quantum dots,18,19 and graphene quantum dots20,21). This research adds further to the development of continuous flow technology of photoactive-related nanomaterials. A detailed analysis of the charge behaviour of the CHFS-synthesised materials through a series of complementary techniques including transient photoluminescence, X-ray photoelectron spectroscopy and density functional theory calculations is reported. High-resolution transmission electron microscopy was employed to study the morphology and particle size of nano-hybrids, UV-Vis spectroscopy was used to provide information about optical properties and bandgap determination, and X-ray powder diffraction and Raman spectroscopy lend complementary information about the compositions and crystallinity of nano-TiO2 hybrids. Surface area values were also determined using the nitrogen adsorption technique.
2. Experimental section
2.1 Chemicals
All the materials were purchased from commercial suppliers and used without further purification. Methylene blue, anhydrous citric acid (C6H8O7) and ammonia solution (NH3 32%) were purchased from Fisher Chemicals (UK); titanium(IV) bis(ammonium lactate)dihydroxide solution ([CH3CH(O–)CO2NH4]2Ti(OH)2, 50 wt% in water) was purchased from Sigma Aldrich (UK). 15 MΩ, deionized water (ELGA Purelab system) was used in all experimental work.2.2 Synthetic methodology
All materials were synthesised using an in-house constructed CHFS set-up17 operated at 450 °C and at a constant pressure of 24.8 MPa. The simplified CHFS schematic is shown in Scheme 1. It consists of a water pre-heater connected to a temperature controller, three high-pressure pumps used for continuous delivery of water and precursor feeds, a ‘T’ junction (facilitating the mixing of the precursor(s)/auxiliary feeds), a counterflow reactor equipped with a thermocouple (where the supercritical water meets the precursor feed and the chemical process takes place), a post-reaction pipe-in-pipe water cooler, a back-pressure regulator (BPR) (that maintains a constant pressure in the system) and a collection vessel (for the collection of the final product aqueous mixture). Generally, in each experiment pre-mixed (at the T-junction) feeds of an aqueous solution of titanium(IV) bis(ammonium lactato)dihydroxide (0.2 M) and a carbon precursor (graphene oxide, 1.0 mg mL−1 and/or citric acid, 70.0 mg mL−1) and nitrogen source (ammonia, 1.0 M) were delivered via the T-junction to meet a concurrently flowing feed of sc-H2O in the mixing zone (reactor), whereupon the formation of nanocomposites occurred. Flow rates for each corresponding pump were set as pump 1 = 20.0 mL min−1, pump 2 = 5.0 mL min−1, pump 3 = 10.0 mL min−1. The product mixture was then cooled, evacuated from the reactor, and collected for further isolation, purification, and analysis.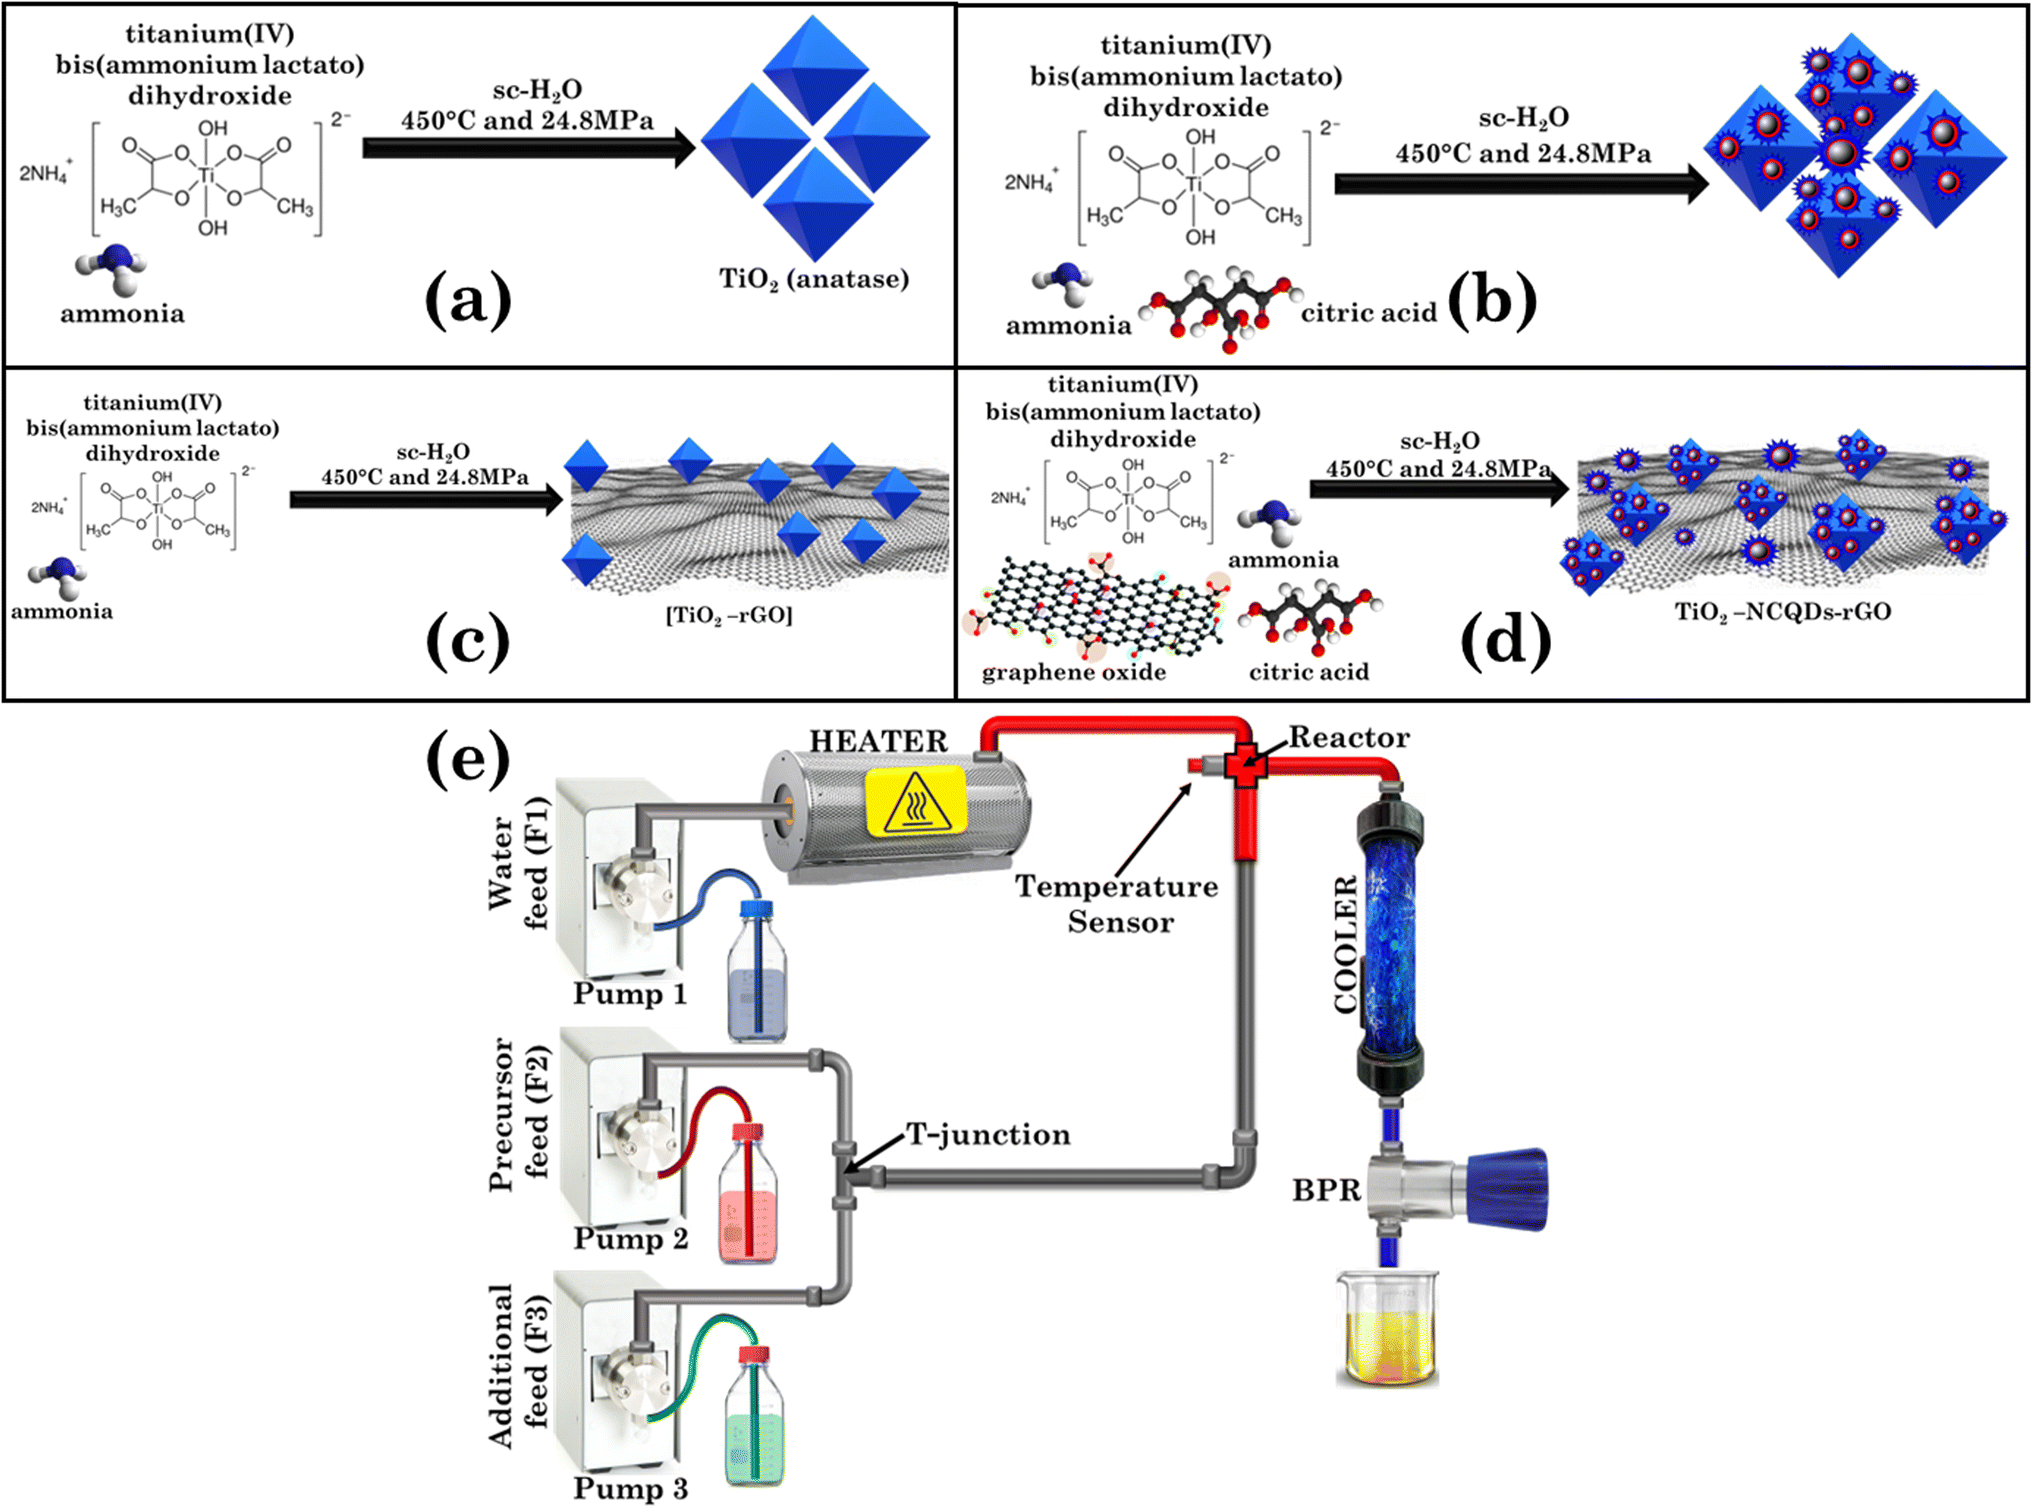 | ||
| Scheme 1 Continuous hydrothermal flow synthesis (CHFS) process detailing the synthetic protocols for: (a)–(d) production of TiO2 and its nanocomposites with reduced graphene oxide (rGO) and/or N-doped carbon quantum dots (NCQDs); (e) simplified representation of the CHFS process. | ||
2.3 Photocatalytic experiments
Solar simulator setup: an in-house system consisting of a laboratory jack, a magnetic stirrer, and a quartz tungsten halogen lamp (Osram 1 kW R7s 22000 lm linear halogen lamp) mounted on a light intensity adjustable device cooled by an electric fan. Lamp performance was verified using an Ocean Insight flame optical spectrometer by measuring the tungsten halogen lamp irradiance spectrum between 200 and 800 nm (see the irradiance spectrum in Fig. S1†). This confirmed that the artificial sunlight generated by the device contains 2.3% UV radiation and 97.7% visible radiation, and the UV radiation is made of 40.6% UV-A radiation (320–400 nm), 6.2% UV-B radiation (280–320 nm), and 53.2% UV-C radiation (200–280 nm). It can thereby be concluded that the solar lamp used in photocatalytic experiments herein, and set under normal parameters, generated a spectrum which is very close to solar light and was sufficient in providing the activation energy for photocatalytic processes. Photocatalytic activities were also investigated under visible light using a MinisolTM LED solar simulator (LSH-7320, MKS Newport) irradiated at wavelengths ranging from 400 to 1100 nm (Fig. S1†) and a light intensity of 50 mW cm−2 (0.5 sun). Visible light intensity studies (0.25, 0.5, and 1 sun) were also performed on the best-performing sample and apparent quantum (AQE) values were calculated (see the ESI†).The photocatalytic activities of titania nanocomposites were evaluated by the photodegradation of methylene blue (MB) in water using the solar-simulator(s) set-up as described above. Routinely, each photocatalyst (10.0 mg) was suspended in MB aqueous standard solution (0.02 mM, 50.0 mL) in a glass beaker (Corning Pyrex Griffin) equipped with a magnetic bead. The solution was stirred in the dark for 30 minutes to ensure the establishment of an adsorption–desorption equilibrium. The reaction mixture was located at a distance (27 cm) from the light source with stirring maintained for the whole photocatalytic process period. The samples were irradiated for 180 minutes. During the irradiation process, aliquots (10.0 mL) were collected at 30-minute intervals, centrifuged to remove particulates (5 min at 4500 rpm), and analysed by UV-Vis spectrophotometry (Shimadzu UV-1800) to assess MB photodegradation by its absorbance change at 660 nm. After the UV-Vis analysis, the centrifuged material was resuspended in the aliquot and returned to the initial reaction mixture. The quantitative determination of MB was calculated using a calibrated correlation between the measured absorbance and its concentration. The direct degradation of MB was measured as a control in all photocatalytic measurements. Adsorption coefficients were also determined using the Langmuir–Hinshelwood model (Table S1†).
2.4 Equipment
Prior to analysis and testing, the samples were freeze dried using a Heto PowderDry PL 3000 freeze-dryer. A Siemens D5005 X-ray diffractometer operating at 30 kW with a long fine focus Cu K alpha radiation source (λ = 1.54 Å) was used to obtain X-ray powder diffraction (XRD) patterns. A Kratos Axis Ultra DLD photoelectron spectrometer with a monochromatic Al kα source operating at 144 W was utilised for X-ray photoelectron spectroscopy (XPS) measurements. Samples were mounted using conductive carbon tape. Survey and narrow scans were performed at constant pass energies of 160 and 40 eV, respectively. The base pressure of the system was ca. 1 × 10⁻⁹ Torr rising to ca. 4 × 10⁻⁹ Torr during the analysis of these samples. It is prudent at this point to state that all calibrations of the spectra have been made to the Ti(2p3/2) peak taken to be 459.3 eV in line with that of Diebold and Madey. Whilst, for example, the NIST database has a mean value of ca. 458.5 eV, there is a significant deviation (approx. 1.5 eV). Using lower values of the Ti(2p3/2) peak (e.g. 458.5 eV), whilst giving stable Ti(2p) and O(1s) peak energies, there is an unacceptable low binding energy determined for sp2 and sp3 carbon functions, equally fitting to the sp3 carbon taken to be 285 eV, resulting in a deviation in binding energies of ca. 0.6 eV for the Ti(2p) and O(1s) signals. Surface area analysis (SABET) of the powders was performed by the Branauer–Emmett–Teller (BET) method using a Micrometrics Gemini VII. The 5-point N2 absorption method was used. The powders were degassed prior to analysis at 180 °C for 2 h to remove any moisture using a FlowPrep 060 degasser. A double-corrected JEOL ARM200F, equipped with a cold field emission gun and set to 80 kV and 10 μA, was employed to record high-resolution transmission electron microscopy (HRTEM) images. Prior to imaging, the aqueous solution of nanocomposites was deposited onto a holey carbon-coated Cu-grid (400 μm). Image analysis was performed using ImageJ software. Scanning electron microscope (SEM) images were recorded using a Hitachi SU-70 FEG instrument. Fourier-Transform Infrared Spectroscopy (FT-IR) analysis was performed using a Shimadzu IRAffinity-1S spectrophotometer fitted with a Specac Quest ATR accessory (diamond 4000–200 cm−1). Raman spectroscopy analysis of the as-synthesized materials was performed with a Horiba LabRAM HR Evolution spectrometer (λ = 633 nm). A PerkinElmer Lambda 950 UV-Vis spectrophotometer fitted with an integrated sphere was used for absorption measurements of the photocatalyst powders. The spectra were converted to Tauc plots and the bandgaps of the materials were calculated for indirect and direct transitions.2 PL decays were measured using TCSPC with an FLS1000 photoluminescence spectrometer (Edinburgh Instruments, UK) equipped with a double emission monochromator and a high-speed PMT detector (H10720). The TiO2 suspensions were excited at 375 nm by using a pulsed diode laser (EPL-375) and the decays were measured at an emission wavelength of 450 nm. The decays were fitted using reconvolution analysis with the IRF in the FLS1000 Fluoracle software.2.5 Theoretical calculations
DFT was used to calculate the equilibrium atomic geometry and electronic structure of bulk TiO2, an unperturbed graphene sheet, and two-dimensional slabs of TiO2, containing cuts of the (001), (100) and (101) surfaces with and without a layer of graphene adsorbed on the surfaces on either side of the slab. Plane-wave DFT as implemented in the VASP code was used22–24 employing the hybrid exchange and correlation functional HSE06,25 which is known to reproduce well the lattice parameters and main features of the energy band structure of TiO2.26 The projector augmented wave27 method was used to model the interaction between core and valence electrons (with four valence electrons for Ti and C and six for O). The total energy of the TiO2 anatase primitive unit cell was calculated using a 600 eV plane-wave cutoff and a 6 × 6 × 6 Γ-centred Monkhorst–Pack,28k-point mesh to sample the Brillouin zone (BZ), which resulted in energies converged within less than 0.1 meV per atom. The geometry of the primitive cell was optimised until the interatomic forces were less than 0.01 eV Å−1. The plane-wave cutoff of 600 eV, combined with an 8 × 8 × 1 k-mesh, resulted in total energy convergence within 0.5 meV per atom for the primitive cell of the two-atom unperturbed graphene sheet. The geometry of the graphene sheet was optimised by varying the bond length about the experimental value of 1.42 Å, calculating the total energy at each length (using five data points), applying a parabolic fit to the energy versus bond length trend and finding the minimum. A vacuum gap of 15 Å was maintained between neighbouring graphene sheets in the periodic unit cell used in the simulations. The TiO2 slabs containing the (001), (100) and (101) surfaces were produced using the surface cutting tools provided on the SAINT database.29 In each case, a 15 Å vacuum gap was placed between periodic images of the slabs. The slab thicknesses were: 27.3 Å (001), 24.6 Å (100) and 23.5 Å (101). Geometry optimisation was performed using the same approach as that adopted for the bulk systems. The k-point meshes were chosen to maintain the density used in the graphene simulations. The slab containing the (001) surfaces was composed of 36 atoms, with a 6 × 6 × 1 k-mesh used to sample the BZ; the slabs containing the (100) surfaces and (101) surfaces were both composed of 84 atoms, with a 6 × 2 × 1 k-mesh used to sample the BZ. After optimisation, graphene layers were added to these slabs, placing one layer over each of the two surfaces in each slab model. To ensure the calculations were tractable, strains of over 5% were introduced to the graphene layers, allowing them to fit within the unit cells of the slab models. For the slab containing the (001) surfaces, a 1 × 2 expansion of the unit cell was needed. The distance between the graphene sheet and the adjacent surface was varied between 2.5 Å and 3.5 Å before optimisation, to search for possible local minima. All slabs were optimised until the forces were below 0.025 eV Å−1. The macroscopically averaged electrostatic potential V,30 as a function of distance z perpendicular to the surfaces in the slab models, was computed for each slab, with and without graphene, from the calculated potential containing the Hartree and ionic contributions, using the MacroDensity package.31,32 Combining the offset in V(z) between its value in the vacuum layer and in the interior of each slab (ΔV) with the energy of the valence band maximum of the bulk system, EVBM, ionisation potentials I were calculated as I = EVBM + ΔV. I and electron affinity, A = −I + Eg, where Eg is the band gap of the bulk system, can be used to determine the band edges on an absolute scale, with the valence band (conduction band) position given by −I (A).3. Results and discussion
In recent years, various methods have been used to improve the photocatalytic properties of titanium dioxide–carbonaceous nanocomposites by altering or extending the TiO2 anatase photoactivity for radiation harvesting from UV to visible.33 Whilst established synthetic processes are promising, they still suffer drawbacks such as high energy and time consumption demands, costly precursors, or experimental setup, batch to batch quality discrepancies, and the inability to scale-up the process from the laboratory to industrial production. The continuous hydrothermal flow synthesis approach reported herein addresses all the shortcomings of traditional methods due to the system’s inherent precision control of reaction parameters, that not only allows real-time tunability of the material production process, but also reduces the time required to assess the best synthetic experimental conditions considerably. CHFS has previously been applied to TiO2 synthesis;34 the uniqueness of this work is that we simultaneously and homogeneously generate titanium dioxide anatase nanoparticles, NCQDs and reduce graphene oxide. The experimental details are shown in (Scheme 1a–d).In general, pre-mixed (at the T-junction) feeds of titanium(IV) bis(ammonium lactate)dihydroxide and a carbon precursor (graphene oxide and/or citric acid) were delivered to meet concurrently with a flowing feed of sc-H2O (450 °C and a pressure of 24.8 MPa) in the mixing zone (reactor) for nanocomposite formation. After cooling, the product mixture was collected for isolation and purification. The as-produced hybrid structures did not require any post-thermal processing; instead, the nanomaterials were characterized and used for further analysis and photocatalytic testing as described in the following.
3.1 Characterisation of the photocatalyst materials
High-resolution transmission electron microscopy (HRTEM) reveals the morphological architecture of the TiO2 and TiO2–carbonaceous nanocomposites as shown in Fig. 1. The TiO2 mean particle size is ∼5.0 nm in diameter with a lattice spacing of ca. 0.33 nm (Fig. 1e) and assigned to the (101) plane of anatase.35 Table S1† shows the average particle size values of TiO2 photocatalysts, with no variation observed (values fall within reported standard deviation). The NCQDs exhibited a spherical morphology with a mean particle size of ∼3.4 nm with an in-plane lattice spacing of ca. 0.22 nm (Fig. 1e) and were identified as a graphitic core arrangement19 with the graphene sheets consisting of 5–8 layers. The corresponding selected area electron diffraction pattern (insets in Fig. 1a–d) of each sample confirms the existence of the crystalline TiO2 anatase phase and influence due to the presence of an amorphous carbon phase in the TiO2–carbonaceous nanocomposites. A close interaction between the TiO2 nanoparticles and NCQDs as a solid–solid direct interface was observed, as shown in Fig. 1e. In the case of TiO2–rGO (Fig. 1c) and TiO2–NCQDs–rGO (Fig. 1d), the TiO2 nanoparticles and NCQDs are dispersed over the 2D layer, creating extensive interfacial interactions across the entire surface of the rGO layers and interlayers. Scanning electron microscopy (SEM) images for TiO2–NCQDs–rGO (Fig. 1f) supported HRTEM analysis for the layered structure of reduced graphene oxide.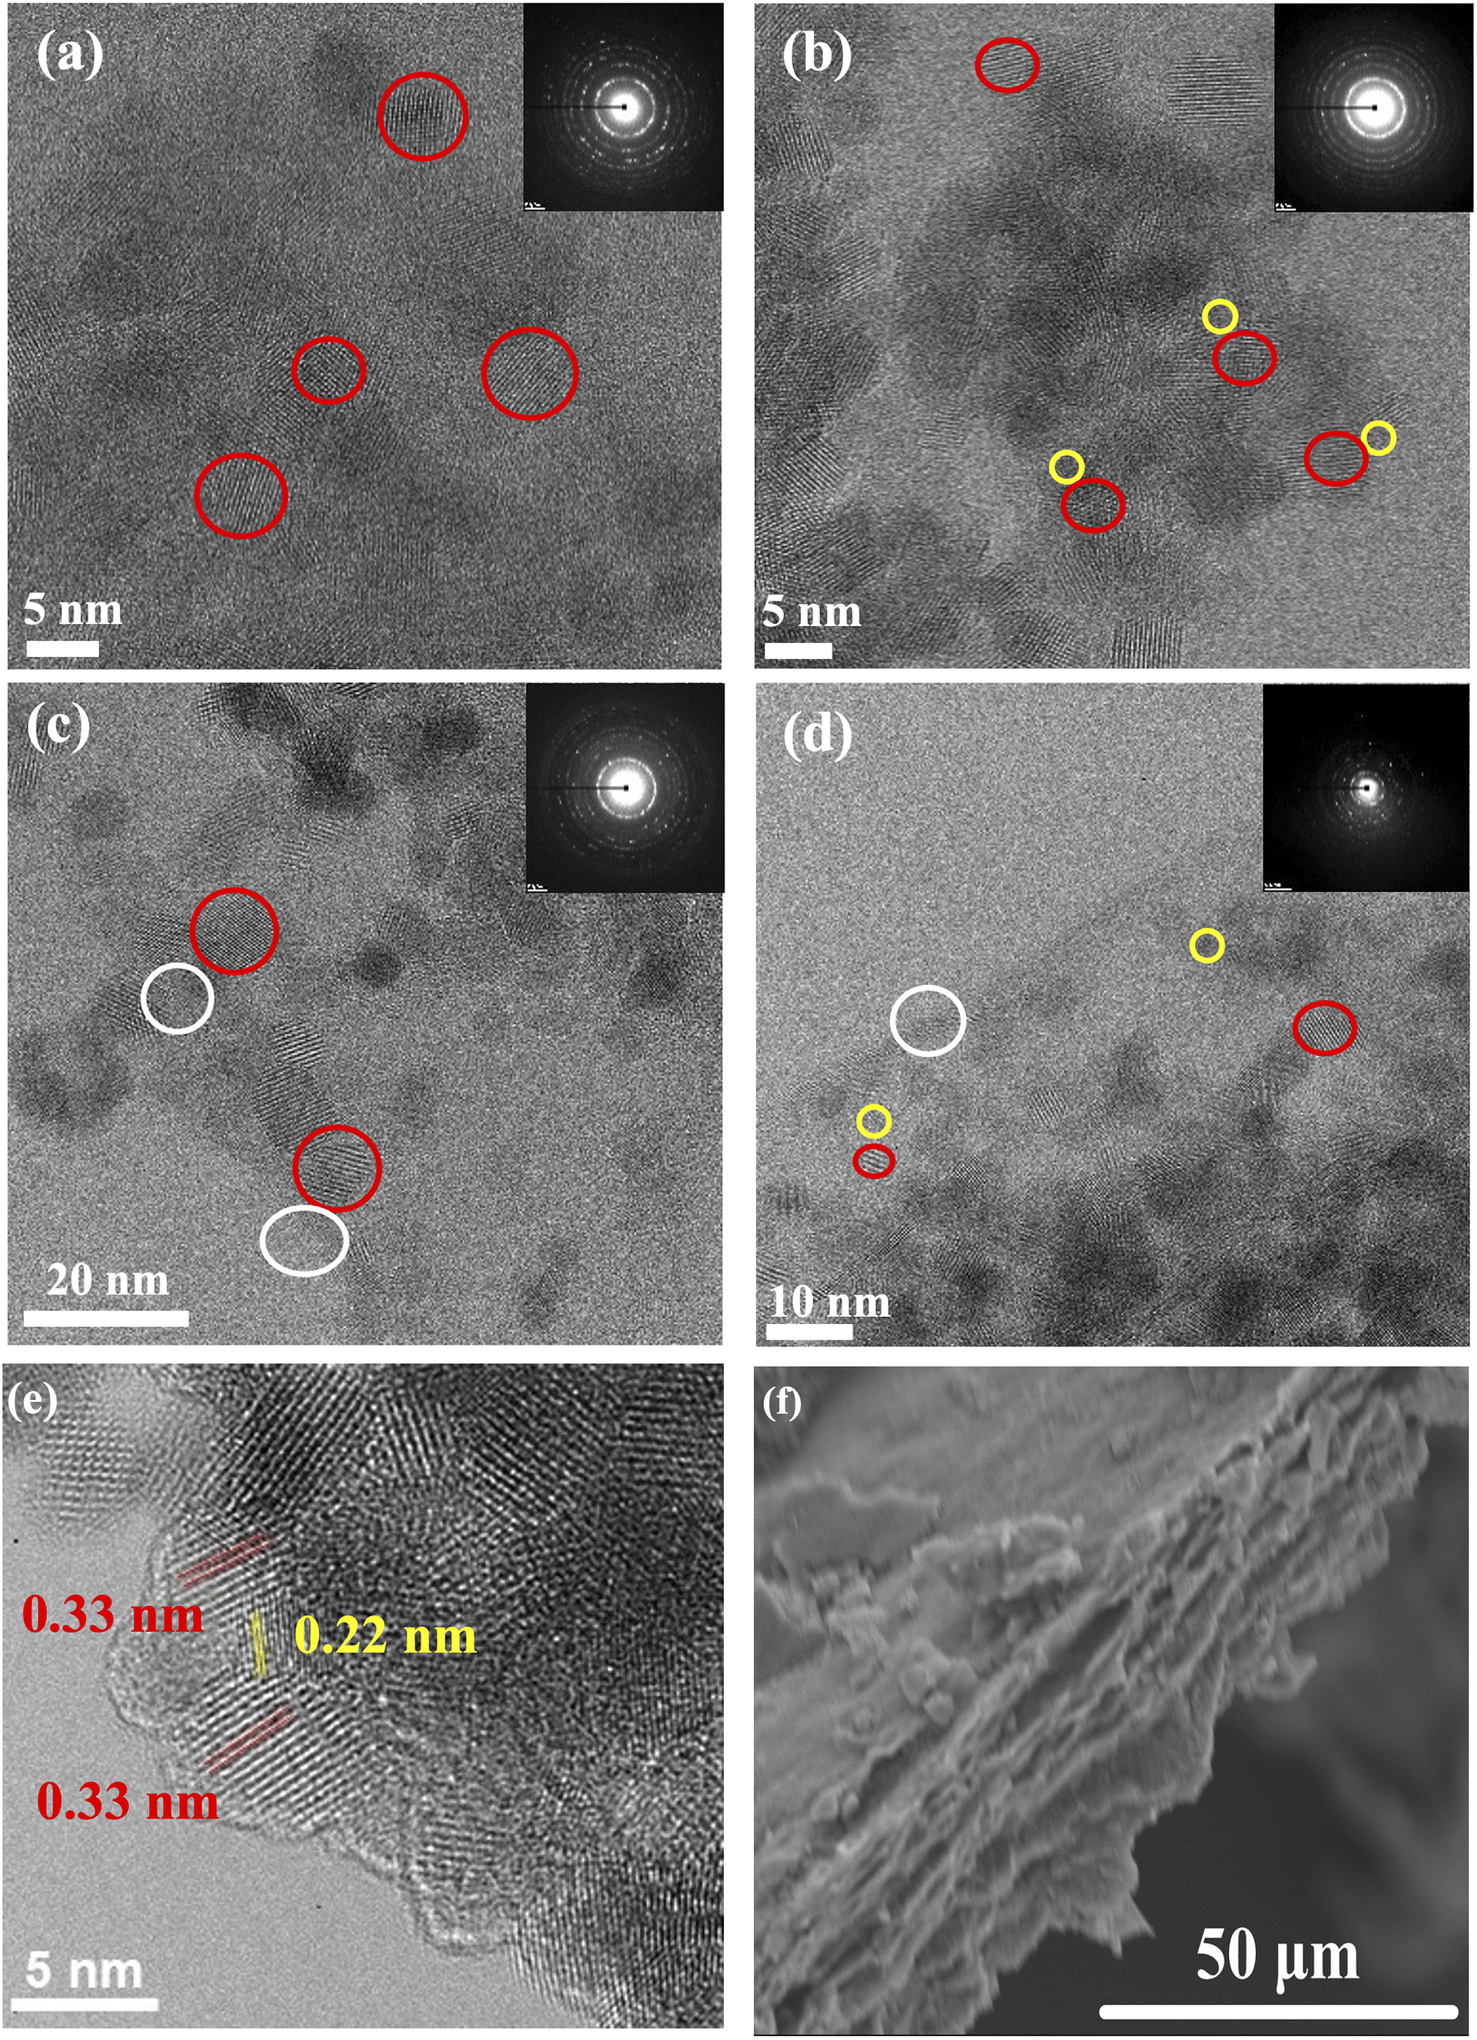 | ||
| Fig. 1 High-resolution transmission electron microscopy (HRTEM) images of: (a) TiO2, (b) [TiO2–NCQDs], (c) [TiO2–rGO], (d) [TiO2–NCQDs–rGO]. Each TEM image has an inset of a corresponding selected area electron diffraction pattern. (e) Lattice fringes of TiO2 and NCQDs in TiO2–NCQDs, and (f) scanning electron microscopy image of TiO2–NCQDs–rGO showing reduced graphene oxide (rGO) layers. Sample labelling key: yellow – NCQDs, red – TiO2, white – rGO. | ||
The small particle sizes observed by HRTEM correlated with the large surface area of the as-synthesised CHFS material measurements by SABET for the pristine titania and its hybrids (compiled in Table S1†) ranging from 232 m2 g−1 for TiO2 to 253 m2 g−1 for the TiO2–NCQDs–rGO nanocomposite. Such high specific area values would be expected to increase the activity of the nano-hybrids through increased adsorption of pollutant molecules (model methylene blue dye) and irradiation photons. Of course, other variables, including structural and surface properties of the photocatalysts, must be considered when comparing the activities of different materials.
For further investigation of the structures and composition of TiO2 photocatalysts and its hybrids, Raman spectroscopy and XRD analysis were undertaken (Fig. 2). Characteristic Raman vibrations for the CHFS-synthesised samples of TiO2 anatase presented an Eg band located at 146 cm−1 and 641 cm−1, a B1g band located at 398 cm−1, and an A1g band positioned at 513 cm−1, all in good agreement with the literature.36 Adding a carbonic phase (reduced graphene oxide) to the material, not only were the expected appearance of the D (ca. 1345 cm−1) and G (ca. 1595 cm−1) vibrational bands observed, but these bands for all rGO containing hybrids were noticeably blue shifted (D-band) and red shifted (G band). It should also be noted that the standard Eg vibrational mode at 144 cm−1 was also red-shifted for TiO2–rGO (150 cm−1), and TiO2–NCQDs–rGO (152 cm−1), respectively. This red shift could be assigned to the charge transfer process occurring between the TiO2 nanoparticles and its hybridised carbonaceous materials.37 This would be in line with the XPS, and modelling data discussed later. Interestingly, the D and G vibrational modes are missing for TiO2–NCQDs, most likely due to a too low NCQD content in the samples for Raman analysis, but nanocomposite NCQDs are accounted for in the XPS analysis later.
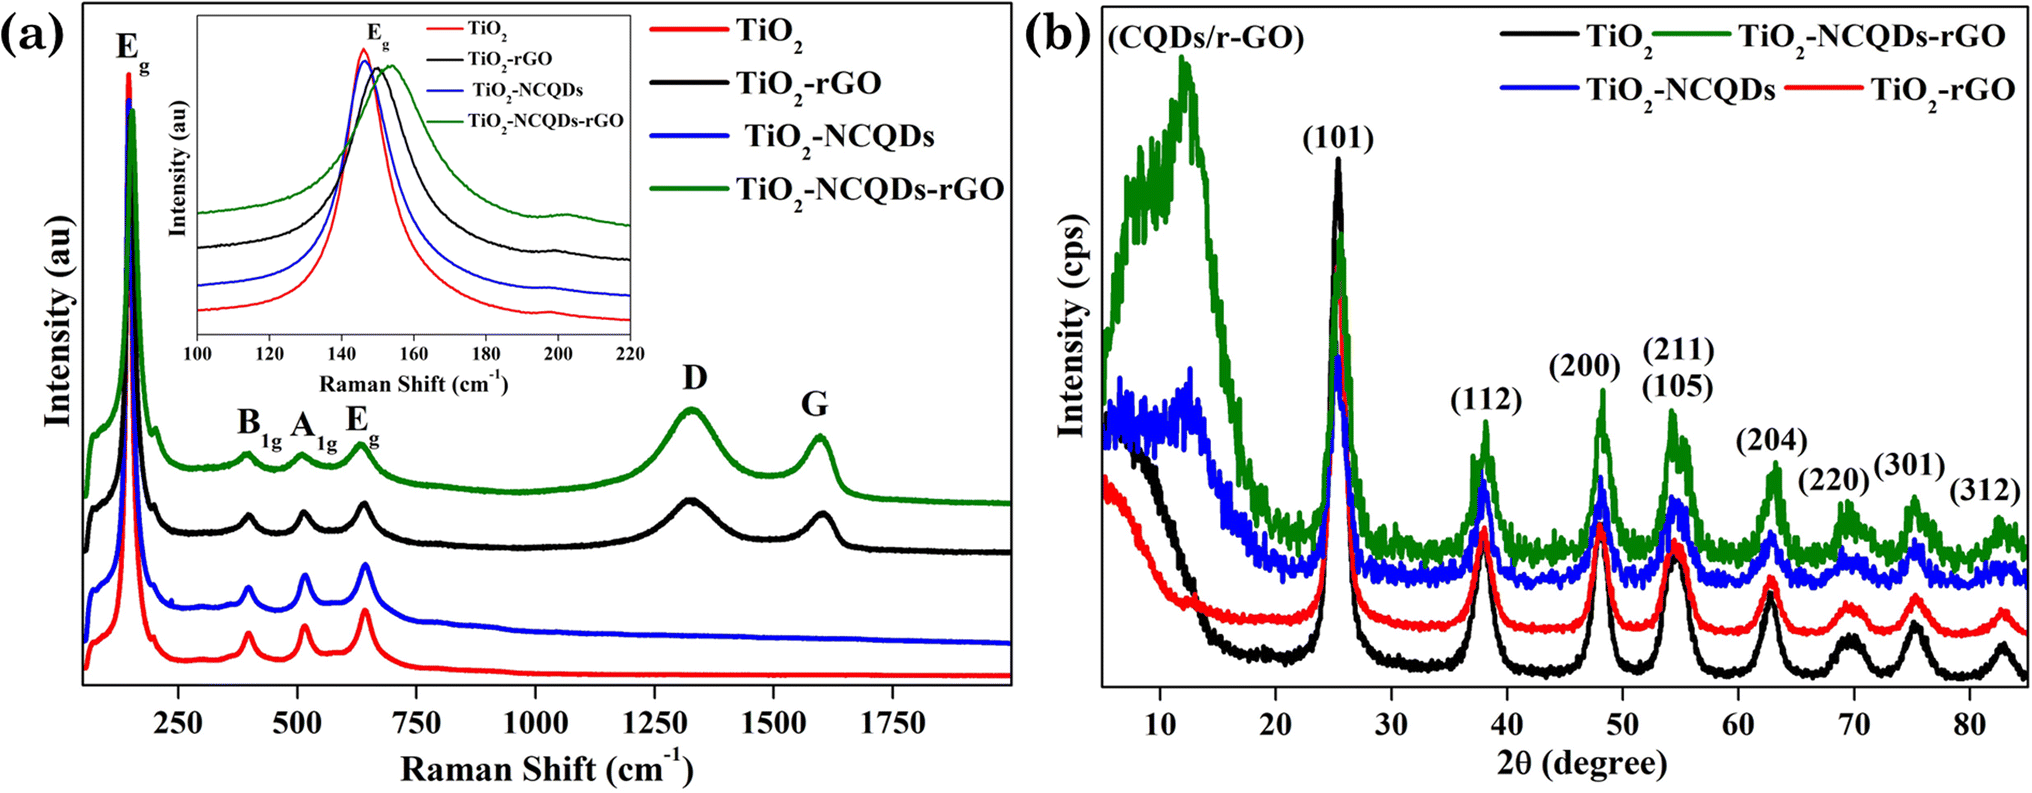 | ||
| Fig. 2 (a) The Raman spectra with anatase TiO2 Eg vibrations in the inset and (b) the XRD patterns of CHFS-synthesised nano-TiO2 hybrids with nitrogen-doped carbon quantum dots and/or reduced graphene oxide revealing characteristic diffraction peaks for anatase and carbonic phases. | ||
Lending further insight and complementary support for our findings, XRD analysis (Fig. 2b) showed characteristic diffraction peaks for TiO2 anatase (JCPDS 21-1272) in all cases. The diffraction peak at 2θ = 12.2° indicated the presence of the carbonic phase [002] and was observed for all samples. Critically, interactions between TiO2 and NCQD and/or rGO are observed by X-ray photoelectron spectroscopy (XPS) and are discussed next.
The XPS analysis of TiO2 nanoparticles (Fig. 3) reveals the characteristic Ti(2p) spin–orbit split peaks, the binding energy of the Ti(2p3/2) peak recorded at 459.3 eV; the corresponding O(1s) peak is composed of two peaks corresponding to Ti–O lattice oxygen (530.6 eV) and surface OH/COx (531.8 eV), an N(1s) signal at 400.7 eV is also found, consistent with fragments in the starting material for the synthesis of the nano-TiO2. For a better understanding of the interaction between the carbon phase and oxide phase, the high-resolution XPS spectrum of carbon (1s) was recorded for all the samples, Fig. 3a. It is worth noting that compared to the pure TiO2, the survey spectra of all samples exhibited higher intensity in carbon originating from graphene and/or carbon quantum dots. The addition of NCQDs to pristine TiO2, resulted in asymmetry to the lower binding energy side of the C(1s) envelope, characteristic of the sp2 graphitic core peaks at binding energies of 284.5 eV (sp3 component was measured at 285.4 eV). The difference in the binding energy of the sp2 component is possibly indicative of the difference in the attachment of the NCQDs to the TiO2, or the charge states of the TiO2 and NCQDs on the surface. Additional C(1s) peaks at 286.7 and 289.4 eV were noted and ascribed to C–O/C–N and COO moieties respectively, whilst N(1s) species at 400.7 eV is again characteristic of C–N/NHx functions.
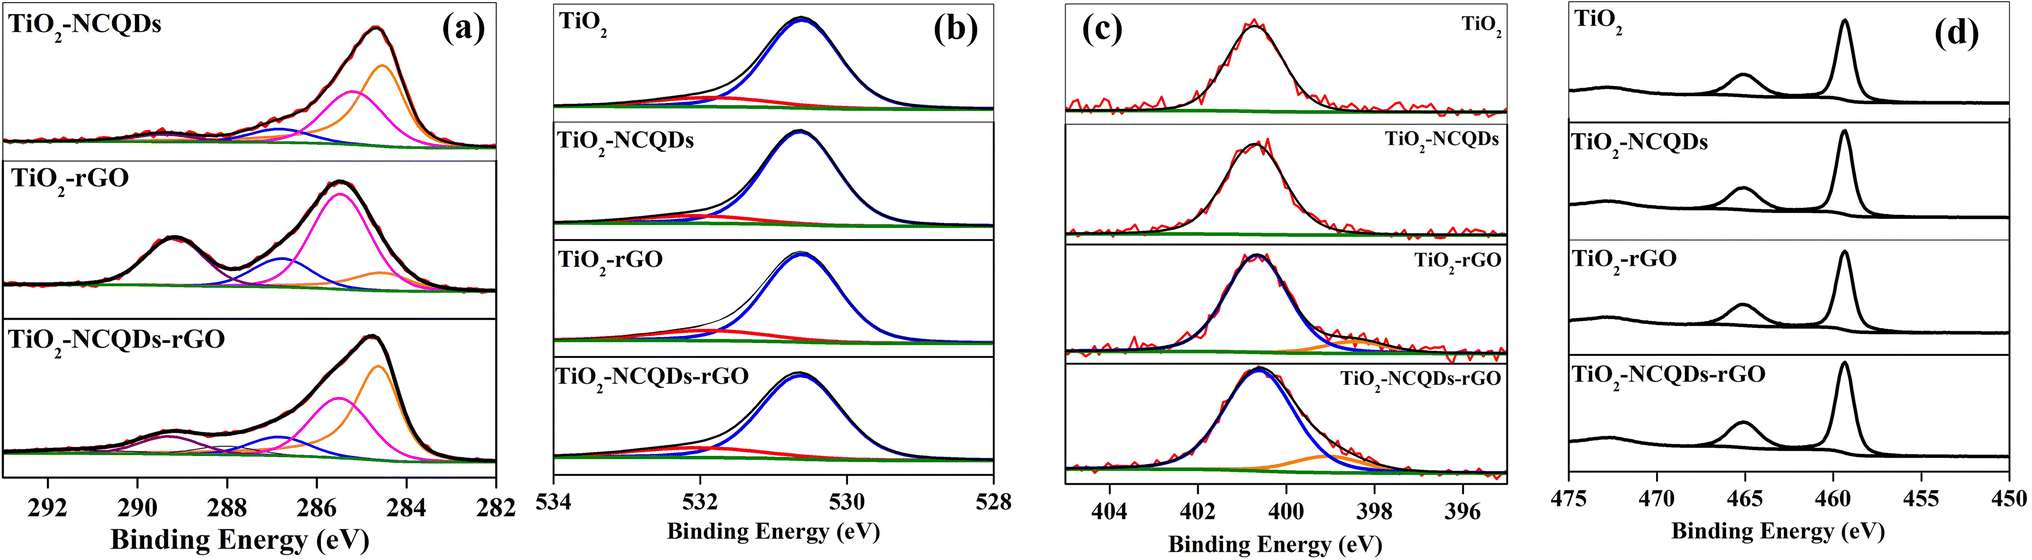 | ||
| Fig. 3 High resolution spectra of (a) C1s, (b) O1s, (c) N1s, and (d) Ti2p, for TiO2 and its carbonaceous nanocomposites. | ||
The TiO2–rGO complex has peaks centred at 284.5, 285.1, 286.8 and 289.4 eV, again characteristic of sp2, sp3, C–O/C–N and COO– functionalities as noted previously. N(1s) signals are found at 398.5 and 400.7 eV representative of C![[double bond, length as m-dash]](https://www.rsc.org/images/entities/char_e001.gif) N–C and C–N type functions. The N presence in rGO is not unexpected as it is considered a consequence of the incorporation of nitrogen from the reaction process. In the case of TiO2–NCQDs–rGO nanomaterial, the high-resolution carbon spectra again show characteristic peaks for sp2 (here the π–π* shake up structure is particularly evident) and C–N/C–O bonds, together with sp3 and the addition of CO functions. For TiO2–NCQDs–rGO, the N(1s) spectra, whilst showing the presence of the 400.7 eV, C–N/–NHx peak, there is a 0.5 eV deviation in the lower binding energy species (399.0 and 398.5 eV, respectively), the lower peak typically ascribed to –NH– or CN species.38 XPS confirms the relationship between TiO2 with NCQDs, and with rGO; despite signals absent from Raman spectroscopy mentioned earlier for TiO2–NCQDs, as well as from XRD for TiO2–rGO.
N–C and C–N type functions. The N presence in rGO is not unexpected as it is considered a consequence of the incorporation of nitrogen from the reaction process. In the case of TiO2–NCQDs–rGO nanomaterial, the high-resolution carbon spectra again show characteristic peaks for sp2 (here the π–π* shake up structure is particularly evident) and C–N/C–O bonds, together with sp3 and the addition of CO functions. For TiO2–NCQDs–rGO, the N(1s) spectra, whilst showing the presence of the 400.7 eV, C–N/–NHx peak, there is a 0.5 eV deviation in the lower binding energy species (399.0 and 398.5 eV, respectively), the lower peak typically ascribed to –NH– or CN species.38 XPS confirms the relationship between TiO2 with NCQDs, and with rGO; despite signals absent from Raman spectroscopy mentioned earlier for TiO2–NCQDs, as well as from XRD for TiO2–rGO.
FT-IR spectroscopy analysis (Fig. 4) reveals the distinctive overlapping stretches (2700–3500 cm−1) due to the presence of hydroxyl groups (–OH, –COOH) on the surface of TiO2, and its nanocomposites, as well as protonated amino groups for TiO2 nanocomposites of NCQDs and/or rGO, along with the expected C–H stretching vibrations (2950 cm−1).
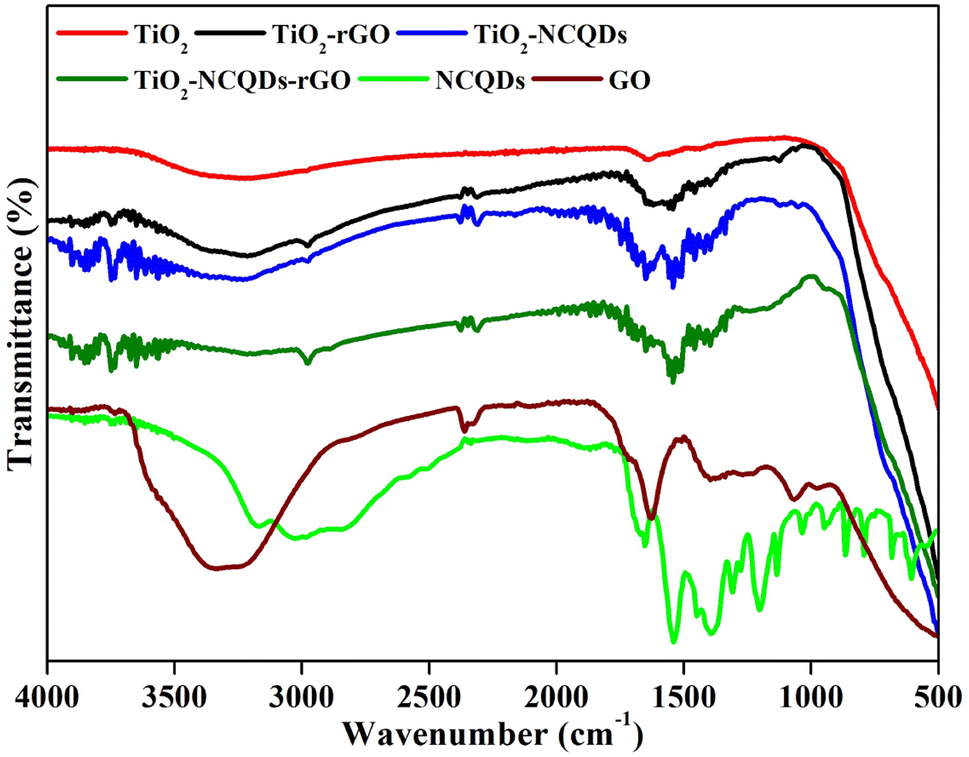 | ||
| Fig. 4 FT-IR spectra of the CHFS-synthesised photocatalysts. | ||
Additional peaks may be assigned for CO/COO– (1641 cm−1), CN (1532 cm−1) and C–N (1460 cm−1) in the TiO2–NCQDs supporting XPS data stated earlier. For the TiO2–rGO-related materials, the presence of oxygen functionalities on the rGO surface was supported by stretches for CO/COO– (1627 cm−1), C–OH (1396 cm−1) and C–O–C vibrations (1068 cm−1), which are diminished when compared to graphene oxide precursor indicating the reduced form being present. The absorption band at ca. 1543 cm−1 may be assigned for graphene-based hybrids that are related to the skeletal vibration of the sheets;39 however, this peak may overlap with the characteristic stretch for CN of NCQDs in TiO2–NCQDs–rGO. The broadening of peaks observed for TiO2 nanocomposites below 1000 cm−1 may correspond to TiO2 coordinating through a combination of interactions, Ti–O–Ti and Ti–O–C, with the carbonaceous materials.40
A photocatalyst with a bandgap that corresponds to solar light and can efficiently maximise energy utilisation would as such be highly desirable. In this regard, the light absorption properties of the as-synthesized photocatalysts were investigated using diffuse reflectance UV-Vis spectrophotometry as profiled in Fig. 5, where bandgap edge values were quantified based on collected measurements.
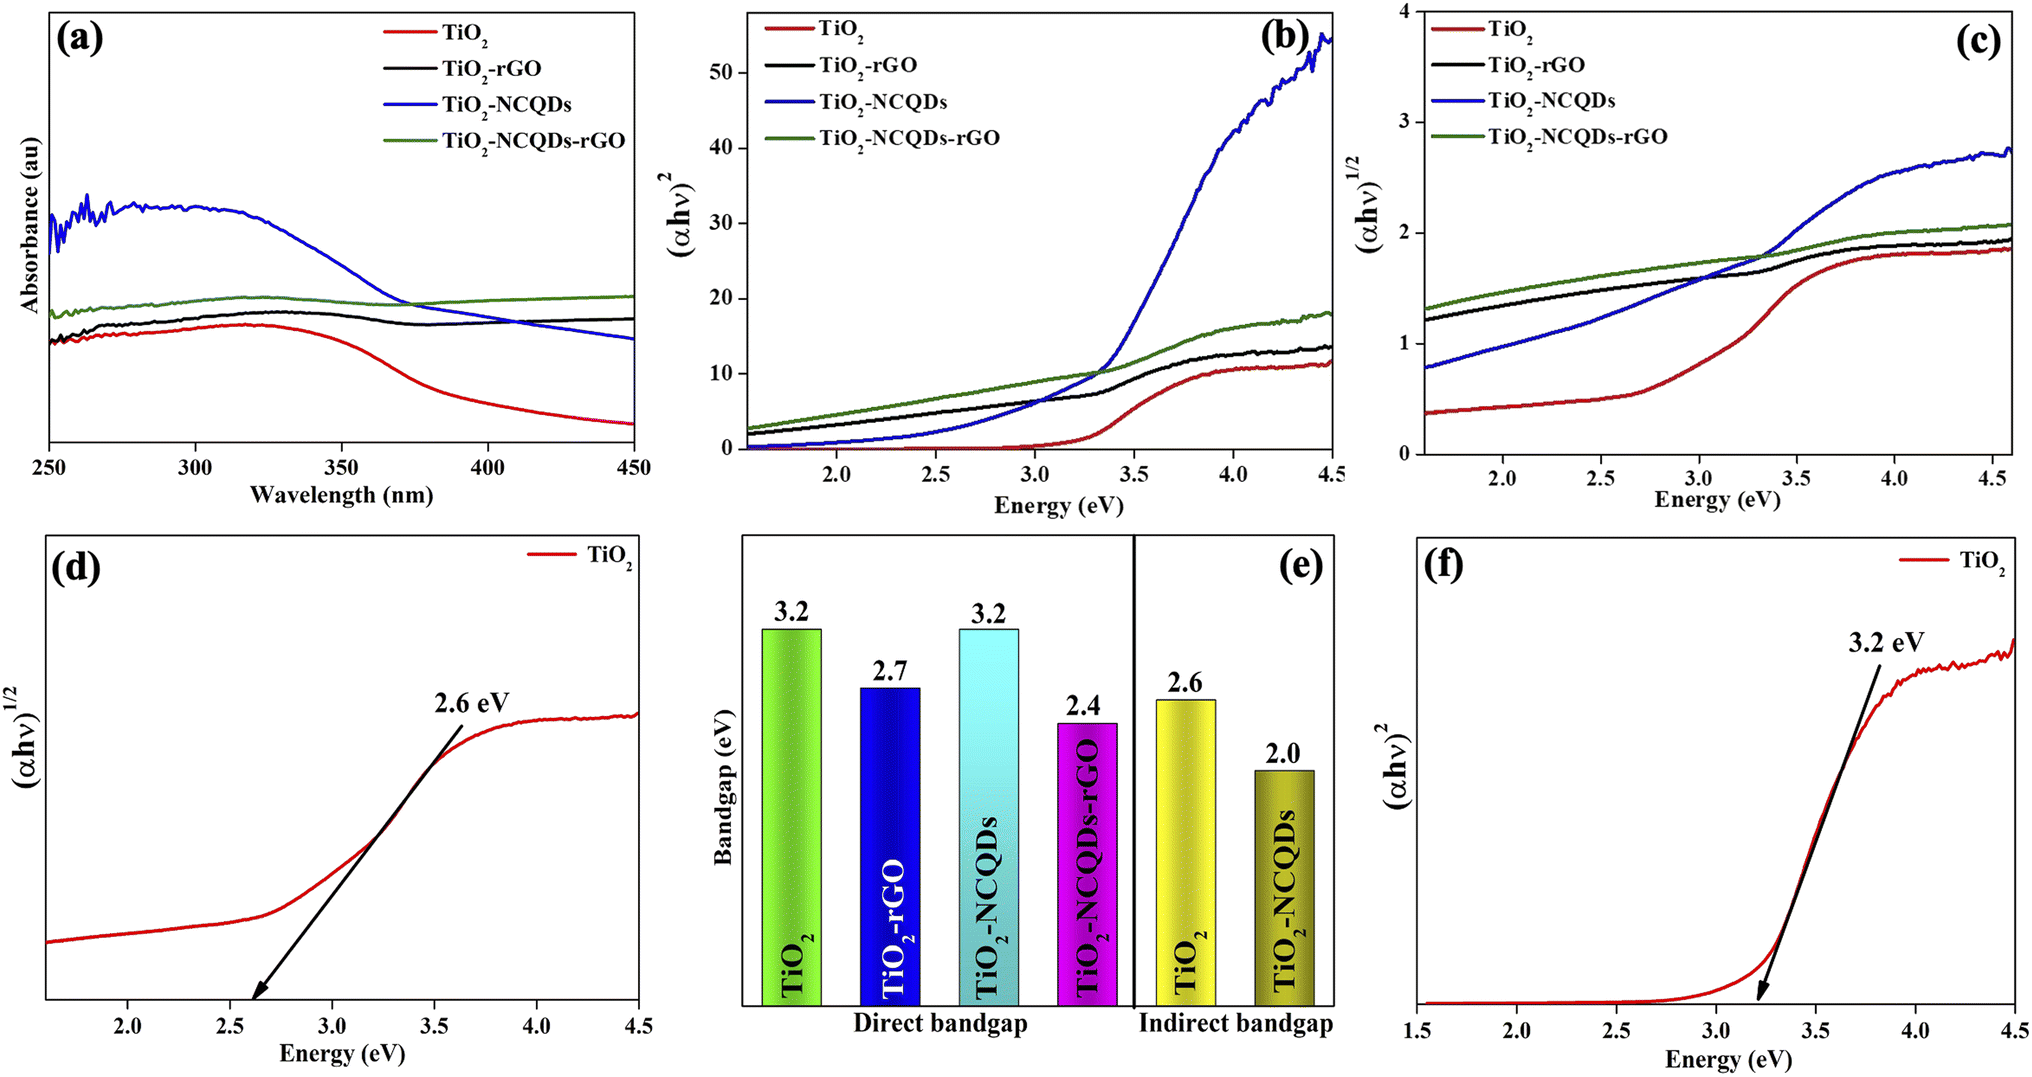 | ||
| Fig. 5 Optical properties of the CHFS-synthesised materials: (a) UV-Vis absorption profiles, and Tauc plot profiles (αhν)nversus photon energy hν are shown for (b) direct (n = 2) and (c) indirect (n = 1/2) bandgap transitions of all photocatalyst materials. (d)–(f) The resulting extrapolated band gap edge Eg (eV) values shown for all photocatalyst materials. Methodology of bandgap determination for the representative sample of TiO2 and its quantified Eg values for (d) indirect and (f) direct transition. | ||
Characteristically, the TiO2 (Fig. 5a) nanoparticles demonstrated a strong UV absorption below 400 nm; however, the absorption edge shifted from the UV to visible when TiO2 was combined with reduced graphene oxide (rGO). This phenomenon was also observed for TiO2–NCQDs, but at a lower intensity. Significantly, it is by the incorporation of NCQDs into TiO2–rGO that an appreciable increase in UV and visible radiation absorption was realised, offering the possibility of improved light-harvesting performance. The quantified bandgap edge values (Fig. 5b and c) were calculated using the Tauc plot, either for direct and indirect transitions (relationship of [αhν]nversus photon energy, where n = 2 for direct transition or n = 1/2 for an indirect one) for each corresponding photocatalyst. The bandgap for anatase TiO2 was calculated to be 3.2 eV, whereas the bandgap values of TiO2–carbonaceous hybrids were noted to be substantially reduced. Extending photocatalyst absorption into the visible region of the electromagnetic spectrum by primarily narrowing the bandgap is generally regarded as one of the most difficult aspects of designing photocatalytic material. These optical studies have demonstrated that using CHFS to manufacture TiO2 and its carbonaceous nanocomposites provided materials with improved properties when compared to anatase, such as an enhanced ability to absorb visible radiation. Nevertheless, the photo-response of these modified catalysts is highly dependent on the characteristics of the type of dopant and as well as dopant optimal concentration. Crucially, fast interfacial electron transport that minimise electron–hole pair recombination (produced when a photon is absorbed), as well as the lifetime of charge separation, play key roles in the photocatalytic activity of a material.
To quantify the interfacial charge transfer process between TiO2 and nitrogen-doped carbon quantum dots (NCQDs) and/or reduced graphene oxide, the transient photoluminescence (PL) studies were performed using time-correlated single-photon counting (TCSPC) at an excitation wavelength of 375 nm. The normalized PL decays (Fig. 6a) show a decrease in the rate of decay for the nanocomposites of TiO2 with rGO and NCQDs. The slowest decay is observed in the case of TiO2–NCQDs–rGO (6.13 ns). Since PL is the result of the recombination of photo-generated electrons and holes, slower decay means that this recombination is suppressed in the presence of rGO and/or NCQDs due to efficient charge separation.41
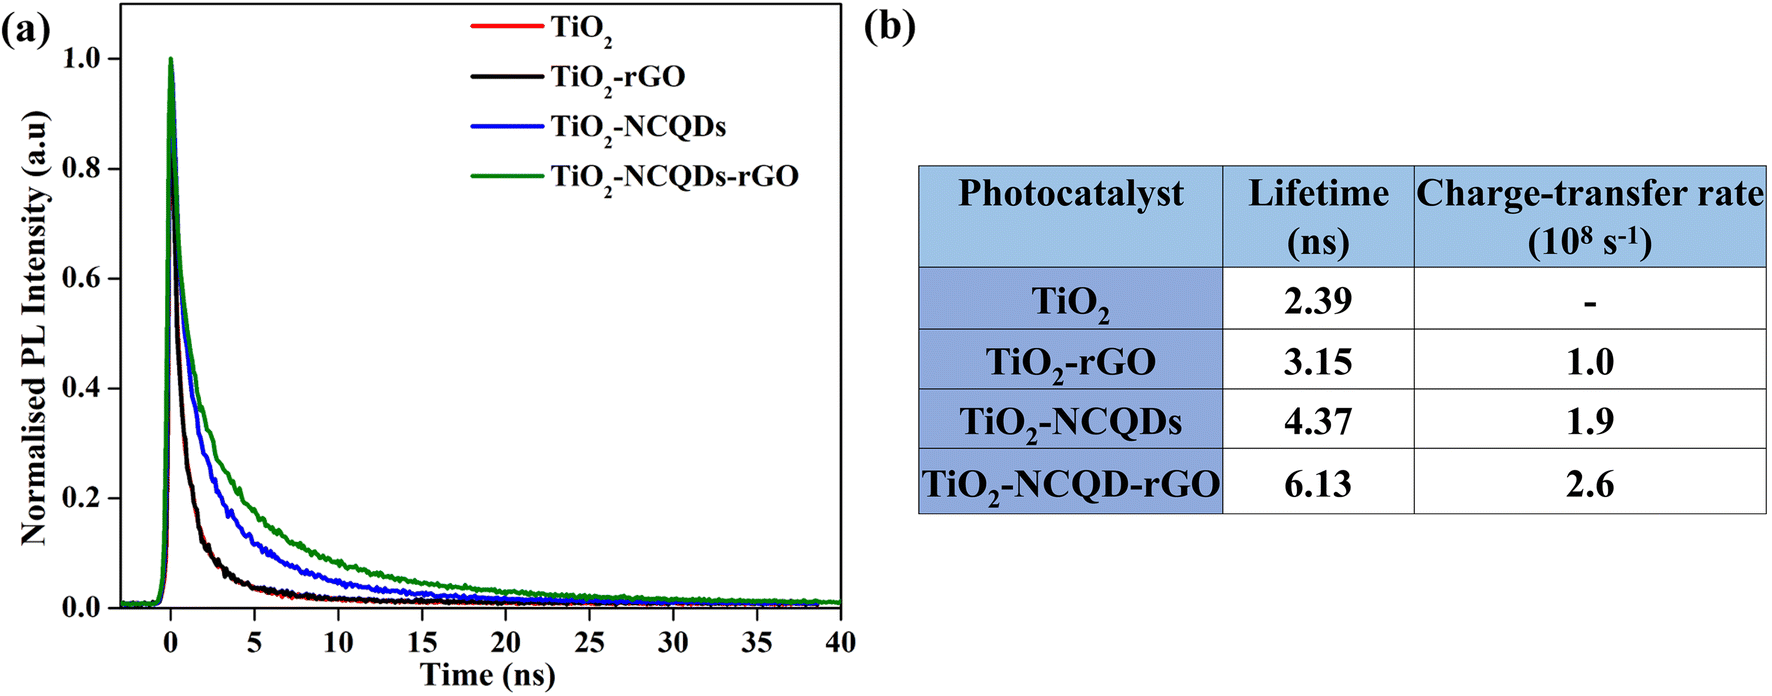 | ||
| Fig. 6 (a) Transient photoluminescence spectra of TiO2 and TiO2–carbonaceous nanocomposites and (b) tabulated data showing lifetime (ns) and charge transfer rate (sec−1) values. | ||
If it is assumed that the difference in the TiO2 emission lifetime (τ) is exclusively due to interfacial charge transfer between TiO2 and NCQDs and/or rGO, then the rate constant for electron transfer, kET, can be determined. Previous studies41 have estimated kET using:
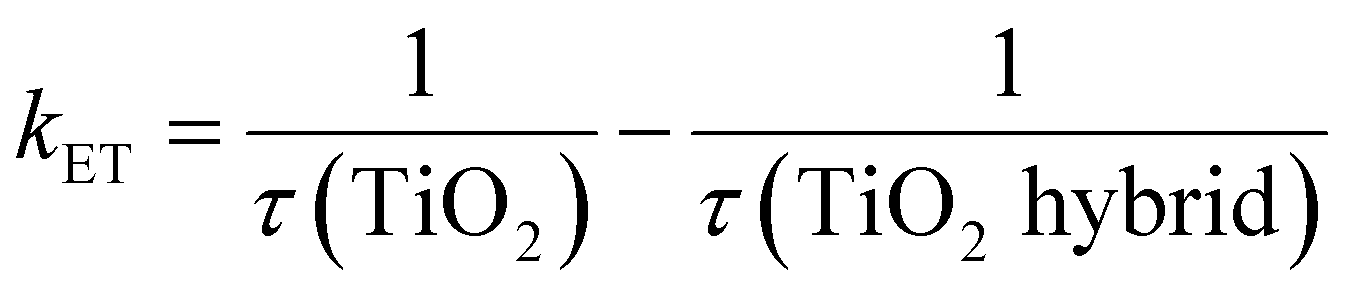 | (1) |
To determine the emission lifetime, the experimental data were fitted with multiexponential decays and the average lifetimes were calculated for all samples and were used to evaluate the electron transfer rate constants (Fig. 6b) using eqn (1). Comparison of the interfacial charge transfer rate constants with trends for photocatalytic activities of the nanocomposites (Fig. 7) was found to be complimentary. The greatest charge transfer rates were obtained when TiO2 was combined with NCQDs and graphene, in particular for TiO2–NCQDs–rGO (2.6 × 10⁸ s−1). This reflects the photocatalytic performances of TiO2 and its carbonaceous nanocomposites, and the influence of intimate contact between TiO2 with NCQDs, and/or rGO.
 | ||
| Fig. 7 (a) Photo-response activities of TiO2 and hybrid nanomaterials showing photodecomposition of methylene blue (a) the final % conversation (C = final concentration to C0 = initial concentration, C/C0 × 100) for each photocatalyst during the total solar light exposure period and, (b) first-order rate constants. In both graphs, control = methylene blue. | ||
The presence of NCQDs not only improves the composite's interfacial charge transfer but also can influence the photolytic efficiency. This was highlighted by the longer lifetimes and charge transfer rates observed for TiO2–NCQDs and TiO2–NCQDs–rGO when they are compared with TiO2 and TiO2–rGO samples.
3.2 Photocatalytic activity measurements
The TiO2 and its carbonaceous nanocomposites were examined for their ability to photodegrade a model dye pollutant (methylene blue, MB) under a solar light simulator (Fig. 7). The photo-response was assessed by measuring the concentration of MB at 30-minute intervals over a total irradiation time of 180 minutes. The conversion of MB (C = final concentration, C0 = initial concentration, (C/C0 × 100)) for each of the photocatalytic nanomaterials during the total solar light exposure period was recorded (Fig. 7a). The photocatalytic reaction rate was determined using the first-order kinetics (ln(C/C0) = −k′t),2 where ln(C/C0) vs. time exhibited a linear relationship in all the cases, and the rate constant, k′, was determined from the slope. A control experiment involved the direct photodegradation of MB dye in the absence of a catalyst under the same solar irradiation conditions. Different light sources including full-spectrum solar light (>λ200 nm) and visible light only (>λ400 nm) were investigated, and the irradiation spectra are shown in Fig. S1.†Most of the carbonaceous TiO2 nanocomposites (N-doped carbon quantum dots and/or reduced graphene oxide) revealed remarkable improvement in photocatalytic activity, in particular, TiO2–NCQDs–rGO with 93% conversion of MB in the allotted 180 minutes, and significantly, a 6-fold photocatalytic rate enhancement (25.24 × 10⁻⁵ s−1) over that of TiO2 alone (Fig. 7b). The photocatalytic activities are comparable to the lifetimes of photogenerated charge carriers (as determined from TPS and shown in Fig. 6), with longer lifetimes correlating with improved photocatalytic activity. Furthermore, the addition of rGO enhances the adsorption capacity towards methylene blue via either or a combination of their respective anionic–cationic interactions and possible aromatic π-stacking and/or C–H–π interactions with the dye. As a consequence, the adsorbed reaction substrates can effectively react with photogenerated key active species (e.g., electrons/holes, hydroxyl radicals, and superoxide radicals) on the surface of the nanohybrid, enhancing the photoredox activity. Indeed, TiO2–NCQDs–rGO which exhibited the highest photocatalytic activity, also had a high adsorption coefficient (Table S1†). In all cases, the formulations of hybrids through CHFS synthesis have proven to be more efficient in delivering enhancement of catalytic activities when compared to TiO2 alone.
Furthermore, under visible light (λ > 400 nm), the hybrid materials perform outstandingly, and the photo-response activities (reaction rate and MB degradation) are shown in Fig. S3.† The best-performing catalyst, TiO2–NCQDs–rGO, was selected to investigate the effect of changing light intensity (0.25, 0.5, and 1 sun) on the degradation of MB dye, and the results are shown in Fig. S4.† It should be noted that increases in light intensity (from 0.5 to 1 sun) did not result in appreciable improvements in degradation efficiency. This indicates that at 50 mW cm−2, the optimum number of photons required for efficient photocatalytic degradation was obtained (0.5 sun). Tables S2 and S3† show the corresponding AQE values for different light sources and light intensity variations (λ > 400 nm), respectively. It was observed that an increase in light intensity corresponds to an increase in AQE, which is consistent with reported research (see the ESI†).
Tailoring the optical properties of titania and controlling its electronic structure have been the subject of research primarily because thay are related to optimisation of its functionalities. Hybridisation with other nanostructures such as carbon quantum dots, results in the formation of new electronic structures (type II heterojunctions) and an increase in the photo-response. This form of arrangement has been shown to not only increase the visible light harvesting potential whilst also extending the lifetime of photogenerated carriers (electrons and holes) through internal charge transfer. These phenomena are further enhanced by the substitutional doping and the addition of a heteroatom, N,42 present in all CHFS-synthesised materials discussed. Graphene can also act as a co-catalyst when hybridised with titanium dioxide. With an electron conductive nanosheet and a lower Fermi stage, 2D graphene can act as an electron reservoir in accepting, transporting and shuttling the electrons produced by photoexcitation of TiO2, enhancing charge carrier separation and transfer to participate in photo-redox processes (decomposition of methylene blue dye). Hence, multilevel/route electron transfer is possible with the hybrid structures of TiO2 and carbonaceous materials reported herein (Scheme 2).
 | ||
| Scheme 2 Mechanism of the photocatalytic reaction between methylene blue and the TiO2–NCQDs–rGO hybrid. A type II heterojunction is formed when TiO2 and NCQDs combine. When excited by full solar light irradiation, electrons (e−) move from the highest-occupied molecular orbital (HOMO) of NCQDs and the valence band (VB) of TiO2 to the lowest-occupied molecular orbital (LUMO)/CB. Literature suggests that anatase prefers h+-mediated photocatalysis for dye photodegradation. As a result, the photoinduced holes (h+) can oxidise water molecules, producing hydroxyl free radicals (˙OH), which are very reactive in oxidising MB. The excited electrons migrate into the π-orbital of the rGO layer, which serves as a conducting 2D network, where excited electrons can freely move to combine with the dissolved oxygen, generating oxygen radicals (˙O2−) that can also react with MB. The movement of photoexcited electrons from the LUMO level of NCQDs to the rGO layer is also expected. Experiments with various light sources show that TiO2 absorbs UV and visible light (due to N-doping creating allowed electronic states between the VB and CB of titania). Overall, the material combination enables efficient charge separation and rapid charge carrier diffusion, resulting in a low charge recombination rate. | ||
3.3 Density functional theory (DFT) calculations
To gain further insight into how the rGO layer (or carbon quantum dots) affects the position of the electronic energy band edges of the anatase system, and what charge transfer occurs if any, an idealised TiO2–graphene model was subjected to density functional theory (DFT) calculations using a plane-wave basis set and a hybrid functional for exchange and correlation. A trade-off between model size and accuracy of the calculation of the electronic properties was necessary, and thus the utilisation of simple slab models to simulate the interface between anatase and graphene was chosen. To carry out the hybrid DFT calculations tractably, the size of the model was restricted to 100–120 atoms to allow fitting of the graphene layers on the slabs with periodic boundary conditions and allow large strains (greater than 5%) to be applied to the graphene layer.This model, composed of a highly strained graphene layer adhered to an infinitely-extending 2D TiO2 slab, is not an accurate simulation of the as-synthesised nanocomposites. Nevertheless, substantial insight can still be gained into the expected charge transfer and modulation of the energy band edges of anatase by the rGO and/or carbon dots that allowed for the enhancement of photocatalytic properties.43 Realistically, larger models could be designed using, for example, interatomic force fields and/or semiclassical techniques;44,45 however, such methods tend to include empirical parameters which have their own disadvantages. As such, the approach chosen herein provides a significantly more accurate account of the electronic energy levels, where analysis of the variation in said energy levels when graphene is present allows for the identification of any possible improvements in photocatalytic properties.‡
The idealised model, chosen as the more energetically favourable for anatase, consisted of slabs of anatase TiO2 cut along the low-index (001), (101) and (100) surfaces.46 The slabs were relaxed fully, and the electron ionisation potentials, I, were computed. Knowledge of I, the energy required to excite an electron from the valence band within the slab to the vacuum level outside, allows for referencing the valence band edges to the vacuum level, thus placing the band on an absolute scale.26,47 Combined with the band gap of bulk anatase, it allows for determination of where the valence band maximum (VBM) and conduction band minimum (CBM) lie relative to particular redox potentials, for example, water oxidation and reduction potentials for photocatalytic water splitting. Once I has been computed, a layer of graphene was added to the TiO2 slab, and the combined TiO2–graphene system was allowed to relax. Then, I for the combined system was calculated to determine the effect of graphene on the band edges. Moreover, by analysing the partial charge densities and spin density, the charge transfer between graphene and TiO2 was shown to occur.
As shown below, a small negative charge density is transferred from the TiO2 slab to the graphene layer, meaning that the VBM states are confined within the graphene layer and the CBM states within the TiO2 layer. Furthermore, I increases substantially within the graphene layers, so that the VBM is pushed downwards (to more negative energies) on the absolute scale, whilst I within the interior of the TiO2 slab is decreased to facilitate CBM being pushed upwards on the absolute scale. Crucially, both of these effects, i.e. the separation of charge and the pushing down (up) of the VBM (CBM) on the absolute energy scale, will be beneficial for photocatalytic activity.48 The charge separation represses unwanted charge recombination, while the energy levels shift to more favourable positions relative to the water redox potentials. These two effects constitute the main results of the computational study here within. Although the slab model is a simplification with respect to the systems for which the measurements were performed, nevertheless, it was expected that both effects should occur in our samples as a significant source for the improved photocatalytic activity of the composite systems. We will now present the detailed results of the DFT calculations.
After relaxing the atomic coordinates, the lattice parameters, a = 3.789 Å and c = 9.613 Å, were determined within ∼1% of the experimental values for the tetragonal anatase structure.49 The calculated band gap of anatase was 3.40 eV which is in good agreement with previous theoretical and experimental studies.47,50 The relaxed C–C bond length in graphene was found to be 1.415 Å, in excellent agreement with the experimental C–C bond in graphite and graphene (1.42 Å). The (001), (100) and (101) surfaces of anatase TiO2 were relaxed for the slab model approach (Fig. 8). As the surfaces are non-polar, minor relaxations were observed on the surface. The calculated surface energies: (001) 1.21 J m−2, (100) 0.73 J m−2 and (101) 0.16 J m−2 which follow the observed trend were in reasonable agreement with standard DFT.51,52
 | ||
| Fig. 8 Calculated planar averaged potential along the direction perpendicular to the slabs, given relative to the value in the vacuum gap. The distance perpendicular to the slabs is given relative to one of the edges of the pure TiO2 slab for each of the facets modelled, which are (left to right): (001), (100) and (101). In the upper panes, the results are given for the pure TiO2 slabs, while the lower panes show the results for the corresponding slabs with single layers of graphene added above and below. The arrows indicate the computed offsets in potential between the vacuum layer and slab interiors (ΔV). The slab models are shown in each pane, aligned with their planar electrostatic potential. Ti atoms are represented by blue spheres, oxygen atoms by red spheres and carbon atoms by brown spheres. | ||
Shown in the lower panes of Fig. 8 are the relaxed slabs with the added graphene layers. After relaxation, the graphene layers were found to have rumpled very slightly, with movements of the C atoms of ∼0.01–0.02 Å. The graphene layers relaxed to distances of 3.76 Å, 3.51 Å and 3.52 Å from the (001), (100) and (101) anatase surfaces, respectively. The potential energy surface proved to be quite shallow; consequently, the relatively large convergence criterion in interatomic forces of 0.025 eV Å−1 was chosen for these relaxations. Interestingly, for the (100) surface, a second local minimum in the potential energy surface was found that had a total energy slightly lower (by about 5 meV per atom) than the relaxed surface shown in Fig. 8. This result showed larger rumpling by an order of magnitude in the graphene layer.
The calculated planar electrostatic potentials averaged over the cells in the direction perpendicular to the slab surfaces are shown in Fig. 8, along with the computed values of ΔV (indicated by arrows). From the relaxation of bulk anatase, it was determined that EVBM = −0.45 eV and Eg = 3.40 eV. It was therefore found for the cases without graphene, the surface cuts (001), (100) and (101) have I = 7.2 eV, 7.3 eV and 7.5 eV, respectively, and A = −3.8 eV, −3.9 eV and −4.1 eV respectively.
The change in the potential when graphene was added was quite pronounced. Two clear potential wells were observed, one deeper well close to the surface of the slab, and a broad, shallower well in the interior of the slab, relative to the surface. As the offset in potential between the slab interior and the vacuum can be related to the position of the VBM on an absolute scale, we see that the energy bands are pushed down at the surface, and up in the interior of the slabs. For the (001) surface, the shift of the bands to more negative energy at the surface when graphene is added is −0.1 eV, and the shift to more positive energies in the interior is 0.3 eV. For the (100) surface, the shifts are −0.7 eV and +0.3 eV, and for the (101) surface they are −0.8 eV and +0.8 eV. For the (001) surface, the deeper well at the surface when graphene is added has a shallow part, then a sharp deepening, in contrast to the two other cases studied. It was observed that in the case of the (001) surface, the TiO2 surface below the anatase layer relaxed more substantially than in the other cases studied.§
A clear shift downwards in the energy of the bands at the graphene layer was observed, and upwards in the TiO2 layer, for the combined systems. Shown in Fig. 9 are the spin density (Fig. 9b) and the partial charge densities for the states at the VBM (Fig. 9c) and CBM (Fig. 9d), for the slab containing the (100) anatase surface (for the other cases, similar results were observed). A charge transfer from the TiO2 slab to the graphene layer of ∼0.1 electrons (in total in the slab model) was also observed. Moreover, as seen from the partial charge densities associated with the VBM and CBM, the states at the VBM are predominately concentrated in the graphene layer, while the states at the CBM are localised in the interior of the TiO2 slab, on the Ti atoms with charge densities similar to the shapes of d orbitals. It can therefore be concluded that the effective VBM of the combined system is pushed downwards on an absolute energy scale, whilst the CBM is pushed upwards. This shift in band edges results in a more favourable alignment with the water redox potentials, thus favouring improved catalytic activity.26,47 The charge separation will also favour photocatalytic processes, as recombination will be suppressed. The combination of these two effects is significant and should see a considerable improvement in photocatalytic performance, due to the presence of the graphene on the TiO2 slab.
 | ||
| Fig. 9 The spin and charge densities for the relaxed combined anatase (100) surface and graphene layer slab. (a) The relaxed (100) anatase surface with the graphene layer above. The direction perpendicular to the slab is to the right. (b) The calculated spin density (purple and yellow isosurface with a density of 10−4 e Å−3). (c) The partial charge density associated with the states at the top of the valence band (grey isosurface with a density of 10−3 e Å−3). (d) The partial charge density associated with the state at the bottom of the conduction band (orange isosurface with a density of 10−3 e Å−3). Ti atoms are represented by blue spheres, oxygen atoms by red spheres and carbon atoms by brown spheres. | ||
Whilst this model of a TiO2–graphene nanocomposite, as discussed earlier, is somewhat crude, nevertheless, these electronic effects, calculated with a sophisticated first principles method, can be expected in real samples. The absolute calculated shifts are not expected to be accurate when compared with experimental results but are indicative of trends that are crucial for improved catalytic performance. The modelling has demonstrated that the combination of anatase and graphene results in energy band shifts and charge separation that significantly benefits photocatalytic performance, and it can be expected that these effects will also be present to some degree when other carbon structures are used, such as quantum dots and rGO layers.
4. Conclusions
Continuous hydrothermal flow synthesis enabled the rapid and efficient production of homogeneous nano-TiO2 hybrid composites with nitrogen-doped carbon quantum dots and/or reduced graphene oxide with outstanding photocatalytic activities. Titania particles exhibited a particle size of <5 nm, high crystallinity (anatase form) and large surface area (typically > 232 m2 g−1), NCQDs exhibited spherical morphology (mean particle size ca. 3.4 nm) with a graphitic core arrangement, and the graphene (rGO) sheets consisted of 5–8 layers. The highlight of the TiO2 hybrid nanocomposites’ remarkable photocatalytic activity was TiO2–NCQDs–rGO providing 93% conversion of methylene blue with a 6-fold photocatalytic rate enhancement (25.24 × 10⁻⁵ s−1) over that of TiO2 alone under solar light simulation was facilitated by longer emission lifetimes (6.13 ns), faster charge transfer rates (2.6 × 10⁸ s−1), and a narrowed band gap. Changes in the bandgap are supported by hybrid DFT calculations based on a model system that indicated a shift in band edges to a more favourable alignment between anatase and graphene, and recombination would be suppressed. The combination of these two effects accounts for the considerable improvement in photocatalytic performance identified for the TiO2–rGO example (emission lifetime, 3.15 ns and charge transfer rate, 1.0 × 10⁸ s−1). The model proposed for TiO2–NCQDs–rGO would also incorporate this, facilitated by NCQDs further increasing the photosensitivity, the emission lifetimes and charge transfer rates via multilevel electron transfer thus significantly enhancing photocatalytic activity.Effective nano-level engineering coupled with a successful synthetic technique that delivers close interfacial interaction and tailored surface chemistry is thus critical for achieving the optimum performance and efficiency in terms of the charge carrier transfer to the surface of the photocatalyst facilitating relevant photoredox reactions to take place. These hybrid structures reported here have the potential to be explored in alternative fields including energy storage, hydrogen generation, or environmental applications.
Author contributions
IAB: investigation, writing original draft; JB: theoretical calculations and associated methodology, writing original draft; KGN: photocatalytic experiments under LED light; TH: TEM analysis; TS, ST and AR: transient photoluminescence spectroscopy analysis; DJM: XPS analysis; NPP: XRD characterisation data; SAN and MT: UV-Vis spectrophotometry absorption measurements of the photocatalyst powders; SD and SK: conceptualisation, facilities and resources; SK: project management/supervision, methodology, writing original draft; all authors reviewed and edited the paper.Conflicts of interest
The authors have no conflicts of interest to declare.Note added after first publication
This article replaces the version published on 13th April 2023 which contained errors related to the charge transfer rate in the conclusion.Acknowledgements
SK, TS, SD and IAB would like to acknowledge the financial support provided by LSBU. NP acknowledges the facilities of The Open University and technical assistance of Dr Matthew Kershaw with X-ray powder diffraction. MT acknowledges the RAEng CiET fellowship. Via JB's membership of the UK's HEC Materials Chemistry Consortium, which is funded by EPSRC (EP/R029431), this work used the ARCHER2 UK National Supercomputing Service (https://www.archer2.ac.uk).References
- U. Nations, The United Nations World Water Development Report 2019: Leaving No One Behind, 2019 Search PubMed.
- J. B. M. Goodall, S. Kellici, D. Illsley, R. Lines, J. C. Knowles and J. A. Darr, Optical and photocatalytic behaviours of nanoparticles in the Ti-Zn-O binary system, RSC Adv., 2014, 4, 31799–31809, 10.1039/c3ra48030e.
- P. Kar, S. Zeng, Y. Zhang, E. Vahidzadeh, A. Manuel, R. Kisslinger, K. M. Alam, U. K. Thakur, N. Mahdi, P. Kumar and K. Shankar, High rate CO2 photoreduction using flame annealed TiO2 nanotubes, Appl. Catal., B, 2019, 243, 522–536, DOI:10.1016/j.apcatb.2018.08.002.
- (a) S. Chen, T. Takata and K. Domen, Particulate photocatalysts for overall water splitting, Nat. Rev. Mater., 2017, 2, 1–17, DOI:10.1038/natrevmats.2017.50; (b) R. Su, Designer titania-supported Au–Pd nanoparticles for efficient photocatalytic hydrogen production, ACS Nano, 2014, 8(4), 3490–3497, DOI:10.1021/nn500963m.
- C. F. Goodeve and J. A. Kitchener, Photosensitisation by titanium dioxide, Trans. Faraday Soc., 1938, 34, 570–579, 10.1039/TF9383400570.
- Y. Zhang, K. Hawboldt, L. Zhang, J. Lu, L. Chang and A. Dwyer, Carbonaceous nanomaterial-TiO2 heterojunctions for visible-light-driven photocatalytic degradation of aqueous organic pollutants, Appl. Catal., A, 2022, 630, 118460, DOI:10.1016/j.apcata.2021.118460.
- E. Kusiak-Nejman and A. W. Morawski, TiO2/graphene-based nanocomposites for water treatment: a brief overview of charge carrier transfer, antimicrobial and photocatalytic performance, Appl. Catal., B, 2019, 253, 179–186, DOI:10.1016/j.apcatb.2019.04.055.
- B. Yao, H. Huang, Y. Liu and Z. Kang, Carbon Dots: A Small Conundrum, Trends Chem., 2019, 1, 235–246, DOI:10.1016/j.trechm.2019.02.003.
- H. Luo, S. Dimitrov, M. Daboczi, J. S. Kim, Q. Guo, Y. Fang, M. A. Stoeckel, P. Samorì, O. Fenwick, A. B. Jorge Sobrido, X. Wang and M. M. Titirici, Nitrogen-doped carbon dots/TiO2 nanoparticle composites for photoelectrochemical water oxidation, ACS Appl. Nano Mater., 2020, 3, 3371–3381, DOI:10.1021/acsanm.9b02412.
- N. Zhang, M. Q. Yang, S. Liu, Y. Sun and Y. J. Xu, Waltzing with the versatile platform of graphene to synthesize composite photocatalysts, Chem. Rev., 2015, 115, 10307–10377, DOI:10.1021/acs.chemrev.5b00267.
- K. R. Reddy, M. Hassan and V. G. Gomes, Hybrid nanostructures based on titanium dioxide for enhanced photocatalysis, Appl. Catal., A, 2015, 489, 1–16, DOI:10.1016/j.apcata.2014.10.001.
- X. Yang and D. Wang, Photocatalysis: from fundamental principles to materials and applications, ACS Appl. Energy Mater., 2018, 1, 6657–6693, DOI:10.1021/acsaem.8b01345.
- J. A. Darr, J. Zhang, N. M. Makwana and X. Weng, Continuous hydrothermal synthesis of inorganic nanoparticles: applications and future directions, Chem. Rev., 2017, 117, 11125–11238, DOI:10.1021/acs.chemrev.6b00417.
- V. Middelkoop, C. J. Tighe, S. Kellici, R. I. Gruar, J. M. Perkins, S. D. M. Jacques, P. Barnes and J. A. Darr, Imaging the continuous hydrothermal flow synthesis of nanoparticulate CeO2 at different supercritical water temperatures using in situ angle-dispersive diffraction, J. Supercrit. Fluids, 2014, 87, 118–128, DOI:10.1016/j.supflu.2013.12.022.
- S. Kellici, J. Acord, A. Vaughn, N. P. Power, D. J. Morgan, T. Heil, S. P. Facq and G. I. Lampronti, Calixarene assisted rapid synthesis of silver-graphene nanocomposites with enhanced antibacterial activity, ACS Appl. Mater. Interfaces, 2016, 8, 19038–19046, DOI:10.1021/acsami.6b06052.
- U. Alli, S. J. Hettiarachchi and S. Kellici, Chemical functionalisation of 2D materials by batch and continuous hydrothermal flow synthesis, Chem.–Eur. J., 2020, 26, 6447–6460, DOI:10.1002/chem.202000383.
- S. Kellici, J. Acord, J. Ball, H. S. Reehal, D. Morgan and B. Saha, A single rapid route for the synthesis of reduced graphene oxide with antibacterial activities, RSC Adv., 2014, 4, 14858–14861, 10.1039/c3ra47573e.
- I. A. Baragau, N. P. Power, D. J. Morgan, R. A. Lobo, C. S. Roberts, M. M. Titirici, V. Middelkoop, A. Diaz, S. Dunn and S. Kellici, Efficient continuous hydrothermal flow synthesis of carbon quantum dots from a targeted biomass precursor for on-off metal ions nanosensing, ACS Sustainable Chem. Eng., 2021, 9, 2559–2569, DOI:10.1021/acssuschemeng.0c08594.
- I. A. Baragau, N. P. Power, D. J. Morgan, T. Heil, R. A. Lobo, C. S. Roberts, M. M. Titirici, S. Dunn and S. Kellici, Continuous hydrothermal flow synthesis of blue-luminescent, excitation-independent nitrogen-doped carbon quantum dots as nanosensors, J. Mater. Chem. A, 2020, 8, 3270–3279, 10.1039/c9ta11781d.
- S. Kellici, J. Acord, N. P. Power, D. J. Morgan, P. Coppo, T. Heil and B. Saha, Rapid synthesis of graphene quantum dots using a continuous hydrothermal flow synthesis approach, RSC Adv., 2017, 7, 14716–14720, 10.1039/C7RA00127D.
- S. Kellici, J. Acord, K. E. Moore, N. P. Power, V. Middelkoop, D. J. Morgan, T. Heil, P. Coppo, I. A. Baragau and C. L. Raston, Continuous hydrothermal flow synthesis of graphene quantum dots, React. Chem. Eng., 2018, 3, 949–958, 10.1039/c8re00158h.
- G. Kresse and J. Hafner, Ab initio molecular dynamics for liquid metals, Phys. Rev. B: Condens. Matter Mater. Phys., 1993, 47, 558–561, DOI:10.1103/PhysRevB.47.558.
- G. Kresse and J. Furthmüller, Efficiency of ab-initio total energy calculations for metals and semiconductors using a plane-wave basis set, Comput. Mater. Sci., 1996, 6, 15–50, DOI:10.1016/0927-0256(96)00008-0.
- G. Kresse and J. Hafner, Ab initio molecular-dynamics simulation of the liquid-metalamorphous-semiconductor transition in germanium, Phys. Rev. B: Condens. Matter Mater. Phys., 1994, 49, 14251–14269, DOI:10.1103/PhysRevB.49.14251.
- A. V. Krukau, O. A. Vydrov, A. F. Izmaylov and G. E. Scuseria, Influence of the exchange screening parameter on the performance of screened hybrid functionals, J. Chem. Phys., 2006, 125, 224106, DOI:10.1063/1.2404663.
- D. O. Scanlon, C. W. Dunnill, J. Buckeridge, S. A. Shevlin, A. J. Logsdail, S. M. Woodley, C. R. A. Catlow, M. J. Powell, R. G. Palgrave, I. P. Parkin, G. W. Watson, T. W. Keal, P. Sherwood, A. Walsh and A. A. Sokol, Band alignment of rutile and anatase TiO2, Nat. Mater., 2013, 12, 798–801, DOI:10.1038/nmat3697.
- P. E. Blöchl, Projector augmented-wave method, Phys. Rev. B: Condens. Matter Mater. Phys., 1994, 50, 17953–17979, DOI:10.1103/PhysRevB.50.17953.
- H. J. Monkhorst and J. D. Pack, Special points for Brillonin-zone integrations, Phys. Rev. B: Solid State, 1976, 13, 5188–5192, 10.1039/C3RA48030E.
- S. Project, SAINT – Surface and Interface Toolkit: For the Materials and Molecular Modelling Community, https://Saint.Chem.Ucl.Ac.Uk/, accessed 2020 Search PubMed.
- M. Peressi, N. Binggeli and A. Baldereschi, Band engineering at interfaces: theory and numerical experiments, J. Phys. D: Appl. Phys., 1998, 31, 1273–1299, DOI:10.1088/0022-3727/31/11/002.
- A. Walsh and K. T. Butler, Prediction of electron energies in metal oxides, Acc. Chem. Res., 2014, 47, 364–372, DOI:10.1021/ar400115x.
- K. T. Butler, C. H. Hendon and A. Walsh, Electronic chemical potentials of porous metal-organic frameworks, J. Am. Chem. Soc., 2014, 136, 2703–2706, DOI:10.1021/ja4110073.
- N. R. Khalid, A. Majid, M. B. Tahir, N. A. Niaz and S. Khalid, Carbonaceous-TiO2 nanomaterials for photocatalytic degradation of pollutants: a review, Ceram. Int., 2017, 43, 14552–14571, DOI:10.1016/j.ceramint.2017.08.143.
- K. Thompson, J. Goodall, S. Kellici, J. A. Mattinson, T. A. Egerton, I. Rehman and J. A. Darr, Screening tests for the evaluation of nanoparticle titania photocatalysts, J. Chem. Technol. Biotechnol., 2009, 84, 1717–1725, DOI:10.1002/jctb.2237.
- J. S. Lee, K. H. You and C. B. Park, Highly photoactive, low bandgap TiO2 nanoparticles wrapped by graphene, Adv. Mater., 2012, 24, 1084–1088, DOI:10.1002/adma.201104110.
- N. S. Allen, N. Mahdjoub, V. Vishnyakov, P. J. Kelly and R. J. Kriek, The effect of crystalline phase (anatase, brookite and rutile) and size on the photocatalytic activity of calcined polymorphic titanium dioxide (TiO2), Polym. Degrad. Stab., 2018, 150, 31–36, DOI:10.1016/j.polymdegradstab.2018.02.008.
- W. Vallejo, A. Rueda, C. Díaz-Uribe, C. Grande and P. Quintana, Photocatalytic activity of graphene oxide-TiO2 thin films sensitized by natural dyes extracted from Bactris guineensis, R. Soc. Open Sci., 2019, 6, 181821, DOI:10.1098/rsos.181824.
- C. P. Alexander Naumkin, A. Kraut-Vass and S. Gaarenstroom, NIST X-ray Photoelectron Spectroscopy Database, in NIST Stand. Ref. Database 20, Version 4.1, 2012 Search PubMed.
- H. Zhang, X. Lv, Y. Li, Y. Wang and J. Li, P25-graphene composite as a high performance photocatalyst, ACS Nano, 2010, 4, 380–386, DOI:10.1021/nn901221k.
- Y. Zhou, S. Yang, D. Fan, J. Reilly, H. Zhang, W. Yao and J. Huang, Carbon quantum dot/TiO2 nanohybrids: efficient photocatalysts for hydrogen generation via intimate contact and efficient charge separation, ACS Appl. Nano Mater., 2019, 2, 1027–1032, DOI:10.1021/acsanm.8b02310.
- L. Liu, Z. Liu, A. Liu, X. Gu, C. Ge, F. Gao and L. Dong, Engineering the TiO2-graphene interface to enhance photocatalytic H2 production, ChemSusChem, 2014, 7, 618–626, DOI:10.1002/cssc.201300941.
- V. Štengl, D. Popelková and P. Vláčil, TiO2-graphene nanocomposite as high performance photocatalysts, J. Phys. Chem. C, 2011, 115, 25209–25218, DOI:10.1021/jp207515z.
- J. Schneider, M. Matsuoka, M. Takeuchi, J. Zhang, Y. Horiuchi, M. Anpo and D. W. Bahnemann, Understanding TiO2 Photocatalysis Mechanisms and Materials, Chem. Rev., 2014, 114, 9919–9986 CrossRef CAS PubMed.
- X. J. Han, L. Bergqvist, P. H. Dederichs, H. Müller-Krumbhaar, J. K. Christie, S. Scandolo and P. Tangney, Polarizable interatomic force field for TiO2 parametrized using density functional theory, Phys. Rev. B: Condens. Matter Mater. Phys., 2010, 81, 1–9, DOI:10.1103/PhysRevB.81.134108.
- R. S. Kavathekar, P. Dev, N. J. English and J. M. D. MacElroy, Molecular dynamics study of water in contact with the TiO2 rutile-110, 100, 101, 001 and anatase-101, 001 surface, Mol. Phys., 2011, 109, 1649–1656, DOI:10.1080/00268976.2011.582051.
- G. Liu, H. G. Yang, J. Pan, Y. Q. Yang, G. Q. M. Lu and H. M. Cheng, Titanium dioxide crystals with tailored facets, Chem. Rev., 2014, 114, 9559–9612, DOI:10.1021/cr400621z.
- J. Buckeridge, K. T. Butler, C. R. A. Catlow, A. J. Logsdail, D. O. Scanlon, S. A. Shevlin, S. M. Woodley, A. A. Sokol and A. Walsh, Polymorph engineering of TiO2: demonstrating how absolute reference potentials are determined by local coordination, Chem. Mater., 2015, 27, 3844–3851, DOI:10.1021/acs.chemmater.5b00230.
- P. Deák, J. Kullgren, B. Aradi, T. Frauenheim and L. Kavan, Water splitting and the band edge positions of TiO2, Electrochim. Acta, 2016, 199, 27–34, DOI:10.1016/j.electacta.2016.03.122.
- D. T. Cromer and K. Herrington, The structures of anatase and rutile, J. Am. Chem. Soc., 1955, 77, 4708–4709, DOI:10.1021/ja01623a004.
- B. Kraeutler and A. J. Bard, Heterogeneous photocatalytic decomposition of saturated carboxylic acids on TiO2 powder. Decarboxylative route to alkanes, J. Am. Chem. Soc., 1978, 19, 5985–5991 CrossRef.
- M. Lazzeri, A. Vittadini and A. Selloni, Structure and energetics of stoichiometric TiO2 anatase surfaces, Phys. Rev. B: Condens. Matter Mater. Phys., 2001, 63, 1554091–1554099, DOI:10.1103/PhysRevB.63.155409.
- M. Lazzeri, A. Vittadini and A. Selloni, Structure and Energetics of Stoichiometric TiO2 Anatase Surfaces, Phys. Rev. B: Condens. Matter Mater. Phys., 2001, 63(15), 155409, DOI:10.1103/PhysRevB.63.155409; M. Lazzeri, A. Vittadini and A. Selloni, Erratum: Structure and Energetics of Stoichiometric TiO2 Anatase Surfaces, Phys. Rev. B: Condens. Matter Mater. Phys., 2002, 65(11), 119901, DOI:10.1103/PhysRevB.65.119901.
Footnotes |
| † Electronic supplementary information (ESI) available. See DOI: https://doi.org/10.1039/d2ta09586f |
| ‡ A more complete study, using larger slab models is underway and will be reported in the future. |
| § We are investigating these relaxation effects further, but a full analysis is beyond the scope of the current study. |
| This journal is © The Royal Society of Chemistry 2023 |