
Red emissive carbon dots as a fluorescent sensor for fast specific monitoring and imaging of polarity in living cells†
Zheng
Yang
 *abc,
Hui
Li
ab,
Tiantian
Xu
b,
Mengyao
She
a,
Jiao
Chen
a,
Xiaodan
Jia
bc,
Ping
Liu
a,
Xiangrong
Liu
bc and
Jianli
Li
*a
*abc,
Hui
Li
ab,
Tiantian
Xu
b,
Mengyao
She
a,
Jiao
Chen
a,
Xiaodan
Jia
bc,
Ping
Liu
a,
Xiangrong
Liu
bc and
Jianli
Li
*a
aKey Laboratory of Synthetic and Natural Functional Molecule of the Ministry of Education, College of Chemistry & Materials Science, Northwest University, Xi'an, 710127, P. R. China. E-mail: lijianli@nwu.edu.cn
bCollege of Chemistry and Chemical Engineering, Xi'an University of Science and Technology, Xi'an 710054, P. R. China. E-mail: yangzheng@xust.edu.cn
cKey Laboratory of Coal Resources Exploration and Comprehensive Utilization, Ministry of Land and Resources, Xi'an 710012, P. R. China
First published on 10th January 2023
Abstract
Polarity is an integral microenvironment parameter, which is crucial for establishing and reflecting a large number of sophisticated physiological functions and pathological effects. Monitoring changes in intracellular polarity is of great scientific and practical significance. In this work, we present a highly-fluorescent red-emitting carbon dots (CDs) based fluorescent sensor for the specific real-time sensing of polarity in solutions and living cells. Both the fluorescence and absorption wavelengths displayed a large redshift to the red emission region with increasing solvent polarity. Inspired by the excellent photostability and photobleaching resistance, high fluorescence quantum yield, superior interference immunity, negligible cytotoxicity and significant biocompatibility, the sensor has been successfully implemented as an effective diagnostic candidate for monitoring and imaging the polarity changes in mitochondria and lysosomes. This work can not only present effective strategies for the design and synthesis of red/near-infrared (NIR) emissive CDs but also afford promising tools for the selective, sensitive, rapid, real-time visualizing detection of polarity in living cells, as a consequence accelerating a better understanding and diagnosis of polarity-related physiological and pathological processes and diseases.
1 Introduction
Changes in the microenvironment in biological system have noteworthy impacts on various biological processes, for which the detection of related status is extremely consequential in the diagnosis and analysis of diseases, determination of disease pathological mechanisms, research and development into new drug targets.1,2 As an integral microenvironment parameter in biological systems especially for living cells, polarity is vital for establishing and reflecting a large number of sophisticated physiological functions and pathological effects, including activating functional proteins and immune responses, triggering signal transduction and membrane rearrangement,3–5 polarity changes in protein binding, stimulation of cell migration and cell proliferation, affecting the interaction of extensive proteins and enzyme stability as well as the permeability of membrane compartments.6,7 As a result, abnormal variations in polarity have been proved in relation to a diversity of disorders and diseases, such as inflammation, organ failure and cancers.8 In addition to indispensable functions in living organisms, polarity also significantly influences a number of organic and inorganic processes in which the reaction efficiencies and results are closely linked and controlled by the polarity.9,10 Therefore, an accurate response to polar changes in environmental and living biological processes and organisms would be particularly valuable and meaningful.11Amongst a variety of organs and processes, sensing of polarity in mitochondria and lysosomes has attracted particular attention from researchers since mitochondria generally act as energy conversion and storage cellular organelles which play considerable roles in regulating cellular energy metabolism and cell death, while lysosomes usually serve as sacs of hydrolytic enzymes within the cells which are essential and of vital importance in decomposing macromolecules into basic small molecules for cell recycling.12–14 As both the functions of mitochondria and lysosomes are highly dependent on a balanced microenvironment in cells, detecting the changes of polarity in mitochondria and lysosomes is of great significance, which can not only reflect the variation in cell states corresponding to different physiological and pathological activities,15,16 but also serve as specific markers for the occurrence of metabolic diseases, neurodegenerative diseases and immune system diseases.17,18
Several approaches have already been applied for polarity sensing in biological systems, such as transmission electron microscopy and immunoblotting for proteins.19,20 Not surprisingly, these methods are sometimes restricted by time-consuming processes and expensive equipment, especially for unavailable for real-time imaging.21 Compared with these traditional methods, fluorescent sensing and imaging processes have become indispensable in recent research because of their advantages of high sensitivity, priority selectivity, friendliness to living subjects, extraordinary convenience and their most important property of quick, safe and visible real-time tracing.10,22 Based on these advantages, numbers of fluorescent sensors based on small molecular organic dyes for the detection of polarity have been constructed with prominent merits of multiple fluorescence colors, high quantum yield (QY) and stability, and long wavelength excitation and emission profiles with large Stokes shifts, as well as easily investigated sensing mechanisms.14,23 However, complex synthesis procedures, poor water solubility, and most importantly high cytotoxicity and inferior biocompatibility constantly block them from efficient practical biological monitoring and imaging applications.24,25
By contrast, a fluorescent sensor made from nanoparticles has excellent biological affinity and unique photoelectric characteristics,26–29 especially for those which are built up by choosing carbon as the basic framework of nanometer quantum dots, not only endowing them with diversified structural variability and abundant modifiability, but also enjoying the advantages of abundant and affordable precursors, green and convenient synthesis procedures as well as exceptional characteristics, such as excellent water solubility, negligible toxicity, and terrific biocompatibility.30–33 These advantages make carbon quantum dots particularly suitable for the real-time detection and imaging of biological activity markers in multitudinous biological events, including polarity response.34–37
Among attractive carbon nanomaterials, fluorescent carbon dots (CDs) of sizes less than 10 nm are widely used as promising fluorescent sensors in biological imaging and as photodynamic therapy tools in consideration of their unique optical, chemical, and biological performances mentioned above as carbon-based nanoparticles.38–42 However, despite these attractive properties, most reported CDs generally emit blue or green fluorescence with low fluorescence quantum yield and stability, which not only suffer from strong auto-fluorescence and background interference in biological systems, but also cause radiation damage to tissues and cells.40,43 As a consequence, the design and development of red/near-infrared (NIR) emissive CDs are interesting and attractive, and have also drawn tremendous attention because of certain advantages, including low levels of light scattering/absorption, long-wavelength emission, deep tissue penetration and negligible auto-fluorescence interference from the biological background.44–46 Considering these demonstrations, the presentation of red/NIR-emissive CDs with advanced fluorescent properties for the targeting and imaging of polarity in related processes and organs, such as mitochondria and lysosomes, would be highly constructive and desirable.47–49
In this context, we herein present interesting red-emissive CDs as effective fluorescent sensor for sensing polarity in solutions and living cells. The CDs were prepared from naphthol, citric acid, and methionine in which the main function of naphthol is to increase the π-conjugated system of CDs in the achievement of red emission while citric acid and methionine contribute primarily to the introduction of surface functional groups and doping of N, S into the carbon core to improve the fluorescence stability and quantum yield. With these contributions, the CDs exhibit bright red emission in aqueous solution with significantly superior fluorescence quantum yield, stability, photobleaching resistance, and biocompatibility. More excitingly, the CDs display specific polarity selectivity, in which the wavelength of the CDs is enhanced along with an increase in solvent polarity, thus enabling the application of the CDs as promising fluorescent sensor for detecting and visualizing polarity variation in mitochondria and lysosomes and therefore contributing to a better understanding of the polarity-correlative physiological and pathological processes.
2 Experimental
2.1 Synthesis of CDs
0.96 g of citric acid, 0.74 g of L-methionine and 0.8 g of 2,7-dihydroxynaphthalene were accurately weighed and poured into a mixture of 20 mL of DMF and 16 mL of deionized water and sonicated for 10 min until completely dissolved. Then the mixture was put it into a 40 mL polyethylene Teflon-lined autoclave and heated at 160 °C for 4 h. After natural cooling to room temperature, the solution was centrifuged at 10![[thin space (1/6-em)]](https://www.rsc.org/images/entities/char_2009.gif) 000 rpm for 1 min, and the supernatant was filtered through a 0.2 μm microporous filter membrane to obtain the filtrate. The filtrate was then extracted with a mixture of ethyl acetate and saturated salt water, and finally washed five times with deionized water. Then the solution was concentrated by spin evaporation and separated by column chromatography44,49,50 using an ethyl acetate and ethanol mixed solution (10:1, v/v) as the spreading agent (Rf value of 0.59), and the liquid product was dried by spin evaporation to obtain a solid powder with an orange-yellow colour.
000 rpm for 1 min, and the supernatant was filtered through a 0.2 μm microporous filter membrane to obtain the filtrate. The filtrate was then extracted with a mixture of ethyl acetate and saturated salt water, and finally washed five times with deionized water. Then the solution was concentrated by spin evaporation and separated by column chromatography44,49,50 using an ethyl acetate and ethanol mixed solution (10:1, v/v) as the spreading agent (Rf value of 0.59), and the liquid product was dried by spin evaporation to obtain a solid powder with an orange-yellow colour.
2.2 Fluorescence detection of polarity
To inspect the selectivity of CDs for the target, 1.00 mL of various ion solutions (10 mmol L−1) of Li+, Na+, K+, Ag+, Ca2+, Mg2+, Fe2+, Co2+, Ni2+, Cu2+, Zn2+, Mn2+, Cd2+, Hg2+, Pb2+, Fe3+, Cr3+, Al3+, Sn4+, PO43−, CO32−, OAc−, C2O42−, SO32−, Cys, GSH, Hcy, O2˙−, H2O2, ClO−, NO, ONOO−, H2S, adenosine monophosphate (AMP), adenosine diphosphate (ADP), and adenosine triphosphate (ATP) cysteine (Cys), glutathione (GSH), homocysteine (Hcy), ascorbic acid (AA), dopamine (DA), were separately added into 1.00 mL of CDs solution (1 mg L−1) and then diluted to 10 mL with distilled water. The obtained solutions were incubated at room temperature for 10 min. The fluorescence emission spectra of the solutions were recorded with a fluorescence spectrometer at an excitation wavelength of 490 nm and slit width of 5 nm.2.3 Biological sensing of polarity in living cells
3 Results and discussion
3.1 Synthesis and structural properties
The red-emission CDs are reasonably constructed from precursors of naphthol, citric acid, and methionine through facile one-step green treatment in a solvothermal synthetic process (Fig. 1) in which the red-emitting property is mainly contributed by inheriting the conjugated structure of naphthol while the doping with nitrogen and sulfur is mainly based on methionine, which also results in maintaining amino, hydroxyl, carboxyl, and methylthio on the surface of the CDs to enhance the fluorescence stability, emission wavelength and quantum yield.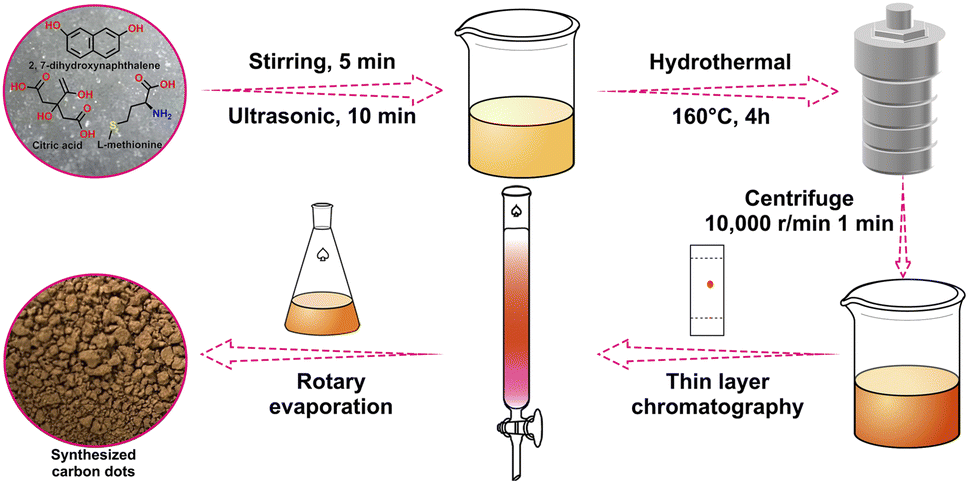 | ||
| Fig. 1 Synthesis of the CDs. | ||
The nanoscale morphology, microstructure, particle size and constituents of the CDs were comprehensively characterized to emphasize the structural features. Transmission electron microscopy (TEM) clearly verified the morphology of the CDs, depicting the excellent dispersibility and spherical structures in the uniform nanoparticle distribution (Fig. 2a and c) with the diameter ranging from 1.29 to 3.05 nm and an average particle size of about 2.10 nm (Fig. 2b). High-resolution TEM (HRTEM) shows that the CDs possess identically good crystalline structures and a well-resolved discernible lattice fringe with an inter-planar spacing of 0.21 nm (Fig. 2d), which is in good correspondence with the (100) crystal facet lattice of graphitic carbon, indicating the widespread π-conjugated domain in the framework of the CDs.51 The crystallinity and graphitic structure of the CDs are also supported by the X-ray diffraction (XRD) pattern, in which the diffraction peaks at 22.6° (2θ) and 27.5° (2θ) are consistent with the typical characteristic diffraction of the (002) plane of graphite-based carbon while the peak appearing at 10.3° (2θ) most likely belongs to the (001) crystal plane of graphite oxide,52 thus confirming the extensive existence of the highly conjugated sp2-domain in the CDs (Fig. 2e). Moreover, another demonstration of the large sp2 hybrid π-conjugated system comes from the 1H NMR spectrum in which the protons of the aromatic ring exist in large numbers with strong peaks in the range of 6.80–7.80 ppm (Fig. 2i). In addition, for more powerful evidence of the intrinsic state of the carbon core, Raman identification was performed. In the Raman spectrum, the disordered polyaromatic sp3 structure (D band) and sp2-bonded graphitic status carbon (G band) are observed at 1386 cm−1 and 1589 cm−1, respectively. The integral area ratio of the D band to the G band (ID/IG) is calculated to be 0.17 (Fig. 2f), indicating the distinct high graphitic degree of the sp2 domain carbonaceous cores of the CDs, which then guarantees the obvious red fluorescence emission. The thermogravimetric analysis (TG) and derivative thermogravimetric analysis (DTG) demonstrated a representative one-step decomposition process (Fig. 2h). The first component loss below 250 °C was most likely attributable to the loss of crystal water. The second degradation at 250–310 °C could be ascribed to the decomposition of the functional groups (amide, hydroxy, carboxyl, methylthio etc.) on the surface of the CDs. The last degradation from 310 to 700 °C was assigned to species that are strongly linked to the CDs via covalent bonds inside the carbon cores.
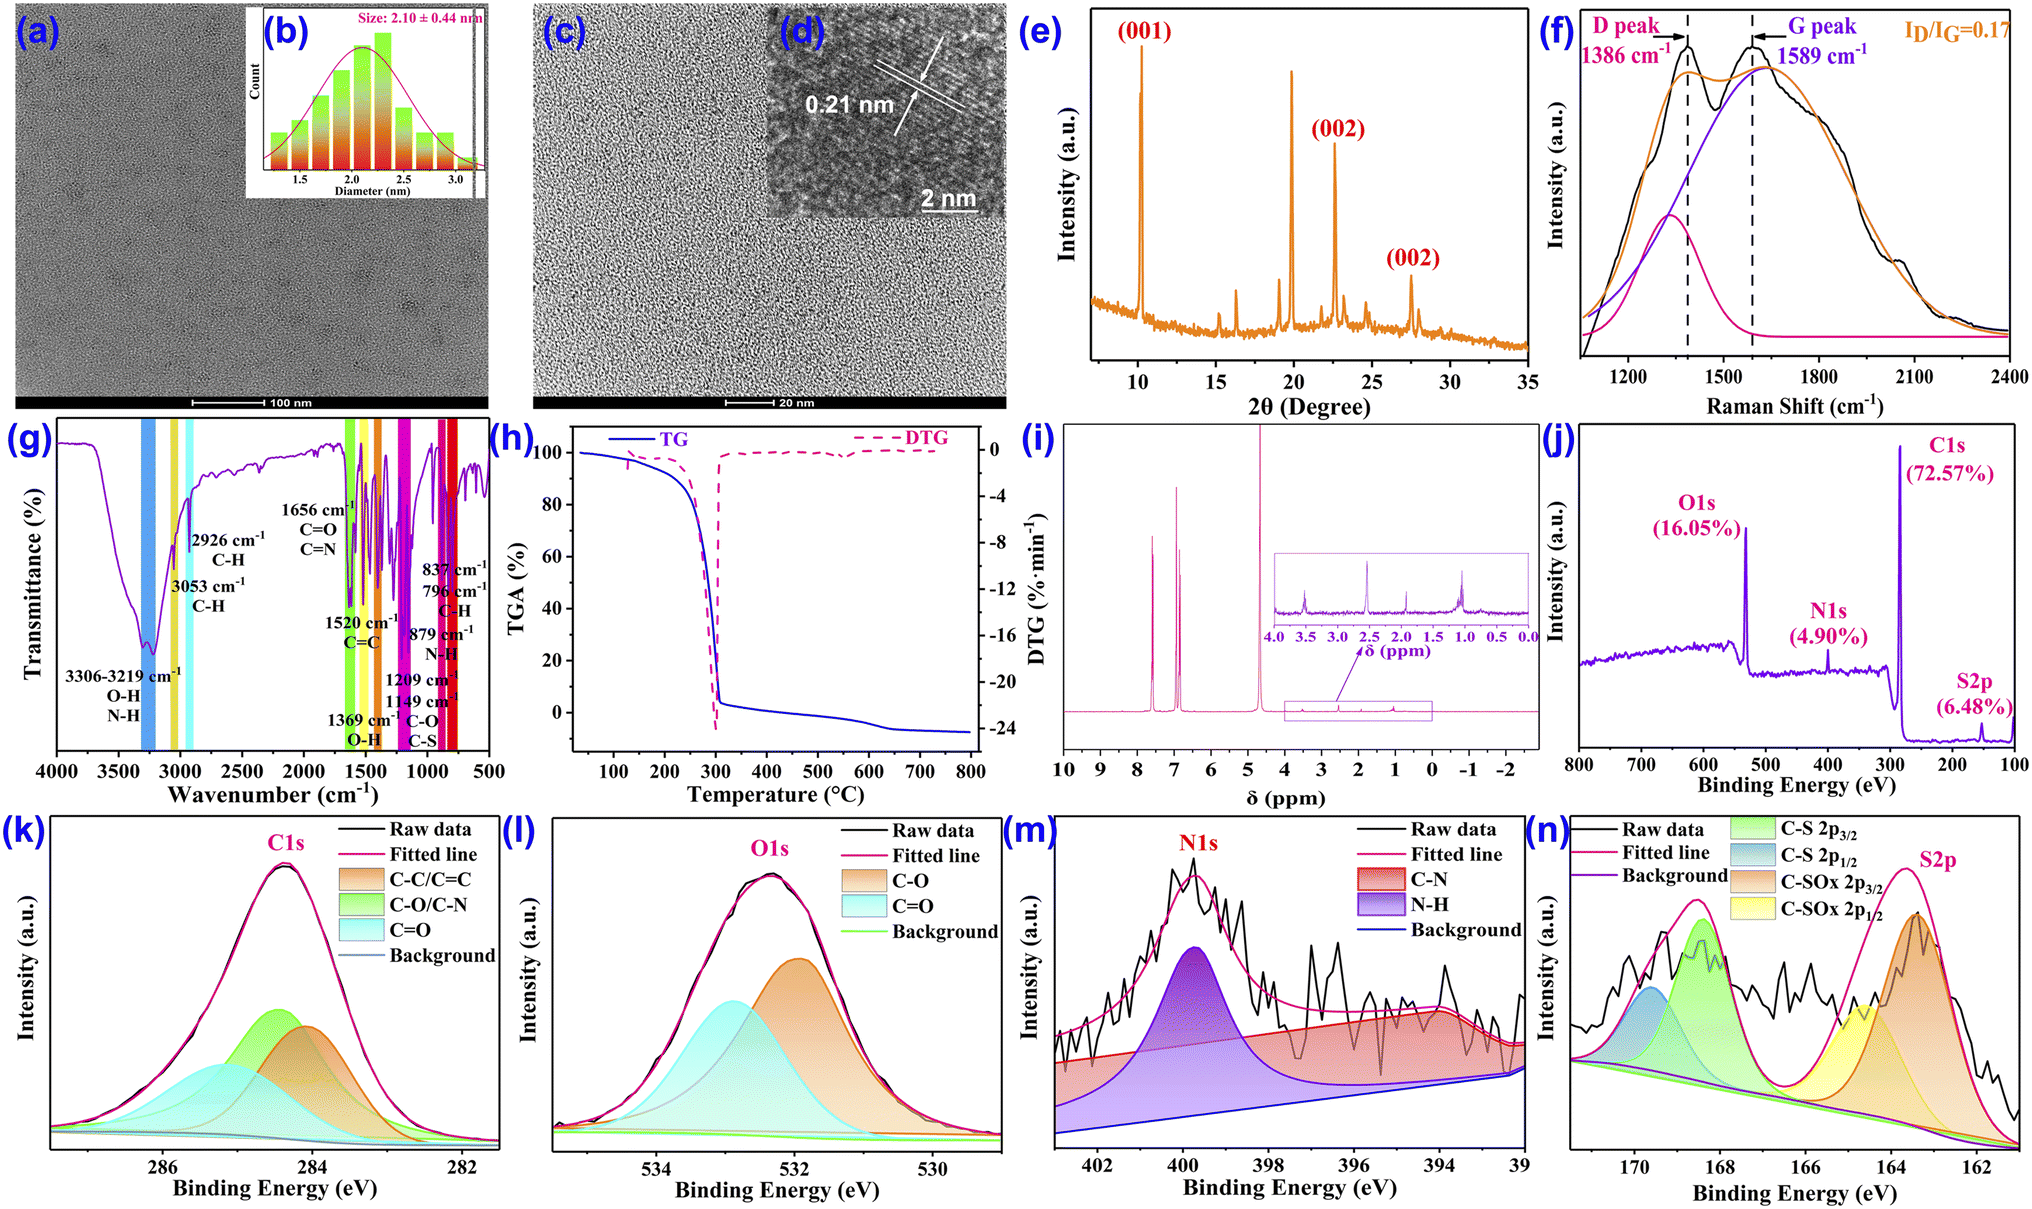 | ||
| Fig. 2 Morphological and structural characterization of the CDs. (a) TEM image at 100 nm. (b) Size distribution. (c) TEM image at 20 nm. (d) High-resolution TEM image. (e) XRD spectrum. (f) Raman spectrum. (g) FT-IR spectrum. (h) TG and DTG spectra. (i) 1H NMR of the CDs. (j) XPS full spectrum. (k) XPS C 1s spectrum. (l) XPS O 1s spectrum. (m) XPS N 1s spectrum. (n) XPS S 2p spectrum. | ||
To gain an insight into the composition and functional groups on the surface of the CDs,53,54 we first conducted zeta-potential analysis. The zeta-potential of the CDs was detected to be −5.46 mV (Fig. S15†), demonstrating strong electronic-rich properties, which can be primarily attributed to the existence of massive negatively charged groups, such as –OH, –NH2, –COOH, and –SCH3 on the CDs. Interestingly, chemical shifts of –SCH3 were noted in the 1H NMR spectrum at 3.53, 2.54, 1.93, and 1.09 ppm (Fig. 2i), significantly suggesting the successful functionalization of –SCH3 onto the CDs. To ascertain the presence of the above functional groups, the Fourier transform infrared (FT-IR) spectrum was then constructed and analyzed (Fig. 2g). First of all, two strong and broad peaks are found around 3306 cm−1 and 3219 cm−1, which generally stand for the stretching vibrations of O–H and N–H. The contained O–H and N–H bonds are also confirmed by the peaks at 1369 cm−1 and 879 cm−1, which are assigned to the in-plane deformation vibration of O–H and the out-of-plane bending vibration of N–H. In combination with the prominent peak at 1656 cm−1, which is attributed to the stretching vibrations of C![[double bond, length as m-dash]](https://www.rsc.org/images/entities/char_e001.gif) O and CN bonds, the possession of –COOH groups can be concluded. The top points at 3053 cm−1 and 1520 cm−1 are the characteristic absorption broad band aromatic C–H and CC bonds, respectively, thus highlighting the sp2-hybridized carbon structure in the CDs. Besides, the peaks at 837 cm−1 and 769 cm−1, which correspond to the wagging vibration of the C–H in alkene, provided other evidence for the existence of CC bonds inside the CDs. The top points appearing at 2946 cm−1 can be ascribed to the representative stretching vibrations of the alkyl C–H bond, which may be donated by the –SCH3 group. In addition, the typical stretching vibration of the C–O–C moiety is centered at 1209 cm−1 while the characteristic stretching vibration absorption band of C–S–C is recorded at 1149 cm−1, which not only denotes the successful coating with –SCH3 but also represents the successfully doping of sulfur into the CDs.
O and CN bonds, the possession of –COOH groups can be concluded. The top points at 3053 cm−1 and 1520 cm−1 are the characteristic absorption broad band aromatic C–H and CC bonds, respectively, thus highlighting the sp2-hybridized carbon structure in the CDs. Besides, the peaks at 837 cm−1 and 769 cm−1, which correspond to the wagging vibration of the C–H in alkene, provided other evidence for the existence of CC bonds inside the CDs. The top points appearing at 2946 cm−1 can be ascribed to the representative stretching vibrations of the alkyl C–H bond, which may be donated by the –SCH3 group. In addition, the typical stretching vibration of the C–O–C moiety is centered at 1209 cm−1 while the characteristic stretching vibration absorption band of C–S–C is recorded at 1149 cm−1, which not only denotes the successful coating with –SCH3 but also represents the successfully doping of sulfur into the CDs.
For further quantification of elemental composition, chemical bonds and surface functionality, X-ray photoelectron spectroscopy (XPS) was performed. The full XPS spectrum depicts that the CDs are constituted by four abundant elements of C, N, O, and S, since four distinctive binding energy peaks are observed, located at 284.1, 400.0, 532.1, and 164.0 eV, which are attributed to C 1s, N 1s, O 1s, and S 2p spin orbitals, respectively, with elemental composition ratios for C, N, O, and S of 72.57%, 4.90%, 16.05%, and 6.48%, respectively, indicating the notable doping percentage of N and S (Fig. 2j). The forms of the four composing elements in the CDs were further investigated by acquiring and analyzing the high-resolution XPS spectra of each element. In the high-resolution spectra, the C 1s spectrum (Fig. 2k) confirms the presence of C–C/CC, C–N/C–O, and CO/CN, corresponding to the distinctive peaks fitted at 284.1 eV, 284.5 eV, and 285.1 eV, respectively. The high-resolution XPS spectra of N 1s (Fig. 2m) can be divided into two peaks at 400.0 eV and 393.9 eV, exhibiting the existence of two main N-containing bonds of N–H and C–N and suggesting the location of N in the manner of an amino group. Furthermore, the O 1s curve (Fig. 2l) can also be fitted into two binding energy peaks established at 532.9 eV and 531.9 eV and certified as CO and C–O bonds, which is in good agreement with both the C 1s spectrum and FT-IR absorption. Moreover, the S 2p spectrum (Fig. 2n) can be deconvoluted into four component peaks at 163.4 eV, 164.6 eV, 168.4 eV, and 169.6 eV, reflecting the processes of C–S and C–SOx, respectively. The XPS results are in significant agreement with other forms of structural identification, which comprehensively revealed that the CDs are composed of aromatic structures and decorated with abundant hydrophilic groups, including –OH, –NH2, –COOH, and –SCH3, which on the one hand provides the basis for the red fluorescence emission and on the other hand enables good water solubility and biocompatibility, therefore endowing the CDs with the ability to target specific objects, such as mitochondria and lysosomes.
3.2 Optical properties
The ultraviolet-visible (UV-vis) absorption spectra and fluorescence spectra in combination with lifetime decay were employed to thoroughly explore the optical properties of the CDs. As exhibited in Fig. 3a, the CDs demonstrate two distinct absorption peaks in the UV-visible region at around 268 nm and 556 nm, which are assigned as the n–π* transition of the CO and CN bonds from the surface-attached functional groups as well as the π–π* transition assigned to the conjugated sp2 hybrid of the aromatic CC bond from the carbon core. In addition, the absorption intensity at 556 nm is much stronger than that at 268 nm, indicating the presence of a large sp2 domain inside the CDs. Based on the absorption behaviour, the CDs usually display a red colour in aqueous solvent under natural light. The excitation performance was investigated next. The spectrum suggests an apparent wide excitation region from 250 nm to 550 nm, in which the maximum excitation wavelength is located around 490 nm (Fig. 3b). When excited by a wavelength varying from 350 nm to 550 nm, the maximum fluorescence emission wavelength displays a faint redshift from 632 to 640 nm (Fig. 3b) in which the optimal excitation wavelength of 490 nm enjoys the strongest emission intensity and wavelength, since no redshift is observed when the excitation wavelength exceeds 490 nm. Under excitation of 490 nm, the intense fluorescence emission appears around 640 nm with a bright red colour and high-intensity fluorescence. Moreover, time-resolved fluorescence spectroscopy manifests the average fluorescence lifetime of the CDs, for which the fluorescence decay curve was optimally fitted to a biexponential function with a calculated result of 4.97 ns in aqueous solution (Fig. 3c). Furthermore, by taking rhodamine 6G as a reference, the fluorescence QY of the CDs was determined following the published procedure and calculated as 27.56%, which is mainly attributed to the oxygen-rich groups on the surface and the successful intercalation of nitrogen and sulfur into the graphitic core in forming a new surface state to serve as an emission trap and resulting in the promotion of high quantum yield. In addition, the QY of the CDs is obviously better than most of those in the previously reported literature and is high enough to ensure fluorescence imaging.
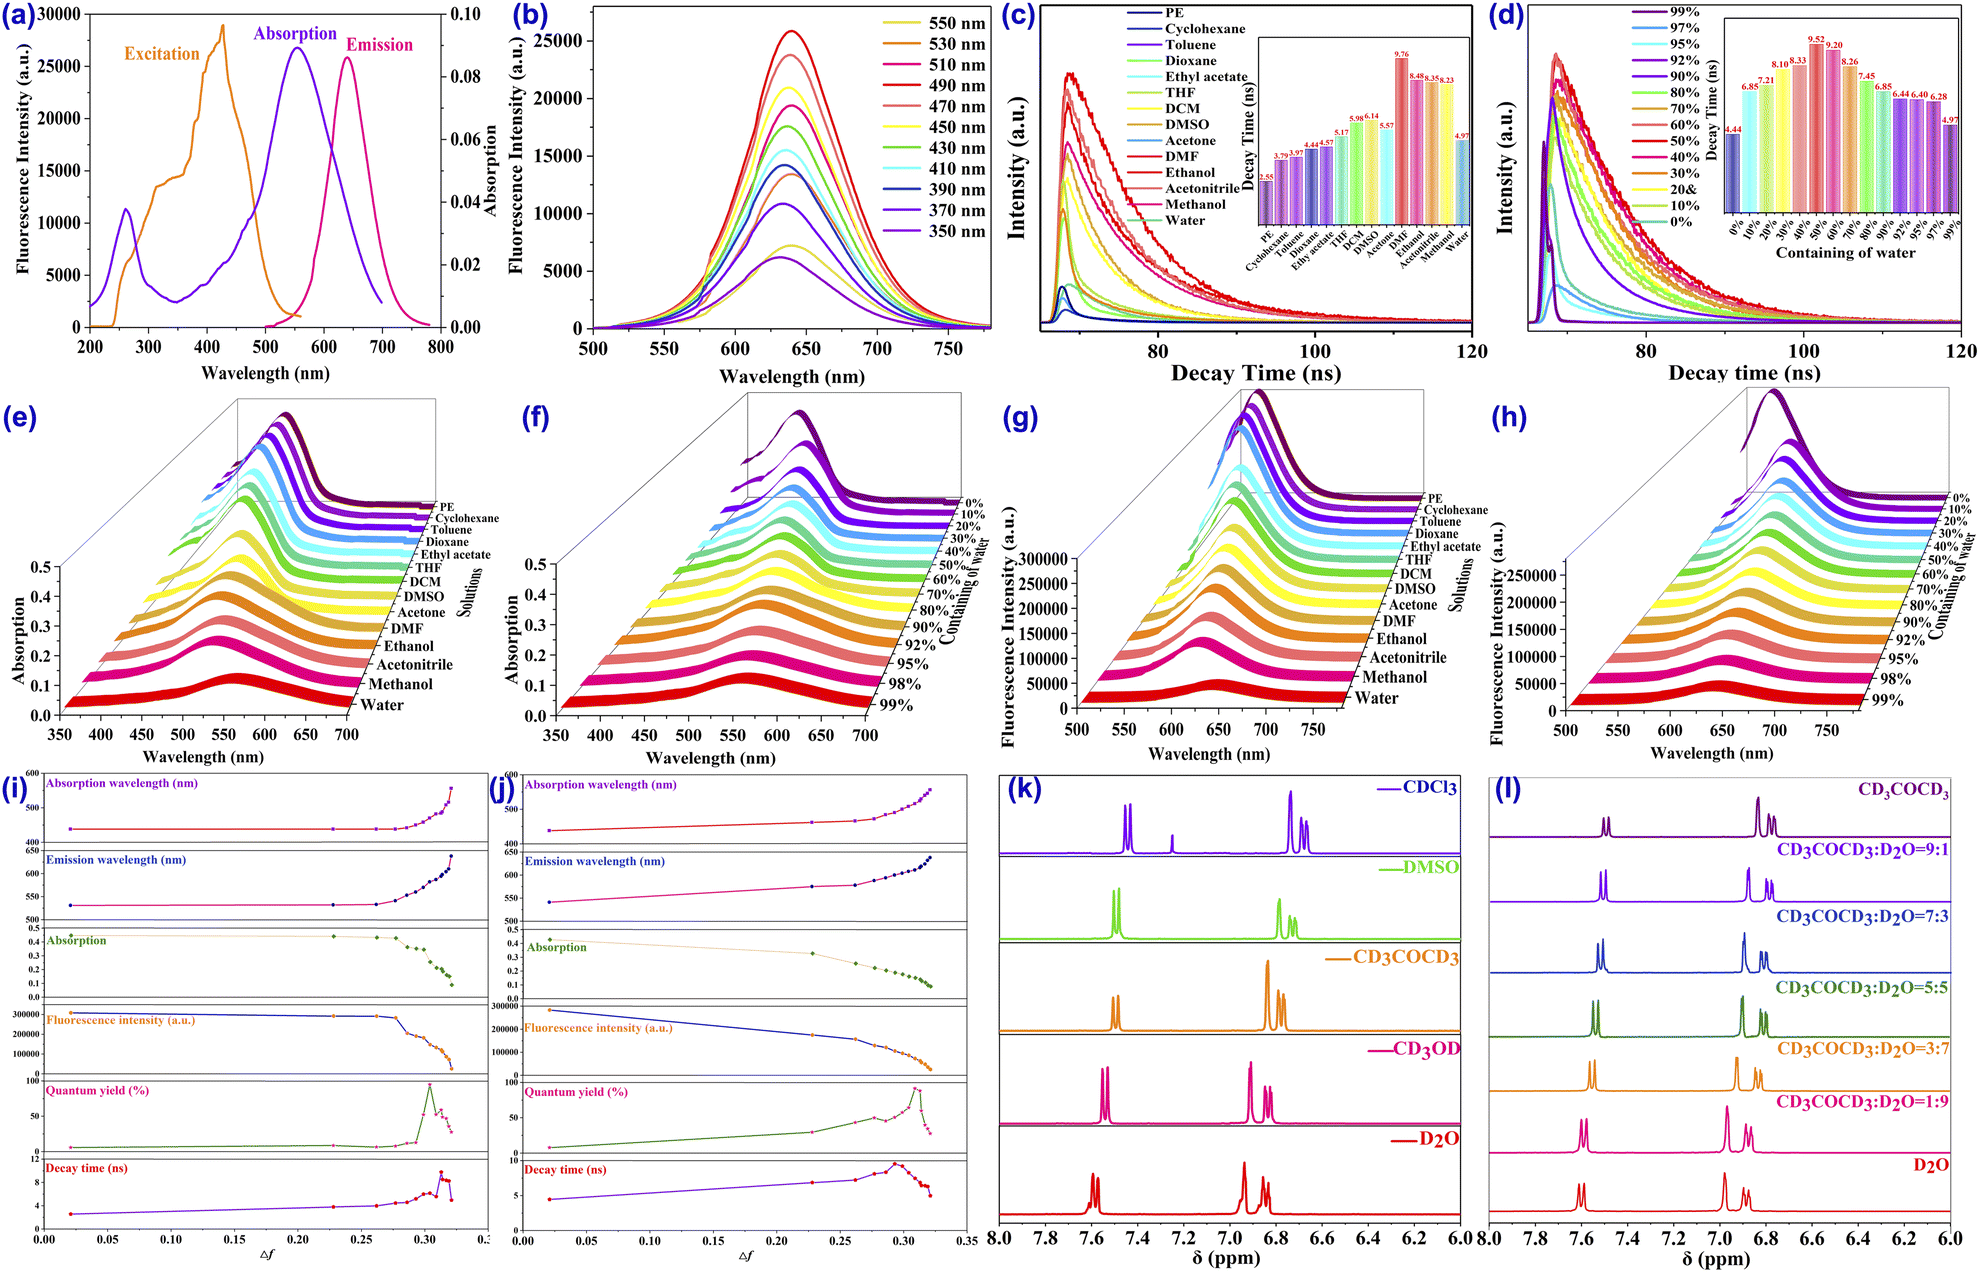 | ||
| Fig. 3 Photophysical characterization and sensing properties of the CDs. (a) UV-vis, and fluorescence excitation and emission spectra. (b) Fluorescence emission spectra subjected to varying excitation wavelengths from 350 to 550 nm. (c) Fluorescence decay curve of the CDs in different solvents. (d) Fluorescence decay curve of the CDs in different ratios of 1,4-dioxane/H2O mixed solvents. (e) Absorption spectra of the CDs in various solvents. (f) Absorption spectra of the CDs in different ratios of 1,4-dioxane/H2O mixed solvents. (g) Fluorescence spectra of the CDs in various solvents, λex = 490 nm. (h) Fluorescence spectra of the CDs in different ratios of 1,4-dioxane/H2O mixed solvents, λex = 490 nm. (i) Absorption and fluorescence wavelengths, intensities, decay times and QYs of the CDs in various solvents. (j) Absorption and fluorescence wavelength, intensities, decay times and QYs of the CDs in different ratios of 1,4-dioxane/H2O mixed solvents. (k) 1H NMR spectra of the CDs in various solvents. (l) 1H NMR spectra of the CDs in different ratios of (CD3)2CO/D2O mixed solvents. | ||
In the actual operation of fluorescence sensing and imaging, photostability is another advantageous characteristic and the stability of these CDs is particularly fantastic. According to the fluorescence spectra, neither the emission wavelength nor the fluorescence intensity displayed any changes when the solution of the CDs was left in the air under room conditions for months (Fig. S1†). Interestingly, when the solution was exposed to prolonged direct and continuous irradiation by UV light at 365 nm (Fig. S3†) and a xenon lamp (Fig. S4†) for 120 min, inappreciable changes were noticed in the strength of fluorescence intensity. The remarkable resistance to photobleaching was also supported by the brilliant stability, showing negligible fluorescence increase or quenching in a strongly ionic saline solution of 1.0 mol L−1 (Fig. S2†) and possessed good thermal stability in different temperatures of −20 to 80 °C (Fig. S5 and S6†). Surprisingly, when a 1.0 mmol L−1 concentration of a diverse range of heavy and transition metal ions, anions, ROS, RNS, thiols and some other active small molecules, including Li+, Na+, K+, Ag+, Ca2+, Mg2+, Fe2+, Co2+, Ni2+, Cu2+, Zn2+, Mn2+, Cd2+, Hg2+, Pb2+, Fe3+, Cr3+, Al3+, Sn4+, PO43−, CO32−, OAc−, C2O42−, SO32−, Cys, GSH, Hcy, O2˙−, H2O2, ClO−, NO, ONOO−, H2S, AMP, ADP, ATP, DA, and AA, were added into the solution with 1 mg L−1 of the CDs, the fluorescence emission properties of the CDs still remained close to the original without any significant effects which may have led to quenching or an increase in intensity (Fig. S7 and S8†). Importantly, the fluorescence emission of the obtained CDs is also primarily stable over a wide pH range since the recorded intensity under different pH values remains relatively stable without obvious changes (Fig. S16†), suggesting that the physiologically relevant intracellular pH will not have an apparent influence on the fluorescence emission of the CDs. The above results confirmed the comparatively excellent photostability of the CDs, tolerant of multiple complexities, including ultrahigh ionic strength, continuous excitation and storage time, common competing metal ions and small molecular as well as pH conditions, which facilitate successful comprehensive applications for real-time, on-site, quick, and long-duration labeling, sensing, and imaging of specific targets in complicated environmental and biological research.
3.3 Polarity sensing
More interestingly, beyond the excitation-dependent fluorescence behaviour, significant emission intensity changes and dramatic wavelength shifts were observed in different solvents with diverse polarities, suggesting that the CDs were consistent with the polarity-sensitive principle and could serve as a potential sensor for polarity detection, which prompted us to characterize the polarity-dependent photoproperties of the CDs through UV-vis absorption and fluorescence spectra. First of all, the absorption and fluorescence in multitudinous solvents were investigated. As depicted schematically in Fig. 3e, the absorption intensity was reduced along with the enlargement in solvent polarity, while the wavelength of the CDs was apparently increased accompanied by the change in solution colour from yellow to red (Fig. 4b). Compared to absorption, the changes in fluorescence were more obvious. With the enhancement in solvent polarity, the fluorescence intensity diminished about 20-fold (Fig. 3g) whereas the emission wavelength shifted significantly by 107 nm (varying from 533 to 640 nm) in which the colour of the fluorescence changed from blue and green to red (Fig. 4a). By contrast, both the fluorescence QYs (Fig. 3i) and the decays (Fig. 3c) went through a rising and falling process in which the highest QY occurred in DMSO solvent while the longest decay was observed in DMF solution. These results may be attributed to an increase in the strength of the hydrogen bonding in highly polar protonic solvents that leads to stronger internal conversion and vibrational relaxation, resulting in fewer photons transitioning back to the ground state than in the original, thus decreasing the fluorescence QYs and decays in these solvents.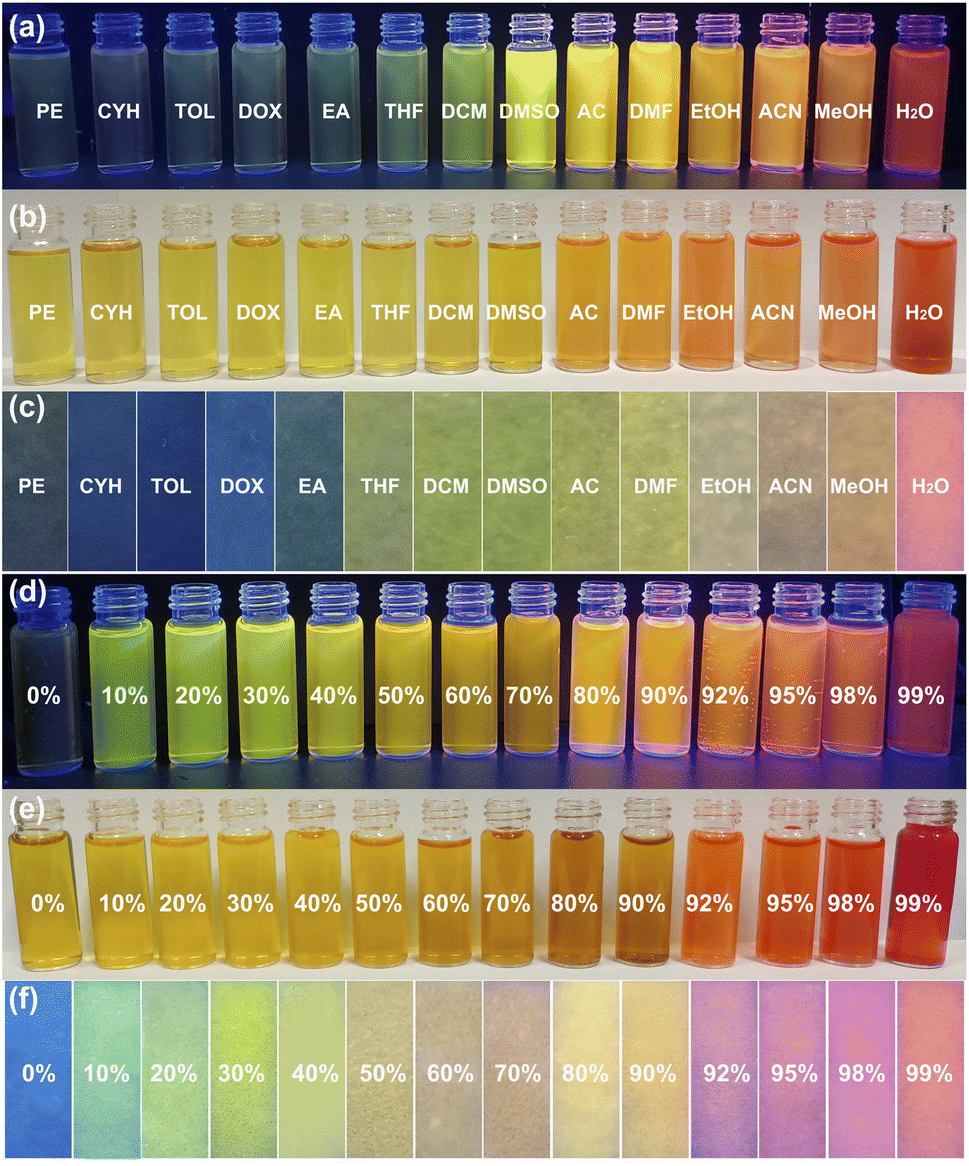 | ||
| Fig. 4 (a) Photographs of the CDs in different solvents under excitation by UV light at 365 nm. (b) Photographs of the CDs in different solvents under daylight. (c) CDs-based filter paper sensor for polarity in different solvents. (d) Photographs of the CDs in different ratios of 1,4-dioxane/H2O mixed solvents under excitation by UV light at 365 nm. (e) Photographs of the CDs in different ratios of 1,4-dioxane/H2O mixed solvents under daylight. (f) CDs-based filter paper sensor for different polarity ratios of 1,4-dioxane/H2O mixed solvents. | ||
In order to effectively evaluate the effect of polarity, the Lippert–Mataga polarity parameter Δf11,13,37,55 was employed to estimate the polarity level of the solution. Solvents with different polarities were prepared in the 1,4-dioxane/H2O mixed system by adjusting the proportion of H2O from 0% to 99% to represent the increase in polarity. In the low-polarity pure solution of anhydrous 1,4-dioxane, the CDs only emit blue fluorescence (Fig. 4d) and a yellow colour under daylight (Fig. 4e) with the fluorescence and absorption peaks located around 541 nm and 438 nm, respectively. When the volume fraction of water increased from 0% to 99%, which means the polarity (Δf) of the 1,4-dioxane/H2O mixed solution was increased from 0.021 (0%) to 0.32 (99%), the maximum emission wavelength redshifted from 541 nm to 640 nm in fluorescence and 438 nm to 556 nm in absorption (Fig. 3f) accompanied by a gradual decrease in the fluorescence and absorption intensity of approximately 21-fold (Fig. 3h) in which the polarity-sensing process can be completed quickly within 5 s (Fig. S17 and S18†). Favorable linear relationships were noted between the emission (Fig. S11†) and absorption (Fig. S13†) intensities with solvent polarizability within a wide range from 0.262 (20% water) to 0.32 (99% water) with a satisfactory correlation coefficient (R2 > 0.95). More excitingly, good linear correlations were also obtained between the solvent polarity and the redshift of the emission (Fig. S12†) and absorption (Fig. S14†) wavelengths with good results spanning a broad range of polarities.
Beyond the specificity of the CDs toward polarity in the solution state, the CDs can also manifest an excellent sensing property in the solid state as a paper sensor. As expected, the air-dried CD soaked paper strips show typical red fluorescence. When the paper strips were put into various solutions with different polarities, distinct changes in fluorescence were observed under the irradiation of a UV lamp at 365 nm (Fig. 4c). Meanwhile, conspicuous fluorescence transformations were also observed when the CD-based paper strips were immersed into solutions of various concentrations containing water from 0% to 99% (Fig. 4f), suggesting the simply fabricated paper strips can be applied as convenient and effective paper sensors for quick monitoring of polarity variation in ordinary environments. Compared with some recently reported sensors for polarity sensing,40,43 the favourable photophysical properties, satisfactory stability toward metal ions, bioactive molecules and pH, as well as the high sensitivity of the CDs toward micropolarity changes and obvious colour changes strongly suggested they could be a promising sensor for potentially accurately measuring the polarity changes in complex environmental and biological applications.
3.4 Sensing mechanism of the CDs
In acquainting ourselves with the polarity-sensing mechanism,37,56,57 we first conducted 1H NMR spectra in different solutions. As illustrated in Fig. 3k, with the increasing polarity of the solvent, the hydrogen peaks of the CDs in the aromatic region gradually move to lower fields with enhancement in the chemical shift. Similar results can also be found in different concentrations of acetone–water mixed solution (Fig. 3l), which may correspond to the rising electron cloud density inside the CDs. To support our speculation, the zeta potentials of the CDs in solution with different polarities (Fig. S15†) were determined and the results suggested that the zeta potentials decreased along with the addition of water, providing powerful evidence for the increasing electron cloud density in solvents with high polarity, which is beneficial to emission with long wavelength.To better understand the mechanism, several possible structures of the CDs were reasonably proposed and theoretically optimized at density functional theory level with the B3LYP functional based on reported work40,58–60 The most probable structure of the CDs (Fig. S19†) was proposed and validated with the best fits of the absorption and emission wavelengths based on the optimized structures of the ground S0 state and the first excited S1 state (Table S6†), in which the structure was also discovered to have the relatively lowest orbital gap between the highest occupied molecular orbital (HOMO) and the lowest unoccupied molecular orbital (LUMO). Analysis of spatial distributions and orbital energies also suggested that both the HOMO and LUMO distributions of the CDs were located essentially over the carbon core.
Based on the optimized structure, the HOMO and LUMO energy, self-consistent field (SCF) density, absorption and emission wavelength of the structures in different solvent models were subsequently calculated (Table S7–S9†). As the emission of the CDs is mainly attributed to the π–π* transition, the polarity of the solvent reduces the energy of the first excited state S1 more than that of the ground state S0, which as a result promoted the π–π* transition. As interpreted in Fig. 5, the energy gaps between the HOMO of the S0 state and LUMO orbitals of the S1 state gradually reduced with the increase in solvent polarity, which consequently facilitated fluorescence emission with longer wavelength. In addition, the SCF density results (Fig. S20†) also suggested bigger electron cloud density in polar solvents, which was particularly consistent with the NMR and zeta potential results. Based on this, the changes in fluorescence of the CDs in the solvents with different polarities could be supposed to be the following: the increase in polarity enhances the electron cloud density of the sp2 hybrid domains inside the carbon core and brings down the energy gap between the HOMO and LUMO orbitals which accelerates the π–π* electron transition from the S1 to the S0 state, resulting in easier fluorescence emission with a redshift of the wavelength as a consequence.
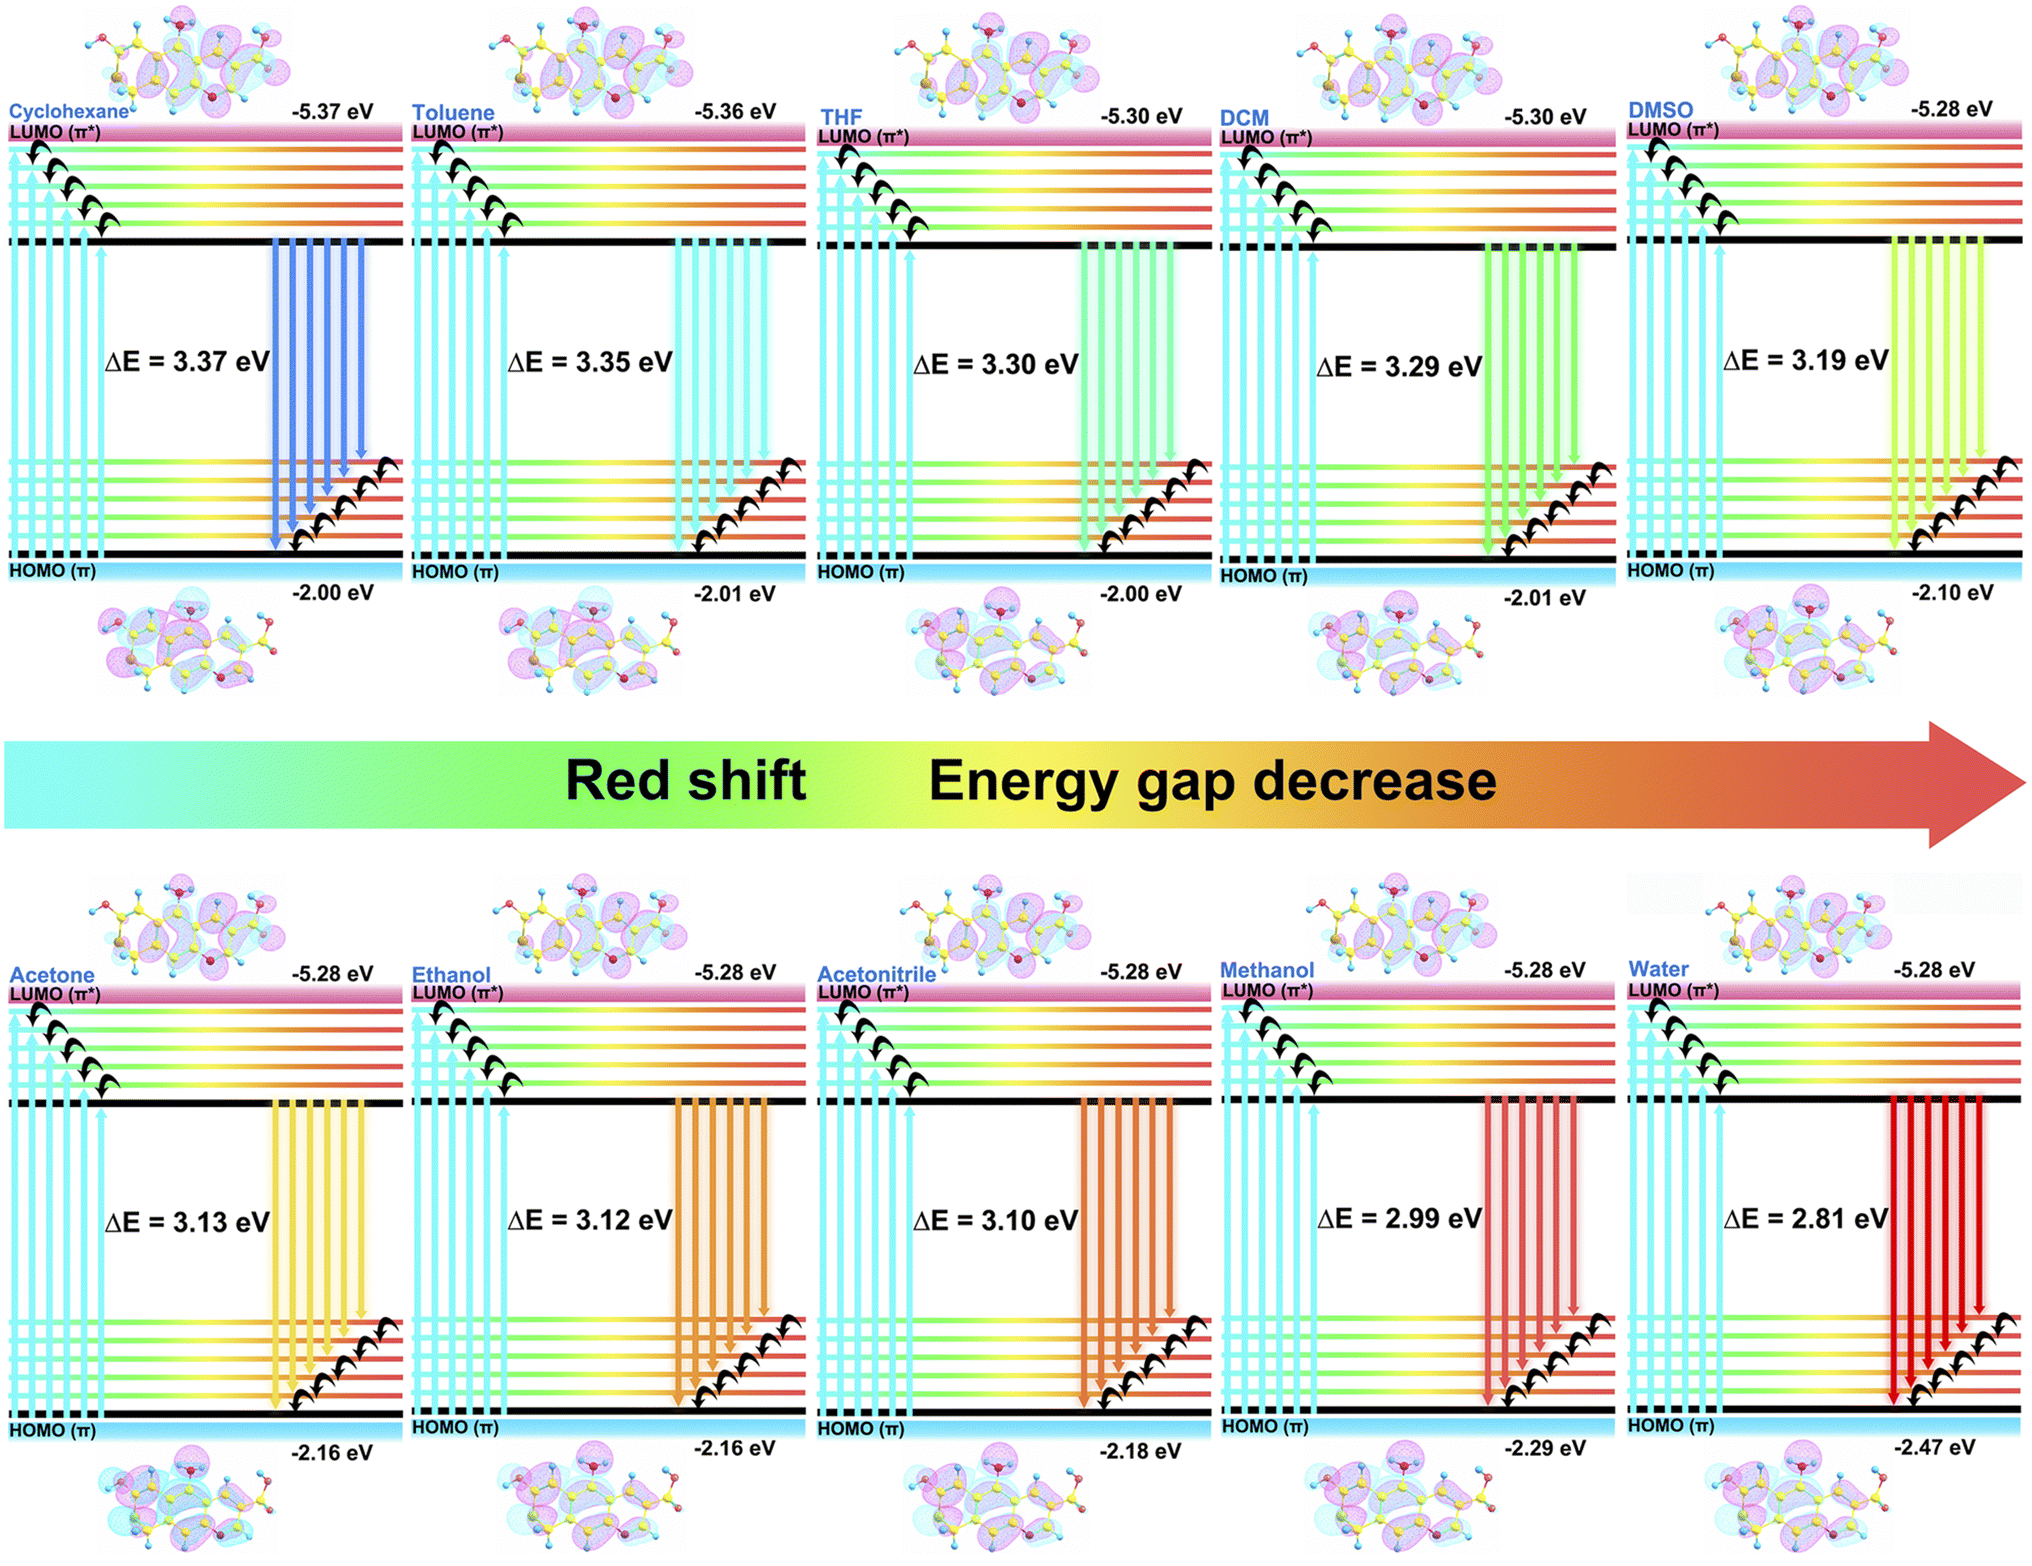 | ||
| Fig. 5 HOMO and LUMO energies and orbitals of the optimized structure of the CDs in solvents of different polarities. | ||
3.5 Polarity sensing in living cells
Thanks to the fantastic optical performances and polarity-specific property, the CDs appear to be suitable for sensing polarity and live-cell imaging. To ensure the possible application of the CDs in biological systems, we evaluated the cytotoxicity of the CDs through MTT experiments with HepG2 cells and A549 cells by incubation with CDs. As depicted in Fig. S21,† the survival rates of the HepG2 cells and A549 cells remained at a high level beyond 90% when the concentration of the CDs varied as 10, 20, 30, 40, 50, 60, 70, 80, 90, and 100 μg mL−1 for over 24 h, validating the relatively negligible cytotoxicity and commendable biocompatibility of the CDs. In addition, some basal conditions of the CDs in HepG2 cells were investigated further. As indicated in Fig S22,† faint fluorescence was observed in the HepG2 cells 5 min after incubation with the CDs, the fluorescence intensity of the cells reached the strongest intensity and then the fluorescence remained stable after 12 min, indicating the prominent penetration effect of the CDs in HepG2 cells. As another essential factor for cell fluorescence, the appropriate concentration in cell imaging was also examined. The fluorescence intensity of HepG2 cells increased with the concentration of the CDs and reached its strongest level at 40 μg mL−1 (Fig S23†), since the fluorescence intensity remained stable as the concentration increased thereafter. Therefore, 12 min and 40 μg mL−1 were chosen as the optimal preconditions for subsequent cell experiments.To further characterize the subcellular distribution of the CDs in cells, the commercially available mitochondrial localization dye (Mito-Tracker Green FM) nuclear localization dye (Hoechst 33342), and lysosomal localization dye (Lyso-Tracker Green) were used for co-localization experiments in HepG2 cells.61,62 As is evident from the confocal laser scanning microscopy (CLMS) images (Fig. 6), the red fluorescence of the CDs overlapped well with the red fluorescence of Mito-Tracker Green FM, in which the colocalization coefficient was found to be as high as 0.75. In addition, the Pearson's correlation coefficients with Lyso-Tracker Green was also noted to give a satisfactory result of 0.65. By contrast, the CDs overlapped little with Hoechst 33342 with a weak coefficient of just 0.25. The above results confirmed the favourable colocalization properties in both mitochondria and lysosomes, which can be efficiently distributed in cells for polarity tracking and imaging.
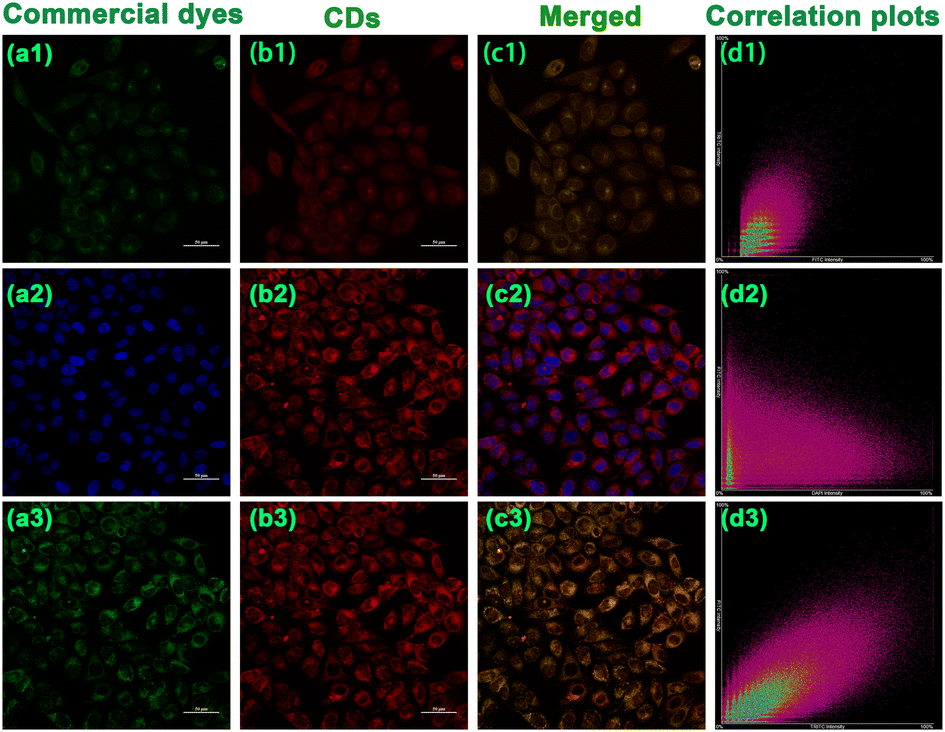 | ||
| Fig. 6 CLMS images of HepG2 cells incubated with 40 μg mL−1 CDs, 1 μL Lyso-Tracker Green, 1 μl Mito-Tracker Green FM, and two drops per mL of Hoechst 33342. (a1–a3) CLMS images of HepG2 cells incubated with commercial dyes. (b1–b3) CLMS images of HepG2cells incubated with 40 μg mL−1 of CDs (λex = 514 nm, λem = 540–650 nm). (b1–b3) CLMS images of HepG2 cells incubated with commercial dyes. (c1–c3) Merged images of the corresponding (a) and (b) images. (d1–d3) Correlation plots of various commercial organelle targeting probes and the CDs. Scale bar: 50 μm. | ||
In order to establish a clear understanding of the pathway of the CDs into the cells, we undertook a deep exploration of the internalization mechanism.63–65 Generally, the entrance of the CDs into the cell depends mainly on an ATP-intervening energy-dependent endocytic process, in which low temperature and NaN3 can affect the synthesis of ATP and reduce the endocytic pathway. Therefore, we examined the fluorescence intensity of HepG2 cells containing the CDs coincubated at 4 °C with NaN3 for 4 h. As shown in Fig. 3c, the fluorescence intensity of the 4 °C group almost disappeared compared to the control group (incubated at 37 °C), while the fluorescence intensity of the NaN3 group reduced by about 70% compared to the control group, providing powerful evidence for the energy-dependent internalization pathway of the CDs. Simultaneously, the specific endocytic pathways of the CDs that were involved in internalization was identified in the presence of chlorpromazine (CPZ), methyl β-cyclodextrin (Mβ-CD), amiloride (AMI) and genistein (Gen) blocking lectin-mediated endocytosis, lipid raft-mediated endocytosis, micropinocytosis, and caveolae-mediated endocytosis. HepG2 cells were preincubated with 10 μg mL−1 CPZ, 10 μg mL−1 Mβ-CD and 100 μg mL−1 Gen for 4 h, then incubated with the CDs at 40 μg mL−1 for 4 h and imaged. According to Fig S24,† the fluorescence intensity of the HepG2 cells preincubated with CPZ and Mβ-CD treatment decreased to about 40% and 35% compared with the control group, while the fluorescence intensity of HepG2 cells preincubated with Gen and AMI remained unchanged compared with that of the control group, indicating that endocytosis was inappreciably affected by these inhibitors. In conclusion, all these results showed that the endocytosis of the CDs is energy-dependent passive diffusion and is correlated with lectin-mediated endocytosis and lipid raft-mediated endocytosis.
As the cell polarity is an expression of intracellular metabolism and feedback mechanisms, the polarity correlates closely with intracellular physiological and pathological activities. Cell polarity fluctuates when normal intracellular homeostasis is disrupted. Therefore, monitoring changes in intracellular polarity is essential for a profound understanding of the fluctuations in pathological and physiological processes over cellular homeostasis and the functions that subcellular organelles perform in the process. DTT is conventionally used for inductive fluctuation in polarity in living cells.37,66,67 The CD-pretreated HepG2 cells were treated with 5 mmol L−1 DTT to induce changes in cell polarity and imaged with CLMS. As shown in Fig. 7, the fluorescence intensity of DTT-incubated HepG2 cells decreased significantly by 60% within 30 min and the cell shape changed from spindle-shaped to an unhealthy round shape. Furthermore, A549 cells and HeLa cells were further treated with DTT, and the cell fluorescence intensity decreased by 30% and 50% respectively. These results suggested the CDs can serve as promising fluorescent sensors for monitoring live-cell polarity in real time, thus promoting better understanding of polarity-related physiological and pathological processes.
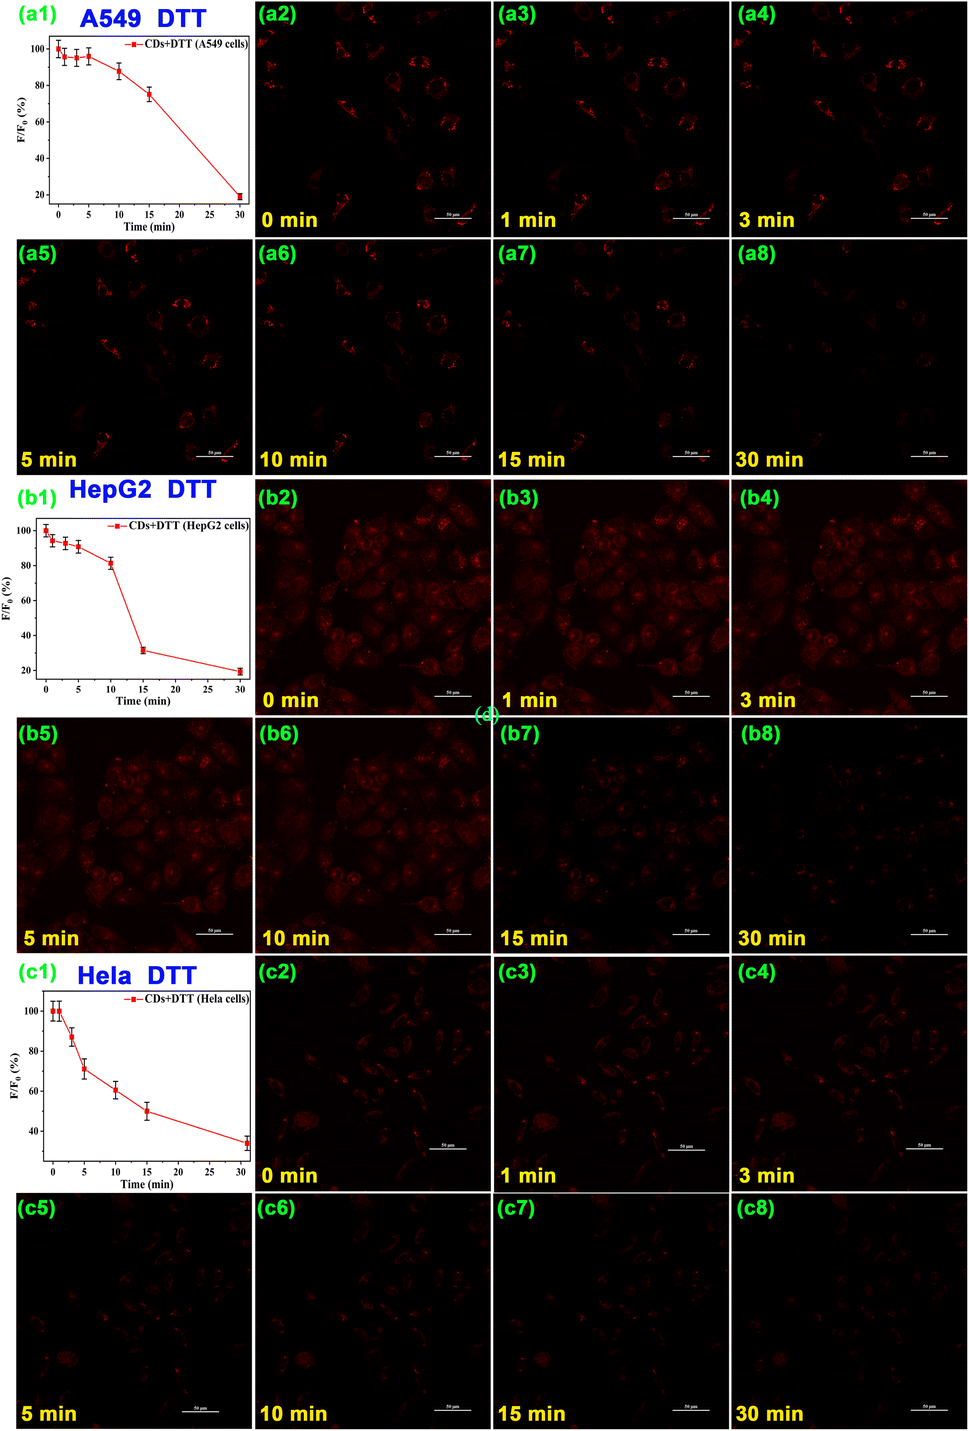 | ||
| Fig. 7 CLMS images of A549 cells (a2–a8), HepG2 cells (b2–b8) and HeLa cells (c2–c8) treated with 40 μg mL−1 CDs and then with 5 mmol L−1 DTT. Normalized fluorescence intensity of the DTT-treated group are shown in a1, b1 and c1 (λex = 514 nm, λem = 540–650 nm). Scale bar: 50 μm. | ||
4 Conclusions
To summarize, polarity-sensitive red-emissive CDs were reasonably designed and facilely fabricated from 2,7-dinaphthol, citric acid and methionine through a green, economic and facile solvothermal approach. Benefiting from the large sp2 hybrid conjugated system as well as the abundant surface functional groups and successful N and S doping, the CDs exhibit reasonable water solubility and brilliant red emission together with excellent fluorescence stability, wonderful quantum yield and advanced biocompatibility. The optical performances of the CDs were investigated to be transformable and highly dependent on solvent polarity, in which the emission and absorption wavelengths were obviously enhanced with an increase in solvent polarity due to the decrease in the energy gaps in solvents with different polarities. Moreover, the CDs possess particular dual-targeting ability both to mitochondria and lysosomes, which manifested great potential for employment as promising candidates in monitoring polarity changes in mitochondria and lysosomes without interference from background fluorescence inside the biological systems, consequently providing significant assistance for facilitating a better understanding of polarity-related physiological and pathological processes and developing new diagnostic tools for correlative diseases based on mitochondrial and lysosomal polarity.Author contributions
Zheng Yang: writing and editing; project management. Hui Li: investigation; methodology. Tiantian Xu: synthesis; characterization. Mengyao She: calculation; analysis. Jiao Chen: cell imaging. Xiaodan Jia: resources; analysis. Ping Liu: analysis; funding acquisition. Xiangrong Liu: visualization; funding acquisition. Jianli Li: supervision, funding acquisition.Conflicts of interest
There are no conflicts to declare.Acknowledgements
This work is supported by the National Natural Science Foundation of China (Nos. 22171223, 22179107, 22077099, U1903133), the Natural Science Basic Research Program of Shaanxi (No. 2022JQ-151, 2018JQ2061), and the Outstanding Youth Science Fund of Xi’an University of Science and Technology (No. 2018YQ3-14)Notes and references
- N. Panwar, A. M. Soehartono, K. K. Chan, S. W. Zeng, G. X. Xu, J. L. Qu, P. Coquet, K. T. Yong and X. Y. Chen, Chem. Rev., 2019, 119, 9559–9656 CrossRef CAS PubMed.
- X. C. Li, X. J. Xing, S. J. Zhao, S. H. Zhu, B. H. Wang, M. H. Lan and X. Z. Song, Chin. Chem. Lett., 2022, 33, 1632–1636 CrossRef CAS.
- C. F. Lai, Y. P. Zhao, X. Zou, Y. Liang and W. Y. Lin, Sens. Actuators, B, 2022, 369, 132267 CrossRef CAS.
- S. Wang, W. X. Ren, J. T. Hou, M. Won, J. An, X. Y. Chen, J. Shu and J. S. Kim, Chem. Soc. Rev., 2021, 50, 8887–8902 RSC.
- E. Shuang, Q. X. Mao, J. H. Wang and X. W. Chen, Nanoscale, 2020, 12, 6852–6860 RSC.
- P. Li, X. Guo, X. Bai, X. Wang, Q. Ding, W. Zhang, W. Zhang and B. Tang, Anal. Chem., 2019, 91, 3382–3388 CrossRef CAS PubMed.
- D. G. Drubin and W. J. Nelson, Cell, 1996, 84, 335–344 CrossRef CAS PubMed.
- L. Zhang, J. L. Wang, X. X. Ba, S. Y. Hua, P. Jiang, F. L. Jiang and Y. Liu, ACS Appl. Mater. Interfaces, 2021, 13, 7945–7954 CrossRef CAS PubMed.
- X. K. Chen, X. D. Zhang and F. G. Wu, Chin. Chem. Lett., 2021, 32, 3048–3052 CrossRef CAS.
- W. Wan, L. G. Zeng, W. H. Jin, X. X. Chen, D. Shen, Y. N. Huang, M. D. Wang, Y. L. Bai, H. C. Lyu, X. P. Dong, Z. M. Gao, L. Wang, X. J. Liu and Y. Liu, Angew. Chem., Int. Ed. Engl., 2021, 60, 25865–25871 CrossRef CAS PubMed.
- Y. Sun, H. Qin, X. Geng, R. Yang, L. Qu, A. N. Kani and Z. Li, ACS Appl. Mater. Interfaces, 2020, 12, 31738–31744 CrossRef CAS PubMed.
- W. J. Liu, Q. L. Qiao, J. Z. Zheng, J. Chen, W. Zhou, N. Xu, J. Li, L. Miao and Z. C. Xu, Biosens. Bioelectron., 2021, 176, 112886 CrossRef CAS PubMed.
- N. Jiang, J. Fan, F. Xu, X. Peng, H. Mu, J. Wang and X. Xiong, Angew. Chem., Int. Ed. Engl., 2015, 54, 2510–2514 CrossRef CAS PubMed.
- X. Y. Li, X. H. Li and H. M. Ma, Chem. Sci., 2020, 11, 1617–1622 RSC.
- Y. F. Huang, Y. B. Zhang, F. J. Huo, J. B. Chao and C. X. Yin, Chem. Eng. J., 2022, 433, 133750 CrossRef CAS.
- S. Guo, Y. Q. Sun, X. Geng, R. Yang, L. H. Xiao, L. B. Qu and Z. H. Li, J. Mater. Chem. B, 2020, 8, 736–742 RSC.
- P. Saftig and J. Klumperman, Nat. Rev. Mol. Cell Biol., 2009, 10, 623–635 CrossRef CAS PubMed.
- L. Huang, L. Zhu, W. T. Su, X. Liang, W. X. Li and W. Y. Lin, Anal. Chem., 2022, 94, 11643–11649 CrossRef CAS PubMed.
- T. Zhang, S. H. Li, A. R. Warden, B. Ghalandari, H. X. Li, X. Zhi, H. Y. Xie and X. T. Ding, Adv. Funct. Mater., 2020, 30, 1910739 CrossRef CAS.
- X. Pan, L. Fang, J. Liu, B. Senay Aras, W. Lin, S. Zheng, T. Zhang, J. Guo, U. Manor, J. Van Norman, W. Chen and Z. Yang, Nat. Commun., 2020, 11, 3914 CrossRef CAS PubMed.
- D. Devenport, D. Oristian, E. Heller and E. Fuchs, Nat. Cell Biol., 2017, 19, 143 CrossRef CAS PubMed.
- H. Li, T. T. Xu, Z. Zhang, J. Chen, M. Y. She, Y. L. Ji, B. Y. Zheng, Z. Yang, S. Y. Zhang and J. L. Li, Chem. Eng. J., 2023, 453, 139722 CrossRef CAS.
- J. Zhang, M. Y. She, L. Liu, M. D. Liu, Z. H. Wang, H. Liu, W. Sun, X. G. Liu, P. Liu, S. Y. Zhang and J. L. Li, Chin. Chem. Lett., 2021, 32, 3083–3086 CrossRef CAS.
- K. N. Wang, L. Y. Liu, D. Mao, S. D. Xu, C. P. Tan, Q. Cao, Z. W. Mao and B. Liu, Angew. Chem., Int. Ed. Engl., 2021, 60, 15095–15100 CrossRef CAS PubMed.
- H. B. Fang, L. T. Hu, Q. X. Chen, S. S. Geng, K. Q. Qiu, C. J. Wang, M. G. Hao, Z. Q. Tian, H. M. Chen, L. Liu, J. L. Guan, Y. C. Chen, L. Dong, Z. J. Guo, W. J. He and J. J. Diao, Biomaterials, 2023, 292, 121929 CrossRef CAS PubMed.
- M. Pirzada and Z. Altintas, Chem. Soc. Rev., 2022, 51, 5805–5841 RSC.
- O. S. Wolfbeis, Chem. Soc. Rev., 2015, 44, 4743–4768 RSC.
- L. Zhang, Y. F. Wang, M. Li, Q. Y. Gao and C. F. Chen, Chin. Chem. Lett., 2021, 32, 740–744 CrossRef CAS.
- W. He, Z. C. Zhang, Y. M. Luo, R. T. K. Kwok, Z. Zhao and B. Z. Tang, Biomaterials, 2022, 288, 121709 CrossRef CAS PubMed.
- Y. Huo, S. J. Xiu, L. Y. Meng and B. Quan, Chem. Eng. J., 2023, 451, 138572 CrossRef CAS.
- R. Y. Li, F. Y. Liang, X. Y. Hu, H. Y. Bian, C. Deng, F. Seidi, B. Y. Zhang, H. N. Xiao and Y. Q. Liu, Carbohydr. Polym., 2022, 298, 120073 CrossRef CAS PubMed.
- J. L. Bai, G. J. Yuan, X. Chen, L. Zhang, Y. Q. Zhu, X. Y. Wang and L. L. Ren, Adv. Sci., 2021, 9, 2104278 CrossRef PubMed.
- B. Y. Han, J. M. Jiang, Q. F. Yan, Z. Xin and Q. Yan, Chin. Chem. Lett., 2021, 32, 591–593 CrossRef CAS.
- X. C. Li, S. J. Zhao, B. L. Li, K. Yang, M. H. Lan and L. T. Zeng, Coord. Chem. Rev., 2021, 431, 213686 CrossRef CAS.
- B. Y. Wang, H. J. Cai, G. I. N. Waterhouse, X. L. Qu, B. Yang and S. Y. Lu, Small Sci., 2022, 2, 2200012 CrossRef CAS.
- J. Hu, Y. Sun, X. Geng, J. Wang, Y. Guo, L. Qu, K. Zhang and Z. Li, Light: Sci. Appl., 2022, 11, 185 CrossRef CAS PubMed.
- J. H. Liu, D. Y. Li, J. H. He, D. Yuan, R. S. Li, S. J. Zhen, Y. F. Li and C. Z. Huang, ACS Appl. Mater. Interfaces, 2020, 12, 4815–4820 CrossRef CAS PubMed.
- J. F. Ma, L. Z. Zhang, X. Chen, R. G. Su, Q. Shi, S. Q. Zhao, Q. X. and C. M. Xu, Chin. Chem. Lett., 2022, 32, 1532–1536 CrossRef.
- J. Liu, T. Y. Kong and H. M. Xiong, Adv. Mater., 2022, 34, 2200152 CrossRef CAS PubMed.
- S. Li, L. Li, H. Y. Tu, H. Zhang, D. S. Silvester, C. E. Banks, G. Q. Zou, H. S. Hou and X. B. Ji, Mater. Today, 2021, 51, 188–207 CrossRef CAS.
- Z. Yang, T. T. Xu, S. B. Zhang, H. Li, Y. L. Ji, X. D. Jia and J. L. Li, Nano Res., 2022 DOI:10.1007/s12274-022-5107-7.
- Q. Xu, H. Cai, W. Li, M. Wu, Y. Wu and X. Gong, J. Mater. Chem. A, 2022, 10, 14709–14731 RSC.
- S. Yoo, Y. Song and S. Hahn, Light: Sci. Appl., 2022, 11, 132 CrossRef CAS PubMed.
- Y. Q. Wang, X. C. Li, S. J. Zhao, B. H. Wang, X. Z. Song, J. F. Xiao and M. H. Lan, Coord. Chem. Rev., 2022, 470, 214703 CrossRef CAS.
- S. Y. Yang, Z. Q. Chen, P. Zhou, J. S. Xia, T. D. and C. Xu, Carbon, 2023, 202, 130–140 CrossRef CAS.
- Z. J. Zhu, Y. L. Zhai, Z. H. Li, P. Y. Zhu, S. Mao, C. Z. Zhu, D. Du, L. A. Belfiore, J. G. Tang and Y. H. Lin, Mater. Today, 2019, 30, 52–79 CrossRef CAS.
- X. W. Hua, Y. W. Bao, J. Zeng and F. G. Wu, ACS Appl. Mater. Interfaces, 2019, 11, 32647–32658 CrossRef CAS PubMed.
- G. Y. Zou, S. Chen, N. Z. Liu and Y. L. Yu, Chin. Chem. Lett., 2022, 33, 778–782 CrossRef CAS.
- X. Shi, H. Meng, Y. Sun, L. Qu, Y. Lin, Z. Li and D. Du, Small, 2019, 15, 1901507 CrossRef CAS PubMed.
- C. H. Liu, L. Zhou, L. J. Xie, Y. Zheng, H. Z. Man and Y. Xiao, Chin. Chem. Lett., 2022, 33, 2537–2540 CrossRef CAS.
- Z. Yang, T. T. Xu, X. Zhang, H. Li, X. D. Jia, S. S. Zhao, Z. W. Yang and X. R. Liu, Spectrochim. Acta, Part A, 2022, 271, 120941 CrossRef CAS PubMed.
- J. Zhang, S. S. Zhao, Z. Yang, Z. W. Yang, S. L. Yang and X. R. Liu, Int. J. Energy Res., 2021, 45, 9396–9407 CrossRef CAS.
- H. Y. Yang, Y. L. Liu, Z. Y. Guo, B. F. Lei, J. L. Zhuang, X. J. Zhang, Z. M. Liu and C. F. Hu, Nat. Commun., 2019, 10, 1789 CrossRef PubMed.
- X. F. Zhang, L. Wang, N. Li and Y. Xiao, Chin. Chem. Lett., 2021, 31, 2395–2399 CrossRef.
- J. Jiang, X. Tian, C. Xu, S. Wang, Y. Feng, M. Chen, H. Yu, M. Zhu and X. Meng, Chem. Commun., 2017, 53, 3645–3648 RSC.
- J. Yang, X. L. Jin, Z. Cheng, H. W. Zhou, L. N. Gao, D. L. Jiang, X. L. Jie, Y. T. Ma and W. X. Chen, ACS Sustainable Chem. Eng., 2021, 9, 13206–13214 CrossRef CAS.
- B. Y. Wang and S. Y. Lu, Matter, 2022, 5, 110–149 CrossRef CAS.
- J. Z. Guo, Y. S. Lu, A. Q. Xie, G. Li, Z. B. Liang, C. F. Wang, X. N. Yang and S. Chen, Adv. Funct. Mater., 2022, 32, 2110393 CrossRef CAS.
- Y. L. Xu, C. Wang, T. Jiang, G. X. Ran and Q. J. Song, J. Hazard. Mater., 2022, 427, 128092 CrossRef CAS PubMed.
- X. J. Li, M. D. Zheng, H. J. Wang, Y. Meng, D. Wang, L. L. Liu, Q. H. Zeng, X. W. Xu, D. Zhou and H. C. Sun, J. Colloid Interface Sci., 2022, 609, 54–64 CrossRef CAS PubMed.
- X. Hua, Y. Bao, Z. Chen and F. Wu, Nanoscale, 2017, 9, 10948–10960 RSC.
- L. Fan, X. D. Wang, J. Y. Ge, F. Li, X. Wang, J. J. Wang, S. M. Shuang and C. Dong, Chem. Commun., 2019, 55, 4703–4706 RSC.
- X. B. Zhou, K. Zhang, C. J. Yang, Y. T. Pei, L. F. Zhao, X. X. Kang, Z. H. Li, F. Y. Li, Y. L. Qin and L. Wu, Adv. Funct. Mater., 2022, 32, 2109929 CrossRef CAS.
- H. Y. Wang, X. Hua, H. Jia, P. Liu, N. Gu, Z. Chen and F. Wu, J. Mater. Chem. B, 2016, 4, 834–843 RSC.
- H. Zhang, J. Liu, B. Hu, L. Wang, Z. Yang, X. Han, J. Wang, W. Bai and W. Guo, Chem. Sci., 2018, 9, 3209–3214 RSC.
- S. Y. Wu, Y. Yan, H. R. Hou, Z. L. Huang, D. X. Li, X. F. Zhang and Y. Xiao, Anal. Chem., 2022, 94, 11238–11247 CrossRef CAS PubMed.
- Q. H. Li, J. X. Hong, S. M. Feng, S. Y. Gong and G. Q. Feng, Anal. Chem., 2022, 94, 11089–11095 CrossRef CAS PubMed.
Footnote |
| † Electronic supplementary information (ESI) available. See DOI: https://doi.org/10.1039/d2ta09462b |
| This journal is © The Royal Society of Chemistry 2023 |