Enhancing energy storage performance in Na0.5Bi0.5TiO3-based lead-free relaxor ferroelectric ceramics along a stepwise optimization route†
Wen
Wang
a,
Leiyang
Zhang
 a,
Yule
Yang
a,
Wenjing
Shi
a,
Yunyao
Huang
a,
D. O.
Alikin
b,
V. Ya.
Shur
b,
Zhihao
Lou
c,
Amei
Zhang
d,
Xiaoyong
Wei
a,
Yule
Yang
a,
Wenjing
Shi
a,
Yunyao
Huang
a,
D. O.
Alikin
b,
V. Ya.
Shur
b,
Zhihao
Lou
c,
Amei
Zhang
d,
Xiaoyong
Wei
 a,
Dong
Wang
e,
Feng
Gao
 *c,
Hongliang
Du
 *d and
Li
Jin
 *a
*a
aElectronic Materials Research Laboratory, Key Laboratory of the Ministry of Education, School of Electronic Science and Engineering, Xi'an Jiaotong University, Xi'an, 710049, China. E-mail: ljin@mail.xjtu.edu.cn
bSchool of Natural Sciences and Mathematics, Ural Federal University, Ekaterinburg, 620000, Russia
cState Key Laboratory of Solidification Processing, MIIT Key Laboratory of Radiation Detection Materials and Devices, USI Institute of Intelligence Materials and Structure, School of Materials Science and Engineering, Northwestern Polytechnical University, Xi'an 710072, China. E-mail: gaofeng@nwpu.edu.cn
dMultifunctional Electronic Ceramics Laboratory, College of Engineering, Xi'an International University, Xi'an 710077, China. E-mail: duhongliang@126.com
eFrontier Institute of Science and Technology and State Key Laboratory for Mechanical Behaviour of Materials, Xi'an Jiaotong University, Xi'an 710049, China
First published on 5th January 2023
Abstract
Despite the fact that relaxor ferroelectrics (RFEs) have been extensively researched because of their various advantages, there are still barriers to simultaneously increasing their energy storage density (Wrec) and efficiency (η). By substituting Bi(Mg0.5Sn0.5)O3 (BMS) and optimizing the formation process, this study follows a stepwise optimization route to achieve comprehensive exceptional energy storage performance (ESP) in Na0.5Bi0.5TiO3-Sr0.85Bi0.1TiO3 (NBT-SBT)-based ceramics. On the premise of constructing a Sr2+–Sr2+ ion pair at the A-site to ensure a large polarization, the introduction of Mg2+ and Sn4+ ions at the B-site further induces a local disordered field and promotes polar nanoregions. Following that, the viscous polymer process (VPP) used to synthesize NBT-SBT-BMS ceramics can thin the thickness, reduce defects, and boost compactness, hence improving the polarization difference (ΔP) and breakdown strength (Eb). Using the stepwise optimization route, we were able to attain a high ΔP of 64.6 μC cm−2 and an Eb of 440 kV cm−1 in 0.92(0.65NBT-0.35SBT)-0.08BMS-VPP ceramics. More crucially, an ultrahigh Wrec of 7.5 J cm−3 and a high η of 85% are simultaneously achieved, together with excellent temperature adaptability between 20 and 120 °C. Our superb ESP exceeds the majority of previously reported NBT-based ceramics, confirming the applicability of this stepwise optimization route to other similar high-performance dielectric ceramic designs.
1. Introduction
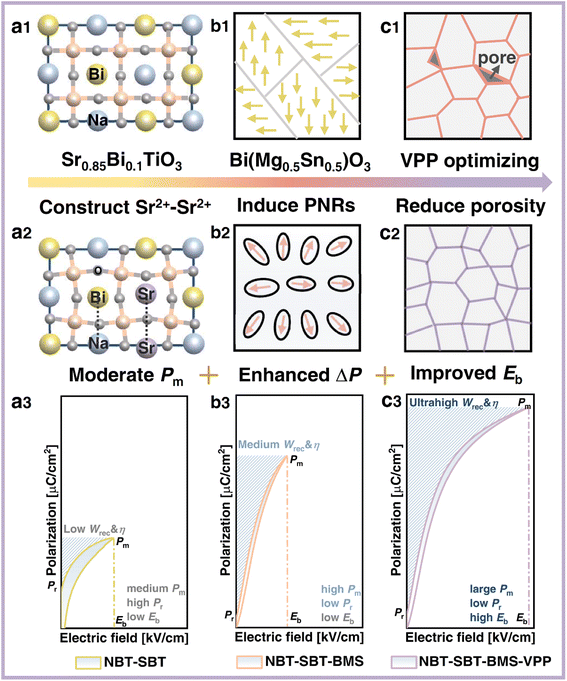
Ceramic dielectric capacitors are capably competitive in electronic systems because of their high-power density, strong voltage resistance, and prominent reliability.1–3 Their poor energy storage density, however, remains an impediment to meeting the demands for advanced electronic system integration and downsizing.4,5 To compensate for this shortcoming, reduce energy loss, and adapt to diverse temperature conditions, ceramic capacitors with high energy storage density (Wrec), energy efficiency (η), and great thermal adaptation are required.1 The desirable Wrec and η are theoretically fulfilled by high breakdown strength (Eb) and large polarization difference (ΔP) between maximum polarization (Pm) and residual polarization (Pr), based on polarization against electric field (P–E) hysteresis loops of ceramics.6 In this regard, relaxor ferroelectrics (RFEs) have a high ΔP value and a moderate Eb, giving them advantages and superiorities over ferroelectrics (FEs), antiferroelectrics (AFEs), and linear dielectrics (LDs), all of which have advantages and disadvantages in energy storage applications.3Perovskite (Na0.5Bi0.5)TiO3 (NBT)-based RFE ceramics have been extensively studied in the past decade.4,5,7–15 Because the valence electron configuration of Bi3+ (6s26p0) is comparable to that of Pb2+ and orbital hybridization between Bi 6p and O 2p normally generates a higher Pm, prototypical NBT has a high Pm greater than 40 μC cm−2.1 Nonetheless, its high Pr (38 μC cm−2) and relative square P–E loop are detrimental to Wrec improvement. Based on this, one of the effective modification strategies for improving the energy storage performance (ESP) of NBT-based ceramics is chemical modification by substituting (Sr0.85Bi0.1)TiO3 (SBT) into NBT.7,16 The total strength of the electrostatic bond of all adjacent cations to an anion is equal to the anion's charge, according to the electrostatic valency principle. As a result, adjacently formed Sr2+–Sr2+ can replace Bi+–Na3+ in the NBT-SBT system, as shown in Fig. 1(a1 and a2). Combined with Coulomb's law F = kq1q2/r2, the distance of the former with q = +2Sr is greater than that of the latter with q = +1Na and q = +3Bi. Following that, such a replacement is built by introducing SBT into NBT to cause A-position asymmetry, larger atomic space, and lattice distortion, resulting in a moderate Pm. Furthermore, due to its dielectric relaxation behavior over a wide temperature range, SBT can help to improve the thermal stability of ceramics.7 In this case, NBT-SBT is chosen as the matrix for this work due to its high Pm and potential temperature characteristics, while its nonnegligible Pr and low Eb limit the ultimate excellent ESP, as depicted in Fig. 1(a3).
As a result, many studies have been conducted to improve the above two points of the NBT-SBT system by introducing niobate compounds such as NaNbO3 (NN),16 KNbO3,17 AgNbO3 (AN),18,19 and (Na, K)NbO3 (KNN) in this matrix.8 For example, Wu et al. acquired an enhanced Wrec of 3.08 J cm−3 by incorporating NN into NBT-SBT systems with an increased Eb of 220 kV cm−1.16 Furthermore, BiMeO3 compounds (Me representing various cations) are frequently substituted into NBT-based systems to improve relaxation behavior and Eb, which are attributed to the strong polarizability of Bi3+ and the reduced grain size by large radius Me3+ ions.20,21 As a result, Bi(Mg0.5Sn0.5)O3 (BMS), which has the potential to decrease Pr while increasing Eb, is chosen as the first optimization route, as shown in Fig. 1(b1 and b2). The difference in charge and ionic radius in the B-site induces a local disordered field, which contributes to the realization of the transition from microdomains to polar nanoregions (PNRs) that respond quickly to an applied electric field, thus maintaining a large ΔP and improving Eb, as shown in Fig. 1(b3).
In addition, the Eb is affected by other factors such as thickness, grain size, porosity, and so on, so many measures to improve the Eb have been implemented around these factors.22 Li et al., for example, achieved an increased Eb of 600 kV cm−1 in K0.5Na0.5NbO3-Bi(Zn2/3Ta1/3)O3 ceramics by reducing thickness and porosity through repeated rolling.23 Yan et al. also achieved a high Eb of 500 kV cm−1 in Bi0.5Na0.5TiO3-SrNb0.5Al0.5O3 ceramics using the tape casting technique.24 As a result, the viscous polymer process (VPP)25,26 is used in the second optimization route to increase the Eb of NBT-SBT-BMS ceramics, as shown in Fig. 1(c1 and c2). The NBT-SBT-BMS ceramic powders are treated with PVA, hot water, acetic acid, and repeated rolling to obtain thinner, less defective, and denser VPP ceramics, which ultimately helps to obtain higher Eb and improve ESP, as indicated in Fig. 1(c3).
Along the stepwise optimization route depicted in Fig. 1. NBT-SBT-BMS-VPP ceramics are synthesized by introducing BMS and optimizing the VPP process in the NBT-SBT matrix with the formation of Sr2+–Sr2+ ion pairs, which improve Pm, reduce Pr and finally improve Eb. In summary, the 0.92(0.65NBT-0.35SBT)-0.08BMS-VPP ceramics optimized by this progressive strategy achieve an ultrahigh Wrec of 7.5 J cm−3 and a high η of 85% at a large ΔP of 64.6 μC cm−2 (Eb = 440 kV cm−1), as well as excellent temperature applicability within 20–120 °C.
2. Experimental
(1−x)(0.65Na0.5Bi0.5TiO3-0.35Sr0.85Bi0.1TiO3)-xBi(Mg0.5Sn0.5)O3 ceramics (abbreviated as NBT-SBT-xBMS, x = 0.02, 0.04, 0.08, and 0.12) were first prepared using the solid-state reaction method, and then the x = 0.08 component was optimized using the VPP process. ESI† contains information on the experimental procedure and characterization.3. Results and discussion
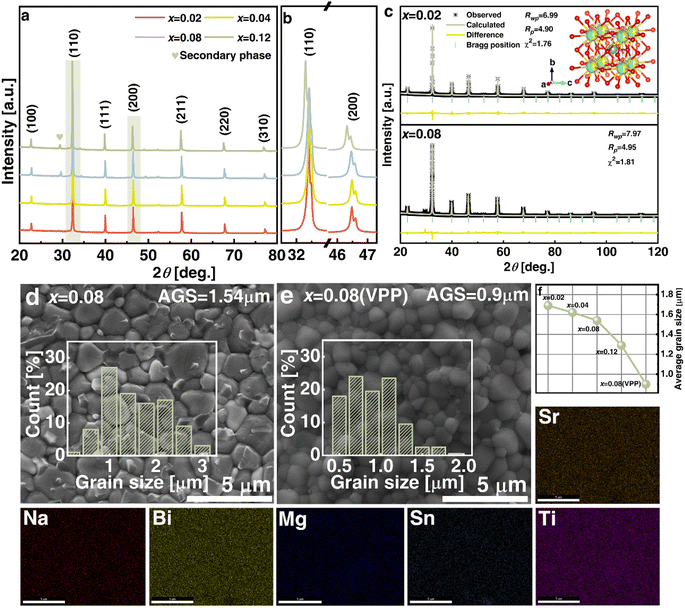
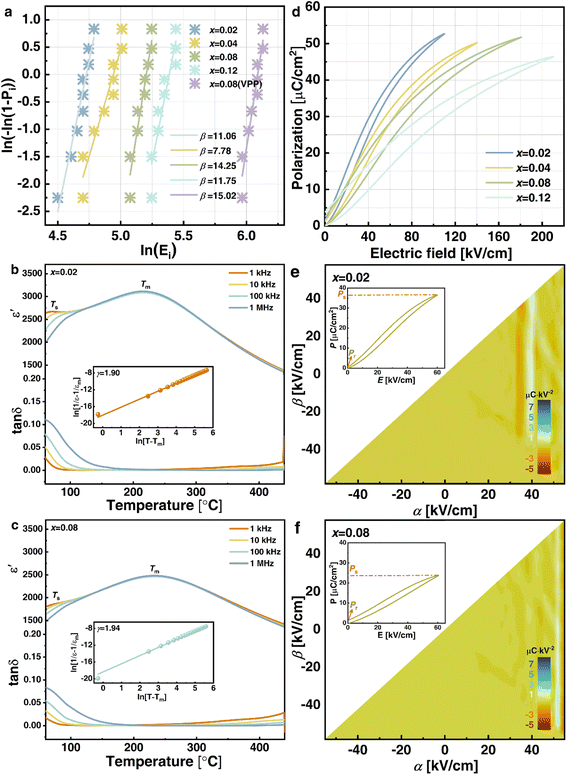
The crystalline structure detected by XRD for NBT-SBT-xBMS ceramics is shown in Fig. 2(a), all of which are solid soluble perovskite structures except for the second phase caused by Bi volatilization during the high-temperature process and labeled at 28–29°. The enlarged (110) peaks in Fig. 2(b) shift to the left as BMS content increases, as does cell volume, because bigger radius Mg2+ (72 pm) and Sn4+ (69 pm) ions replace Ti4+ ions (60.5 pm). Similarly, the cleaved (200) peaks show that ceramics are not cubic in structure but have pseudocubic symmetry, as determined by the Rietveld refinements of all compositions in Table S1† and Fig. 2(c). The average structures are Pm![[3 with combining macron]](https://www.rsc.org/images/entities/char_0033_0304.gif) m, according to the fitting R-factors in the refinement results, and the changes in lattice parameters and cell volume are consistent with the XRD analyses. Furthermore, Fig. 2(d) and (e) compare the SEM micro appearances and average grain size (AGS) distributions of x = 0.08 and x = 0.08 (VPP) ceramics, with the latter being denser than the former due to the reduced porosity achieved through VPP processing. Fig. 2(f) shows the AGS distribution results of each ceramic component, with the AGS steadily decreasing from 1.69, 1.62, 1.54, 1.29 to 0.9 μm with the addition of BMS and VPP. The element distributions (EDS) of the optimal VPP object (x = 0.08) are then shown in Fig. 2(Sr–Ti), exhibiting the chemical uniformity of the elements Sr, Na, Bi, Mg, Sn, and Ti. As is generally known, grain size, porosity, and compactness are all parameters that can influence the Eb of ceramics by varying the quantity of high-insulating grain boundaries.2,22 As a result, the Eb of NBT-SBT-xBMS ceramics is evaluated in terms of the Weibull distribution, as illustrated in Fig. 3(a), where all data obey the distribution and fit out the reliable value β. The increasing Eb is inversely proportional to the decreasing AGS, which conforms to the relationship between them, i.e.,
m, according to the fitting R-factors in the refinement results, and the changes in lattice parameters and cell volume are consistent with the XRD analyses. Furthermore, Fig. 2(d) and (e) compare the SEM micro appearances and average grain size (AGS) distributions of x = 0.08 and x = 0.08 (VPP) ceramics, with the latter being denser than the former due to the reduced porosity achieved through VPP processing. Fig. 2(f) shows the AGS distribution results of each ceramic component, with the AGS steadily decreasing from 1.69, 1.62, 1.54, 1.29 to 0.9 μm with the addition of BMS and VPP. The element distributions (EDS) of the optimal VPP object (x = 0.08) are then shown in Fig. 2(Sr–Ti), exhibiting the chemical uniformity of the elements Sr, Na, Bi, Mg, Sn, and Ti. As is generally known, grain size, porosity, and compactness are all parameters that can influence the Eb of ceramics by varying the quantity of high-insulating grain boundaries.2,22 As a result, the Eb of NBT-SBT-xBMS ceramics is evaluated in terms of the Weibull distribution, as illustrated in Fig. 3(a), where all data obey the distribution and fit out the reliable value β. The increasing Eb is inversely proportional to the decreasing AGS, which conforms to the relationship between them, i.e.,  , where G represents the AGS.22
Fig. 3(b) and (c) show the temperature dependences of dielectric properties for x = 0.02 and 0.08 ceramics. The noticeable frequency dispersion at a low temperature of about 60 °C in the loss tangent (tan![[thin space (1/6-em)]](https://www.rsc.org/images/entities/char_2009.gif) δ) − T curves of these two ceramics can be detected as the one dielectric anomaly (Ts peak) in the corresponding permittivity (ε′) − T spectrum, which is created by the thermal evolution of PNRs.27,28 In contrast, another dielectric anomaly (Tm peak) corresponding to maximum permittivity εm exists in the high-temperature area of 250 °C due to the weak frequency dispersion. After doping additional BMS, the ε′ of x = 0.08 ceramics dramatically falls compared to x = 0.02 and 0.08 ceramics due to increasing cation disorder at A- and B-sites as well as the broken long-range ferroelectric order. Furthermore, the dielectric peak of x = 0.08 ceramics becomes wide and flat, which improves relaxor behavior, increases the thermal stable interval, and contributes to ESP temperature stability. In order to determine the diffuseness degree of x = 0.02 and 0.08 ceramics further, the modified Curie–Weiss law is used as follows:29
δ) − T curves of these two ceramics can be detected as the one dielectric anomaly (Ts peak) in the corresponding permittivity (ε′) − T spectrum, which is created by the thermal evolution of PNRs.27,28 In contrast, another dielectric anomaly (Tm peak) corresponding to maximum permittivity εm exists in the high-temperature area of 250 °C due to the weak frequency dispersion. After doping additional BMS, the ε′ of x = 0.08 ceramics dramatically falls compared to x = 0.02 and 0.08 ceramics due to increasing cation disorder at A- and B-sites as well as the broken long-range ferroelectric order. Furthermore, the dielectric peak of x = 0.08 ceramics becomes wide and flat, which improves relaxor behavior, increases the thermal stable interval, and contributes to ESP temperature stability. In order to determine the diffuseness degree of x = 0.02 and 0.08 ceramics further, the modified Curie–Weiss law is used as follows:29
 | (1) |
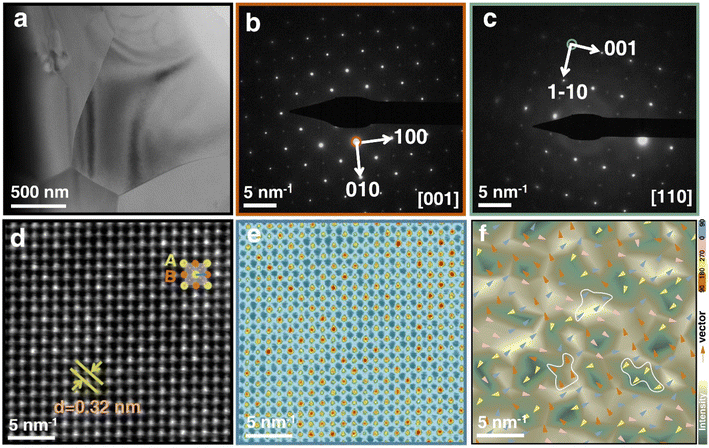
Bright-field transmission electron microscopy (TEM) examination is performed to observe the domain morphology in order to better investigate the physical mechanism of the remarkable ESP in the optimal x = 0.08 ceramic, as shown in Fig. 4(a). Because of the introduction of BMS, micron-sized PNRs have clearly replaced huge ferroelectric domains in ceramics. The lattice spacing confirms the average structure of pseudocubic symmetry, according to the selected-area electron diffraction (SAED) patterns along the [001] and [110] zone axes of the x = 0.08 ceramic grains shown in Fig. 4(b) and (c), which is consistent with the XRD refinement results. The high-resolution TEM (HR-TEM) images in Fig. 4(d) and concomitant brightness distribution in Fig. 4(e) of the x = 0.08 ceramic jointly point out the A- and B-sites atom positions. As a result, the spontaneous polarization vector is identified as the distance from the cationic B-site to the nearest four A-site centers. Based on this assumption, Fig. 4(f) depicts the intensity and orientation of spontaneous polarization, as shown by the back color distribution and arrow direction, respectively. Meanwhile, four-angle interval arrow vectors (0-90-180-270-360°) divided into four colors correspond to different back color regions showing polarization intensity. PNRs are regions (indicated by a white line) composed of polarization vectors of the same color and orientation, where the (2–4) nm PNRs and domain structure in the x = 0.08 ceramic are helpful for improving ΔP and ESP.
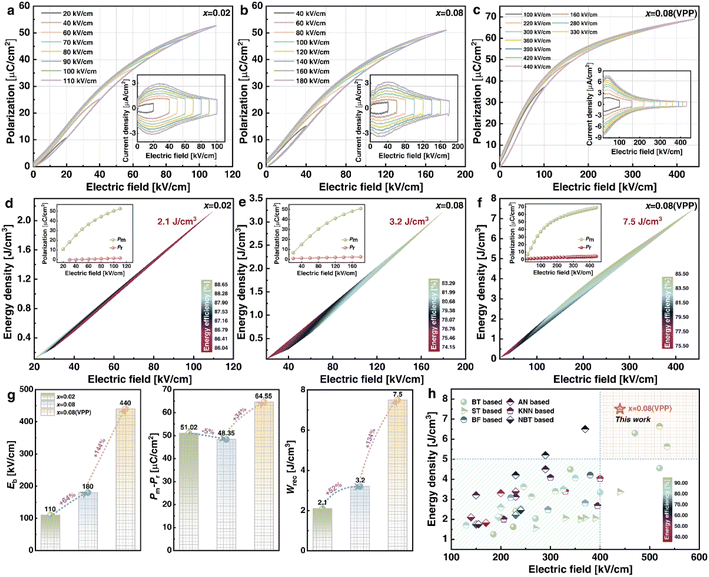
Fig. 5(a–c) show the unipolar P–E loops and relative I–E curves of x = 0.02, 0.08, and 0.08 (VPP) ceramics under various electric fields. Because of the comparatively obvious hysteresis embedded in the P–E loops, the x = 0.02 ceramics in Fig. 5(a) exhibit weak RFE features, with low Eb as well as significant Pm and Pr values. Under the same electric field, Pm falls and Pr increases after the addition of 0.08 mole BMS in Fig. 5(b) compared to x = 0.02. Despite this, BMS has greatly improved the Eb of x = 0.08 to give a Pm value that is still high under this breakdown field. As a result, x = 0.08 is determined for further VPP to synthesize x = 0.08 (VPP) ceramics in Fig. 5(c), which intuitively have slimmer P–E loops. The VPP reduces thickness, flaws, and porosity, resulting in greatly higher Eb, equally high Pm, and significantly reduced Pr. The foregoing trends of x = 0.02, 0.08, and 0.08 (VPP) ceramics are independently reflected in the specific performance parameters (Eb, Pm, Pr, Wrec, and η) observed under different electric fields in Fig. 5(d–f). With a low Eb of 110 kV cm−1 for x = 0.02 ceramics in Fig. 5(d), the large Pm of 52.68 μC cm−2 and Pr of 1.66 μC cm−2 result in an undesired ESP (Wrec = 2.1 J cm−3, η = 87%). Then under the function of BMS for x = 0.08 ceramics in Fig. 5(e), the enhanced Eb (180 kV cm−1) boosts the modified Wrec (3.2 J cm−3) but the increased Pr (2.65 μC cm−2) cause a reduced η of 85%. The ESP has yet to meet the actual application requirements. As a result, the ESP of x = 0.08 ceramics is naturally enhanced by VPP, achieving ultrahigh Wrec of 7.5 J cm−3 and η of 85% under Eb of 440 kV cm−1 as shown in Fig. 5(f). Fig. 5(g) depicts the effects of key parameters such as Eb and Pm − Pr on Wrec for the three ceramics. As 0.08 mol. BMS and VPP act sequentially to improve Eb from 110 kV cm−1 by 64% to 180 kV cm−1 and subsequently by 144% to 440 kV cm−1, the ΔP decreases by 5% from 51.02 μC cm−2 to 64.55 μC cm−2. As a result, the massive increase in Wrec from 2.1 to 7.5 J cm−3 is ultimately realized in x = 0.08 (VPP) ceramics, which is primarily attributed to the overall improved Eb and ΔP. In addition, a succession of Eb, Wrec, and η between our work and BaTiO3 (BT), AN, SrTiO3 (ST), KNN, BiFeO3 (BF), and NBT-based ceramics are shown in Fig. 5(h).10,15,16,18,22,33–77 Most ceramic performance parameters are spread in the lower left and upper right corners of each system, with Eb below 400 kV cm−1 linearly corresponding to Wrec below 5 J cm−3 and vice versa. However, the x = 0.08 (VPP) ceramic with Wrec of 7.5 J cm−3 and η of 85% improves on the prior ESP of roughly 400 kV cm−1, broadening the application prospect.
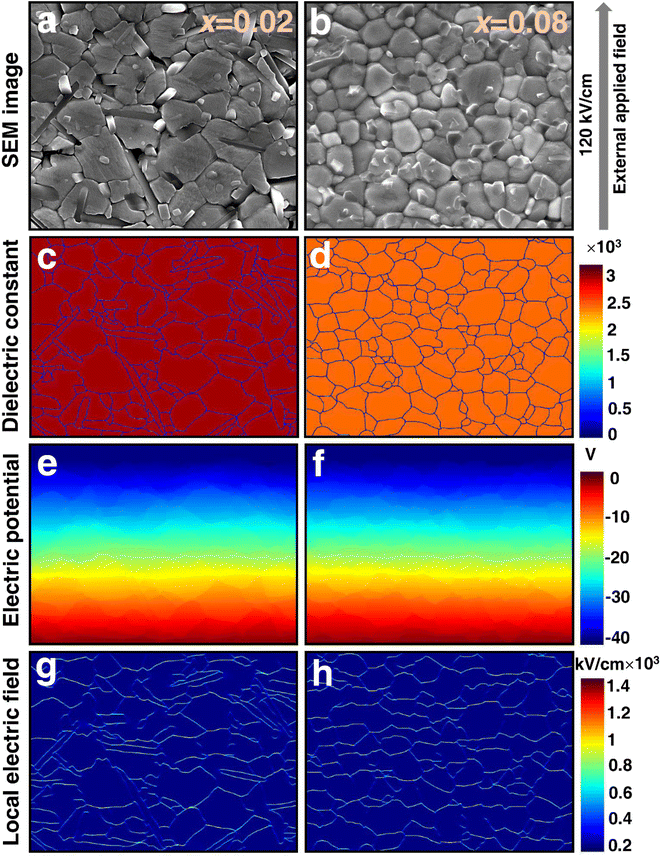
SEM appearances of x = 0.02 and 0.08 ceramics in Fig. 6(a) and (b) are utilized as the matrix structure for a series of COMSOL simulations to validate the definite relationship between microstructure and electrical properties. Because of the clear separation of grain boundaries and grains in these two ceramics, their own ε′ of 3090 and 2469 at 1 kHz obtained from Fig. 3(b) and (d) are assigned as belonging to the grains, and the ε′ of the grain boundaries is one-tenth of it. Following this setting, the model presented by Randall et al.78 is used to simulate x = 0.02 and 0.08 ceramics, and the corresponding results are displayed in Fig. 6(c) and (d), respectively. Under a simulated external electric field of 120 kV cm−1 applied to x = 0.02 and 0.08 ceramics, the grain distributions of x = 0.08 are more uniform and denser than those of x = 0.02, resulting in a greater average electric potential, as shown in Fig. 6(e) and (f). Furthermore, when combined with the finer grains in x = 0.08 ceramics, Fig. 6(g) and (h) shows that x = 0.08 ceramics have more grain boundaries (shown in yellow) correlating to a strong local electric field, resulting in a higher Eb.
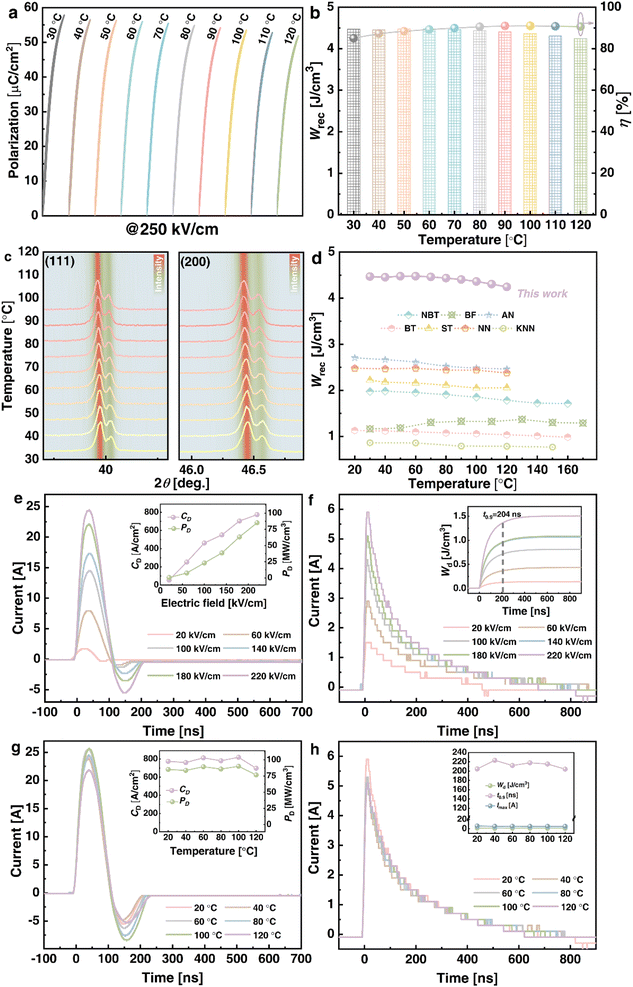
Aside from obtaining superior ESP at RT, its temperature adaptability throughout a broad temperature range is critical for energy storage applications. Fig. 7(a) and (b) exhibit the unipolar P–E loops and corresponding Wrec and η of x = 0.08 (VPP) ceramics from 30 to 120 °C at 250 kV cm−1. Although Pm will certainly reduce slightly as temperature rises, the P–E loops will always remain slim, and Pr will likewise decrease. With the same changes in Pm and Pr, Wrec remains stable at 4.47 to 4.25 J cm−3 and the η rises from 85 to 91%. As a result, the combined Wrec of 4.4 J cm−3 and η of 89% with fluctuations of less than ±5% and ±6% indicate that stable thermal reactivity is attained in x = 0.08 (VPP) ceramics. Similarly, at 30–120 °C, the XRD patterns of the (111) and (200) peaks at 39.5–40.5° and 46–47° are shown in Fig. 7(c). The shape and intensity of the diffraction peak reflected by the background color essentially remain unchanged as the temperature changes. This structural evolution law can also be used to demonstrate the temperature independence of x = 0.08 (VPP) ceramics, which have superior ESP performance than other ceramic systems at various temperatures [see Fig. 7(d)].15,36,66,74,79–81 In comparison to chosen NBT, BF, AN, BT, ST, NN, and KNN-based ceramics, x = 0.08 (VPP) ceramics stand out due to Wrec of 4.25 J cm−3 and η of 89%. Furthermore, the charge–discharge behaviors are critical for x = 0.08 (VPP) ceramics and are depicted in Fig. 7(e–h). The underdamped I–t curves from 20 to 220 kV cm−1 are displayed in Fig. 7(e). All curves perpendicularly increase as the electric field varies. Under 220 kV cm−1, the maximum current (Imax), current density (CD = Imax/S), and power density (PD = EImax/2S) are 24.5 A, 780.25 A cm−2 and 85.83 MW cm−3, respectively. Fig. 7(f) shows the overdamped I–t curves in the same electric field range, while the corresponding discharged energy density  82 is 1.51 J cm−3 and discharge time (t0.9) is maintained within 204 ns. These two types of waveforms from 20 to 120 °C are also gathered in Fig. 7(g) and (h) for analyzing the temperature applicability of x = 0.08 (VPP) ceramics. Even if the waveforms and derived values change with temperature, its Imax, CD, and PD remain stable at 120 °C, which are 21.9 A, 697.45 A cm−2, and 76.72 MW cm−3, respectively, with a Wd of 1.26 J cm−3 and t0.9 of 204 ns. As a result, x = 0.08 (VPP) ceramics exhibit superior thermal independence and competitiveness in energy storage and pulse performance.
4. Conclusions
To summarize, the stepwise optimization route is used to achieve comprehensive outstanding ESP in 0.65NBT-0.35BST-based ceramics by gradually introducing the BMS and implementing the VPP technique. Specifically, after generating a Sr2+–Sr2+ ion pair at the A-site to assure a high Pm, the introduction of Mg2+ and Sn4+ ions at the B-site promotes PNRs and repeated rolling for ceramics increases compactness, which improve the ΔP and Eb in order. As a result, 0.92(0.65NBT-0.35BST)-0.08BMS-VPP ceramics obtain an ultrahigh Wrec of 7.5 J cm−3 and a high η of 85% under the action of a huge ΔP of 64.6 μC cm−2 at 440 kV cm−1, as well as stable thermal reactivity within 20–120 °C. Such superior ESP benefits from the high polarization intensity, breaks the previous values at almost the breakdown electric field, and outperforms the majority of reported NBT-based ceramics, demonstrating the applicability of the stepwise optimization route for designing other similar high-performance dielectric ceramics.Conflicts of interest
There are no conflicts to declare.Acknowledgements
This work was financially supported by the National Natural Science Foundation of China (Grant No. 52261135548), the Key Research and Development Program of Shaanxi (Program No. 2022KWZ-22), the Natural Science Basic Research Program of Shaanxi (Grant No. 2023-JC-YB-441), the National Key Research and Development Program of China (Grant No. 2021YFE0115000 and 2021YFB3800602), the Youth Innovation Team of Shaanxi Universities, the Scientific Research Program Funded by Shaanxi Provincial Education Department, China (Grant No. 21JK0869 and 22JP073) and the Fundamental Research Funds of Shaanxi Key Laboratory of Artificially-Structured Functional Materials and Devices (AFMD-KFJJ-21203). The research was made possible by Russian Science Foundation (Project No. 23-42-00116). The equipment of the Ural Center for Shared Use “Modern nanotechnology” Ural Federal University (Reg. No. 2968) which is supported by the Ministry of Science and Higher Education RF (Project No. 075-15-2021-677) was used. The SEM work was done at International Center for Dielectric Research (ICDR), Xi'an Jiaotong University, Xi'an, China.References
- Z. Yang, H. Du, L. Jin and D. Poelman, J. Mater. Chem. A, 2021, 9, 18026–18085 RSC.
- L. Yang, X. Kong, F. Li, H. Hao, Z. Cheng, H. Liu, J. Li and S. Zhang, Prog. Mater. Sci., 2019, 102, 72–108 CrossRef CAS.
- B. Zhang, X. Chen, Z. Pan, P. Liu, M. Mao, K. Song, Z. Mao, R. Sun, D. Wang and S. Zhang, Adv. Funct. Mater., 2022, 33, 2210050 CrossRef.
- J. Lv, Q. Li, Y. Li, M. Tang, D. Jin, Y. Yan, B. Fan, L. Jin and G. Liu, Chem. Eng. J., 2021, 420, 129900 CrossRef CAS.
- B. Guo, Y. Yan, M. Tang, Z. Wang, Y. Li, L. Zhang, H. Zhang, L. Jin and G. Liu, Chem. Eng. J., 2021, 420, 130475 CrossRef CAS.
- L. Jin, F. Li and S. Zhang, J. Am. Ceram. Soc., 2014, 97, 1–27 CrossRef CAS.
- J. Li, F. Li, Z. Xu and S. Zhang, Adv. Mater., 2018, 30, 1802155 CrossRef PubMed.
- Z. Pan, D. Hu, Y. Zhang, J. Liu, B. Shen and J. Zhai, J. Mater. Chem. C, 2019, 7, 4072–4078 RSC.
- J. Li, Z. Shen, X. Chen, S. Yang, W. Zhou, M. Wang, L. Wang, Q. Kou, Y. Liu, Q. Li, Z. Xu, Y. Chang, S. Zhang and F. Li, Nat. Mater., 2020, 19, 999–1005 CrossRef CAS PubMed.
- F. Yan, K. Huang, T. Jiang, X. Zhou, Y. Shi, G. Ge, B. Shen and J. Zhai, Energy Storage Mater., 2020, 30, 392–400 CrossRef.
- L. Zhang, S. Cao, Y. Li, R. Jing, Q. Hu, Y. Tian, R. Gu, J. Kang, D. O. Alikin, V. Y. Shur, X. Wei, G. Liu, F. Gao, H. Du, Y. Yan and L. Jin, J. Alloys Compd., 2022, 896, 163139 CrossRef CAS.
- Z. Sun, Z. Wang, Y. Tian, G. Wang, W. Wang, M. Yang, X. Wang, F. Zhang and Y. Pu, Adv. Electron. Mater., 2020, 6, 1900698 CrossRef CAS.
- L. Zhang, R. Jing, Y. Huang, Q. Hu, D. O. Alikin, V. Y. Shur, J. Gao, X. Wei, L. Zhang, G. Liu, Y. Yan and L. Jin, J. Materiomics, 2022, 8, 527–536 CrossRef.
- H. Li, S. Zhou, J. Zhao, T. Yan, Y. Du, H. Zhou, Y. Pu and D. Wang, J. Adv. Dielectr., 2022, 12, 2242007 CrossRef.
- D. Hu, Z. Pan, X. Zhang, H. Ye, Z. He, M. Wang, S. Xing, J. Zhai, Q. Fu and J. Liu, J. Mater. Chem. C, 2020, 8, 591–601 RSC.
- Y. Wu, Y. Fan, N. Liu, P. Peng, M. Zhou, S. Yan, F. Cao, X. Dong and G. Wang, J. Mater. Chem. C, 2019, 7, 6222–6230 RSC.
- X. Zhang, D. Hu, Z. Pan, X. Lv, Z. He, F. Yang, P. Li, J. Liu and J. Zhai, Chem. Eng. J., 2021, 406, 126818 CrossRef CAS.
- X. Qiao, D. Wu, F. Zhang, B. Chen, X. Ren, P. Liang, H. Du, X. Chao and Z. Yang, J. Mater. Chem. C, 2019, 7, 10514–10520 RSC.
- Y. Tian, P. Song, G. Viola, J. Shi, J. Li, L. Jin, Q. Hu, Y. Xu, W. Ge, Z. Yan, D. Zhang, N. V. Tarakina, I. Abrahams, X. Wei and H. Yan, J. Mater. Chem. A, 2022, 10, 14747–14787 RSC.
- Y. Lin, D. Li, M. Zhang and H. Yang, J. Mater. Chem. C, 2020, 8, 2258–2264 RSC.
- D. Li, Y. Lin, Q. Yuan, M. Zhang, L. Ma and H. Yang, J. Materiomics, 2020, 6, 743–750 CrossRef.
- Z. Yang, F. Gao, H. Du, L. Jin, L. Yan, Q. Hu, Y. Yu, S. Qu, X. Wei, Z. Xu and Y. Wang, Nano Energy, 2019, 58, 768–777 CrossRef CAS.
- D. Li, D. Zhou, D. Wang, W. Zhao, Y. Guo and Z. Shi, Adv. Funct. Mater., 2022, 32, 2111776 CrossRef CAS.
- F. Yan, H. Bai, Y. Shi, G. Ge, X. Zhou, J. Lin, B. Shen and J. Zhai, Chem. Eng. J., 2021, 425, 130669 CrossRef CAS.
- G. Liu, M. Tang, X. Hou, B. Guo, J. Lv, J. Dong, Y. Wang, Q. Li, K. Yu, Y. Yan and L. Jin, Chem. Eng. J., 2021, 412, 127555 CrossRef CAS.
- G. Liu, Y. Li, B. Guo, M. Tang, Q. Li, J. Dong, L. Yu, K. Yu, Y. Yan, D. Wang, L. Zhang, H. Zhang, Z. He and L. Jin, Chem. Eng. J., 2020, 398, 125625 CrossRef CAS.
- L. Jin, W. Luo, L. Wang, Y. Tian, Q. Hu, L. Hou, L. Zhang, X. Lu, H. Du, X. Wei, G. Liu and Y. Yan, J. Eur. Ceram. Soc., 2019, 39, 277–286 CrossRef CAS.
- Y. Pu, M. Yao, H. Liu and T. Frömling, J. Eur. Ceram. Soc., 2016, 36, 2461–2468 CrossRef CAS.
- W. Wang, L. Zhang, R. Jing, Q. Hu, D. O. Alikin, V. Ya. Shur, X. Wei, G. Liu, Y. Yan and L. Jin, Chem. Eng. J., 2022, 434, 134678 CrossRef CAS.
- Z. Yang, H. Du, L. Jin, Q. Hu, S. Qu, Z. Yang, Y. Yu, X. Wei and Z. Xu, J. Eur. Ceram. Soc., 2019, 39, 2899–2907 CrossRef CAS.
- Z. Yang, H. Du, L. Jin, Q. Hu, H. Wang, Y. Li, J. Wang, F. Gao and S. Qu, J. Mater. Chem. A, 2019, 7, 27256–27266 RSC.
- L. Zhang, R. Jing, Y. Huang, Q. Hu, D. O. Alikin, V. Y. Shur, D. Wang, X. Wei, L. Zhang, G. Liu and L. Jin, J. Eur. Ceram. Soc., 2022, 42, 944–953 CrossRef CAS.
- N. Luo, K. Han, F. Zhuo, C. Xu, G. Zhang, L. Liu, X. Chen, C. Hu, H. Zhou and Y. Wei, J. Mater. Chem. A, 2019, 7, 14118–14128 RSC.
- D. Wang, Z. Fan, D. Zhou, A. Khesro, S. Murakami, A. Feteira, Q. Zhao, X. Tan and I. M. Reaney, J. Mater. Chem. A, 2018, 6, 4133–4144 RSC.
- M. Zhou, R. Liang, Z. Zhou and X. Dong, Ceram. Int., 2019, 45, 3582–3590 CrossRef CAS.
- H. Yang, H. Qi and R. Zuo, J. Eur. Ceram. Soc., 2019, 39, 2673–2679 CrossRef CAS.
- W. Wang, Y. Pu, X. Guo, R. Shi, M. Yang and J. Li, J. Alloys Compd., 2020, 817, 152695 CrossRef CAS.
- X. Jiang, H. Hao, S. Zhang, J. Lv, M. Cao, Z. Yao and H. Liu, J. Eur. Ceram. Soc., 2019, 39, 1103–1109 CrossRef CAS.
- W. Wang, Y. Pu, X. Guo, R. Shi, Y. Shi, M. Yang, J. Li, X. Peng and Y. Li, J. Eur. Ceram. Soc., 2019, 39, 5236–5242 CrossRef CAS.
- W. Wang, Y. Pu, X. Guo, T. Ouyang, Y. Shi, M. Yang, J. Li, R. Shi and G. Liu, Ceram. Int., 2019, 45, 14684–14690 CrossRef.
- Y. Pu, W. Wang, X. Guo, R. Shi, M. Yang and J. Li, J. Mater. Chem. C, 2019, 7, 14384–14393 RSC.
- M. Zhang, H. Yang, D. Li, L. Ma and Y. Lin, J. Mater. Chem. C, 2020, 8, 8777–8785 RSC.
- C. Xu, Z. Fu, Z. Liu, L. Wang, S. Yan, X. Chen, F. Cao, X. Dong and G. Wang, ACS Sustainable Chem. Eng., 2018, 6, 16151–16159 CrossRef CAS.
- H. Sun, X. Wang, Q. Sun, X. Zhang, Z. Ma, M. Guo, B. Sun, X. Zhu, Q. Liu and X. Lou, J. Eur. Ceram. Soc., 2020, 40, 2929–2935 CrossRef CAS.
- N. Luo, K. Han, L. Liu, B. Peng, X. Wang, C. Hu, H. Zhou, Q. Feng, X. Chen and Y. Wei, J. Am. Ceram. Soc., 2019, 102, 4640–4647 CrossRef CAS.
- B. Qu, H. Du and Z. Yang, J. Mater. Chem. C, 2016, 4, 1795–1803 RSC.
- F. Li, J. Zhai, B. Shen, H. Zeng, X. Jian and S. Lu, J. Alloys Compd., 2019, 803, 185–192 CrossRef CAS.
- N. Liu, R. Liang, X. Zhao, C. Xu, Z. Zhou and X. Dong, J. Am. Ceram. Soc., 2018, 101, 3259–3265 CrossRef CAS.
- Y. Tian, L. Jin, H. Zhang, Z. Xu, X. Wei, G. Viola, I. Abrahams and H. Yan, J. Mater. Chem. A, 2017, 5, 17525–17531 RSC.
- T. Shao, H. Du, H. Ma, S. Qu, J. Wang, J. Wang, X. Wei and Z. Xu, J. Mater. Chem. A, 2017, 5, 554–563 RSC.
- S. Li, H. Nie, G. Wang, C. Xu, N. Liu, M. Zhou, F. Cao and X. Dong, J. Mater. Chem. C, 2019, 7, 1551–1560 RSC.
- Z. Yang, H. Du, S. Qu, Y. Hou, H. Ma, J. Wang, J. Wang, X. Wei and Z. Xu, J. Mater. Chem. A, 2016, 4, 13778–13785 RSC.
- G. Wang, J. Li, X. Zhang, Z. Fan, F. Yang, A. Feteira, D. Zhou, D. C. Sinclair, T. Ma, X. Tan, D. Wang and I. M. Reaney, Energy Environ. Sci., 2019, 12, 582–588 RSC.
- L. Yang, X. Kong, Z. Cheng and S. Zhang, J. Mater. Chem. A, 2019, 7, 8573–8580 RSC.
- Q. Hu, Y. Tian, Q. Zhu, J. Bian, L. Jin, H. Du, D. O. Alikin, V. Y. Shur, Y. Feng, Z. Xu and X. Wei, Nano Energy, 2020, 67, 104264 CrossRef CAS.
- W. Wang, Y. Pu, X. Guo, R. Shi, M. Yang and J. Li, Ceram. Int., 2020, 46, 11484–11491 CrossRef CAS.
- N. Luo, K. Han, M. J. Cabral, X. Liao, S. Zhang, C. Liao, G. Zhang, X. Chen, Q. Feng, J. Li and Y. Wei, Nat. Commun., 2020, 11, 4824 CrossRef CAS PubMed.
- Z. Dai, J. Xie, W. Liu, X. Wang, L. Zhang, Z. Zhou, J. Li and X. Ren, ACS Appl. Mater. Interfaces, 2020, 12, 30289–30296 CrossRef CAS PubMed.
- F. Si, B. Tang, Z. Fang, H. Li and S. Zhang, Ceram. Int., 2019, 45, 17580–17590 CrossRef.
- B. Luo, X. Wang, E. Tian, H. Song, H. Wang and L. Li, ACS Appl. Mater. Interfaces, 2017, 9, 19963–19972 CrossRef CAS PubMed.
- D. Li, D. Zhou, W. Liu, P. Wang, Y. Guo, X. Yao and H. Lin, Chem. Eng. J., 2021, 419, 129601 CrossRef CAS.
- L. Zhang, L. Pang, W. Li and D. Zhou, J. Eur. Ceram. Soc., 2020, 40, 3343–3347 CrossRef CAS.
- L. Zhao, Q. Liu, J. Gao, S. Zhang and J. Li, Adv. Mater., 2017, 29, 1701824 CrossRef PubMed.
- Z. Lu, W. Bao, G. Wang, S.-K. Sun, L. Li, J. Li, H. Yang, H. Ji, A. Feteira, D. Li, F. Xu, A. K. Kleppe, D. Wang, S.-Y. Liu and I. M. Reaney, Nano Energy, 2021, 79, 105423 CrossRef CAS.
- W. Li, D. Zhou, L. Pang, R. Xu and H. Guo, J. Mater. Chem. A, 2017, 5, 19607–19612 RSC.
- M. Zhou, R. Liang, Z. Zhou and X. Dong, J. Mater. Chem. C, 2018, 6, 8528–8537 RSC.
- H. Yang, Z. Lu, L. Li, W. Bao, H. Ji, J. Li, A. Feteira, F. Xu, Y. Zhang, H. Sun, Z. Huang, W. Lou, K. Song, S. Sun, G. Wang, D. Wang and I. M. Reaney, ACS Appl. Mater. Interfaces, 2020, 12, 43942–43949 CrossRef CAS PubMed.
- J. Wu, A. Mahajan, L. Riekehr, H. Zhang, B. Yang, N. Meng, Z. Zhang and H. Yan, Nano Energy, 2018, 50, 723–732 CrossRef CAS.
- X. Ren, L. Jin, Z. Peng, B. Chen, X. Qiao, D. Wu, G. Li, H. Du, Z. Yang and X. Chao, Chem. Eng. J., 2020, 390, 124566 CrossRef CAS.
- L. Zhao, J. Gao, Q. Liu, S. Zhang and J. Li, ACS Appl. Mater. Interfaces, 2018, 10, 819–826 CrossRef CAS PubMed.
- F. Yan, X. Zhou, X. He, H. Bai, S. Wu, B. Shen and J. Zhai, Nano Energy, 2020, 75, 105012 CrossRef CAS.
- X. Zhou, H. Qi, Z. Yan, G. Xue, H. Luo and D. Zhang, ACS Appl. Mater. Interfaces, 2019, 11, 43107–43115 CrossRef CAS PubMed.
- W. Huang, Y. Chen, X. Li, G. Wang, N. Liu, S. Li, M. Zhou and X. Dong, Appl. Phys. Lett., 2018, 113, 203902 CrossRef.
- Z. Dai, D. Li, Z. Zhou, S. Zhou, W. Liu, J. Liu, X. Wang and X. Ren, Chem. Eng. J., 2022, 427, 131959 CrossRef CAS.
- L. Zhu, X. Lei, L. Zhao, M. I. Hussain, G. Zhao and B. Zhang, Ceram. Int., 2019, 45, 20266–20275 CrossRef CAS.
- X. Gao, Y. Li, J. Chen, C. Yuan, M. Zeng, A. Zhang, X. Gao, X. Lu, Q. Li and J. Liu, J. Eur. Ceram. Soc., 2019, 39, 2331–2338 CrossRef CAS.
- M. Zhang, H. Yang, D. Li and Y. Lin, J. Alloys Compd., 2020, 829, 154565 CrossRef CAS.
- C. A. Randall, A. D. Hilton, D. J. Barber and T. R. Shrout, J. Mater. Res., 1993, 8, 880–884 CrossRef CAS.
- M. Zhou, R. Liang, Z. Zhou and X. Dong, J. Mater. Chem. A, 2018, 6, 17896–17904 RSC.
- S. Li, T. Hu, H. Nie, Z. Fu, C. Xu, F. Xu, G. Wang and X. Dong, Energy Storage Mater., 2021, 34, 417–426 CrossRef.
- Y. Ding, P. Li, J. He, W. Que, W. Bai, P. Zheng, J. Zhang and J. Zhai, Composites, Part B, 2022, 230, 109493 CrossRef CAS.
- L. Zhang, H. Sun, Y. Lan, M. Tang, Y. Li, D. O. Alikin, V. Y. Shur, J. Gao, X. Lu, X. Wei, Z. Xu and L. Jin, Ceram. Int., 2022, 48, 15711–15720 CrossRef CAS.
Footnote |
| † Electronic supplementary information (ESI) available. See DOI: https://doi.org/10.1039/d2ta09395b |
| This journal is © The Royal Society of Chemistry 2023 |

