
 Open Access Article
 This Open Access Article is licensed under a Creative Commons Attribution-Non Commercial 3.0 Unported Licence
Effects of the diphenyl ether additive in halogen-free processed non-fullerene acceptor organic solar cells†
Lorenzo
Di Mario
 a,
David
Garcia Romero
a,
Meike J.
Pieters
a,
Fabian
Eller
b,
Chenhui
Zhu
c,
Giovanni
Bongiovanni
d,
Eva M.
Herzig
b,
Andrea
Mura
d and
Maria A.
Loi
*a
a,
David
Garcia Romero
a,
Meike J.
Pieters
a,
Fabian
Eller
b,
Chenhui
Zhu
c,
Giovanni
Bongiovanni
d,
Eva M.
Herzig
b,
Andrea
Mura
d and
Maria A.
Loi
*a
aZernike Institute for Advanced Materials, University of Groningen, Nijenborgh 4, Groningen 9747 AG, The Netherlands. E-mail: m.a.loi@rug.nl
bDynamics and Structure Formation – Herzig Group, Institute of Physics, University of Bayreuth, Universitätsstraße 30, Bayreuth 95447, Germany
cLawrence Berkeley National Laboratory, Advanced Light Source, Berkeley, CA 94720, USA
dDipartimento di Fisica, Università degli Studi di Cagliari, Monserrato I-09042, Italy
First published on 16th January 2023
Abstract
The development of an environmentally friendly fabrication process for non-fullerene acceptor organic solar cells is an essential condition for their commercialization. However, devices fabricated by processing the active layer with green solvents still struggle to reach, in terms of efficiency, the same performance as those fabricated with halogenated solvents. The reason behind this is the non-optimal nanostructure of the active layer obtained with green solvents. Additives in solution have been used to fine-tune the nanostructure and improve the performance of organic solar cells. Therefore, the identification of non-halogenated additives and the study of their effects on the device performance and stability are of primary importance. In this work, we propose the use of diphenyl ether (DPE) as additive, in combination with the non-halogenated solvent o-xylene, to fabricate organic solar cells with a completely halogen-free process. Thanks to the addition of DPE, a best efficiency of 11.7% have been obtained for the system TPD-3F:IT-4F, an increase over 15% with respect to the efficiency of devices fabricated without additive. Remarkably, the stability under illumination of the solar cells is also improved when DPE is used. The addition of DPE has effects on the molecular organization in the active layer, with an enhancement in the donor polymer ordering, showing a higher domain purity. The resulting structure improves the charge carrier collection, leading to a superior short-circuit current and fill factor. Furthermore, a reduction of the non-radiative recombination losses and an improved exciton diffusion, are the results of the superior molecular ordering. With a comprehensive insight of the effects of DPE when used in combination with a non-halogenated solvent, our study provides an approach to make the fabrication of organic solar cell environmentally friendlier and more suitable for large scale production.
Introduction
Organic solar cells (OSCs), based on the combination of polymer donors with small molecule acceptors, have seen in the last few years a surge in power conversion efficiency (PCE), driven by the development of novel non-fullerene acceptors (NFA), which, compared to fullerene derivatives, offer complementary light absorption and well-matched energy levels with the polymer donors.1,2 Efficiency values have already surpassed what is considered as the threshold for commercialization, with record PCE above 19%.3–6 Therefore, the new challenge for the scientific community is the improvement of the stability and of the fabrication process, in order to allow large scale production of these devices.7In solution-processed OSCs, the active layer deposition relies on the preparation of a solution containing both the donor and acceptor materials, in order to obtain the formation of a bulk heterojunction (BHJ) layer upon casting. The solvent employed to prepare the solution regulates the purity and crystallinity of donor- and acceptor-rich domains8,9 which can dramatically affect the nanostructure of the BHJ, and thus the performance of the final devices. This sets strict requirements for the selection of the solvent, which can be challenging to meet. Currently, the OSCs with the best performance are all obtained using halogenated solvents (e.g. chloroform, chlorobenzene, dichlorobenzene).4–6 Despite their proven effectiveness for the processing of the active layer in OSCs, halogenated solvents are toxic and harmful for the environment and therefore they are not suitable for industrial application. Finding green solvents able to guarantee device performance comparable to those obtained with halogenated solvents is crucial for the commercialization of OSCs.10,11 In the last few years, several halogen-free solvents (e.g. o-xylene, tetrahydrofuran, anisole, carbon disulfide, limonene) have been reported to successfully work for the fabrication of OSCs, although device performance is still lagging behind in comparison with the one obtained with the halogenated counterpart.12–15 While many donor and acceptor materials show a good solubility in non-halogenated solvents, the optimal nanostructure of the BHJ is hardly achieved when they are employed.
A simple and effective method to control the aggregation of donor and acceptor materials, in order to promote an optimal structure of the BHJ, consists in the use of solvent additives. Since their first successful use, strong efforts have been devoted to define the criteria for the selection of proper additives and to identify the most promising ones for the processing of OSCs of various composition.16,17 As happened for the solvents, the first effective additives that have been identified were halogenated additives. 1,8-Diiodooctane (DIO) and 1-chloronaftalene (CN) are the most widely used solvent additives and their effects on BHJ nanostructure, device efficiency and stability have been thoroughly studied.18–20 While those additives are often reported to improve the device performance also when OSCs are fabricated using green solvents,13,14 their employment can hinder the compatibility with large scale production. Therefore, finding non-halogenated additives for OSCs, and investigating their effects, represents a further step toward OSCs commercialization.21
The use of diphenyl ether (DPE) as non-halogenated additive has been reported in the fabrication of diverse OSCs, showing his effectiveness in devices using fullerenes as acceptors, where improvements have been correlated with an effect of DPE on the polymer donor crystallization.22–25 More recently, DPE has also been used in the fabrication of OSCs with NFAs, both in bulk- as well as planar-heterojunction active layer.26–29 Despite those promising results, a fundamental understanding of the complex interaction between DPE, solvents, polymer donors and non-fullerene acceptors is still missing and most of the knowledge related to the effects of DPE as additive still relies on what was observed in systems using fullerene derivatives as acceptors. Additionally, DPE has been mostly used in combination with halogenated solvents and its use with green solvent is scarcely reported.26,27,30 Finally, the effects of DPE on the stability of OSCs has not yet been investigated, although it is widely reported that other additives remain in the active layer, with detrimental effects for the device stability.31–33
In this work, we demonstrate that the use of the non-halogenate DPE as additive, in combination with a non-halogenated solvent, improves simultaneously the performance and the stability of NFA-OSCs. The OSCs were fabricated blending together the polymer poly[2,2′-[4,8-bis[4-fluoro-5-(2-hexyldecyl)-2-thienyl]benzo[1,2-b:4,5-b′]dithiophene-2,6-diyl]-2,5-thiophenediyl(5,6-dihydro-5-octyl-4,6-dioxo-4H-thieno[3,4-c]pyrrole-1,3-diyl)-2,5-thiophenediyl] (TPD-3F) and the small molecule 3,9-bis(2-methylene-((3-(1,1-dicyanomethylene)-6,7-difluoro)-indanone))-5,5,11,11-tetrakis(4-hexylphenyl)-dithieno[2,3-d:2′,3′-d′]-s-indaceno[1,2-b:5,6-b′]dithiophene (IT-4F). We used o-xylene as solvent and we investigated the effects of DPE as additive, depositing the active layer by both spin coating and blade coating.
Solar cells fabricated with the addition of DPE achieved a maximum PCE of 11.7%, with an improvement of over 15% compared with devices without additive. The operational stability of the solar cells is also improved when DPE is used, with devices able to preserve 73% of their initial efficiency after 150 h under constant illumination, where only 57% of the efficiency is maintained in devices fabricated without additive. In the DPE treated devices, the increase in Jsc and in FF, is the result of an improved charge carrier collection, especially when photons are absorbed by the donor. The consequence of the interaction of DPE with the donor molecules were investigated by Grazing-Incidence Wide-Angle X-ray Scattering (GIWAXS) measurements, which revealed how the additive leads to a higher ordering of the polymer molecules, inducing edge-on orientation in comparison to the dominantly face-on presented in the blend without additive. Photoluminescence and fast transient absorption measurements further support the correlation between the structural changes and device performance, showing a reduction of non-radiative recombination losses, together with an improved exciton diffusion. In particular, the increased exciton diffusion points towards a reduced energetic disorder, as result of the superior molecular ordering of the donor when DPE is used as an additive. The reduced energetic disorder not only promotes better device performance but is also the reason for the improved device stability.
Results and discussion
We fabricated OSCs using TPD-3F and IT-4F as donor and acceptor, respectively. Fig. 1a shows the chemical structures of the two molecules, together with the device structure used (Fig. 1b). The organic blend of donor and acceptor was spin coated starting from a solution in o-xylene with diphenyl ether (DPE) as additive. A solution without the additive was used to fabricate reference devices, with the same structure and employing the same processing parameters. Furthermore, for comparison, devices were fabricated with the commonly-used halogenated additive 1,8-diiodooctane (DIO). Device performance and characterizations of films made using DIO are reported in the ESI.†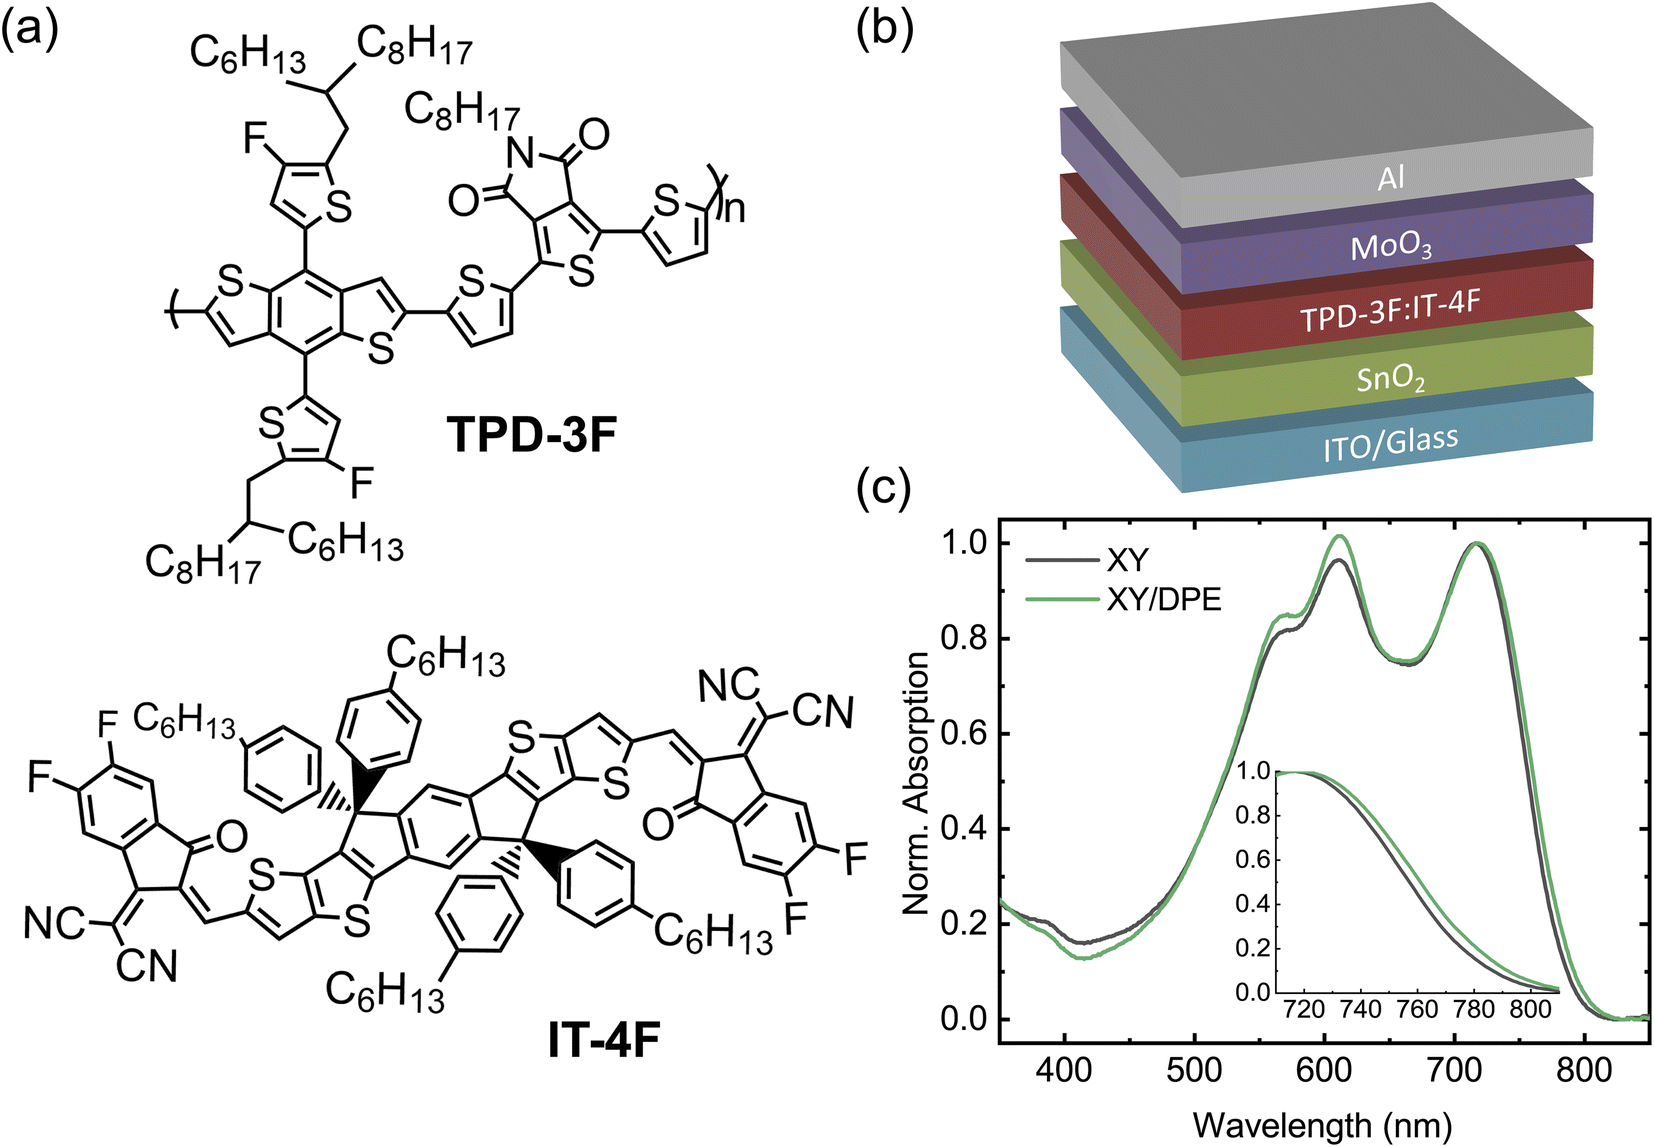 | ||
| Fig. 1 (a) Chemical structures of the polymer donor TPD-3F and the non-fullerene acceptor IT-4F. (b) Schematic of the device structure used in this work. (c) Absorption spectra of TPD-3F:IT-4F blend films cast from o-xylene without additive and with 3 wt% of DPE. The inset shows a zoom-in of the absorption onset. | ||
Normalized UV-Vis absorption spectra of blend films spin coated from solution with and without the use of DPE (Fig. 1c) show the characteristic absorption features of TPD-3F with peaks around 560 and 610 nm, and IT-4F with a peak at 720 nm.34,35 The most noteworthy change in the absorption spectrum, due to the use of DPE, is an increased absorption in the spectral range of the donor material with respect to the peak of the acceptor, which suggests an effect of the additive in the formation of the donor-rich domains. A closer look at the absorption peak of the acceptor, as reported in the inset of Fig. 1c, reveals a small redshift of the absorption onset when DPE is used. Such effect is often observed when additives are used for non-fullerene acceptor OSCs and is associated with a higher ordering of the acceptor-rich domains.36,37 Overall, the analysis of the absorption spectra suggests changes in the BHJ layer following the use of DPE, which are compatible with an improved molecular ordering in both donor-rich and acceptor-rich domains. This is consistent with an increased phase purity in the BHJ layer, since donor–acceptor intermixing generally hinder a proper ordering.
In Fig. 2 the performance of solar cells fabricated by spin coating the blend film with and without the addition of DPE is compared. J–V characteristics under illumination of the two best devices are reported in Fig. 2a, while Table 1 and Fig. S1† report a summary of the photovoltaic parameters obtained over multiple batches of devices. Devices fabricated with the use of DPE show superior photovoltaic performance, with a maximum efficiency of 11.7%, which represents an improvement of more than 15% over the best values obtained without additive. The improvement is the result of an increased Jsc and FF, both parameters that are strongly affected by the molecular ordering and phase purity in the BHJ. A reduction of the Voc is observed for devices fabricated adding DPE. This result correlates well with the redshift of the absorption spectrum and is ascribed to a narrowing of the acceptor energy gap due to an increased crystallinity.37
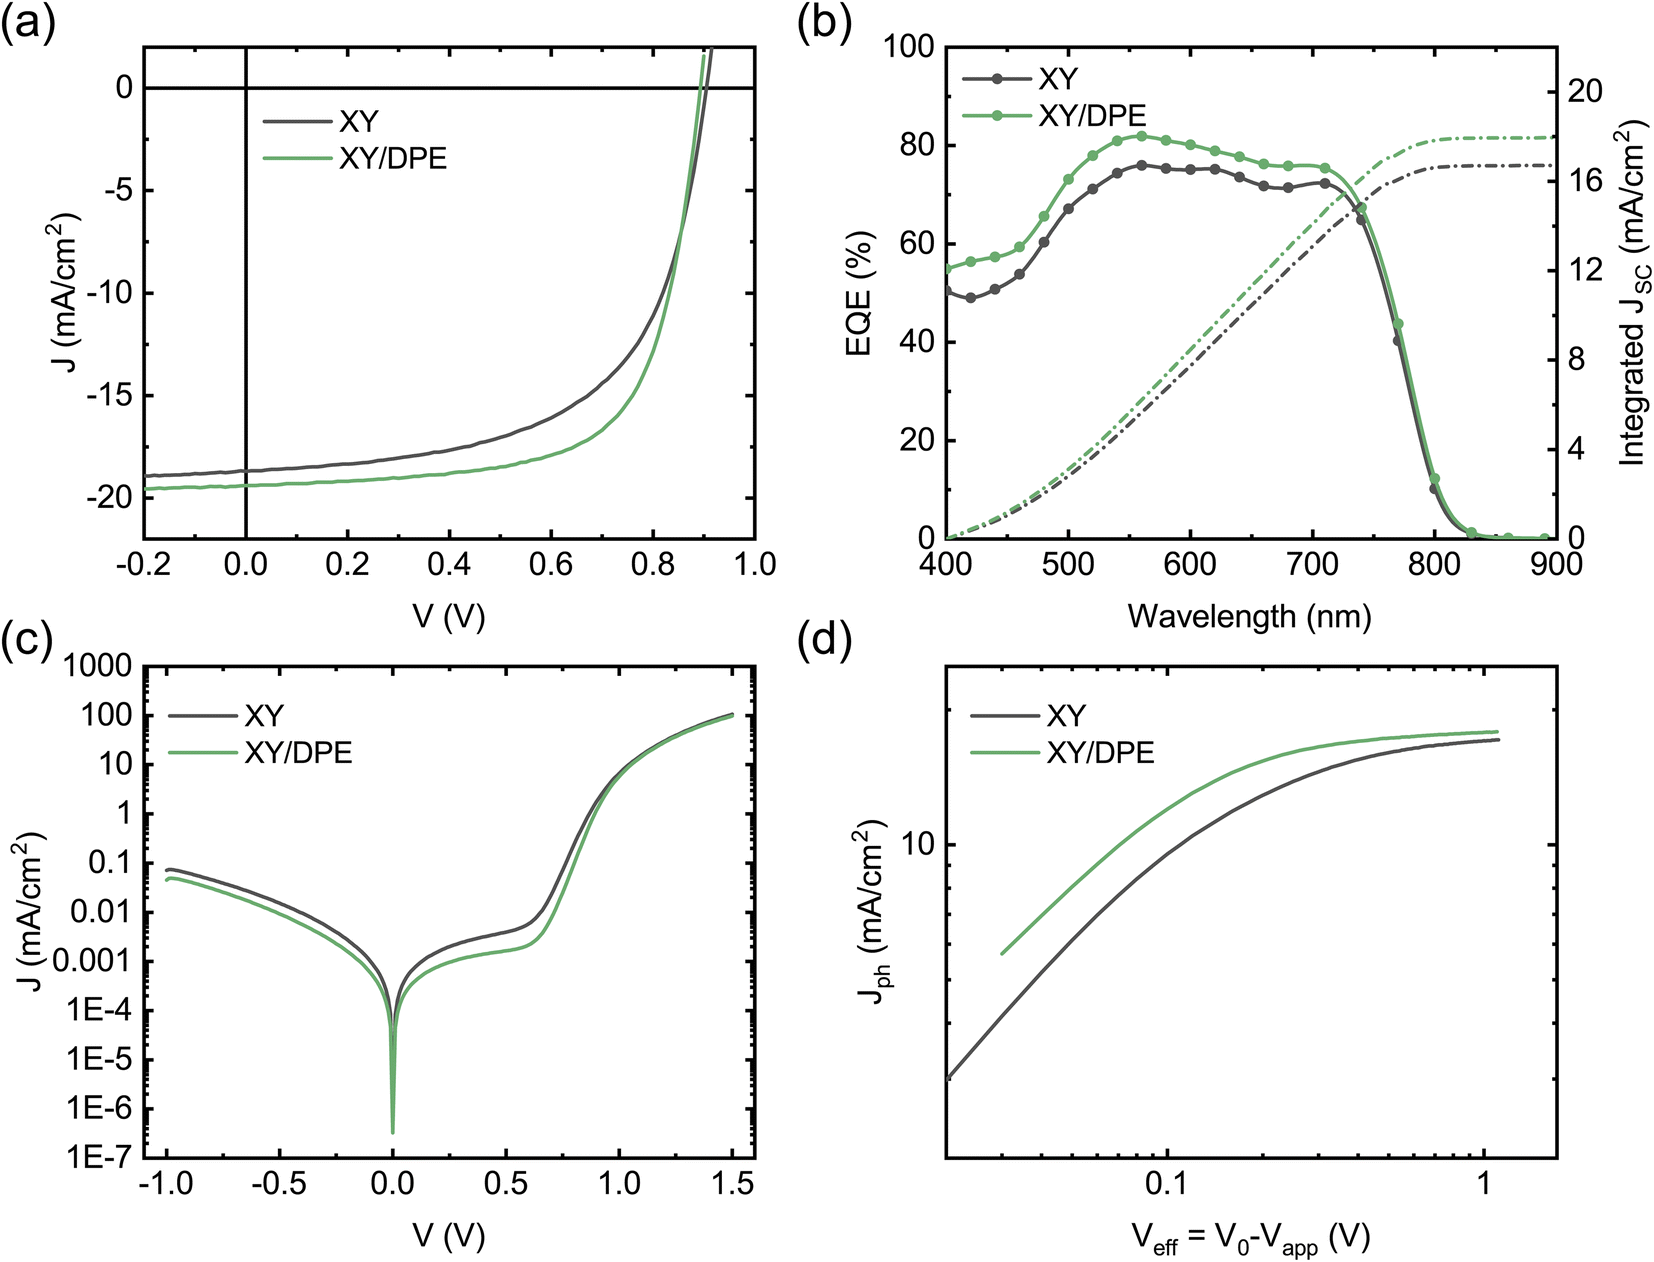 | ||
| Fig. 2 Electrical characteristics of optimized solar cells, fabricated by spin coating from a o-xylene solution without additive and with 3 wt% of DPE: (a) J–V curves under illumination (AM 1.5, 100 mW cm−2); (b) EQE spectra and integrated Jsc; (c) J–V curves in dark condition; (d) Jph as a function of Veff. | ||
| Solution | V oc (V) | J sc (mA cm−2) | FF (%) | PCE (%) |
|---|---|---|---|---|
| a Devices with active area of 10 mm2. b Devices with active area of 4 mm2. | ||||
| XYa | 0.936 (0.935 ± 0.006) | 16.49 (16.52 ± 0.35) | 62.66 (60.21 ± 2.66) | 9.67 (9.30 ± 0.29) |
| XY + 3% DPEa | 0.922 (0.921 ± 0.004) | 17.75 (17.35 ± 0.32) | 66.05 (63.93 ± 1.58) | 10.81 (10.20 ± 0.41) |
| XYb | 0.905 (0.905 ± 0.002) | 18.70 (18.59 ± 0.11) | 59.77 (59.50 ± 0.58) | 10.11 (9.98 ± 0.12) |
| XY + 3% DPEb | 0.893 (0.892 ± 0.004) | 19.39 (19.29 ± 0.20) | 67.49 (66.75 ± 0.50) | 11.68 (11.50 ± 0.18) |
OSCs have also been fabricated casting the active layer by blade coating and their performance is shown in Fig. S2.† Despite the different deposition method, the addition of DPE leads to similar changes in Jsc, FF and Voc as those observed when spin coating is employed. Remarkably, when blade coating is used, the performance of devices without additive are poorer while devices with DPE are able to achieve performance comparable with spin coated devices.
Comparing the performance of devices fabricated with DPE with those of devices fabricated with DIO, as shown in Fig. S1,† both additives induce similar effects on the photovoltaic parameters. However, while DIO improves the performance of the devices with respect to those fabricated without additive, the overall effect on the efficiency is below 5% and for all photovoltaic parameters the improvement is less significant than with DPE.
To better understand the origin of the increased Jsc in devices fabricated using DPE, we measured the external quantum efficiency (EQE) (Fig. 2b). The value of the Jsc calculated from the EQE spectra is consistent with that extracted from the J–V curves. Devices with and without the additive exhibit similar EQE spectral shape with differences in the absolute values. While for devices fabricated with DPE a maximum EQE of 82% is measured, without the additive only 75% is reached. To better point out the differences of samples fabricated with and without additive, the difference between the two EQE spectra is displayed in Fig. S3.† The most significant changes are observed in the spectral range of absorption of the TPD-3F, which is in agreement with what has been discussed for the absorption spectra (Fig. 1c).
Fig. 2c shows the J–V characteristics of the solar cells measured in dark conditions. Devices fabricated using DPE are characterized by lower shunt current and diminished series resistance, which is consistent with the higher FF measured under illumination. The reduced leakage current can be explained by a slower drying of the organic film after spin coating, due to the high boiling point of the additive, which leads to a more compact film. However, the lower series resistance hints at an improved BHJ nanostructure and, thus, at an increased charge carrier collection. This is confirmed by the study of the photocurrent Jph as function of the effective voltage Veff (Fig. 2d). Jph is defined as the difference between light and dark current densities, while Veff is the difference between the voltage V0 at which dark and light current densities compensate and the applied voltage Vapp. For large values of Veff, the photon harvesting is maximized and Jph reaches a saturation value. Devices fabricated adding DPE reach a saturation current of 17.88 mA cm−2, which is higher than the 17.15 mA cm−2 of devices fabricated without additive. This indicates an increased photon harvesting, which is in agreement with absorption and EQE spectra and points towards an improved nanostructure of the BHJ as result of the use of DPE. From the ratio between Jph and the saturation current density at maximum power point conditions, it is possible to estimate the charge carrier collection probability Pcoll.38 A remarkable difference is observed on the collection probability with and without the additive, with an increase from 77.6% to 83.8% when DPE is used, which hint at a more favorable interpenetrating network of donor and acceptor and a better charge transport.
Charge carrier transport and collection were also investigated by impedance spectroscopy and the results are displayed in the Nyquist plot in Fig. 3, together with the best fits of the experimental data. Devices fabricated either with or without the use of DPE, show a single semicircle in the Nyquist plot and, thus, their behavior can be fitted assuming a single RC component. The equivalent circuit used for the fitting is shown in Fig. 3 as inset and the values obtained for the different components can be found in Table S1.† As expected from the results previously discussed, the component Rp, which mainly represents the resistance of the organic layer, is reduced by the use of DPE, as further indication of the improvement in charge transport. The constant phase element (CPE) is a non-ideal capacitor, which considers dispersive processes, caused for instance by inhomogeneities in the BHJ. The dispersion parameter CPE-P (ideally equal to 1), is similar for devices fabricated with and without the use of DPE, suggesting no effects of the additive on the homogeneity of the film, which is an important aspect for the scaling up of the fabrication process. Furthermore, the higher RC time constant for devices fabricated using DPE with respect to the one of those without additive is an indication of longer charge carrier lifetimes.39 Finally, the series resistance Rs, which takes into account the resistance of contacts, interlayers and interfaces, is also remarkably reduced in the presence of DPE. Considering that there are no differences in the device structure, the observed change in Rs indicates the effect of the additive on the active layer and therefore also on the resistance at the interfaces. As reported in the case of DIO,18,20 the use of an additive for the active layer can affect the distribution of donor and acceptor in the direction perpendicular to the substrate, with the result of a higher concentration of one of the two components at the interface with the transport layer. While such a gradient of concentration of donor and acceptor along the film thickness is challenging to prove,40 it could explain the significant difference in Rs observed.
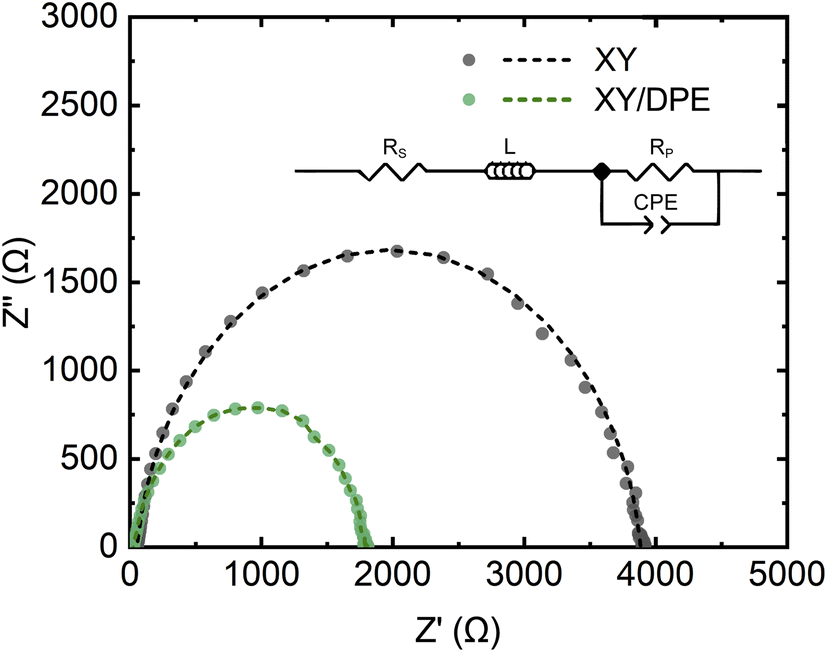 | ||
| Fig. 3 Nyquist plot of solar cells fabricated with and without DPE. Experimental data (dots) and best fits (dash lines). Inset: equivalent circuit used to fit the experimental data. | ||
To conclude the analysis of the effect of DPE on device performance, the stability of solar cells was tested, and the results are displayed in Fig. 4. Fig. 4a shows the operational stability of solar cells under illumination at the maximum power point. Solar cells fabricated adding DPE are characterized by an improved stability, preserving the 73% of their initial efficiency after 150 hours, while devices without additive maintain only the 57% of their efficiency. Looking at the decay dynamics, both solar cells have an initial rapid loss of performance, called burn-in, followed by a more gradual and significantly slower loss. The main difference in the stability of devices fabricated with and without the use of DPE is in the burn-in phase. For devices fabricated using DPE the burn-in lasts few hours and accounts for a loss in performance of around 5%. On the other hand, devices fabricated without additive have a burn-in phase of more than 20 hours, in which the efficiency drops below 80% of the initial value. While the origin of the burn-in in NFA-OSCs is still debated, morphological instabilities and disorder-induced losses have been identified as two of the main factors determining this phenomenon.41 Morphological instabilities arise when the BHJ nanostructure that is achieved after casting and post-processing is not the most thermodynamically stable. In this condition, the exposure to light provides enough energy to drive an evolution toward a more stable nanostructure. This often implies a de-mixing of the two blend components, which leads to performance reduction in the devices. Since morphological instabilities are thermodynamically driven, heating the devices has a similar effect as light exposure. Thus, operational stability and thermal stability measurements are expected to return similar results. In Fig. 4b the thermal stability at 120 °C is reported for the two types of devices. Differently from the results with light exposure, under thermal stress solar cells with and without additive show comparable behaviors. This suggests that, despite the presence of thermodynamic instability, the difference in operational stability between device with and without DPE could arise from a different impact of disorder-induced losses. An increase in energetic disorder and, thus, in disorder-induced losses is generated in OSCs by the light exposure due to photochemical reactions in the BHJ.42,43 An higher molecular ordering of donor and acceptor is reported to reduce the sensitivity to the increased energetic disorder.44–46 Therefore, the improved stability when DPE is used could find an explanation in an increased molecular ordering in the BHJ with respect to when the additive is not used.
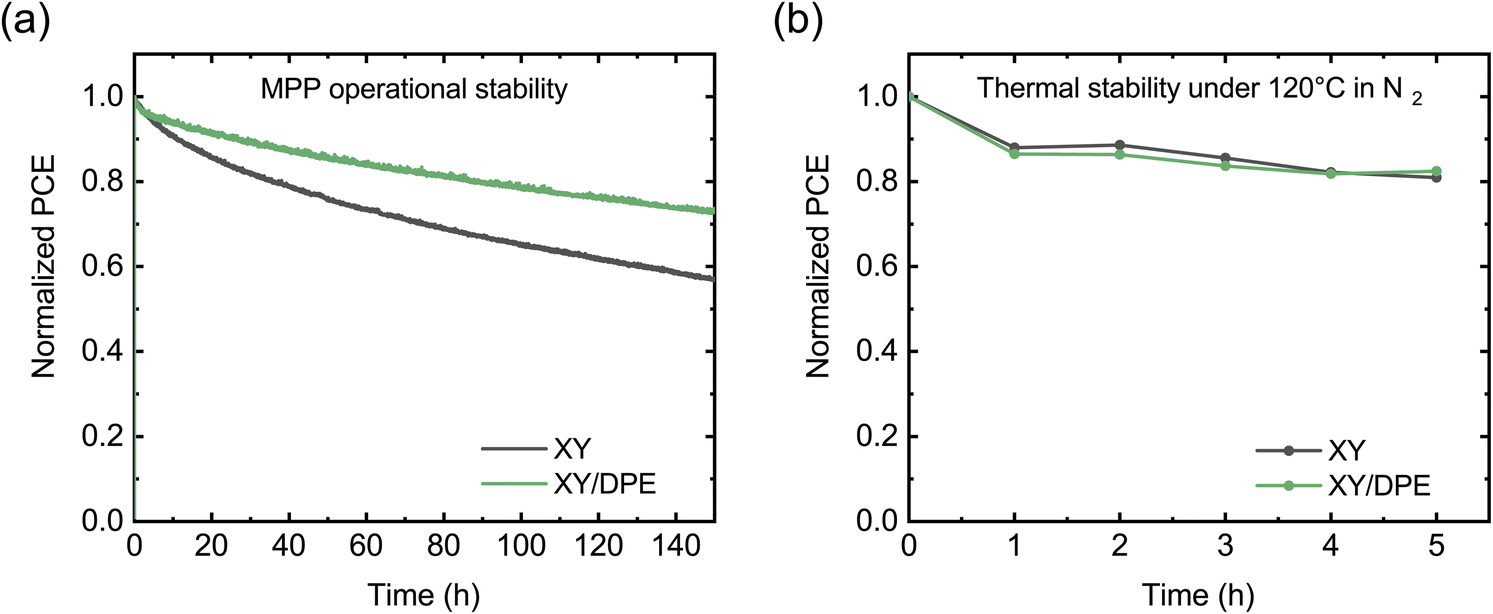 | ||
| Fig. 4 Stability of solar cells fabricated casting the blend film from a solution without additive and with DPE: (a) stability in operation measured at maximum power point (MPP) under continuous illumination (AM 1.5, 100 mW cm−2); (b) thermal stability measured after annealing the solar cells at 120 °C in N2 atmosphere. | ||
The stability of solar cells fabricated using DIO has also been tested and is displayed in the ESI (Fig. S4†). The operational stability in Fig. S4a† shows the same behavior as for devices without additive, proving that the improvement observed with DPE, strongly correlates with the characteristics of this specific additive. However, the often reported detrimental effects of DIO in solar cell stability due to photoinduced ionization33,47,48 is not present in our measurements, as an UV filter was used. On the other hand, as can be seen in Fig. S4b,† devices fabricated using DIO show worse stability under thermal stress than devices with DPE and without additive. While an in-depth study of the mechanism that affect the stability of OSCs in the presence of different additives is out of the scope of this work, the comparison between DIO and DPE points to the superior stability of the devices fabricated with DPE, which is a crucial aspect for applications.
Due to the addition of DPE, both efficiency and stability of the solar cells show improvements, which derive from changes in BHJ nanostructure and in the molecular ordering of donor and acceptor molecules. To further investigate the variation induced by DPE in the nanostructure, Grazing Incidence Wide-Angle X-ray Scattering (GIWAXS) measurements have been performed on the active layers deposited on the glass/ITO/SnO2 stack used for devices. Fig. 5 shows the measurements performed on the two active layers, while Fig. S5 and S6 in ESI† show the results of experiments on neat TPD-3F and IT-4F films, respectively. Only intermolecular separations bigger than the π–π stacking are here discussed, since a strong scattering from the layer stack under the active layer at q values similar to the π–π stacking makes impossible to isolate the peak. The measurements on neat donor (Fig. S5†), with and without additive, show a peak in the direction parallel to the substrate at around qxy = 0.247 Å−1 (d = 25.4 Å), which points to a preferential face-on orientation of the polymer with respect to the substrate. Differences in peak shape with and without the use of DPE are negligible. On the other hand, the use of DPE as additive results in an increase of the peak amplitude and peak area of around 37%, in comparison with the film prepared without additive. In addition, a weaker but similar TPD-3F lamellar peak seems to be induced by the DPE in the direction perpendicular to the substrate, as shown in Fig. S5d† by the increased scattering intensity for qz values between 0.2 and 0.3 Å−1. Overall, the type of ordering in neat TPD-3F films, with and without DPE, appears to be the same. Nonetheless, with the addition of DPE, more TPD-3F molecules are in an ordered phase and, additionally to the dominant face-on orientation, a fraction of edge-on orientation occurs.
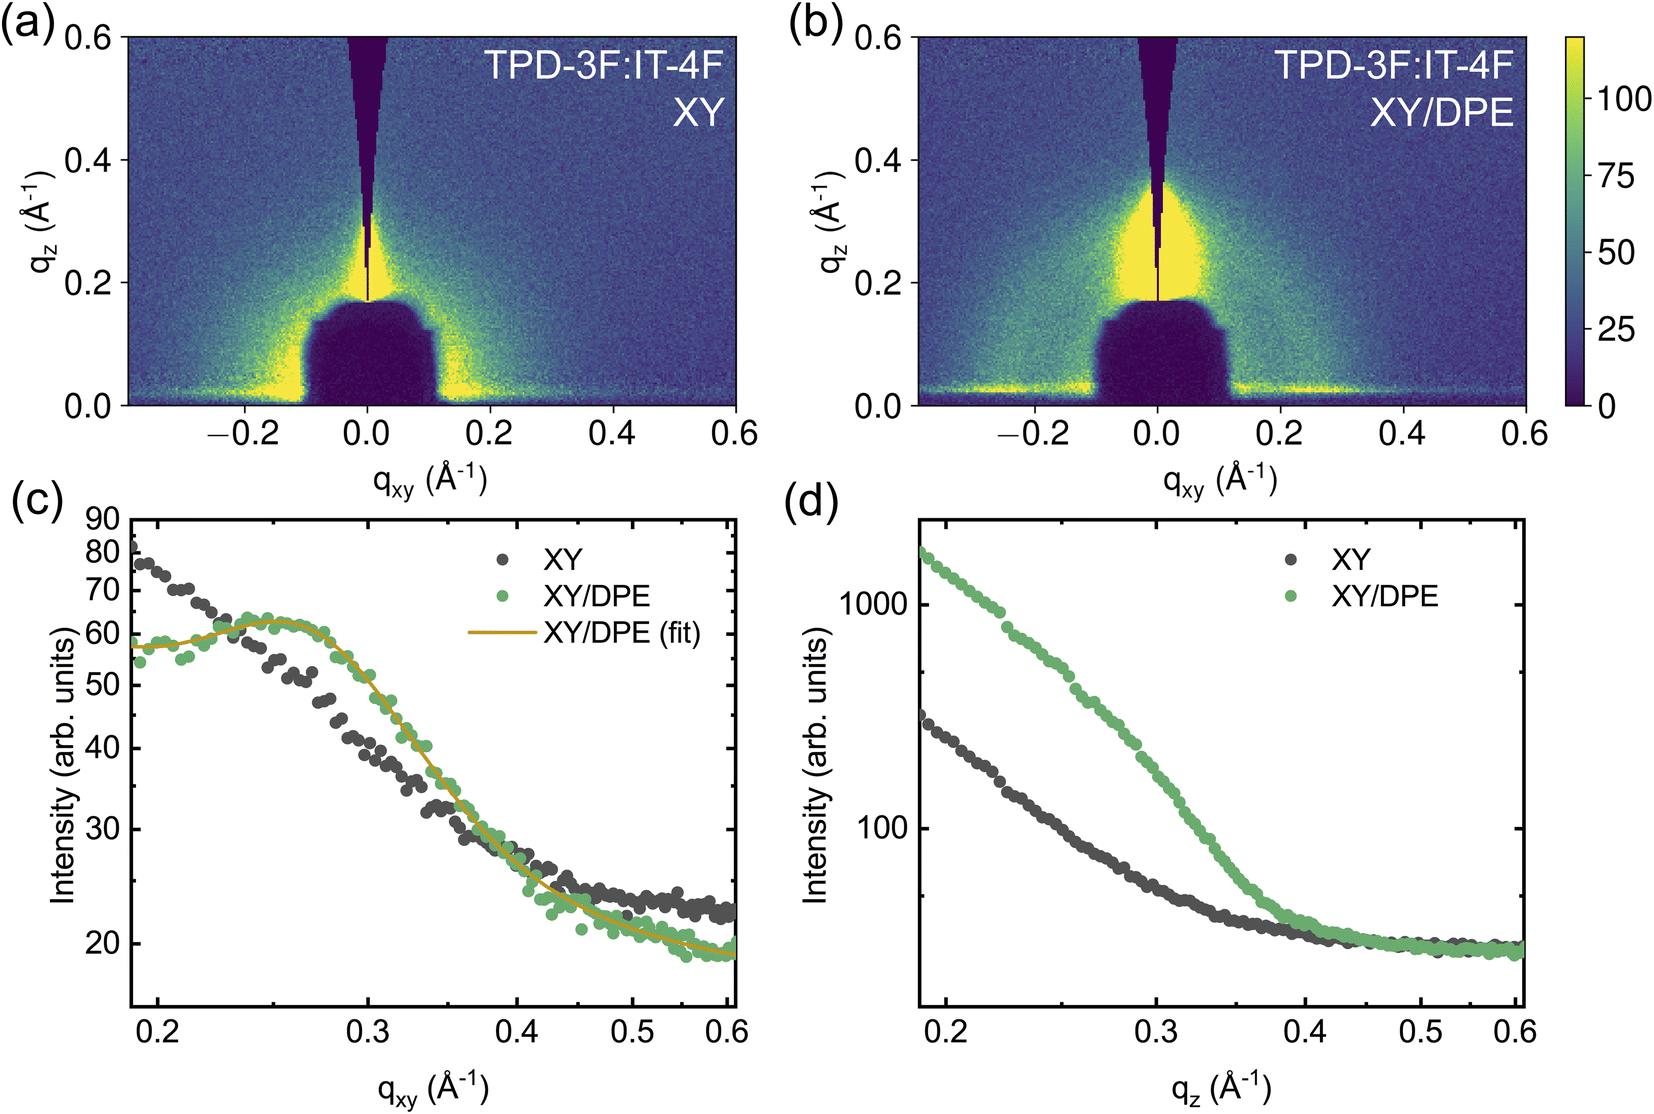 | ||
| Fig. 5 2D GIWAXS data and cuts of measurements on TPD-3F:IT-4F blend films cast with and without the addition of DPE: 2D false-color maps for a blend film without additive (a) and with additive (b); corresponding in-plane (c) and out-of-plane (d) line cuts. | ||
In the IT-4F films (Fig. S6†), no signs of well-defined nanostructure are observed when the film is spin coated from a solution without additive. However, when DPE is used, a clear peak appears in the direction perpendicular to the substrate, at about qz = 0.414 Å−1. In the films of neat donor and acceptor the addition of DPE increases the amount of material possessing nanostructure. Since not only existing nanostructures are strengthened or reoriented, but new order appears with the addition of DPE, the effect of the additive is not limited to an increased drying time, but most likely also to an altered solubility.
The effects of the addition of DPE becomes even more important for the blend films, as can be seen in Fig. 5. Even though the neat TPD-3F film cast from a solution without additive exhibits a clear nanostructure, the TPD-3F:IT-4F blend film does not show any signs of nanostructure of the donor without the use of the additive. This suggests a strong interaction between donor and acceptor molecules, which leads to highly mixed domains and, thus, hinders the nanostructure formation of TPD-3F. The addition of DPE enables nanostructure formation, with the appearance of a TPD-3F peak in the direction parallel to the substrate (Fig. 5c). Compared to the peak shown by the film of neat donor, an increase of about 90% of the peak width points towards a higher disorder in the blend. At the same time the peak position shifts to qxy = 0.258 Å−1 (d = 24.3 Å), which corresponds to a reduction of the spacing of about 4.3% in the blend with respect to the neat donor film. The addition of DPE also affects the ordering in the perpendicular direction, where a significant enhancement in scattering is observed in the film with the additive, compared to the one without (Fig. 5d). Similarly to the case of the neat donor films, such increased scattering can be correlated with an ordering of the TPD-3F in the perpendicular direction, with structure size analogous and larger with respect to that observed in the parallel direction. Therefore, with the addition of DPE, the nanostructure is not only strongly enhanced, but also reoriented with a significant fraction of the TPD-3F with an edge-on orientation, additionally to the dominant face-on orientation.
The effects of DPE on the blend nanostructure are also compared to those of DIO and the results are reported in the ESI (Fig. S7†). The addition of DIO also enables the nanostructure formation of TPD-3F in the blend. Peak position and line shape in the direction parallel to the substrate are comparable to those obtained with the use of DPE, suggesting a similar quality of ordering. Comparing the blend peak amplitudes, the amplitude is higher by about 69% when DIO is used instead of DPE, indicating that the occurrence of face-on orientation is higher with the halogenated additive. On the other hand, no clear sign of edge-on orientation for the TPD-3F is observed using DIO, in contrast to DPE.
To conclude, the analysis of GIWAXS measurements indicates that both DPE and DIO lead to a stronger aggregation of the TPD-3F molecules, which we attribute to a more pronounced phase separation. The lower order of the TPD-3F nanostructure in the blend films compared to the films of neat donor points out that IT-4F is present in the donor-rich domains. This induces a loss of order at shorter distances, but also increases the packing density of the TPD-3F. The effect of DPE and DIO on the phase separation appears to be similar. Nonetheless, the addition of DIO favors only a face-on orientation of the TPD-3F while DPE also promotes edge-on orientation, on both blend and neat donor films. Similar effects on the blend nanostructure when DPE is used as additive have been previously reported for other polymers.23,24,29 In general, DPE is considered a theta solvent for polymers such as the ones used as donors in OSCs.24 This means that the polymer coils act as ideal chains in DPE, since the interaction between solvent and polymer is balanced at the theta point. The result, when DPE is used as additive, is an improved blend film nanostructure with a continuous and properly distributed polymer network, in both the directions parallel and perpendicular to the substrate, a condition that is expected to enhance charge transport and suppress non-radiative losses.23,24 As already reported in other works in literature, the use of DPE as additive can lead to a remarkable improvement of both charge carrier mobilities, a result that is consistent with the changes in nanostructure here pointed out.23,26,27
To further understand how the change in nanostructure induced by the DPE affects the charge carrier dynamics in the blend and to reveal the correlation with the device performance improvement, photoluminescence (PL) and fast transient transmission spectroscopy (FTTS) have been employed. The steady state PL spectra of blend films deposited by spin coating from a solution with and without DPE are compared in Fig. 6a. Both spectra display the typical acceptor emission, while the emission from the donor is totally quenched.34,35 Comparing the two spectra, the addition of DPE leads to slightly increased PL intensity, together with a redshift of the peak, which is consistent with that observed for the absorption spectra.
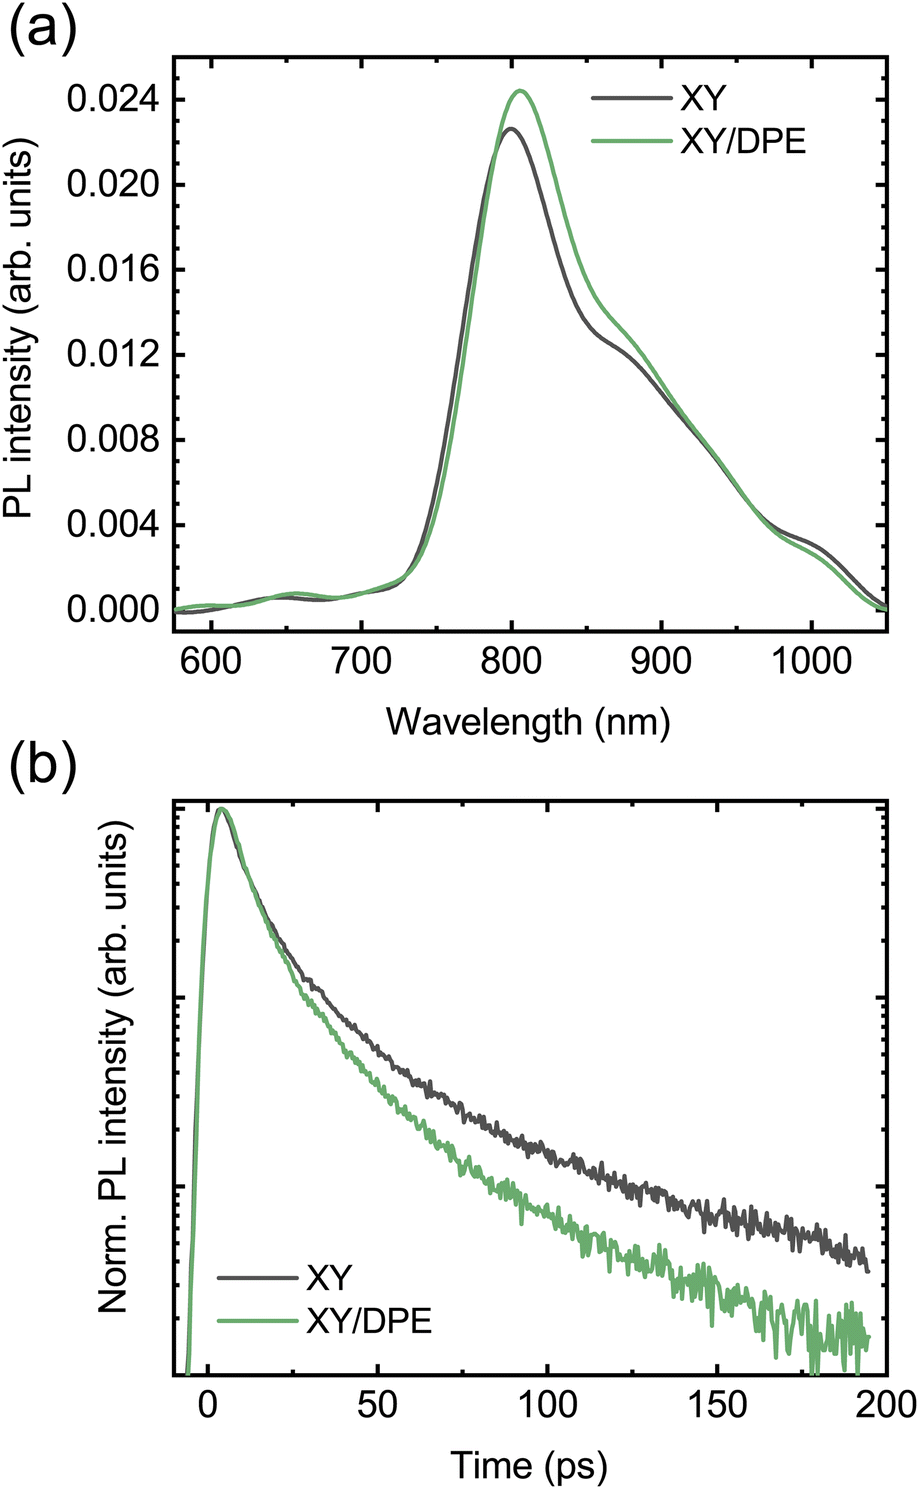 | ||
| Fig. 6 Photoluminescence measurements on TPD-3F:IT-4F blend films cast with and without the use of DPE: (a) steady-state photoluminescence; (b) decay of the PL signal at 800 nm. | ||
Moving to the time-resolved PL measurements (Fig. 6b), a faster decay of the PL intensity measured at the peak (800 nm) and, thus, a faster exciton quenching is observed in blend films processed with DPE with respect to films without additive. The time-resolved PL decays are fitted with multiexponential curves and the extracted parameters are reported in Table S2,† together with the calculated average PL lifetimes. A significantly shorter average PL lifetime is obtained when DPE is used, despite comparable time-constants in both the picoseconds and tens of picoseconds regimes. The shorter PL lifetime can be associated with an increased chance for the excitons of reaching the donor–acceptor interface to be dissociated. This can be the result of both a reduction in domain size or an increased exciton diffusion length. A reduction in domain size is unlikely considering the results of the GIWAXS characterization, which point out a higher phase purity likely associated with an increased phase separation. An increase of the exciton diffusion length can be explained by a reduced energetic disorder, which is a direct consequence of the improved ordering of the donor molecules induced by the DPE.49–51 The correlation between improved exciton dissociation and ordering of the polymer in the blend film is also consistent with the increase of the EQE in the range of absorption of the donor.
FTTS can be used to further investigate the exciton diffusion and dissociation at the sub-picosecond time scale (Fig. 7). Upon excitation with pump pulses at 700 nm, the transient spectra of films with and without DPE show similar features, as displayed in Fig. 7a and b. For both films the transient spectra are characterized by a broad band centered around 720 nm and two peaks at around 600 nm. All signals are negative in sign and are ascribed to the ground state bleaching of acceptor and donor, for the signals at 720 nm and 600 nm, respectively. Fig. S8† shows the transient spectra obtained by exciting the neat donor and acceptor films with pump pulses at 360 nm. Similar transient spectra have been reported for analogous donor:acceptor blend systems.34,36 Despite the fact that the 700 nm wavelength used to excite the blend is above the edge of absorption of the donor, located around 650 nm,34,35 a photobleaching of its ground state is observed in both blend films, confirming a fast hole transfer following the exciton generation in the acceptor. The comparison of the transient spectra at different times after excitation reveals a difference in the evolution of the donor signal and, thus, in the charge carrier dynamics, when DPE is used. In the film processed without the additive, the donor signal reaches the maximum intensity much faster in comparison with the film processed with DPE. The difference in the rise time of the bleaching of the donor signal is even more evident in Fig. 7c, where the kinetics of the signal at 564 nm are displayed for both films. This wavelength has been selected to avoid any overlap between the donor and acceptor signals (see Fig. S8†). For comparison the acceptor bleaching kinetics at 710 nm are displayed in Fig. 7d. Fitting the kinetics of the donor signal, a rise time of around 500 fs is obtained for the film without additive and of about 700 fs for the film with DPE. A slower hole transfer when comparing two different donor:acceptor systems can be associated with a slower exciton dissociation, which can lead to worse device performance. In this case, being the composition of the blend exactly the same with and without the additive, the difference in rise time should not be correlated with the energetic landscape, but most likely with the change in nanostructure induced by the DPE.52 Therefore, in agreement with the results of the GIWAXS measurements, the longer rise time hints to an increased phase separation, with bigger and more pure domains. The slight difference in hole transfer is not enough to negatively impact the overall exciton dissociation process, which is still more efficient in the blend film made with DPE, thanks to the longer exciton diffusion length.
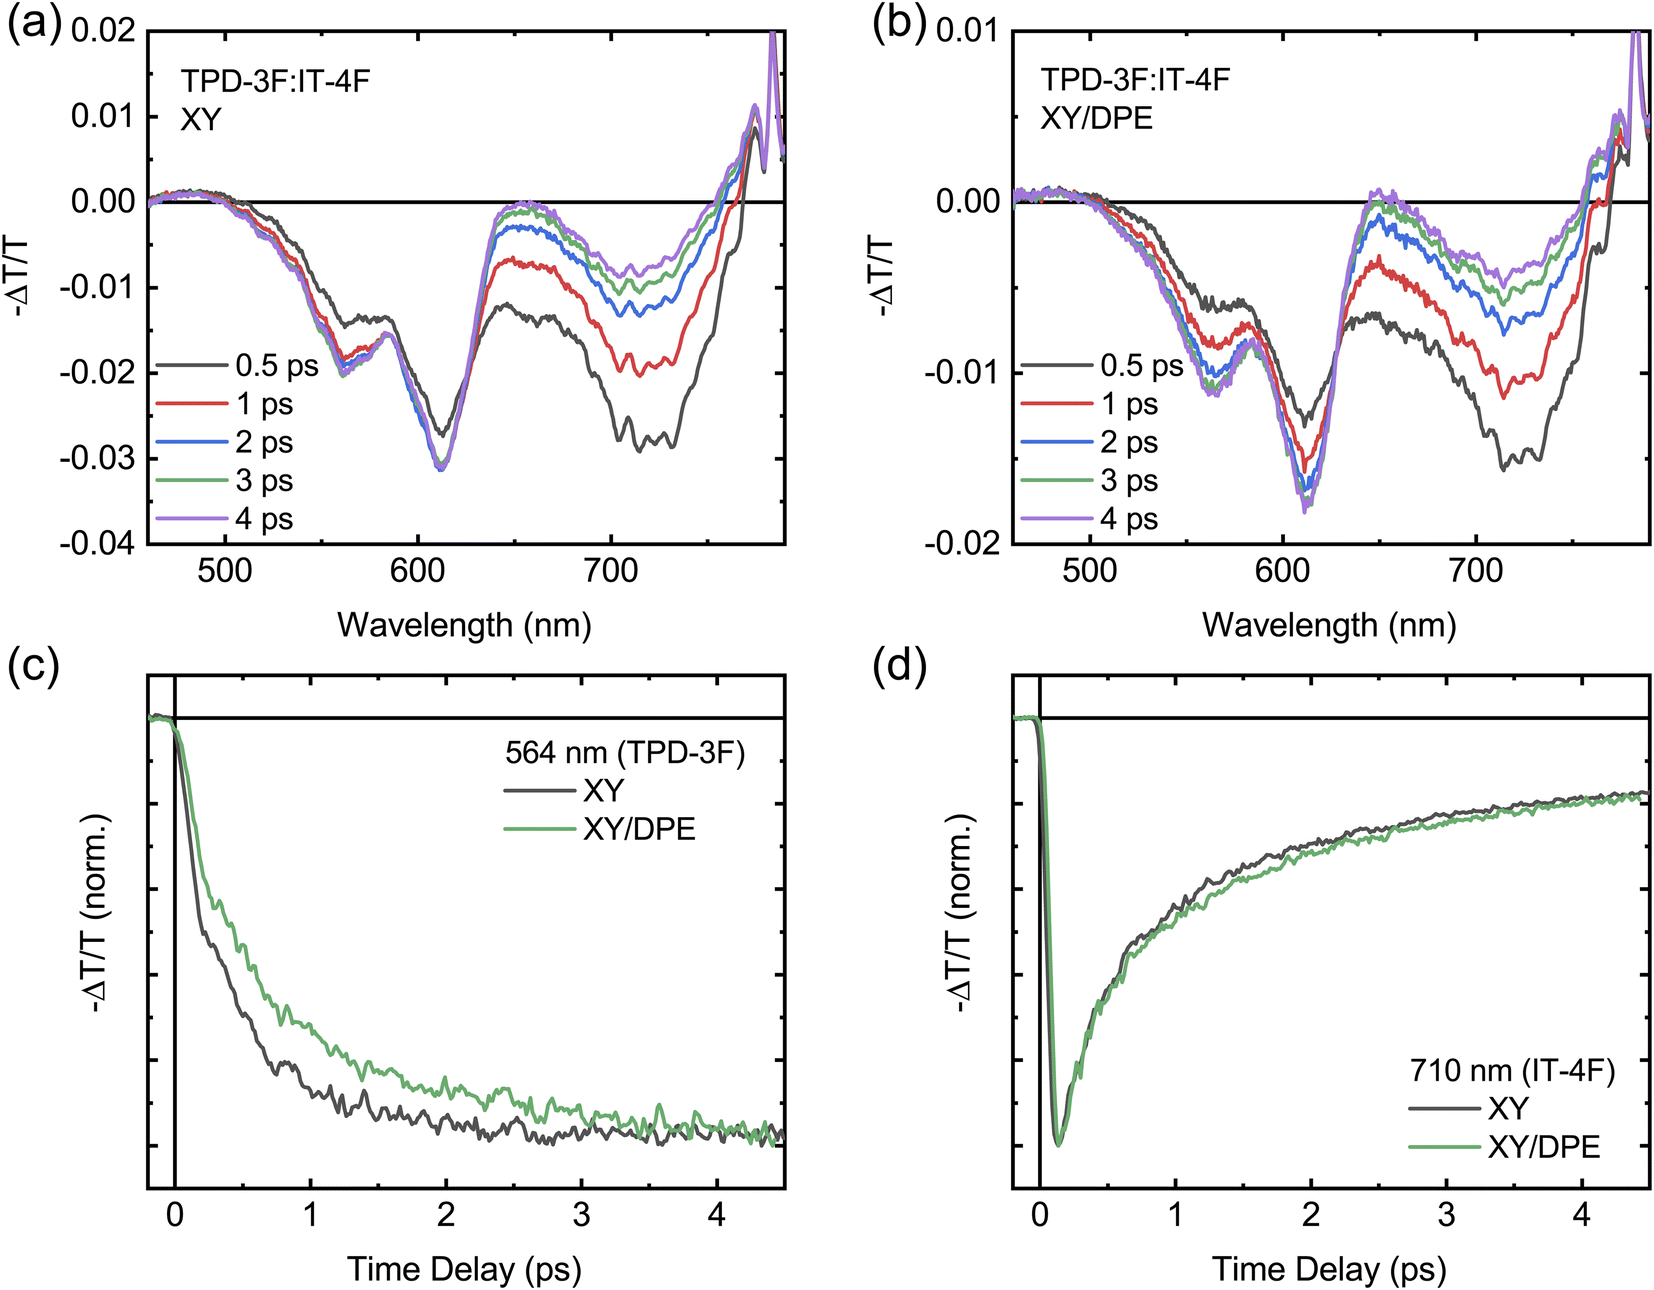 | ||
| Fig. 7 Fast transient transmission spectroscopy measurements with an excitation wavelength of 700 nm on TPD-3F:IT-4F blend films cast with and without the use of DPE in solution: transient transmission spectra acquired at different time delays for the blend film cast without additive (a) and with additive (b); kinetics of the donor (c) and acceptor (d) signals for the two blend films. | ||
In summary, the results of the optical spectroscopies further confirm how the blend nanostructure induced by the DPE leads to improved device performance, with an optimized balance between exciton dissociation and charge carrier transport, which is the result of the favorable domain size and purity.53 At the same time, the improved molecular ordering when DPE is used, promotes the exciton diffusion at the donor–acceptor interface and reduce the non-radiative recombination losses. All this contributes to increase the charge carrier collection and, thus, to reduce the non-radiative recombination losses.54
Conclusions
In conclusion, this work demonstrates the fabrication of NFA-OSCs by spin coating as well as blade coating with a fully halogen-free process, using o-xylene as solvent and DPE as additive. The addition of DPE determines an improvement above 15% of the efficiency of the solar cells, in comparison with devices fabricated without additive. A best PCE of 11.7% is obtained with DPE, as result of increases in short-circuit current and fill factor. Device performance improvements are correlated with an optimized nanostructure of the active layer induced by the additive, which increases the phase purity and promotes the ordering of the donor molecules. In particular, the improved molecular ordering in the presence of DPE, and the resulting decreased energetic disorder, is revealed to reduce non-radiative energy losses and to enhance exciton diffusion, for a more efficient charge carrier collection in the solar cells. Additionally, the reduced energetic disorder is also found to improve the operational stability of the OSCs. All these results prove the potential of DPE as additive in combination with non-halogenated solvents for the fabrication of efficient and stable NFA-OSCs on large scale.Experimental
Materials
Organic donor (TPD-3F) and acceptor (IT-4F) materials were purchased from Raynergy Tek. o-Xylene (99%) was purchased from Acros Organics. Diphenyl ether (>98%) and 1,8-diiodooctane (98%) were purchased from Sigma Aldrich. Tin oxide nanoparticles dispersion in H2O (15 wt%) was purchased from Alfa Aesar. All chemicals were used as received, without any further purification.Solar cells fabrication
Solar cells with inverted structure ITO/SnO2/TPD-3F:IT-4F/MoO3/Al were fabricated on pre-patterned glass/ITO substrates. A 5 wt% solution of tin oxide nanoparticles was prepared diluting a SnO2 dispersion with ultrapure water. The solution was kept stirring for at least 4 h and it was filtered before use. The organic blend solutions were prepared dissolving TPD-3F and IT-4F, with a concentration of 9 mg ml−1 (1![[thin space (1/6-em)]](https://www.rsc.org/images/entities/char_2009.gif) :1), in o-xylene with and without the addition of an additive. DIO was added in a concentration of 0.5 wt%, while DPE in a concentration of 3 wt%. The concentration of DPE in solution was adjusted following a systematic study on solar cells, in order to maximize their performance (see Table S3†). The blend solutions were stirred for 12 h at 120 °C and filtered before use. The pre-patterned substrates were cleaned with soapy water, deionized water, acetone and isopropyl alcohol, then dried and treated with UV/ozone for 20 min. The SnO2 solution was spin-coated at 3000 rpm for 40 s and annealed at 150 °C for 30 min in air, to obtain films of about 40 nm. The samples were then treated with UV/ozone for 20 min, before transferring them into a glove box. The blend solutions were spin-coated at 1500 rpm for 60 s, to obtain a BHJ layer of about 120 nm. After annealing at 120 °C for 10 min, the samples were transferred in an evaporator, where 10 nm of MoO3 and 100 nm of Al were sequentially evaporated at a base pressure of 10−6 mbar.
:1), in o-xylene with and without the addition of an additive. DIO was added in a concentration of 0.5 wt%, while DPE in a concentration of 3 wt%. The concentration of DPE in solution was adjusted following a systematic study on solar cells, in order to maximize their performance (see Table S3†). The blend solutions were stirred for 12 h at 120 °C and filtered before use. The pre-patterned substrates were cleaned with soapy water, deionized water, acetone and isopropyl alcohol, then dried and treated with UV/ozone for 20 min. The SnO2 solution was spin-coated at 3000 rpm for 40 s and annealed at 150 °C for 30 min in air, to obtain films of about 40 nm. The samples were then treated with UV/ozone for 20 min, before transferring them into a glove box. The blend solutions were spin-coated at 1500 rpm for 60 s, to obtain a BHJ layer of about 120 nm. After annealing at 120 °C for 10 min, the samples were transferred in an evaporator, where 10 nm of MoO3 and 100 nm of Al were sequentially evaporated at a base pressure of 10−6 mbar.
Device measurements
The J–V characteristics were measured in nitrogen atmosphere and at a controlled temperature of 295 K, using a Keithley 2400 source meter and under a simulated AM 1.5 G spectrum from a Steuernagel solar constant 1200 metal halide lamp. The light intensity was calibrated using a monocrystalline silicon solar cell (WRVS reference cell, Fraunhofer ISE). The measured current density J was corrected for the spectral mismatch. Operational stability measurements were performed keeping the solar cells under illumination and tracking their maximum power point. Thermal stability was tested annealing the solar cells at 120 °C on a hotplate for a total of 5 h and measuring their J–V characteristics every hour. All measurements were performed in a glove box, on non-encapsulated samples.The external quantum efficiency (EQE) of the solar cells was measured using a xenon lamp and a set of three filter wheels to illuminate the samples, scanning a spectral range of 400–1400 nm, at intervals of 20 nm below 680 nm and 30 nm above. After passing the filter wheels, the light was directed through a chopper and then focused on the solar cells. A lock-in amplifier (Stanford Research Systems SR830 DSP) was used to measure the photocurrent. The photon flux was calibrated before the measurements, using two Newport optical power detectors (Newport 818-SL and 818-IR). The solar cells were kept in nitrogen atmosphere during the measurements.
Impedance spectroscopy measurements
For impedance spectroscopy measurements a Solarton 1260 impedance gain-phase analyzer was used. The DC voltage was set to open circuit conditions and the AC voltage was set to 20 mV. The samples were measured fresh and the thickness of the active layers was the same for all the sample measured. The solar cells were kept in nitrogen atmosphere and in dark conditions during the measurements.GIWAXS measurements
GIWAXS measurements were performed on samples with structure ITO/SnO2/organic film, on glass substrate. Substrate cleaning and SnO2 deposition were the same as for solar cells. Blend films were spin coated and annealed as for the solar cells, starting from the same solutions. Films of neat donor and acceptor were spin coated and annealed using the same parameter as for the other samples, starting from solutions in o-xylene, with and without DPE.GIWAXS experiments were conducted at the beamline 7.3.3 at the Advanced Light Source at Lawrence Berkeley National Lab (Berkeley, USA).55 The samples were illuminated with 10 keV radiation (λ = 1.24 Å) at an incident angle (αi) of 0.1° at room temperature. The beam size was 300 μm (height) × 700 μm (width). The scattering signal was captured on a Pilatus 2M (172 μm pixel size, file format EDF, 1475 × 1679 pixels) located 274 mm from the sample.
The 2D maps are corrected by rescaled background scattering of ITO/SnO2 on glass. Using these background corrected cake cuts covering an azimuthal angle of 70–110° for the cuts in the vertical direction and 0–20° as well as 160–180° for the cuts in the horizontal direction were used to obtain the presented cuts.
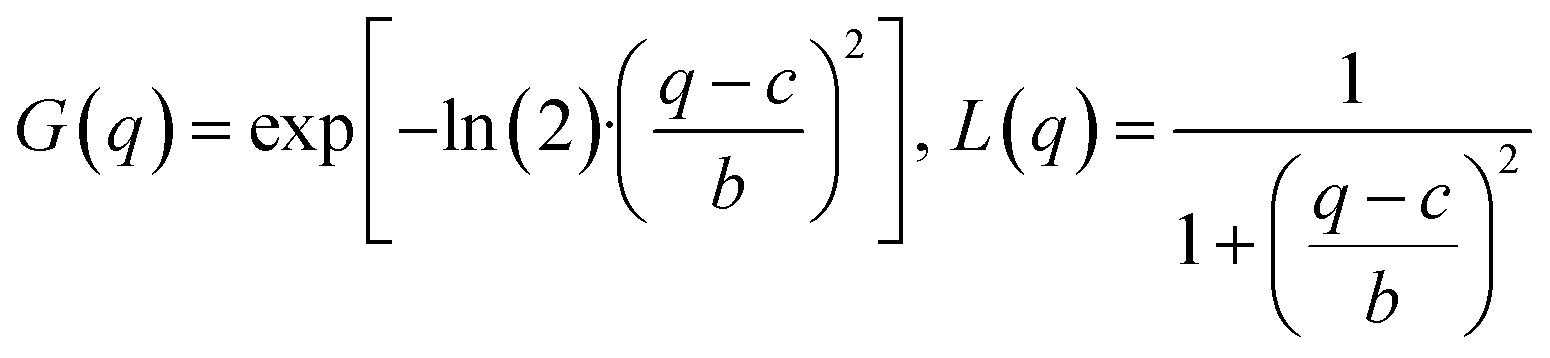
The data analysis is based on fitting the lamellar peak in the horizontal cuts. The fits are Pseudo-Voigt fits, described by the following expression:
| f(q) = A·[η·L(q) + (1 − η)·G(q)] with 0 < η < 1 |
where A is the peak amplitude, c is the peak position, 2b is the full width at half maximum of the Pseudo-Voigt peak and η the Pseudo-Voigt mixing parameter. An additional background covering small angle scattering and a constant accounting for the scattering of the substrate were included in the fitting procedure.
Photoluminescence measurements
Steady state and time-resolved photoluminescence were measured exciting the samples with the second harmonic (400 nm) of a mode-locked Ti:Sapphire laser (Coherent Mira 900), emitting at a repetition rate of 76 MHz. The laser beam was adjusted in size through an iris and then focused on the sample with a lens of 150 mm focal length. For all the measurements a laser power of 40 μW was used, which corresponds to a fluence of about 46 nJ cm−2 per pulse. The spectra were taken in reflection geometry. The PL emission from the sample was collected with an achromatic doublet to a monochromator with a 50 lines mm−1 grating. Steady-state PL spectra were acquired with a Hamamatsu C9100-13 spectral-calibrated EM-CCD camera. Time-resolved PL traces were recorded with a Hamamatsu C5680-24 picosecond streak camera, in synchroscan mode. A time resolution of 2 ps was evaluated from the scattering of the laser beam. Blend films were prepared the same way as those used for GIWAXS measurements and kept in nitrogen atmosphere during the measurements.Transient transmission spectroscopy measurements
Fast transient transmission spectroscopy was performed using as pump the output of an optical parametric amplifier (Light Conversion Topas 800), seeded by a regenerative amplifier (794 nm, 4 mJ, 1 kHz) with an integrated Ti:Sapphire oscillator (Coherent Libra). Pump pulses of 100 fs, at wavelengths of 360 nm and 700 nm have been used to excite the samples. A white light supercontinuum (450–850 nm), generated inside a transient absorption spectrometer (Ultrafast Systems Helios), was used as probe. The spot size of the focused pump on the sample was around 150 μm and the pulse energy was adjusted to be 60 nJ per pulse and 10 nJ per pulse, for the 700 nm and 360 nm wavelength, respectively. The time delay (up to 8 ns) between pump and probe have been controlled modifying the optical path of the probe through a delay line with sub micrometer spatial resolution. The organic films were spin coated on pre-cleaned quartz substrates, following the same procedure used for devices, and encapsulated with a quartz lid and epoxy glue, in order to be measured without air exposure.Conflicts of interest
The authors declare no conflict of interest.Acknowledgements
L. D. M., F. E., E. M. H. and M. A. L. acknowledge funding from SolarEraNet (No. NFA4R2ROPV). D. G. R. acknowledges the financial support from NWO organization. F. E. and E. M. H. acknowledge funding from the DFG (INST 91/443-1). F. E. thanks the Elite Study Program Macromolecular Science within the Elite Network of Bavaria (ENB) for support. Portions of this research were carried out at beamline 7.3.3 of the Advanced Light Source, which is supported by the Director of the Office of Science, Office of Basic Energy Sciences, of the U.S. Department of Energy under Contract No. DE-AC02-05CH11231. A. M. acknowledge access to research infrastructure in CeSAR—Centro Servizi di Ateneo per la Ricerca – at Università degli Studi di Cagliari and thank Dr M. Marceddu for technical assistance. L. D. M., D. G. R. and M. A. L. thank A. F. Kamp and T. Zaharia for their technical support.References
- J. Hou, O. Inganas, R. H. Friend and F. Gao, Nat. Mater., 2018, 17, 119–128 CrossRef CAS PubMed.
- A. Karki, A. J. Gillett, R. H. Friend and T. Q. Nguyen, Adv. Energy Mater., 2021, 11, 1–30 Search PubMed.
- Y. Cui, Y. Xu, H. Yao, P. Bi, L. Hong, J. Zhang, Y. Zu, T. Zhang, J. Qin, J. Ren, Z. Chen, C. He, X. Hao, Z. Wei and J. Hou, Adv. Mater., 2021, 33, 2102420 CrossRef CAS PubMed.
- K. Chong, X. Xu, H. Meng, J. Xue, L. Yu, W. Ma and Q. Peng, Adv. Mater., 2022, 34, 2109516 CrossRef CAS PubMed.
- L. Zhu, M. Zhang, J. Xu, C. Li, J. Yan, G. Zhou, W. Zhong, T. Hao, J. Song, X. Xue, Z. Zhou, R. Zeng, H. Zhu, C. C. Chen, R. C. I. MacKenzie, Y. Zou, J. Nelson, Y. Zhang, Y. Sun and F. Liu, Nat. Mater., 2022, 21, 656–663 CrossRef CAS PubMed.
- Y. Wei, Z. Chen, G. Lu, N. Yu, C. Li, J. Gao, X. Gu, X. Hao, G. Lu, Z. Tang, J. Zhang, Z. Wei, X. Zhang and H. Huang, Adv. Mater., 2022, 2204718 CrossRef CAS PubMed.
- R. Xue, J. Zhang, Y. Li and Y. Li, Small, 2018, 14, 1–24 Search PubMed.
- S. Guo, E. M. Herzig, A. Naumann, G. Tainter, J. Perlich and P. Müller-Buschbaum, J. Phys. Chem. B, 2014, 118, 344–350 CrossRef CAS PubMed.
- Z. Du, M. Mainville, J. Vollbrecht, A. L. Dixon, N. Schopp, M. Schrock, Z. Peng, J. Huang, S. Chae, H. Ade, M. Leclerc, G. N. M. Reddy and T.-Q. Nguyen, Sol. RRL, 2021, 5, 2100213 CrossRef CAS.
- S. Zhang, L. Ye, H. Zhang and J. Hou, Mater. Today, 2016, 19, 533–543 CrossRef CAS.
- C. McDowell and G. C. Bazan, Curr. Opin. Green Sustainable Chem., 2017, 5, 49–54 CrossRef.
- L. Ye, Y. Xiong, Z. Chen, Q. Zhang, Z. Fei, R. Henry, M. Heeney, B. T. O'Connor, W. You and H. Ade, Adv. Mater., 2019, 31, 1808153 CrossRef PubMed.
- H. Chen, H. Lai, Z. Chen, Y. Zhu, H. Wang, L. Han, Y. Zhang and F. He, Angew. Chem., Int. Ed., 2021, 60, 3238–3246 CrossRef CAS PubMed.
- H. Chen, R. Zhang, X. Chen, G. Zeng, L. Kobera, S. Abbrent, B. Zhang, W. Chen, G. Xu, J. Oh, S.-H. Kang, S. Chen, C. Yang, J. Brus, J. Hou, F. Gao, Y. Li and Y. Li, Nat. Energy, 2021, 6, 1045–1053 CrossRef CAS.
- X. Song, P. Sun, D. Sun, Y. Xu, Y. Liu and W. Zhu, Nano Energy, 2022, 91, 106678 CrossRef CAS.
- K. L. Jae, L. M. Wan, C. J. Brabec, J. Yuen, S. M. Ji, Y. K. Jin, K. Lee, G. C. Bazan and A. J. Heeger, J. Am. Chem. Soc., 2008, 130, 3619–3623 CrossRef PubMed.
- K. R. Graham, P. M. Wieruszewski, R. Stalder, M. J. Hartel, J. Mei, F. So and J. R. Reynolds, Adv. Funct. Mater., 2012, 22, 4801–4813 CrossRef CAS.
- L. Zhao, S. Zhao, Z. Xu, B. Qiao, D. Huang and X. Xu, Org. Electron., 2016, 34, 188–192 CrossRef CAS.
- C. McDowell, M. Abdelsamie, M. F. Toney and G. C. Bazan, Adv. Mater., 2018, 30, 1707114 CrossRef PubMed.
- L. Zhao, H. Ji, S. Li, Q. Shi, C. Zhu, W. Wang and D. Huang, Appl. Surf. Sci., 2021, 569, 151120 CrossRef CAS.
- L. Ye, Y. Xiong, M. Zhang, X. Guo, H. Guan, Y. Zou and H. Ade, Nano Energy, 2020, 77, 105310 CrossRef CAS.
- T. L. Nguyen, H. Choi, S. J. Ko, M. A. Uddin, B. Walker, S. Yum, J. E. Jeong, M. H. Yun, T. J. Shin, S. Hwang, J. Y. Kim and H. Y. Woo, Energy Environ. Sci., 2014, 7, 3040–3051 RSC.
- H. Choi, S.-J. Ko, T. Kim, P.-O. Morin, B. Walker, B. H. Lee, M. Leclerc, J. Y. Kim and A. J. Heeger, Adv. Mater., 2015, 27, 3318–3324 CrossRef CAS PubMed.
- T. H. Lee, S. Y. Park, B. Walker, S. J. Ko, J. Heo, H. Y. Woo, H. Choi and J. Y. Kim, RSC Adv., 2017, 7, 7476–7482 RSC.
- S. Rasool, D. Van Vu, C. E. Song, H. K. Lee, S. K. Lee, J. Lee, S. Moon and W. S. Shin, Adv. Energy Mater., 2019, 9, 1900168 CrossRef.
- W. Zhao, L. Ye, S. Li, X. Liu, S. Zhang, Y. Zhang, M. Ghasemi, C. He, H. Ade and J. Hou, Sci. China Mater., 2017, 60, 697–706 CrossRef CAS.
- J. E. Yu, S. J. Jeon, J. Y. Choi, Y. W. Han, E. J. Ko and D. K. Moon, Small, 2019, 15, 1–10 Search PubMed.
- Z. Zheng, E. He, J. Wang, Z. Qin, T. Niu, F. Guo, S. Gao, Z. Ma, L. Zhao, X. Lu, Q. Xue, Y. Cao, G. T. Mola and Y. Zhang, J. Mater. Chem. A, 2021, 9, 26105–26112 RSC.
- X. Ma, Q. Jiang, W. Xu, C. Xu, S. Young Jeong, H. Young Woo, Q. Wu, X. Zhang, G. Yuan and F. Zhang, Chem. Eng. J., 2022, 442, 136368 CrossRef CAS.
- L. Ye, Y. Xiong, S. Li, M. Ghasemi, N. Balar, J. Turner, A. Gadisa, J. Hou, B. T. O'Connor and H. Ade, Adv. Funct. Mater., 2017, 27, 1702016 CrossRef.
- A. Tournebize, A. Rivaton, H. Peisert and T. Chassé, J. Phys. Chem. C, 2015, 119, 9142–9148 CrossRef CAS.
- W. Kim, J. K. Kim, E. Kim, T. K. Ahn, D. H. Wang and J. H. Park, J. Phys. Chem. C, 2015, 119, 5954–5961 CrossRef CAS.
- B. J. Tremolet De Villers, K. A. O'Hara, D. P. Ostrowski, P. H. Biddle, S. E. Shaheen, M. L. Chabinyc, D. C. Olson and N. Kopidakis, Chem. Mater., 2016, 28, 876–884 CrossRef CAS.
- C. Y. Liao, Y. Chen, C. C. Lee, G. Wang, N. W. Teng, C. H. Lee, W. L. Li, Y. K. Chen, C. H. Li, H. L. Ho, P. H. S. Tan, B. Wang, Y. C. Huang, R. M. Young, M. R. Wasielewski, T. J. Marks, Y. M. Chang and A. Facchetti, Joule, 2020, 4, 189–206 CrossRef CAS.
- D. Garcia Romero, L. Di Mario, G. Portale and M. A. Loi, J. Mater. Chem. A, 2021, 9, 23783–23792 RSC.
- Q. Yang, X. Li, H. Tang, Y. Li, Y. Fu, Z. Li and Z. Xie, J. Mater. Chem. C, 2020, 8, 6724–6733 RSC.
- Q. He, W. Sheng, M. Zhang, G. Xu, P. Zhu, H. Zhang, Z. Yao, F. Gao, F. Liu, X. Liao and Y. Chen, Adv. Energy Mater., 2021, 11, 1–11 Search PubMed.
- J. Gao, R. Ming, Q. An, X. Ma, M. Zhang, J. Miao, J. Wang, C. Yang and F. Zhang, Nano Energy, 2019, 63, 103888 CrossRef CAS.
- G. Garcia-Belmonte, A. Munar, E. M. Barea, J. Bisquert, I. Ugarte and R. Pacios, Org. Electron., 2008, 9, 847–851 CrossRef CAS.
- M. P. Felicissimo, D. Jarzab, M. Gorgoi, M. Forster, U. Scherf, M. C. Scharber, S. Svensson, P. Rudolf and M. A. Loi, J. Mater. Chem., 2009, 19, 4899–4901 RSC.
- E. M. Speller, A. J. Clarke, J. Luke, H. K. H. Lee, J. R. Durrant, N. Li, T. Wang, H. C. Wong, J. S. Kim, W. C. Tsoi and Z. Li, J. Mater. Chem. A, 2019, 7, 23361–23377 RSC.
- A. Tournebize, P.-O. Bussière, P. Wong-Wah-Chung, S. Thérias, A. Rivaton, J.-L. Gardette, S. Beaupré and M. Leclerc, Adv. Energy Mater., 2013, 3, 478–487 CrossRef CAS.
- R. A. Street and D. M. Davies, Appl. Phys. Lett., 2013, 102, 1–4 CrossRef.
- T. Heumueller, W. R. Mateker, I. T. Sachs-Quintana, K. Vandewal, J. A. Bartelt, T. M. Burke, T. Ameri, C. J. Brabec and M. D. McGehee, Energy Environ. Sci., 2014, 7, 2974–2980 RSC.
- T. Heumueller, T. M. Burke, W. R. Mateker, I. T. Sachs-Quintana, K. Vandewal, C. J. Brabec and M. D. McGehee, Adv. Energy Mater., 2015, 5, 1500111 CrossRef.
- M. B. Upama, M. Wright, M. A. Mahmud, N. K. Elumalai, A. Mahboubi Soufiani, D. Wang, C. Xu and A. Uddin, Nanoscale, 2017, 9, 18788–18797 RSC.
- A. J. Pearson, P. E. Hopkinson, E. Couderc, K. Domanski, M. Abdi-Jalebi and N. C. Greenham, Org. Electron., 2016, 30, 225–236 CrossRef CAS.
- N. Y. Doumon, G. Wang, X. Qiu, A. J. Minnaard, R. C. Chiechi and L. J. A. Koster, Sci. Rep., 2019, 9, 1–14 CrossRef CAS PubMed.
- T. A. Papadopoulos, L. Muccioli, S. Athanasopoulos, A. B. Walker, C. Zannoni and D. Beljonne, Chem. Sci., 2011, 2, 1025–1032 RSC.
- J. D. A. Lin, O. V. Mikhnenko, J. Chen, Z. Masri, A. Ruseckas, A. Mikhailovsky, R. P. Raab, J. Liu, P. W. M. Blom, M. A. Loi, C. J. García-Cervera, I. D. W. Samuel and T. Q. Nguyen, Mater. Horiz., 2014, 1, 280–285 RSC.
- I. Rörich, O. V. Mikhnenko, D. Gehrig, P. W. M. Blom and N. I. Crǎciun, J. Phys. Chem. B, 2017, 121, 1405–1412 CrossRef PubMed.
- N. D. Eastham, J. L. Logsdon, E. F. Manley, T. J. Aldrich, M. J. Leonardi, G. Wang, N. E. Powers-Riggs, R. M. Young, L. X. Chen, M. R. Wasielewski, F. S. Melkonyan, R. P. H. Chang and T. J. Marks, Adv. Mater., 2018, 30, 1–8 CrossRef PubMed.
- Z. Chen, X. Chen, B. Qiu, G. Zhou, Z. Jia, W. Tao, Y. Li, Y. M. Yang and H. Zhu, J. Phys. Chem. Lett., 2020, 11, 3226–3233 CrossRef CAS PubMed.
- D. He, F. Zhao, C. Wang and Y. Lin, Adv. Funct. Mater., 2022, 32, 2111855 CrossRef CAS.
- A. Hexemer, W. Bras, J. Glossinger, E. Schaible, E. Gann, R. Kirian, A. MacDowell, M. Church, B. Rude and H. Padmore, J. Phys.: Conf. Ser., 2010, 247, 012007 CrossRef.
Footnote |
| † Electronic supplementary information (ESI) available. See DOI: https://doi.org/10.1039/d2ta08603d |
| This journal is © The Royal Society of Chemistry 2023 |