Enlarging the porosity of metal–organic framework-derived carbons for supercapacitor applications by a template-free ethylene glycol etching method†
Ruijing
Xin
 a,
Minjun
Kim
*a,
Ping
Cheng
a,
Aditya
Ashok
a,
Minjun
Kim
*a,
Ping
Cheng
a,
Aditya
Ashok
 a,
Silvia
Chowdhury
a,
Teahoon
Park
a,
Silvia
Chowdhury
a,
Teahoon
Park
 b,
Azhar
Alowasheeir
c,
Md. Shahriar
Hossain
 d,
Jing
Tang
e,
Jin Woo
Yi
*b,
Yusuke
Yamauchi
 ac,
Yusuf Valentino
Kaneti
*a and
Jongbeom
Na
 *af
*af
aAustralian Institute for Bioengineering and Nanotechnology (AIBN), The University of Queensland, Brisbane, QLD 4072, Australia. E-mail: minjun.kim@uq.edu.au; v.kaneti@uq.edu.au
bCarbon Composite Department, Composites Research Division, Korea Institute of Materials Science (KIMS), 797, Changwon-daero, Seongsan-gu, Changwon-si 51508, Gyeongsangnam-do, Republic of Korea. E-mail: yjw0628@kims.re.kr
cJST-ERATO Yamauchi Materials Space-Tectonics Project, International Center for Materials Nanoarchitectonics (WPI-MANA), National Institute for Materials Science, 1-1 Namiki, Tsukuba, Ibaraki 305-0044, Japan
dSchool of Mechanical and Mining Engineering, Faculty of Engineering, Architecture, and Information Technology (EAIT), The University of Queensland, Brisbane, QLD 4072, Australia
eSchool of Chemistry and Molecular Engineering, Shanghai Key Laboratory of Green Chemistry and Chemical Processes, Institute of Eco-Chongming, East China Normal University, Shanghai 200062, China
fMaterials Architecturing Research Center, Korea Institute of Science and Technology, Seoul, Republic of Korea. E-mail: jongbeom@kist.re.kr
First published on 2nd November 2022
Abstract
In this work, hierarchically porous bimetallic zeolitic imidazolate framework (ZIF) particles (etched Zn33Co67-ZIF) exhibiting both micropores and mesopores have been designed and prepared through an ethylene glycol-assisted aqueous etching method. The etching process effectively increases the pore size, surface area, and pore volume of the bimetallic ZIF particles. After the thermal treatment, the etched Zn33Co67-ZIF particles are transformed into cobalt and nitrogen co-doped hierarchically porous carbon (i.e., etched Zn33Co67–C). Etched Zn33Co67–C has an increased mesoporosity, leading to an approximately 45% increase in its specific capacitance compared to the unetched one. In addition, etched Zn33Co67–C displays a higher capacitance retention (67%) than unetched Zn33Co67–C (41%) over a range of scan rates from 1 to 100 mV s−1. The presented ethylene glycol-assisted aqueous etching process provides a facile template-free strategy to enlarge the porosity of MOFs and their corresponding porous carbons for improving their energy storage performance.
10th Anniversary StatementI, Yusuke Yamauchi, joined as an Associate Editor of Journal of Materials Chemistry A in 2017. Since joining the editorial team, Journal of Materials Chemistry A has risen to be one of the leading journals in the Energy and Environmental fields as indicated by the rapid rise in its impact factor. The journal has a strong history of publishing quality reports of interest to readers working in multidisciplinary fields of Materials Science, Chemistry, and Nanotechnology. I have published over 250 papers in the RSC journals and over 70 papers in J. Mater. Chem. and J. Mater. Chem. A, and found the journal to be fair, efficient, and rigorous in terms of peer review and publication. |
Introduction
Hierarchically porous carbon materials with controllable size, shape, and composition have gained significant attention due to their structure-dependent electrochemical properties. High surface areas and accessible structures are beneficial for enhancing their electrochemical performance.1–4 Porous materials can involve different classes of nanopores, including micropores (pore size < 2 nm), mesopores (pore size between 2 and 50 nm), and macropores (pore size > 50 nm).5 In electrochemical reactions, micropores generally increase the surface areas of materials. Abundant mesopores are known to promote a fast mass transport of substances throughout the porous structure and surface, therefore maximizing the use of potential active sites. Macropores often serve as reservoirs of the electrolyte ions and other substances, thus shortening the diffusion distance.6,7 Hierarchically porous carbon materials are frequently synthesized by hard-8,9 and soft-templating methods.10 The template-based approaches, however, require a specific combination of the carbon sources and templates, and post-synthetic template removal, making the fabrication procedures costly and complex.Metal–organic frameworks (MOFs), which are composed of metal nodes and organic ligands, have attracted great interest for the preparation of nanoporous carbons (NPCs) because they can serve as both carbon sources and self-templates.11–13 Furthermore, MOFs exhibit other attractive characteristics, including large surface area, high crystallinity, intrinsic porosity, and good thermal stability. MOF-derived NPCs typically inherit the morphology and porosity of the parent MOFs, which are highly advantageous for energy storage applications.14–16 Zeolitic imidazolate framework-8 (ZIF-8), a typical MOF, is formed via the formation of coordination bonding between zinc (Zn) ions and the imidazole ligands. Due to its inherent nitrogen (N) content, ZIF-8 can be thermally converted into N-doped microporous carbon.13,17
Despite the facile preparation and the intrinsic N-doping, the microporous nature of ZIF-8-derived carbon can hinder the ion diffusion in electrochemical energy storage devices, such as supercapacitors.17 Enlarging the pore size of ZIF-8-derived carbon is, therefore, highly desirable, and it can be achieved through various chemical modifications.13 For example, tannic acid was employed to create hollow ZIF-8, which was subsequently carbonized to obtain hollow nanoporous carbon. With the hollow center serving as a reservoir of electrolyte ions, the hollow nanoporous carbon showed a much-improved rate capability for supercapacitor applications.18 Alternatively, the pore size of ZIF-derived carbon can be increased by incorporating cobalt (Co) atoms into the ZIF-8 framework prior to the carbonization process. ZIFs incorporating Co (ZIF-67) and Zn (ZIF-8) demonstrate the isoreticular structure with the same sodalite structure and topology, and similar crystallinity and lattice parameters.19 Upon carbonization, Co atoms in ZIF-67 undergo a severe aggregation to form Co nanoparticles (NPs), and an acid washing of the Co NPs in ZIF-67-derived carbons leaves mesopores in the carbon matrix. Consequently, ZIF-67-derived carbons can have more abundant mesopores in their structures than ZIF-8-derived carbons, although ZIF-8 and ZIF-67 share similar morphological and crystalline features. Furthermore, ZIF-67-derived carbons tend to exhibit a higher degree of graphitization because Co NPs can act as thermal catalysts to promote the graphitization of carbon atoms.20 Both core–shell and homogeneously distributed bimetallic ZIFs can give rise to their carbonaceous forms with enlarged pores and improved graphitization.17,21 The resulting bimetallic ZIF-derived carbons, however, tend to exhibit richer micropores with relatively small mesopores (∼3 nm) originating from the removal of small Co NPs after the carbonization process.17
Etching is a potential strategy to create larger pores in ZIFs. For instance, ZIF-8 and ZIF-67 have been reported to form cubes, tetrahedra, and hollow microboxes from the original truncated and non-truncated rhombic dodecahedral crystals using pH-controlled etchant solution of xylenol orange sodium salt. In the etching process, 2-methylimidazole ligands were protonated to break their bonds with Zn2+ or Co2+, thus forming nanopores.22
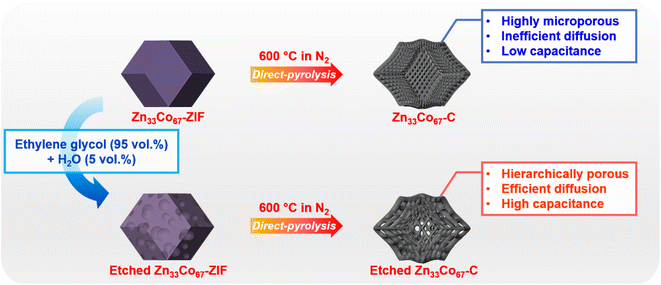
Herein, we demonstrate a facile template-free method to enlarge the size of nanopores of bimetallic Zn33Co67-ZIF (where the subscript indicates the feed molar ratio of the respective metal species) from the micropore range to mesopore range via the ethylene glycol (EG)-assisted aqueous etching process. Upon successful etching, obvious mesopores are created on both the surface and inside of the etched Zn33Co67-ZIF particles. The thermal treatment of etched Zn33Co67-ZIF leads to the formation of Co and N co-doped hierarchically porous carbon (i.e., etched Zn33Co67–C) containing both micropores and mesopores. As a result of the pore enlargement, etched Zn33Co67–C shows a 45% higher specific capacitance compared to its unetched counterpart. Furthermore, the retention rate of etched Zn33Co67–C (67%) is higher than that of unetched Zn33Co67–C (41%) at a high scan rate of 100 mV s−1. The presented work provides a new strategy for increasing the ion diffusion and therefore the capacitance and retention rate of ZIF-derived NPCs.
Experimental
Chemicals
Zinc acetate dihydrate (Zn(CH3CO2)2·2H2O, 99%), cobalt acetate tetrahydrate (Co(CH3CO2)2·4H2O, 98%), 2-methylimidazole (CH3C3H2N2H, 99%), ethylene glycol ((CH2OH)2, 99%), hydrochloric acid (HCl, 37%), sulfuric acid (H2SO4, 98%), methanol (CH3OH, 99.9%), ethanol (C2H5OH, 99.9%), poly(vinylidene fluoride) (PVDF, average molecular weight (Mw) ∼534![[thin space (1/6-em)]](https://www.rsc.org/images/entities/char_2009.gif) 000), and 1-methyl-2-pyrrolidinone (NMP, 99.5%) were purchased from Sigma-Aldrich. Carbon black (99.9%) was purchased from Alfa Aesar.
000), and 1-methyl-2-pyrrolidinone (NMP, 99.5%) were purchased from Sigma-Aldrich. Carbon black (99.9%) was purchased from Alfa Aesar.
Preparation of Zn33Co67-ZIF and ZIF-8
Zinc acetate dihydrate (0.770 g) and cobalt acetate tetrahydrate (1.743 g) were dissolved in 100 mL of methanol at room temperature in a 250 mL beaker and stirred for 10 minutes in an ice bath. 2-Methylimidazole (13.793 g) was dissolved in 30 mL of methanol at room temperature in a 500 mL glass reagent bottle and transferred to a 250 mL separation funnel. The methanolic solution of 2-methylimidazole was quickly released from the separation funnel to the methanolic solution containing a mixture of zinc acetate and cobalt acetate within 2 seconds in an ice bath. The beaker was swiftly placed into an oil bath, which has been preheated to 60 °C and stirred for 10 minutes at 400 rpm. Next, it was aged at room temperature for 24 h. The resulting Zn33Co67-ZIF particles were collected by centrifugation and washed with methanol three times at 15![[thin space (1/6-em)]](https://www.rsc.org/images/entities/char_2009.gif) 000 rpm for 4 minutes before being dried in a vacuum oven at 60 °C. The preparation of ZIF-8 particles followed the same procedure as Zn33Co67-ZIF, except that 2.305 g of zinc acetate dihydrate was used without any cobalt acetate tetrahydrate in the metal precursor.
000 rpm for 4 minutes before being dried in a vacuum oven at 60 °C. The preparation of ZIF-8 particles followed the same procedure as Zn33Co67-ZIF, except that 2.305 g of zinc acetate dihydrate was used without any cobalt acetate tetrahydrate in the metal precursor.
Preparation of etched Zn33Co67-ZIF and etched ZIF-8
To obtain the etched Zn33Co67-ZIF particles, a mixture of 95 vol% EG and 5 vol% deionized water (DW) (95EG![[thin space (1/6-em)]](https://www.rsc.org/images/entities/char_2009.gif) :
:![[thin space (1/6-em)]](https://www.rsc.org/images/entities/char_2009.gif) 5DW) is used (note: a mixture of x vol% EG and y vol% DW is denoted as xEG
5DW) is used (note: a mixture of x vol% EG and y vol% DW is denoted as xEG![[thin space (1/6-em)]](https://www.rsc.org/images/entities/char_2009.gif) :
:![[thin space (1/6-em)]](https://www.rsc.org/images/entities/char_2009.gif) yDW). A volume of 240 mL 95EG
yDW). A volume of 240 mL 95EG![[thin space (1/6-em)]](https://www.rsc.org/images/entities/char_2009.gif) :
:![[thin space (1/6-em)]](https://www.rsc.org/images/entities/char_2009.gif) 5DW was first prepared by ultra-sonication for 1 hour in a 650 mL plastic bottle. 60 mg of Zn33Co67-ZIF was ground in an agate mortar with a pestle with 60 mL 95EG
5DW was first prepared by ultra-sonication for 1 hour in a 650 mL plastic bottle. 60 mg of Zn33Co67-ZIF was ground in an agate mortar with a pestle with 60 mL 95EG![[thin space (1/6-em)]](https://www.rsc.org/images/entities/char_2009.gif) :
:![[thin space (1/6-em)]](https://www.rsc.org/images/entities/char_2009.gif) 5DW (DW was added in a dropwise manner while grinding, and EG was subsequently added in the same manner). The slurry of Zn33Co67-ZIF in 60 mL 95EG
5DW (DW was added in a dropwise manner while grinding, and EG was subsequently added in the same manner). The slurry of Zn33Co67-ZIF in 60 mL 95EG![[thin space (1/6-em)]](https://www.rsc.org/images/entities/char_2009.gif) :
:![[thin space (1/6-em)]](https://www.rsc.org/images/entities/char_2009.gif) 5DW was transferred to glass vials and sonicated for 3 minutes. Then, the slurry was added to the 240 mL 95EG
5DW was transferred to glass vials and sonicated for 3 minutes. Then, the slurry was added to the 240 mL 95EG![[thin space (1/6-em)]](https://www.rsc.org/images/entities/char_2009.gif) :
:![[thin space (1/6-em)]](https://www.rsc.org/images/entities/char_2009.gif) 5DW and sonicated for 3 hours in a water bath. The water bath was cooled using ice to keep the temperature below 30 °C. After sonication, the etched Zn33Co67-ZIF particles were obtained by centrifugation at 20
5DW and sonicated for 3 hours in a water bath. The water bath was cooled using ice to keep the temperature below 30 °C. After sonication, the etched Zn33Co67-ZIF particles were obtained by centrifugation at 20![[thin space (1/6-em)]](https://www.rsc.org/images/entities/char_2009.gif) 000 rpm for 30 minutes. These particles were subsequently washed with ethanol several times and dried in a vacuum oven at 60 °C. The etched ZIF-8 particles were prepared using the same procedure with ZIF-8.
000 rpm for 30 minutes. These particles were subsequently washed with ethanol several times and dried in a vacuum oven at 60 °C. The etched ZIF-8 particles were prepared using the same procedure with ZIF-8.
To study the etching mechanism, 60 mg of Zn33Co67-ZIF was ground in EG/DW of varying volume ratios (refer to Fig. 3a and b) and the resulting etched Zn33Co67-ZIF particles were characterized by Fourier-transform infrared spectroscopy (FTIR) and scanning electron microscopy (SEM).
Thermal conversion of MOFs
ZIF-8, etched ZIF-8, Zn33Co67-ZIF, and etched Zn33Co67-ZIF were thermally pyrolyzed in a tube furnace at 600 °C for 2 h under a N2 atmosphere with a heating rate of 5 °C min−1. Before the start of the thermal treatment, the MOF powder was ground in an agate mortar before being placed in an alumina combustion boat, which was then inserted into the tube furnace and purged with N2 at a rate of 140 mL min−1 for 30 minutes. After the thermal treatment, the tube furnace was cooled down to room temperature. The black powder was acid washed with 2 M HCl at room temperature for 13 hours to remove the Co NPs. The washed product was centrifuged at 20![[thin space (1/6-em)]](https://www.rsc.org/images/entities/char_2009.gif) 000 rpm for 4 minutes three times and dried in a vacuum oven overnight at 60 °C. The final products were labelled as Zn–C, etched Zn–C, Zn33Co67–C, and etched Zn33Co67–C, respectively.
000 rpm for 4 minutes three times and dried in a vacuum oven overnight at 60 °C. The final products were labelled as Zn–C, etched Zn–C, Zn33Co67–C, and etched Zn33Co67–C, respectively.
Characterization
The morphology of the samples was checked using field-emission scanning electron microscopy (FESEM) on a JEOL JSM-7800F microscope at a working voltage of 1 kV. Transmission electron microscopy (TEM) imaging was performed on a Hitachi HT7700 microscope with an accelerating voltage of 120 kV. Elemental information was obtained through scanning transmission electron microscopy (STEM) energy-dispersive X-ray spectroscopy (EDS) on a Hitachi HF5000 microscope. The composition and crystal structure of the samples were analyzed by powder X-ray diffraction (PXRD) on a Bruker D8 Advance MKII instrument with Cu Kα X-rays. The surface composition and elemental states of the samples were checked by X-ray photoelectron spectroscopy (XPS) using a Kratos Axis Ultra photoelectron spectrometer with a monochromatic Al Kα source. The N2 adsorption–desorption measurements were conducted using a BELMaster BELSORP analyzer. The samples were degassed at 120 °C for 12 h under vacuum before nitrogen physisorption measurements. Inductively coupled plasma-optical emission spectrometry (ICP-OES) measurements were performed using a PerkinElmer Optima 8300DV. Raman spectroscopy measurements were performed on a Renishaw Raman microscope and spectrometer with a 514 nm laser wavelength. Fourier-transform infrared (FTIR) spectroscopy measurements were conducted on a Nicolet 5700 ATR-FTIR spectrometer. The thermogravimetric analysis (TGA) was performed on a Mettler Toledo analyzer under a N2 atmosphere with a heating rate of 5 °C min−1.Electrochemical measurements
The electrochemical performance of the ZIF-derived carbon products as electrode materials for supercapacitors was tested in a standard three-electrode electrochemical cell. Platinum and Ag/AgCl (in 3 M NaCl) were utilized as the counter and reference electrodes, respectively. The electrode dispersion ink was prepared by sonicating a mixture of 10.0 mg of etched Zn33Co67–C, 1.25 mg of carbon black, 1.25 mg poly(vinylidene difluoride), and 1 mL of 1-methyl-2-pyrrolidinone for 30 minutes. The working electrode was prepared by drop-casting 100 μL of the homogenized electrode dispersion ink on a polished flat 1 cm × 1 cm graphite electrode. After drying in an air-forced oven at 50 °C overnight, the electrode was ready for measurements. For comparison, Zn33Co67–C and Zn–C electrodes, which were derived from Zn33Co67-ZIF and ZIF-8, respectively, were also prepared using the same procedures. The electrochemical measurements were conducted on a CHI-760E electrochemical workstation in a 1.0 M H2SO4 electrolyte. The electrochemical performance was measured using cyclic voltammetry (CV) and galvanostatic charge–discharge (GCD) measurements. The CV scan rate was changed from 1 to 100 mV s−1 and the charge–discharge current density was varied from 2 to 100 A g−1. The specific capacitance was calculated from the CV curve using the following equation: | (1) |
 is the integration of the CV area. In addition, the specific capacitance can also be calculated from the GCD curves from the following equation:
 | (2) |
Results and discussion
Etching of MOFs
The EG-assisted aqueous etching method was adopted to introduce larger nanopores in MOFs. The pore enlargement strategy on microporous MOFs is to target the water-decomposable MOF components by utilizing the 95EG![[thin space (1/6-em)]](https://www.rsc.org/images/entities/char_2009.gif) :
:![[thin space (1/6-em)]](https://www.rsc.org/images/entities/char_2009.gif) 5DW complex. Co-based ZIF-67 is more susceptible to degradation in an aqueous environment than Zn-based ZIF-8.23 To maintain the ZIF framework structure while allowing partial degradation by water molecules, a bimetallic MOF (Zn33Co67-ZIF) was selected as the starting material (Scheme 1). The Zn33Co67-ZIF was prepared by a simple one-pot reaction in a methanolic solution at room temperature. The composition of this bimetallic ZIF can be controlled by varying the molar ratio of zinc acetate dihydrate and cobalt acetate tetrahydrate, and we used a fixed feed molar ratio of 1Zn2+
5DW complex. Co-based ZIF-67 is more susceptible to degradation in an aqueous environment than Zn-based ZIF-8.23 To maintain the ZIF framework structure while allowing partial degradation by water molecules, a bimetallic MOF (Zn33Co67-ZIF) was selected as the starting material (Scheme 1). The Zn33Co67-ZIF was prepared by a simple one-pot reaction in a methanolic solution at room temperature. The composition of this bimetallic ZIF can be controlled by varying the molar ratio of zinc acetate dihydrate and cobalt acetate tetrahydrate, and we used a fixed feed molar ratio of 1Zn2+![[thin space (1/6-em)]](https://www.rsc.org/images/entities/char_2009.gif) :
:![[thin space (1/6-em)]](https://www.rsc.org/images/entities/char_2009.gif) 2Co2+ in this study.21 From the FESEM and the TEM images of Zn33Co67-ZIF particles, a well-defined rhombic dodecahedron morphology with an average particle size of 500 nm is observed (Fig. 1a and b).
2Co2+ in this study.21 From the FESEM and the TEM images of Zn33Co67-ZIF particles, a well-defined rhombic dodecahedron morphology with an average particle size of 500 nm is observed (Fig. 1a and b).
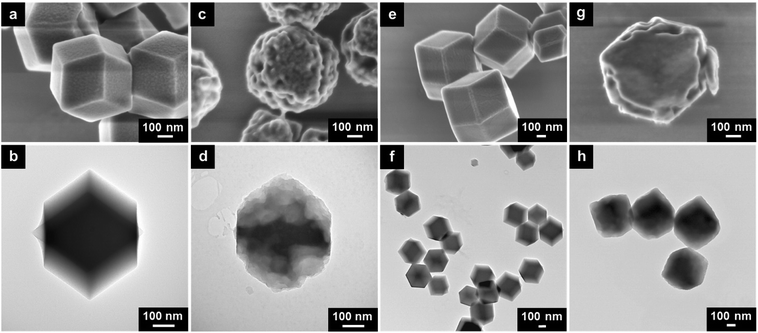 | ||
| Fig. 1 (a) SEM and (b) TEM images of Zn33Co67-ZIF. (c) SEM and (d) TEM images of etched Zn33Co67-ZIF. (e) SEM and (f) TEM images of ZIF-8. (g) SEM and (h) TEM images of etched ZIF-8. | ||
The as-synthesized Zn33Co67-ZIF particles were then homogeneously dispersed in 95EG![[thin space (1/6-em)]](https://www.rsc.org/images/entities/char_2009.gif) :
:![[thin space (1/6-em)]](https://www.rsc.org/images/entities/char_2009.gif) 5DW to allow the water molecules to break the bonding between Co2+ and 2-methylimidazole, hence partially etching the particles. Upon a successful etching process, the surface of the etched Zn33Co67-ZIF particles becomes much rougher with numerous enlarged nanopores (Fig. 1c and S1a and b†). In addition, the etching occurs at the core of the particles to generate an interconnected porosity with abundant mesopores and micropores (Fig. 1d and S1c and d†). We also examined the effect of the EG
5DW to allow the water molecules to break the bonding between Co2+ and 2-methylimidazole, hence partially etching the particles. Upon a successful etching process, the surface of the etched Zn33Co67-ZIF particles becomes much rougher with numerous enlarged nanopores (Fig. 1c and S1a and b†). In addition, the etching occurs at the core of the particles to generate an interconnected porosity with abundant mesopores and micropores (Fig. 1d and S1c and d†). We also examined the effect of the EG![[thin space (1/6-em)]](https://www.rsc.org/images/entities/char_2009.gif) :
:![[thin space (1/6-em)]](https://www.rsc.org/images/entities/char_2009.gif) DW ratio on the etching process and the resulting morphology of Zn33Co67-ZIF. With 95EG
DW ratio on the etching process and the resulting morphology of Zn33Co67-ZIF. With 95EG![[thin space (1/6-em)]](https://www.rsc.org/images/entities/char_2009.gif) :
:![[thin space (1/6-em)]](https://www.rsc.org/images/entities/char_2009.gif) 5DW and 50EG
5DW and 50EG![[thin space (1/6-em)]](https://www.rsc.org/images/entities/char_2009.gif) :
:![[thin space (1/6-em)]](https://www.rsc.org/images/entities/char_2009.gif) 50DW, larger nanopores are formed on both the surface and the inside of the particles (Fig. S2†). As the DW ratio increases from 95EG
50DW, larger nanopores are formed on both the surface and the inside of the particles (Fig. S2†). As the DW ratio increases from 95EG![[thin space (1/6-em)]](https://www.rsc.org/images/entities/char_2009.gif) :
:![[thin space (1/6-em)]](https://www.rsc.org/images/entities/char_2009.gif) 5DW to 50EG
5DW to 50EG![[thin space (1/6-em)]](https://www.rsc.org/images/entities/char_2009.gif) :
:![[thin space (1/6-em)]](https://www.rsc.org/images/entities/char_2009.gif) 50DW to 20EG
50DW to 20EG![[thin space (1/6-em)]](https://www.rsc.org/images/entities/char_2009.gif) :
:![[thin space (1/6-em)]](https://www.rsc.org/images/entities/char_2009.gif) 80DW and to 100DW, however, the particles tend to lose the rhombic dodecahedral shape (Fig. S3†). This is largely due to the hydrogen bonding between water molecules limiting the entry of individual water molecules into the small micropores of Zn33Co67-ZIF in the absence of EG. The presence of EG, however, disrupts the hydrogen bonding between water molecules and allows more individual water molecules to enter and etch the interior of the particle. In the case of ZIF-67 etched by the same range of EG
80DW and to 100DW, however, the particles tend to lose the rhombic dodecahedral shape (Fig. S3†). This is largely due to the hydrogen bonding between water molecules limiting the entry of individual water molecules into the small micropores of Zn33Co67-ZIF in the absence of EG. The presence of EG, however, disrupts the hydrogen bonding between water molecules and allows more individual water molecules to enter and etch the interior of the particle. In the case of ZIF-67 etched by the same range of EG![[thin space (1/6-em)]](https://www.rsc.org/images/entities/char_2009.gif) :
:![[thin space (1/6-em)]](https://www.rsc.org/images/entities/char_2009.gif) DW ratios, they lose their rhombic dodecahedral shape even in 95EG
DW ratios, they lose their rhombic dodecahedral shape even in 95EG![[thin space (1/6-em)]](https://www.rsc.org/images/entities/char_2009.gif) :
:![[thin space (1/6-em)]](https://www.rsc.org/images/entities/char_2009.gif) 5DW, and the level of degradation further increases as the DW ratio increases (Fig. S4†). This observation can be attributed to the fact that ZIF-67 contains only Co metal and the etching by water molecules takes place homogeneously across the surface. It is, therefore, the bonding between Co2+ and 2-methlyimidazole in Zn33Co67-ZIF that is more readily targeted in the etching process. The framework of ZIF-67 mostly disintegrates when 100DW is used due to the hydrolysis process (Fig. S4d†). To further demonstrate this, ZIF-8, Zn67Co33-ZIF, Zn50Co50-ZIF, Zn25Co75-ZIF, and Zn10Co90-ZIF (synthesized by changing the feed molar ratio of Zn2+
5DW, and the level of degradation further increases as the DW ratio increases (Fig. S4†). This observation can be attributed to the fact that ZIF-67 contains only Co metal and the etching by water molecules takes place homogeneously across the surface. It is, therefore, the bonding between Co2+ and 2-methlyimidazole in Zn33Co67-ZIF that is more readily targeted in the etching process. The framework of ZIF-67 mostly disintegrates when 100DW is used due to the hydrolysis process (Fig. S4d†). To further demonstrate this, ZIF-8, Zn67Co33-ZIF, Zn50Co50-ZIF, Zn25Co75-ZIF, and Zn10Co90-ZIF (synthesized by changing the feed molar ratio of Zn2+![[thin space (1/6-em)]](https://www.rsc.org/images/entities/char_2009.gif) :
:![[thin space (1/6-em)]](https://www.rsc.org/images/entities/char_2009.gif) Co2+ to 2
Co2+ to 2![[thin space (1/6-em)]](https://www.rsc.org/images/entities/char_2009.gif) :
:![[thin space (1/6-em)]](https://www.rsc.org/images/entities/char_2009.gif) 1, 1
1, 1![[thin space (1/6-em)]](https://www.rsc.org/images/entities/char_2009.gif) :
:![[thin space (1/6-em)]](https://www.rsc.org/images/entities/char_2009.gif) 1, 1
1, 1![[thin space (1/6-em)]](https://www.rsc.org/images/entities/char_2009.gif) :
:![[thin space (1/6-em)]](https://www.rsc.org/images/entities/char_2009.gif) 3, and 1
3, and 1![[thin space (1/6-em)]](https://www.rsc.org/images/entities/char_2009.gif) :
:![[thin space (1/6-em)]](https://www.rsc.org/images/entities/char_2009.gif) 9, respectively) were subjected to 95EG
9, respectively) were subjected to 95EG![[thin space (1/6-em)]](https://www.rsc.org/images/entities/char_2009.gif) :
:![[thin space (1/6-em)]](https://www.rsc.org/images/entities/char_2009.gif) 5DW etching condition (Fig. 1e and f). After the etching, only surface nanopores are enlarged in ZIF-8 particles whereas the inner parts appear dense without the obvious presence of enlarged nanopores (Fig. 1g and h). All etched bimetallic ZIFs exhibit enlarged nanopores on both the surface and the interior, suggesting that the presence of Co species throughout the framework is important to achieve more homogeneous nanopore enlargement by the EG-assisted aqueous etching method (Fig. S5†).
5DW etching condition (Fig. 1e and f). After the etching, only surface nanopores are enlarged in ZIF-8 particles whereas the inner parts appear dense without the obvious presence of enlarged nanopores (Fig. 1g and h). All etched bimetallic ZIFs exhibit enlarged nanopores on both the surface and the interior, suggesting that the presence of Co species throughout the framework is important to achieve more homogeneous nanopore enlargement by the EG-assisted aqueous etching method (Fig. S5†).
Moreover, we have noticed that the sonication time plays an important role in the formation of the pores. Fig. S6† shows the TEM images of Zn33Co67-ZIF particles obtained in 95EG![[thin space (1/6-em)]](https://www.rsc.org/images/entities/char_2009.gif) :
:![[thin space (1/6-em)]](https://www.rsc.org/images/entities/char_2009.gif) 5DW with a varying sonication time of 1.5, 3, 6, and 9 hours, respectively. A short sonication time of less than 3 hours (e.g., 1.5 hours) is not sufficient to cause the inside of the particles to be etched. On the contrary, a longer sonication time (e.g., 6 and 9 hours) is likely to exert a severe physical stress to the particles to induce the formation of larger nanopores, including macropores. To obtain the hierarchically porous Zn33Co67-ZIF with interconnected and enlarged nanopores to expose the carbon surface to electrolyte ions and facilitate better ion diffusion, 95EG
5DW with a varying sonication time of 1.5, 3, 6, and 9 hours, respectively. A short sonication time of less than 3 hours (e.g., 1.5 hours) is not sufficient to cause the inside of the particles to be etched. On the contrary, a longer sonication time (e.g., 6 and 9 hours) is likely to exert a severe physical stress to the particles to induce the formation of larger nanopores, including macropores. To obtain the hierarchically porous Zn33Co67-ZIF with interconnected and enlarged nanopores to expose the carbon surface to electrolyte ions and facilitate better ion diffusion, 95EG![[thin space (1/6-em)]](https://www.rsc.org/images/entities/char_2009.gif) :
:![[thin space (1/6-em)]](https://www.rsc.org/images/entities/char_2009.gif) 5DW is selected as the optimized etching condition.24,25
5DW is selected as the optimized etching condition.24,25
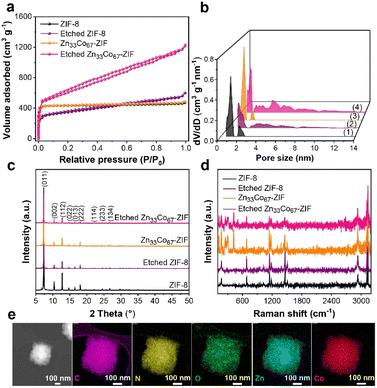
To further confirm the enlargement of the pore size of ZIFs using the EG-assisted aqueous etching method, the porosity of unetched and etched ZIF-8 and Zn33Co67-ZIF was evaluated using N2 adsorption–desorption isotherms (Fig. 2a). Both ZIF-8 and Zn33Co67-ZIF show a sharp uptake of N2 at P/P0 < 0.1, suggesting their microporous nature. For etched ZIF-8 and Zn33Co67-ZIF, small hysteresis loops are observed in the isotherms, implying that the etching process led to the enlargement of micropores to mesopores. Furthermore, the pore size distribution data obtained using the non-local density functional theory (NLDFT) method confirm the pore size enlargement (Fig. 2b). The pore size distribution plot of etched Zn33Co67-ZIF shows the presence of peaks at 1–2 nm and 4–8 nm, whereas Zn33Co67-ZIF displays sharp peaks at 1 nm and 2 nm. Furthermore, the etching process is found to greatly increase the pore volume and surface area from 0.686 cm3 g−1 and 1843 m2 g−1 in Zn33Co67-ZIF to 1.743 cm3 g−1 and 2142 m2 g−1 in etched Zn33Co67-ZIF (Table S1†). Similarly, etched ZIF-8 also shows an increase in pore volume to 0.822 cm3 g−1 compared to ZIF-8 (0.672 cm3 g−1). Additionally, the extent of the pore volume increase in Zn33Co67-ZIF is larger than that observed in ZIF-8, suggesting that the presence of Co facilitates the pore enlargement in the EG-assisted aqueous etching strategy.
The crystallinity of the unetched and etched ZIFs was analyzed by PXRD. Fig. 2c shows the PXRD patterns of Zn33Co66-ZIF and ZIF-8 before and after the etching process. All samples exhibit peaks at 7.36°, 10.36°, 12.71°, 14.70°, 16.45°, and 18.01°, which can be assigned to the (011), (002), (112), (022), (013), and (222) lattice planes of ZIF-8, respectively. In particular, very sharp peaks at 7.36° and 12.71° are observed in all samples, implying that they have high crystallinity. In the Zn33Co66-ZIF sample, Co2+ partially substitutes Zn2+ and causes no structural damage or alteration due to the similar ionic radii of Zn2+ (0.74 Å) and Co2+ (0.72 Å) in the tetrahedral coordination framework.26 The PXRD patterns of Zn33Co67-ZIF and ZIF-8 are in good agreement with previously reported data.18,19 In comparison, the peak intensities of the etched ZIF samples are decreased compared to the unetched ones, implying that the EG-assisted aqueous treatment affects the crystallinity of the ZIF samples to some extent.
Moreover, Raman spectroscopy was used to understand the chemical bonding in ZIFs. Fig. 2d displays the Raman spectra of Zn33Co67-ZIF, etched Zn33Co67-ZIF, ZIF-8, and etched ZIF-8. The intense Raman bands at 682, 839, 1019, 1145, 1184, 1312, 1387, 1457, 1509, 2928, 3115, and 3130 cm−1 are mainly ascribed to the methyl group and imidazole ring vibrations (Fig. S7 and Table S2†).27 Both Zn–N stretching (282 cm−1) and Co–N stretching (300 cm−1 and 420 cm−1) vibrations are observed in both Zn33Co67-ZIF and etched Zn33Co67-ZIF, while only Zn–N stretching vibration is observed in ZIF-8 and etched ZIF-8.28 The Raman peaks of the etched ZIF samples have the same positions as those of the unetched ZIF samples. In addition, the STEM elemental mapping images in Fig. 2e confirm the homogenous incorporation of Zn2+ and Co2+ into one crystal for etched Zn33Co67-ZIF.
The metal contents in Zn33Co67-ZIF and etched Zn33Co67-ZIF were experimentally determined by ICP-OES measurements, and compared to the feed metal contents.21 From Table 1, it can be observed that the actual Co content in Zn33Co67-ZIF (60.9 mol%) is lower than the feed content (67.0 mol%), which is attributed to the stronger affinity of Zn ions to the 2-methylimidazole ligand compared to Co ions.23,26 In addition, etched Zn33Co67-ZIF has a lower content of Co (48.1 mol%) than its unetched counterpart (60.9 mol%) based on the ICP-OES data, suggesting that the Co content is decreased by the EG-assisted aqueous etching process.
| Sample | Co (ppm) | Zn (ppm) | ICP determined Co content (mol%) | Feed Co content (mol%) |
|---|---|---|---|---|
| a Co content (mol%) = mol of Co/(mol of Co + mol of Zn). | ||||
| Zn33Co67-ZIF | 0.685 | 0.458 | 60.9 | 66.7 |
| Etched Zn33Co67-ZIF | 0.330 | 0.395 | 48.1 | — |
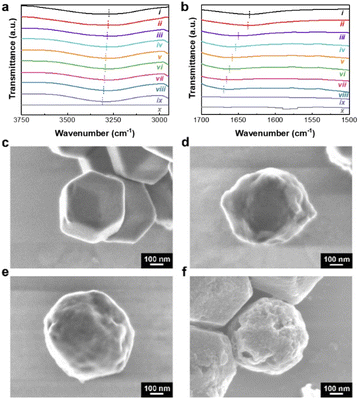
To further understand the role of EG in the etching process, we examined the FTIR spectra of the O–H stretching and bending vibrations of a varying EG to DW ratio. The peak of O–H stretching vibration of DW only is typically located at 3276 cm−1. The peak of O–H stretching vibration gradually shifts towards a higher wavenumber upon increasing the ratio of EG in the mixture (specifically, 3280, 3284, 3288, 3292, 3296, 3300, and 3304 cm−1 with 100DW, 63.5EG, 83.3EG, 89.3EG, 92.1EG, 93.8EG, and 95EG, respectively) (Fig. 3a). Additionally, the peak of O–H bending vibration of DW only is observed at 1635 cm−1. The peak of O–H bending vibration also shifts towards a higher wavenumber with the increased amount of EG in the mixture (specifically, 1637, 1650, 1654, 1658, 1662, 1666, and 1670 cm−1 with 100DW, 63.5EG, 83.3EG, 89.3EG, 92.1EG, 93.8EG, and 95EG, respectively) (Fig. 3b). Similar peak shifts have been observed in previous reports.29,30 Besides, there are no O–H stretching and bending peaks in the FTIR spectrum of vacuum-dried Zn33Co67-ZIF (Fig. 3a and b). Based on these observations, it is suggested that the increase in the EG ratio leads to more interactions with water molecules.29,31 In addition, Fig. 3c illustrates the morphological changes from the mixing of Zn33Co67-ZIF with 100DW. The rhombic dodecahedral shape with smooth surface structure is observed from SEM, and there is no obvious destruction of the framework. Additional nanopores are formed with the increase of EG ratio, as indicated by the bumpier surface contour of the particles (Fig. 3d and e). Deeper and larger pores are formed by increasing the volume of 95EG![[thin space (1/6-em)]](https://www.rsc.org/images/entities/char_2009.gif) :
:![[thin space (1/6-em)]](https://www.rsc.org/images/entities/char_2009.gif) 5DW (300 mL) and sonication time of 3 hours (Fig. 1c, d, and 3f). It is noted that the morphology is similar when there is no replenishment of EG and water, but with the same sonication time (Fig. S8†). Based on the FTIR spectra and SEM images, we can deduce that EG facilitates the enlargement of the nanopores of the bimetallic ZIF particles.23
5DW (300 mL) and sonication time of 3 hours (Fig. 1c, d, and 3f). It is noted that the morphology is similar when there is no replenishment of EG and water, but with the same sonication time (Fig. S8†). Based on the FTIR spectra and SEM images, we can deduce that EG facilitates the enlargement of the nanopores of the bimetallic ZIF particles.23
Thermal conversion of MOFs
FTIR spectra of ZIF-8, etched ZIF-8, Zn33Co67-ZIF, and etched Zn33Co67-ZIF show peaks at ∼694, 759, 995, 1145, 1309, 1432, and 1585 cm−1, which are attributed to sp3 C–H bending, sp2 C–H bending, CC bending, C–N stretching, sp3 C–H bending, sp3 C–H bending, and CN stretching, respectively (Fig. 4a, b and Table S3†).32 The TGA and corresponding first derivative weight curves of ZIF-8, etched ZIF-8, Zn33Co67-ZIF, and etched Zn33Co67-ZIF are shown in Fig. 4c. From the first derivative curves (Fig. 4d), it can be observed that ZIF-8 is stable until ∼600 °C with the maximum decomposition rate achieved at 631 °C. The temperature at which the maximum decomposition rate occurs is reduced from 587 °C for Zn33Co67-ZIF to 527 °C for etched Zn33Co67-ZIF. This may be caused by the partial removal of Co species in etched Zn33Co67-ZIF.33 Moreover, the maximum decomposition rate of etched Zn33Co67-ZIF is achieved at a much lower temperature of 527 °C as compared to that of etched ZIF-8 (629 °C) because the Co substitution leads to a faster ligand decomposition.25 After decomposition, the weight of ZIFs decreases dramatically due to the decomposition of the organic linker (2-methylimidazole) and the production of gases. It has been investigated that the decomposed gaseous mixtures under N2 flow involve C, CxHy, CxNy or both, and HzCxNy.25 Based on these results, the thermal treatment temperature is set at 600 °C for 2 hours with a heating rate of 5 °C min−1 for all samples. A higher carbonization temperature at 800 °C results in the collapse of MOF structure; hence, the use of such high temperature is not further investigated in this study (Fig. S9a and b†).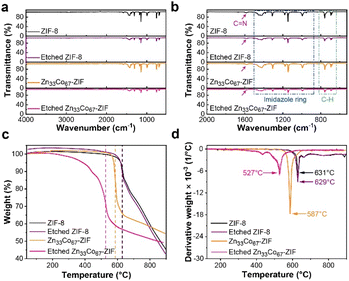 | ||
| Fig. 4 (a) FTIR, (b) the enlarged FTIR spectra, (c) TGA, and (d) TGA first derivative curves of ZIF-8, etched ZIF-8, Zn33Co67-ZIF, and etched Zn33Co67-ZIF. | ||
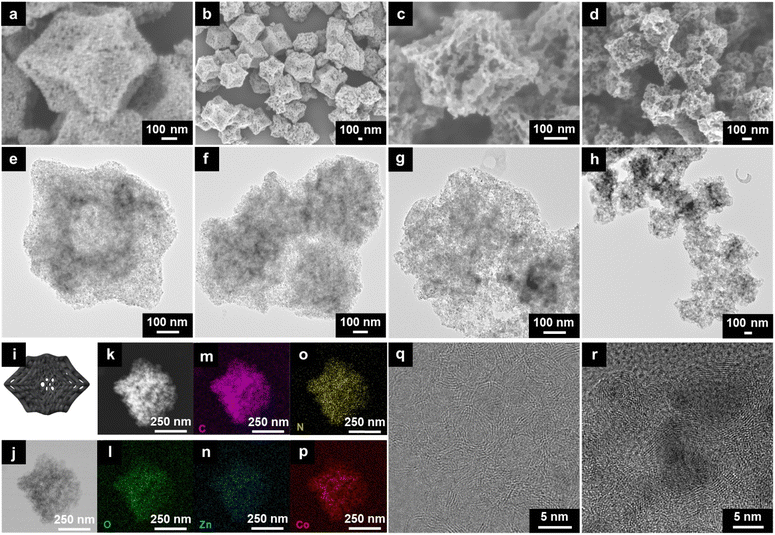
The carbonized forms of Zn33Co67-ZIF and etched Zn33Co67-ZIF (denoted as Zn33Co67-ZIF-C and etched Zn33Co67–C, respectively) were obtained using direct-carbonization at 600 °C followed by the acid washing process. The structural evolution from Zn33Co67-ZIF to Zn33Co67–C was checked using both SEM and TEM (Fig. 5a–h). Both Zn33Co67-ZIF-C and etched Zn33Co67–C largely inherit the rhombic dodecahedron morphology of their precursors (Fig. 5a–d). In addition, mesopores are observed on the surface of Zn33Co67–C, indicating the successful removal of Co NPs after the acid washing process. A more open structure with enlarged nanopores is obtained in etched Zn33Co67–C as compared to Zn33Co67–C (Fig. 5e–h). In comparison, without acid washing, large Co NPs are still observed in the interior of Zn33Co67–C (Fig. S9c and d†). Fig. 5i shows the schematic representation of etched Zn33Co67–C. Bright-field and dark-field STEM images of etched Zn33Co67–C are shown in Fig. 5j and k. The corresponding elemental mappings confirm the existence of O, C, Zn, N, and Co in etched Zn33Co67–C (Fig. 5l–p). The high-resolution TEM of etched Zn33Co67–C shows graphitic layers (Fig. 5q and r).
As compared to Zn33Co67–C, Zn–C derived from ZIF-8 by the same thermal conversion condition also maintains the original rhombic dodecahedron morphology but possesses a smooth surface with no large pores or cracks (Fig. S10†). In contrast, etched Zn–C obtained from the thermal treatment of etched ZIF-8 exhibits a distorted and bumpy surface, as seen in Fig. S11.† Likewise, the N2 adsorption–desorption isotherms of etched ZIF-8 and etched Zn–C confirm the existence of mesopores (Fig. S12†).
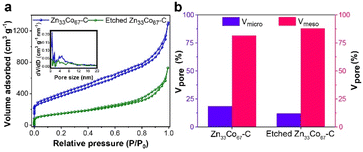
The porosity of Zn33Co67–C and etched Zn33Co67–C was quantified by the N2 adsorption–desorption measurements. The isotherms of both Zn33Co67–C and etched Zn33Co67–C demonstrate a gradual uptake of N2, and the pore size distribution curves indicate their mesoporous characteristics (Fig. 6a). The ratio of the micropore volume in etched Zn33Co67–C (12%) is less than that of Zn33Co67–C (18%), whereas the percentage of the mesopore volume in etched Zn33Co67–C (87%) is higher than that of Zn33Co67–C (81%) (Fig. 6b). The increased ratio of mesopores is beneficial for enhancing the ion diffusion in electrochemical applications.13 Etched Zn33Co67–C has a smaller specific surface area (521 m2 g−1) and pore volume (0.835 cm3 g−1) than Zn33Co67–C (1339 m2 g−1 and 1.616 cm3 g−1), possibly due to the increased amount of mesopores on the particles (Table S4†).
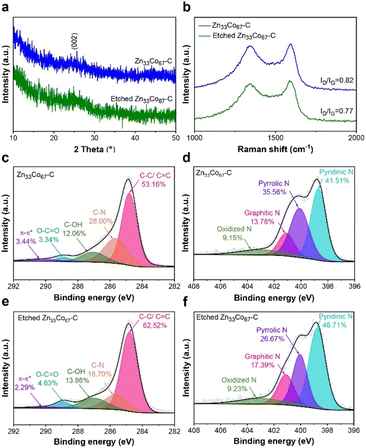
PXRD patterns of Zn33Co67–C and etched Zn33Co67–C show a broad peak at around 26°, which corresponds to the (002) plane of graphite (Fig. 7a). Two sharp peaks at 1346 cm−1 and 1585 cm−1 observed in the Raman spectra correspond to the first-order D and G bands, respectively (Fig. 7b). The D band represents the presence of disordered carbons, while the G band represents the presence of sp2 hybridized graphitic carbons. The peak intensity ratio between the D and G band (ID/IG) can give a good insight into the degree of graphitization.34 The results in Fig. 7b reveal that the ID/IG ratio of etched Zn33Co67–C (0.77) is smaller than that of Zn33Co67–C (0.82), indicating that etched Zn33Co67–C has a greater degree of graphitization than Zn33Co67–C.
The chemical bonding states in Zn33Co67–C and etched Zn33Co67–C were further analyzed by XPS measurements. The high-resolution (HR) XPS spectrum of C 1s displays five main peaks of C–C/CC (284.8 eV), C–N (285.6 eV), C–OH (287.0 eV), O–CO (288.9 eV), and π–π* (290.2 eV) (Fig. 7c). The HRXPS spectrum of N 1s exhibits four main peaks of N species, including pyridinic N (398.7 eV), pyrrolic N (400.1 eV), graphitic N (401.1 eV), and oxidized N (402.9 eV) (Fig. 7d).35–37 Typically, the C–C/CC carbon of etched Zn33Co67–C increases to 62.52 at% as compared to that of Zn33Co67–C (53.16 at%) (Fig. 7c and e).21 The graphitic N of etched Zn33Co67–C rises to 17.39 at% from 13.78 at% (Fig. 7d and f). The high contents of graphitic carbon and nitrogen are beneficial for improving the conductivity for supercapacitors.38 The wide-scan XPS spectra show that etched Zn33Co67–C has a higher carbon atomic percentage (81.87 at%) but lower nitrogen atomic percentage (7.86 at%) compared to Zn33Co67–C (79.56 at% and 9.58 at%, respectively) (Table S5†). We have selected four different local areas and taken the average values of each chemical composition of the unetched and etched Zn33Co67–C particles using EDS elemental analysis (Fig. S13–S16†). It shows that etched Zn33Co67–C has a nearly similar average carbon content (86.70 at%) and a slightly higher average nitrogen content (4.62 at%) as compared to Zn33Co67–C (C: 86.89 at% and N: 3.83 at%) (Table S6†). The weight percentage results show a similar trend (Table S7†).
Electrochemical performance for supercapacitors
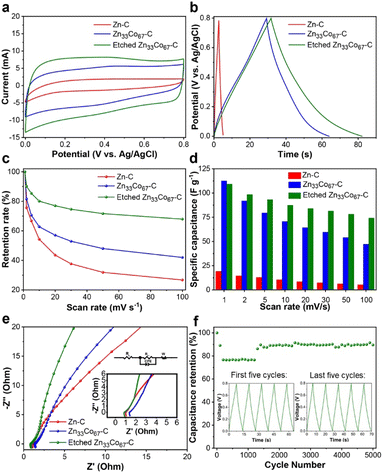
In supercapacitors, electric double-layer capacitors (EDLCs) store electrical energy by the electrostatic accumulation of charges on the polarized surface of electrodes.24 Carbon materials are typical electrode materials demonstrating EDLC properties. Efficient diffusion of electrolyte ions plays a crucial role in enhancing the power density of EDLC-based supercapacitors. The electrochemical performance of Zn33Co67–C, etched Zn33Co67–C, and Zn–C as electrode materials for supercapacitors was evaluated by using a three-electrode system in 1.0 M H2SO4 solution. Cyclic voltammetry (CV) studies were conducted in a potential window range of 0.0 to 0.8 V with the Ag/AgCl reference electrode. As observed in Fig. 8a and S17a–c,† the quasi-rectangular shape of CV curves reveals the EDLC behaviors of the ZIF-derived carbons.17 The integrated area of the CV curve of the etched Zn33Co67–C electrode at a high scan rate of 100 mV s−1 is larger than those of Zn–C and Zn33Co67–C electrodes, revealing that the increased mesoporosity of the etched Zn33Co67–C particles can facilitate better ion diffusion (Fig. 8a).The galvanostatic charge–discharge (GCD) curves of Zn–C, Zn33Co67–C, and etched Zn33Co67–C electrodes were collected at various current densities ranging from 2 to 100 A g−1 (Fig. S17d–f†). The linear nature of the curves confirms the EDLC characteristics of these ZIF-derived carbon samples. The symmetric configuration of the GCD curves of these three samples demonstrates that the EDLC adsorption and desorption processes are reversible. The specific capacitance can be obtained from the potential drop over time of the discharge curves. The etched Zn33Co67–C electrode exhibits specific capacitances of 127, 102, 89, 80, 74, 70, 69, and 61 F g−1 at current densities of 2, 3, 5, 10, 20, 30, 50, and 100 A g−1, respectively. Moreover, the specific capacitance of the etched Zn33Co67–C electrode (127 F g−1) is significantly higher than that of Zn33Co67–C (87 F g−1) and Zn–C electrodes (6 F g−1) at 2 A g−1 (Fig. 8b). It can be inferred that the enhanced specific capacitance of the etched Zn33Co67–C electrode may result from the increased porosity and higher degree of graphitization, thus promoting faster electrolyte and ion diffusion and better electrical conductivity.
In addition, the etched Zn33Co67–C electrode shows the best rate capability with a capacitance retention of 67% with the increasing scan rates from 1 to 100 mV s−1 as compared to 41% and 26% for Zn33Co67–C and Zn–C electrodes, respectively (Fig. 8c). Therefore, the enlarged nanopores by the etching process play an important role in enhancing the capacitance retention because the more abundant mesopores in the ZIF precursors and the derived porous carbons enable more efficient ion diffusion.
Fig. 8d shows the specific capacitance calculated from the CV curves at scan rates of 1, 2, 5, 10, 20, 30, 50, and 100 mV s−1 for Zn–C, Zn33Co67–C, and etched Zn33Co67–C electrodes, respectively. At a low scan rate of 1 mV s−1, the Zn33Co67–C and etched Zn33Co67–C electrodes exhibit specific capacitances of 112 and 109 F g−1, respectively, which are significantly higher than that of the Zn–C electrode (19 F g−1). Furthermore, the specific capacitance decreases with the increase of scan rate. This is because the electrolyte ions have adequate time to interact with the electrode interface for adsorption and desorption at low scan rates.39 At a high scan rate of 100 mV s−1, the specific capacitance of the etched Zn33Co67–C (74 F g−1) electrode is 1.6- and 14.8-times higher than that of Zn33Co67–C (47 F g−1) and Zn–C (5 F g−1) electrodes, respectively. This shows that the increase in the ratio of mesopores allows for faster diffusion of ions and contributes to the higher capacitance.
Electrochemical impedance spectroscopy (EIS) was used to analyze the internal charge transfer resistance in the ZIF-derived porous carbon samples (Fig. 8e). From the equivalent series resistance obtained from the intercept at the Z′ axis, the electrical conductivity of the materials can be deduced. The equivalent series resistance (Rs) value of the etched Zn33Co67–C electrode (0.86 Ω) is lower than that of the Zn33Co67–C electrode (1.33 Ω), indicating that the increased graphitization in etched Zn33Co67–C enhances its electrical conductivity. The EIS curve of the etched Zn33Co67–C electrode displays a steeper slope as compared to the Zn33Co67–C and Zn–C electrodes, implying that it has the greatest capacitive behavior among the three electrodes. The high capacitive behavior of the etched Zn33Co67–C electrode may be attributed to the interconnected hierarchical porous structure, which can promote faster and more efficient ion transport.
Moreover, the stability test of the etched Zn33Co67–C electrode was performed by repeating the charge–discharge cycles at a current density of 10 A g−1 (Fig. 8f). In the first 1000 cycles, 77% of the initial specific capacitance of the etched Zn33Co67–C electrode is maintained. From 1000 cycles to 5000 cycles, 90% of the initial capacitance is retained. The increase in the capacitance retention after 1000 cycles may be due to the increased wetting of the hierarchical porous carbon (etched Zn33Co67–C) electrode.
Conclusions
In summary, bimetallic ZIF-derived Co and N co-doped hierarchical porous carbon containing large mesopores has been achieved by an EG–assisted aqueous etching treatment. Unlike ZIF-8 which contains only zinc ions, the bimetallic Zn33Co67-ZIF exhibits more mesopores following the etching process due to the weaker coordination between Co2+ and 2-methylimidazole compared to Zn2+. The etched Zn33Co67–C electrode shows the best rate capability with a capacitance retention of 67% with the increase of the scan rate from 1 to 100 mV s−1 compared to 41% and 26% for Zn33Co67–C and Zn–C electrodes, respectively. Additionally, it shows a high capacitance retention of ∼90% after 5000 cycles of charge–discharge at a high current density of 10 A g−1, indicating the good cyclability of the etched Zn33Co67–C electrode. It is expected that the proposed EG–water etching strategy will provide a useful method for enlarging the porosity of MOF-derived porous carbons without the need for external templates.Author contributions
R. X.: investigation, methodology, data curation, formal analysis, visualization; M. K.: conceptualization, investigation, methodology, formal analysis, visualization, writing – review & editing, validation; P. C.: formal analysis, writing – review & editing; A. A.: data curation, formal analysis; S. C.: formal analysis, validation; T. P.: formal analysis, writing – review & editing; A. A.: data curation, investigation; M. S. H.: writing – review & editing, supervision, J. T.: investigation, formal analysis, validation; J. W. Y.: writing – review & editing, funding acquisition; Y. Y.: resources, writing – review & editing, funding acquisition, supervision; Y. V. K.: writing – review & editing, project administration, visualization, supervision; J. N.: conceptualization, writing – review & editing, project administration, supervision.Conflicts of interest
There are no conflicts to declare.Acknowledgements
This research was supported by the Principal Research Program (PNK8740) at the Korea Institute of Materials Science (KIMS).References
- J. W. Long, D. Belanger, T. Brousse, W. Sugimoto, M. B. Sassin and O. Crosnier, MRS Bull., 2011, 36, 513–522 CrossRef.
- M. M. Liu, N. T. He, H. X. Guo, S. M. Ying and Z. X. Chen, Chin. J. Struct. Chem., 2021, 40, 806–810 Search PubMed.
- M. Kim, J. F. S. Fernando, J. Wang, A. K. Nanjundan, J. Na, M. S. A. Hossain, H. Nara, D. Martin, Y. Sugahara, D. Golberg and Y. Yamauchi, Chem. Commun., 2022, 58, 863–866 RSC.
- M. Kim, J. F. S. Fernando, Z. B. Li, A. Alowasheeir, A. Ashok, R. J. Xin, D. Martin, A. K. Nanjundan, D. V. Golberg, Y. Yamauchi, N. Amiralian and J. L. Li, Chem. Eng. J., 2022, 445, 136344 CrossRef CAS.
- M. Thommes, K. Kaneko, A. V. Neimark, J. P. Olivier, F. Rodriguez-Reinoso, J. Rouquerol and K. S. W. Sing, Pure Appl. Chem., 2015, 87, 1051–1069 CrossRef CAS.
- Y. F. Deng, Y. Xie, K. X. Zou and X. L. Ji, J. Mater. Chem. A, 2016, 4, 1144–1173 RSC.
- S. H. Lee, J. Kim, D. Y. Chung, J. M. Yoo, H. S. Lee, M. J. Kim, B. S. Mun, S. G. Kwon, Y. E. Sung and T. Hyeon, J. Am. Chem. Soc., 2019, 141, 2035–2045 CrossRef CAS.
- J. Tang, T. Wang, R. R. Salunkhe, S. M. Alshehri, V. Malgras and Y. Yamauchi, Chem.–Eur. J., 2015, 21, 17293–17298 CrossRef CAS PubMed.
- N. P. Wickramaratne, J. T. Xu, M. Wang, L. Zhu, L. M. Dai and M. Jaroniec, Chem. Mater., 2014, 26, 2820–2828 CrossRef CAS.
- J. Wang, J. Tang, B. Ding, V. Malgras, Z. Chang, X. Hao, Y. Wang, H. Dou, X. Zhang and Y. Yamauchi, Nat. Commun., 2017, 8, 15717 CrossRef CAS PubMed.
- H. Furukawa, K. E. Cordova, M. O'Keeffe and O. M. Yaghi, Science, 2013, 341, 1230444 CrossRef.
- X. M. Wu, M. M. Liu, H. X. A. Guo, S. M. Ying and Z. X. Chen, Chin. J. Struct. Chem., 2021, 40, 994–998 CAS.
- M. Kim, K. L. Firestein, J. F. S. Fernando, X. T. Xu, H. Lim, D. V. Golberg, J. Na, J. Kim, H. Nara, J. Tang and Y. Yamauchi, Chem. Sci., 2022, 13, 10836–10845 RSC.
- S. Chowdhury, N. L. Torad, A. Ashok, G. Gumilar, W. Chaikittisilp, R. Xin, P. Cheng, M. I. Ul Hoque, M. A. Wahab, M. R. Karim, B. Yuliarto, M. S. Hossain, Y. Yamauchi and Y. V. Kaneti, Chem. Eng. J., 2022, 450, 138065 CrossRef CAS.
- C. H. Wang, D. W. Zhang, S. D. Liu, Y. Yamauchi, F. B. Zhang and Y. V. Kaneti, Chem. Commun., 2022, 58, 1009–1012 RSC.
- J. S. Wang, X. H. Yi, X. T. Xu, H. D. Ji, A. M. Alanazi, C. C. Wang, C. Zhao, Y. V. Kaneti, P. Wang, W. Liu and Y. Yamauchi, Chem. Eng. J., 2022, 431, 133213 CrossRef CAS.
- J. Tang, R. R. Salunkhe, J. Liu, N. L. Torad, M. Imura, S. Furukawa and Y. Yamauchi, J. Am. Chem. Soc., 2015, 137, 1572–1580 CrossRef CAS PubMed.
- M. Kim, X. T. Xu, R. J. Xin, J. Earnshaw, A. Ashok, J. Kim, T. Park, A. K. Nanjundan, W. A. El-Said, J. W. Yi, J. Na and Y. Yamauchi, ACS Appl. Mater. Interfaces, 2021, 13, 52034–52043 CrossRef CAS.
- R. Banerjee, A. Phan, B. Wang, C. Knobler, H. Furukawa, M. O'Keeffe and O. M. Yaghi, Science, 2008, 319, 939–943 CrossRef CAS.
- N. L. Torad, R. R. Salunkhe, Y. Q. Li, H. Hamoudi, M. Imura, Y. Sakka, C. C. Hu and Y. Yamauchi, Chem.–Eur. J., 2014, 20, 7895–7900 CrossRef CAS.
- J. Tang, R. R. Salunkhe, H. Zhang, V. Malgras, T. Ahamad, S. M. Alshehri, N. Kobayashi, S. Tominaka, Y. Ide, J. H. Kim and Y. Yamauchi, Sci. Rep., 2016, 6, 30295 CrossRef PubMed.
- C. Avci, J. Arinez-Soriano, A. Carne-Sanchez, V. Guillerm, C. Carbonell, I. Imaz and D. Maspoch, Angew. Chem., Int. Ed., 2015, 54, 14417–14421 CrossRef CAS.
- W. H. Choi, B. C. Moon, D. G. Park, J. W. Choi, K. H. Kim, J. S. Shin, M. G. Kim, K. M. Choi and J. K. Kang, Adv. Sci., 2020, 7, 2000283 CrossRef CAS.
- T. Y. Liu, F. Zhang, Y. Song and Y. Li, J. Mater. Chem. A, 2017, 5, 17705–17733 RSC.
- S. Gadipelli, T. T. Zhao, S. A. Shevlin and Z. X. Guo, Energy Environ. Sci., 2016, 9, 1661–1667 RSC.
- G. Kaur, R. K. Rai, D. Tyagi, X. Yao, P. Z. Li, X. C. Yang, Y. L. Zhao, Q. Xu and S. K. Singh, J. Mater. Chem. A, 2016, 4, 14932–14938 RSC.
- S. Tanaka, K. Fujita, Y. Miyake, M. Miyamoto, Y. Hasegawa, T. Makino, S. Van der Perre, J. C. Saint Remi, T. Van Assche, G. V. Baron and J. F. M. Denayer, J. Phys. Chem. C, 2015, 119, 28430–28439 CrossRef.
- M. A. Ali, J. J. Ren, T. Y. Zhao, X. F. Liu, Y. J. Hua, Y. Z. Yue and J. R. Qiu, ACS Omega, 2019, 4, 12081–12087 CrossRef PubMed.
- J. B. Zhang, P. Y. Zhang, K. Ma, F. Han, G. H. Chen and X. H. Wei, Sci. China, Ser. B: Chem., 2008, 51, 420–426 CrossRef.
- T. Seki, K. Y. Chiang, C. C. Yu, X. Q. Yu, M. Okuno, J. Hunger, Y. Nagata and M. Bonn, J. Phys. Chem. Lett., 2020, 11, 8459–8469 CrossRef CAS PubMed.
- Y. Wang, F. B. Li, W. H. Fang, C. L. Sun and Z. W. Men, Spectrochim. Acta, Part A, 2021, 260, 119916 CrossRef CAS.
- Z. A. Huang, J. Q. Zhou, Y. Y. Zhao, H. B. Cheng, G. X. Lu, A. W. Morawski and Y. Yu, J. Mater. Res., 2021, 36, 602–614 CrossRef CAS.
- X. K. Qian, Q. B. Ren, X. F. Wu, J. Sun, H. Y. Wu and J. Lei, ChemistrySelect, 2018, 3, 657–661 CrossRef CAS.
- X. Q. Li, C. L. Hao, B. C. Tang, Y. Wang, M. Liu, Y. W. Wang, Y. H. Zhu, C. G. Lu and Z. Y. Tang, Nanoscale, 2017, 9, 2178–2187 RSC.
- M. Kim, R. J. Xin, J. Earnshaw, J. Tang, J. P. Hill, A. Ashok, A. K. Nanjundan, J. Kim, C. Young, Y. Sugahara, J. Na and Y. Yamauchi, Nat. Protoc., 2022, 17, 2990–3027 CrossRef CAS PubMed.
- I. S. Amiinu, X. B. Liu, Z. H. Pu, W. Q. Li, Q. D. Li, J. Zhang, H. L. Tang, H. N. Zhang and S. C. Mu, Adv. Funct. Mater., 2018, 28, 1704638 CrossRef.
- J. Wang, X. L. Luo, C. Young, J. Kim, Y. V. Kaneti, J. You, Y. M. Kang, Y. Yamauchi and K. C. W. Wu, Chem. Mater., 2018, 30, 4401–4408 CrossRef CAS.
- S. Ghosh, S. Barg, S. M. Jeong and K. Ostrikov, Adv. Energy Mater., 2020, 10, 44 Search PubMed.
- A. Akram, M. A. Liaqat, S. Javed, M. Hamid, U. Ali, F. Javed, M. D. Wei and M. A. Akram, J. Alloys Compd., 2022, 891, 161961 CrossRef CAS.
Footnote |
| † Electronic supplementary information (ESI) available. See DOI: https://doi.org/10.1039/d2ta06307g |
| This journal is © The Royal Society of Chemistry 2023 |

