
 Open Access Article
 This Open Access Article is licensed under a
 Creative Commons Attribution 3.0 Unported Licence
Structure and properties of biobased polyamide 36,9/cellulose nanocomposites
Yeyen
Nurhamiyah
 ab and
Biqiong
Chen
*a
ab and
Biqiong
Chen
*a
aSchool of Mechanical and Aerospace Engineering, Queen's University Belfast, Stranmillis Road, Belfast, BT9 5AH, UK. E-mail: b.chen@qub.ac.uk
bResearch Center for Biomass and Bioproducts, National Research and Innovation Agency (BRIN), Jl. Raya Bogor Km 46 Cibinong, Bogor, 16911, Indonesia
First published on 20th October 2023
Abstract
The research into replacing polymers from fossil fuels with those from renewable resources has recently been attracting increasing interest from researchers. Biobased polymers with renewable additives such as cellulose nanocrystals (CNCs) are emerging as promising substitutes. In this article, fully biobased nanocomposites were produced from a biobased polyamide elastomer, PA36,9, reinforced with CNCs. The addition of CNCs influences the morphological features and thermal and mechanical properties of the neat polymer. It slightly reduces the melting temperature and crystallinity of the polymer, and increases its glass transition temperature. Furthermore, the incorporation of CNCs provides significant enhancements in the tensile Young's modulus, storage modulus and hardness of the polymer matrix. The Young's modulus of PA36,9/CNC nanocomposites closely follows the Halpin–Tsai model for the composites with a 2D randomly dispersed filler. In general, these biobased CNC-reinforced thermoplastic elastomer nanocomposites could be promising recyclable and renewable substitutes for some existing synthetic elastomers with similar properties.
Sustainability spotlightMost polymers are derived from fossil fuels, which are not renewable. Furthermore, the reinforcing fillers in polymer composites are often not renewable and/or recyclable. This work investigates a type of fully biobased polymer nanocomposites, which are both renewable and recyclable, as potential substitutes with improved sustainability for some conventional elastomers. The work aligns with UN SDG-12: responsible consumption and production. |
Introduction
The trend of sustainable products is increasing due to the demand from the consumers, industry, and government towards carbon-neutral products, as well as generating low impact to the environment. The research on biobased polymers has gained considerable attention with the aim to substitute fossil fuel-based polymers. Despite good properties, these biobased polymers may be reinforced by renewable fillers to broaden their applications.Cellulose nanocrystals (CNCs) are whisker-like particles that have a high crystallinity (54–88%), aspect ratio (18–100), and Young's modulus (110–220 GPa).1 Together with their renewability, these excellent properties make CNCs attractive nanofillers in polymer nanocomposites. In polymer nanocomposites, CNCs act as the load-bearing component which can generate reinforcement for polymer matrices. For example, CNCs were used to reinforce polycaprolactone-based waterborne polyurethane.2 The resulting nanocomposites demonstrated a marked improvement in tensile strength from 4.27 to 14.86 MPa and Young's modulus from 0.51 to 344 MPa, with CNC content varied from 0 to 30 wt%. CNCs were also used to reinforce polyamide 6 (PA6), and similarly significant enhancements in tensile strength and Young's modulus were achieved.3,4 The incorporation of CNCs into biodegradable poly(glycerol sebacate urethane) increased the tensile strength up to 9 times its original value, and Young's modulus up to 44 times while only slightly decreasing the elongation at break. CNCs also provide the nanocomposites with a water-responsive shape-memory effect for potential use in minimally invasive medical devices.5 CNCs have been used to reinforce various biobased polymers including polyurethane,6,7 epoxy,8 and polyester-amide.9 Recently, we reported the preparation of wholly biobased PA36,36/CNC nanocomposites with filler loadings of 10 wt% and 30 wt%.10 The addition of CNCs to PA36,36 enhanced the tensile strength by up to 700%, Young's modulus by 750%, Shore A hardness by 410% and Shore D hardness by 400%, while maintaining a high elongation at break of around 830%.10,11
After a successful attempt of improving the mechanical properties of PA36,36 with CNCs, in this work, we aim to enhance the properties of biobased PA36,9, which was recently synthesised in our laboratory,12 by developing fully biobased PA36,9/CNC nanocomposites to broaden its applications. PA36,9 is a semi-crystalline biobased polyamide elastomer, with a large elongation at break (1220%), a high tensile strength (31.8 MPa), medium hardness (Shore A/Shore D = 90/35) and excellent hydrophobicity.12 It is a promising sustainable elastomer for applications such as insulation, sealing, automotive components and electronics. Biobased PA36,9/CNC nanocomposites with various contents of CNCs (5 wt%, 10 wt% and 15 wt%) were prepared by solvent casting. These CNC contents were selected because high contents of CNCs were demonstrated to show good improvements in the mechanical properties of elastomers.5,10,13 The impact of the CNC filler and filler content on the structure and thermal and mechanical properties of PA36,9 was investigated. Quantitative analysis of the Young's modulus of the biobased nanocomposites was also carried out.
Experimental section
Materials
Microcrystalline cellulose (MCC) and tetrahydrofuran (THF, Emplura) were purchased from VWR UK. Sulphuric acid (98%, H2SO4) was supplied by Sigma-Aldrich. PA36,9 was prepared in accordance with our recent publication,12 with a weight average molecular weight (![[M with combining macron]](https://www.rsc.org/images/entities/i_char_004d_0304.gif) w) of 95
w) of 95![[thin space (1/6-em)]](https://www.rsc.org/images/entities/char_2009.gif) 200 g mol−1, polydispersity index of 2.95, glass transition temperature (Tg) of 17.6 °C, and melting temperature (Tm) of 83.6 °C.
200 g mol−1, polydispersity index of 2.95, glass transition temperature (Tg) of 17.6 °C, and melting temperature (Tm) of 83.6 °C.
Preparation of PA36,9/CNC nanocomposites
The preparation of PA36,9/CNC nanocomposites followed the procedures reported in our previous studies.10,12 Briefly, CNC/THF suspensions with a known concentration were prepared by the hydrolysis of MCC with sulphuric acid, followed by purification and dispersion of CNCs in THF. Separately, polyamide was dissolved in THF to prepare a 10 wt% PA36,9/THF solution. The CNC suspension with a pre-determined concentration and the polymer solution were mixed together in a beaker by stirring at room temperature, first covered with a polyethylene film for 20 h, and then uncovered for 4 h to remove most of the THF. The resulting mixture paste was cast into a Teflon Petri dish and kept in a fume hood to dry.Characterisation
The microstructure of the PA36,9/CNC nanocomposites was investigated on a Hitachi FLEX SEM 1000 scanning electron microscope (SEM), at an accelerating voltage of 15 kV. The film samples were placed on a 3.2 mm pin stub which was coated with gold by using an Agar auto sputter coater. The top surface of the film was observed. Fourier transform infrared (FTIR) spectroscopy was carried out with attenuated total reflectance using a PerkinElmer Spectrum 100 between 4000 and 600 cm−1, with a resolution of 1 cm−1. Differential scanning calorimetry (DSC) was performed on a PerkinElmer Pyris 6 DSC. Two heating–cooling cycles were applied from 30 °C to 120 °C with a heating–cooling rate of 10 °C min−1. The second heating–cooling curves were analysed. The degrees of crystallinity (Xc) of PA36,9 and its nanocomposites were calculated from the melting peak using eqn (1).13 | (1) |
Thermal decomposition was investigated by thermogravimetric analysis (TGA) (Q50 TA Instruments) from 40 °C to 600 °C at a heating rate of 10 °C min−1 under nitrogen flow at a rate of 50 ml min−1. The onset thermal degradation temperature (Tonsetd) was determined from the TGA curves according to ISO 11358-1, while peak thermal degradation temperature (Tpeakd) was the peak temperature obtained from the derivative thermogravimetry (DTG) curves. Dynamic mechanical analysis (DMA) was conducted on a Tritec 2000 with single cantilever mode. A rectangular sample with a length of 10 mm and thickness of 1 mm was tested from −120 °C to 80 °C with a heating rate of 3 °C min−1 at 1 Hz frequency. Tensile properties were determined on a Lloyds LS5 mechanical testing machine equipped with a 500 N load cell. Testing was conducted at ambient temperature (16 °C) at a crosshead speed of 100 mm min−1. A square piece of film with dimensions of 10 cm × 10 cm × 0.5 mm was produced by hot pressing using a Rondol manual platen press at 120 °C for 4 min. The test samples of dumb-bell shape (British Standard ISO-37 type 3) were then shaped from the film using a die cutter. Shore D hardness testing was performed in accordance with ISO868 on a Coats Comaco rubber hardness tester. Both tests were repeated three times.
Results and discussion
Surface morphology
As described in our recent publications,10 the CNCs have an average diameter and length of 22.2 ± 2.9 nm and 286.1 ± 34.1 nm, respectively. The morphology of the top surface of PA36,9/CNC nanocomposites with different CNC contents was observed with SEM (Fig. 1). Neat PA36,9 displays a rough surface, which is also spotted in its nanocomposites. Whisker-like features are also seen on the surface of PA36,9/CNC 5 wt% (Fig. 1b), attributable to the presence of high-aspect-ratio CNCs. Such whisker-like features are rather scarce in this nanocomposite with a lower CNC loading. In the nanocomposite with 10 wt% CNCs, the whisker-like features become more frequent. When the CNC loading increases to 15 wt%, larger granules appear instead of whisker-like features, which indicates agglomeration of some CNCs because of the higher concentration of CNCs. The CNCs have a high specific surface area and total surface energy, which are responsible for their strong tendency to agglomerate.15 | ||
| Fig. 1 Surface morphology of (a) PA36,9, and PA36,9/CNC nanocomposites with CNC contents of (b) 5 wt%, (c) 10 wt% and (d) 15 wt%. | ||
Chemical structure
FTIR was used to study the interfacial interactions between PA36,9 and CNCs in their nanocomposites. The FTIR spectra of PA36,9 and its nanocomposites are shown in Fig. 2. The characteristic peaks of PA36,9 have been described in our previous publication.12 Briefly, amide bands are observed at 3293 cm−1 for amide A, 1636 cm−1 for amide I, 1551 cm−1 for amide II, and 1242 cm−1 for amide III. The CNC functional groups are detected at 3357 cm−1, 1163 cm−1, 1111 cm−1, and 1059 cm−1, which are ascribed to the O–H stretching, C–O–C asymmetric vibration, asymmetric glucose ring stretching, and C–O–C pyranose ring stretching, respectively.10,16 The peak at 1242 cm−1 for PA36,9 shifts to 1244 cm−1 in the nanocomposites, indicating hydrogen bonding interactions between the amide III groups of PA36,9 and the hydroxyl groups of CNCs.17 | ||
| Fig. 2 FTIR spectra of PA36,9,12 CNC and PA36,9/CNC nanocomposites with different CNC contents in the ranges of (a) 4000–650 cm−1 and (b) 1500–1000 cm−1. | ||
Thermal properties
In order to study the melting and the crystallisation behaviour of PA36,9 and its CNC nanocomposites, DSC was employed. Fig. 3a displays the heating traces of PA36,9 and its nanocomposites filled with different concentrations of CNCs. It is observed that a peak corresponding to the melting transition appears in all samples. Compared to neat PA36,9, Tm of the nanocomposites slightly shifts to a lower temperature. The Tm values for PA36,9,12 PA36,9/CNC 5 wt%, PA36,9/CNC 10 wt%, and PA36,9/CNC 15 wt% are 83.6 °C, 81.5 °C, 82.0 °C, and 80.3 °C, respectively. | ||
| Fig. 3 DSC thermograms of PA36,9 (ref. 9) and PA36,9/CNC nanocomposites with different CNC contents: (a) heating and (b) cooling. | ||
The Xc values of the nanocomposites are 5.9% for PA36,9/CNC 5 wt%, 5.5% for PA36,9/CNC 10 wt%, and 5.0% for PA36,9/CNC 15 wt%, respectively, lower than that of the neat PA36,9 (6.1%).12 As described in our previous publication,12 the low crystallinity of PA36,9 is due to the presence of two dangling chains in each repeating unit of the polymer, which significantly reduces the chain regularity for crystallisation. Fig. 3b exhibits the cooling scans of neat PA36,9 and its CNC nanocomposites with various filler contents. All traces display a crystallisation peak during the cooling process. The temperature of crystallisation (Tc) for neat PA36,9 is 46.3 °C,12 which remains the same for PA36,9/CNC 5 wt%. But for the nanocomposites with CNC loadings of 10 wt% and 15 wt%, their Tc values are slightly lower, being 45.8 °C and 44.6 °C, respectively.
Both Tc and Xc of the nanocomposites are slightly reduced regardless of the CNC content, known as the anti-nucleation effect.18 This may be related to the strong interactions between CNCs and PA36,9, which restrict the movement of the polymer chains, hence hindering chain rearrangement and the crystallisation process. All the thermal analysis results are summarised in Table 1.
| Sample | T m (°C) | X c (%) | T c (°C) | T onsetd (°C) CNC,PA | T peakd (°C) CNC,PA | T g (°C) |
|---|---|---|---|---|---|---|
| PA36,9 | 83.6 (ref. 12) | 6.1 (ref. 12) | 46.3 (ref. 12) | —,427 | —,464 | 15.3 |
| PA36,9/CNC 5 wt% | 81.5 | 5.9 | 46.0 | 340428 |
367465 |
16.0 |
| PA36,9/CNC 10 wt% | 82.0 | 5.5 | 45.8 | 332433 |
367468 |
17.2 |
| PA36,9/CNC 15 wt% | 80.3 | 5.0 | 44.6 | 304435 |
367465 |
17.9 |
The thermal degradation behaviour of PA36,9 and PA36,9/CNC nanocomposites of different compositions, determined from TGA, is displayed in Fig. 4a, and the results are summarised in Table 1. The thermal degradation behaviour of CNCs was investigated in our earlier work,10 which reported a Tonsetd and Tpeakd of CNCs of 255 °C and 327 °C, respectively. Tonsetd of neat PA36,9 is observed at 427 °C, lower than that of PA36,9 reported in our previous work (434 °C)12 presumably because the polymer has undergone a solvent treatment in this work. Meanwhile, the nanocomposites exhibit two stages of degradation, similar to PA36,36/CNC nanocomposites.10 The first stage Tonsetd values for PA36,9/CNC 5 wt%, PA36,9/CNC 10 wt% and PA36,9/CNC 15 wt% are 340 °C, 332 °C and 304 °C, which are associated with the degradation of CNCs.10 The higher the content of CNCs, the lower the Tonsetd for the nanocomposite. The second stage Tonsetd values for PA36,9/CNC 5 wt%, PA36,9/CNC 10 wt% and PA36,9/CNC 15 wt% are 428 °C, 433 °C and 435 °C, which are associated with the degradation of the matrix PA36,9 but higher than its Tonsetd. These higher values in the nanocomposites are attributable to their strong interfacial interactions described above.
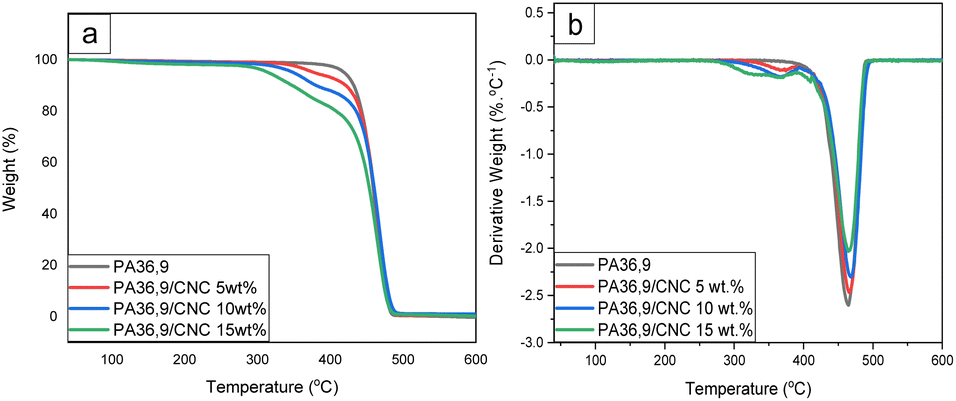 | ||
| Fig. 4 (a) TGA and (b) DTG curves of PA36,9 and PA36,9/CNC nanocomposites with different CNC contents. | ||
Compared to neat PA36,9, one additional small peak at around 367 °C is noticed in the DTG curve for the nanocomposites, which is associated with the degradation of the CNC components, and the intensive peak at 464 °C is related to the degradation of the polymer fraction. As the CNC content in PA36,9 increases, the Tpeakd of the nanocomposite increases slightly, up to 468 °C for PA36,9/CNC 10 wt%. The slight increase in Tpeakd could also be attributed to the interfacial bonding between the two constituents.19
Thermo-mechanical properties
The viscoelastic properties of PA36,9 and its CNC nanocomposites were measured by DMA. The storage modulus (E′) vs. temperature curves of the polymer and nanocomposites are shown in Fig. 5a. The storage modulus represents the elastic response of a material. The addition of CNCs increases E′ of PA36,9 significantly, and the higher contents of CNCs, generally, lead to higher E′ values, in particular, in the glass–rubber transition and the rubbery regions. The increases in storage modulus in the nanocomposites are due to the stiffening effect of the CNCs which have a much higher modulus than the matrix.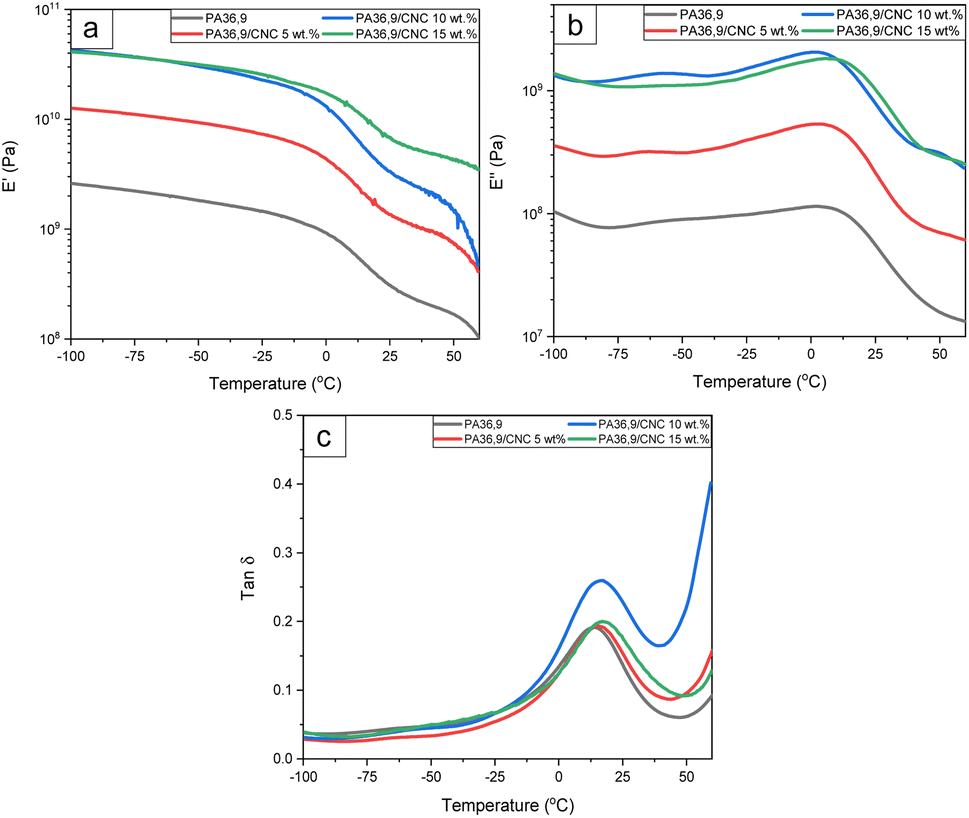 | ||
| Fig. 5 DMA curves of PA36,9 and PA36,9/CNC nanocomposites with different CNC contents, as a function of temperature: the (a) storage modulus (E′), (b) loss modulus (E′′), and (c) loss factor (tanδ). | ||
The loss modulus (E′′) vs. temperature curves of PA36,9 and its nanocomposites are shown in Fig. 5b. The loss modulus represents the viscous properties of the material and is related to the dissipation energy. Similar to E′, E′′ increases with the addition of CNCs, and the E′′ values for the higher CNC contents (10 wt% and 15 wt%) are higher than that for 5 wt% CNC content. The higher E′′ values in the nanocomposites, compared to the value of the neat polymer, indicate that CNCs restrict the molecular motion of PA36,9 thus increasing the dissipation energy.20
The loss factor (tanδ) of the nanocomposites as a function of temperature is displayed in Fig. 5c. The peak temperature of loss factor is determined as the Tg, and the values for the nanocomposites are higher than that of the polymer matrix (Table 1). Tg of neat PA36,9 is 15.3 °C, which increases to 17.9 °C for the nanocomposite with a CNC loading of 15 wt%. The incorporation of CNCs restricts the chain mobility, hence increasing the Tg of the nanocomposites.10
Tensile properties and Shore D hardness
Fig. 6 displays the typical tensile stress–strain curves of neat PA36,9 and PA36,9/CNC nanocomposites with various CNC concentrations. The data including tensile strength, Young's modulus and elongation at break are listed in Table 2. The tensile strength, Young's modulus and elongation at break for neat PA36,9 are 27.0 ± 1.3 MPa, 22.0 ± 1.4 MPa, and 919 ± 99%, respectively. The tensile strength and elongation at break are different from the values reported in our recent publication.12 This could be because of the solution casting process employed in this work which could have triggered disentanglement and rearrangement of some polymer chains, lowering the number of physical crosslinks in the elastomer.10,21 The tensile strength values of the nanocomposites with CNC loadings of 5 wt%, 10 wt% and 15 wt% are 18.7 ± 0.4 MPa, 24.0 ± 2.3 MPa, and 25.4 0.7 MPa, respectively. The decreases in the tensile strength from the polymer matrix to the nanocomposites are statistically insignificant except for PA36,9/CNC 5 wt% which shows a statistically significant decrease (two-tailed t-test, p < 0.05 considered as significant). The reduction in the crystallinity of the polymer,22 and the possible agglomeration of CNCs discussed above might have resulted in weak load transfer from the polymer matrix to the filler when under applied force.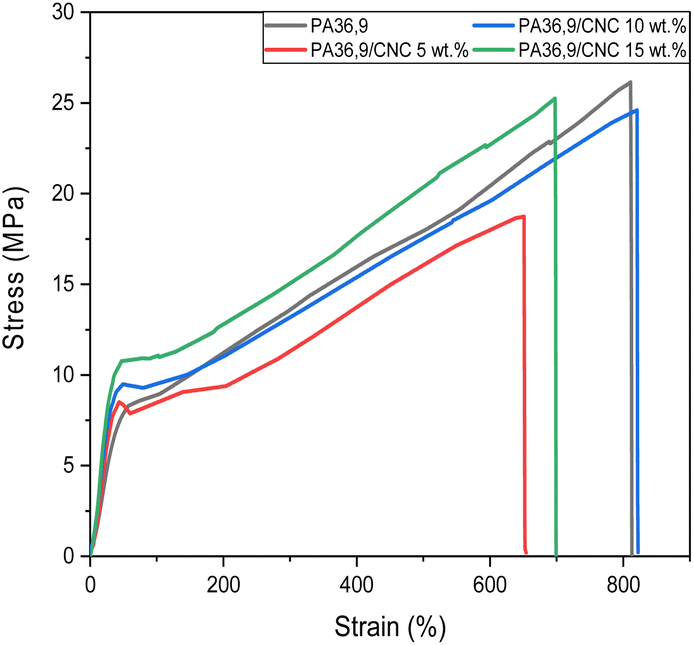 | ||
| Fig. 6 Representative tensile stress–strain curves of PA36,9 and PA36,9/CNC nanocomposites with different CNC contents. | ||
| σ (MPa) | E (MPa) | ε (%) | Shore D hardness | |
|---|---|---|---|---|
| PA36,9 | 27.0 ± 1.4 | 22.0 ± 1.4 | 918.5 ± 99.0 | 35 ± 0 |
| PA36,9/CNC 5 wt% | 18.7 ± 0.4 | 28.5 ± 3.8 | 678.7 ± 60.5 | 42 ± 2.1 |
| PA36,9/CNC 10 wt% | 24.0 ± 2.3 | 35.5 ± 0.2 | 837.4 ± 60.2 | 45 ± 0 |
| PA36,9/CNC 15 wt% | 25.4 ± 0.7 | 40.1 ± 1.3 | 762.8 ± 92.3 | 45 ± 0.6 |
The Young's modulus (E) values of the nanocomposites with CNC concentrations of 5 wt%, 10 wt% and 15 wt% are 28.5 ± 3.8 MPa, 35.5 ± 0.2 MPa, and 40.1 ± 1.3 MPa, respectively, which represent increases of up to 82% in contrast to the modulus for the neat polymer. These increments suggest the effective stiffening effect of CNCs in the polymer matrix.23 The high stiffness, aspect ratio and specific surface area of CNCs, together with the hydrogen bonding between CNCs and the polymer, contribute to the improvements in Young's modulus in the nanocomposites. The quantitative analysis of the Young's modulus by using the Halpin–Tsai model for composites is presented in the next section.
The elongation at break of PA36,9 decreases to 678.7 ± 60.5%, with statistical significance, by the addition of 5 wt% CNCs. In contrast, at 10 wt% and 15 wt% CNC loadings it shows statistically insignificant decreases compared to that of neat PA36,9. The lower elongation at break could be associated with the embrittlement effects from CNCs.24 Similar to the case of Young's modulus, the incorporation of CNCs also increases the hardness of the elastomer, which is summarised in Table 2.
The Shore D hardness of neat PA36,9 is 35, increasing to 45 with the addition of 10 wt% CNCs. The enhanced hardness of PA36,9 nanocomposites is also because of the stiffening effect of the CNC filler.25
The hardness of these nanocomposites is similar to that of other types of medium-hardness thermoplastic elastomers such as PEBAX 4033 with a Shore D hardness of 40, Pearlthane 15N95UV with a hardness of 45, and Pebax 3533 with a hardness of 33 (data from manufacturers' specification sheets). Medium-hardness elastomers offer a combination of flexible features and rigidity, which may be suitable for applications in electronics, footwear, fire hoses and automotive parts.12
Quantitative analysis of the Young's modulus of nanocomposites
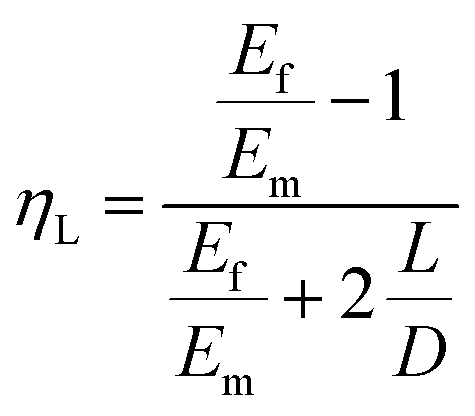
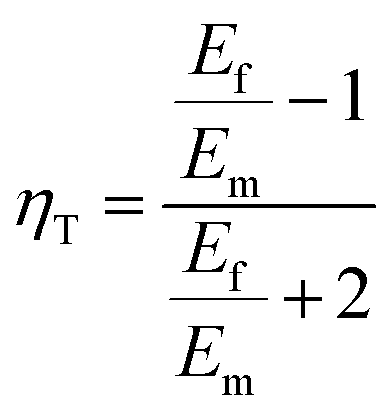
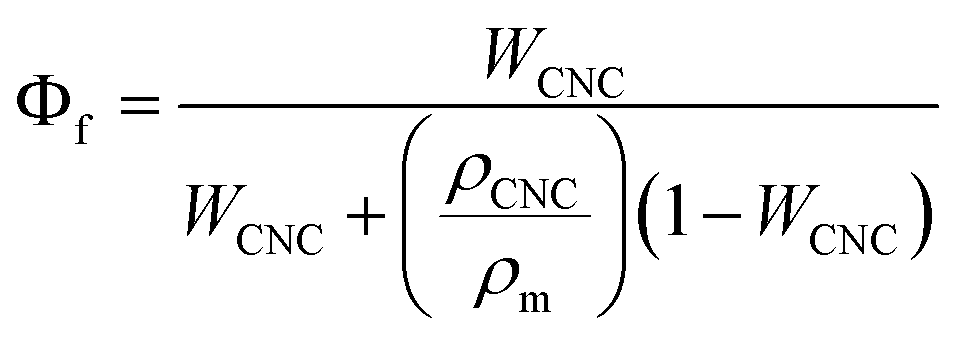
The Halpin–Tsai model is commonly used to forecast the Young's moduli of unidirectional or randomly distributed fibre-reinforced composites.26 It considers that the particle and matrix are firmly bonded and linearly elastic.26,27 The Young's modulus for a randomly dispersed composite, Ec, is obtained from the following equation:26| EC = αEL + (1 − α) ET | (2) |
 | (3) |
 | (4) |
 | (5) |
 | (6) |
 | (7) |
The Young's moduli of PA36,9/CNC nanocomposites of 5 wt%, 10 wt% and 15 wt% CNC compositions predicted using the Halpin–Tsai model with 2D and 3D randomly dispersed fibres, are plotted against the experimental data as shown in Fig. 7. Generally, the 2D model provides a much closer fit to the experimental data than the 3D model, the latter showing large deviations from the experimental data at higher loadings. In this work, the tensile testing specimens were prepared by solution casting followed by compression moulding. So, the CNCs were distributed randomly in the 2D plane.27
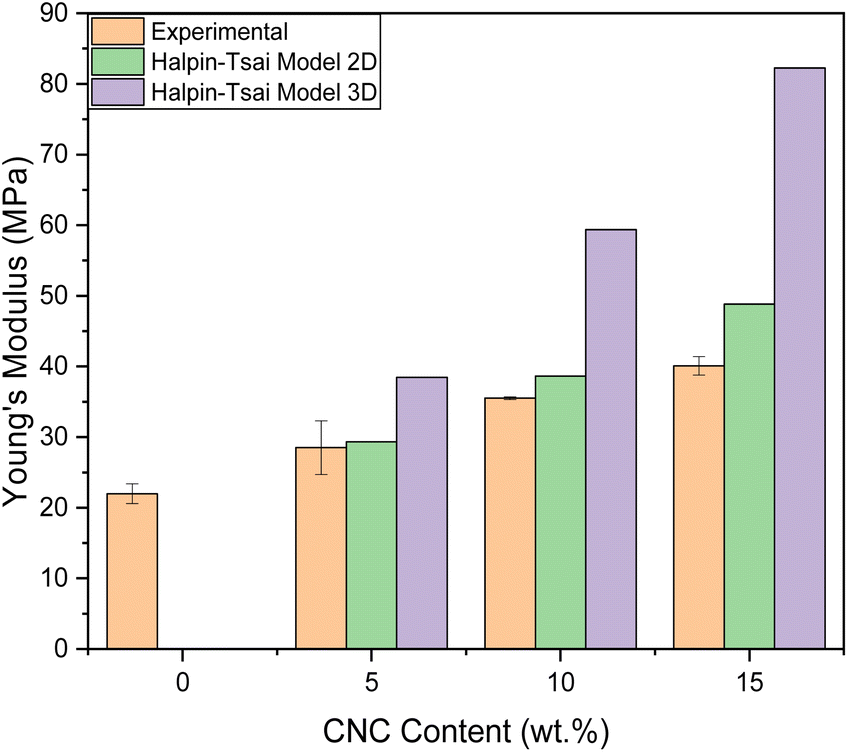 | ||
| Fig. 7 The comparison of the experimental Young's modulus data of PA36,9/CNC nanocomposites with the theoretical values from the Halpin–Tsai models with 2D and 3D randomly dispersed fillers. | ||
Conclusions
PA36,9/CNC nanocomposites were prepared by solvent casting with CNC loadings of 5 wt%, 10 wt%, and 15 wt%. The embedding of CNCs in PA36,9 slightly reduced Tm, Xc and Tc. The nanocomposites showed two thermal degradation peaks, which were related to the polymer matrix and CNCs. Tonsetd of PA36,9 increased in the nanocomposites from 427 °C up to 435 °C for the 15 wt% CNC loading. The incorporation of CNCs into PA36,9 increased the storage modulus. Tg of the PA36,9 nanocomposites increased with the CNC content by up to 17.9 °C. The addition of CNCs in PA36,9 caused decreases in tensile strength and elongation at break, but increases in Young's modulus and hardness by up to 82% and 29%, respectively. The Young's moduli of the PA36,9/CNC nanocomposites closely followed the Halpin–Tsai model for 2D randomly dispersed fibres. The changes in the thermal, thermomechanical and mechanical properties of the PA36,9/CNC nanocomposites are attributable to the intrinsic properties of the nanofiller and the interfacial interactions between the neat polymer and the CNCs.These wholly biobased CNC-reinforced polyamide nanocomposites could have potential to replace some existing medium-hardness elastomers in applications such as electronics, footwear, fire hoses and automotive parts. Further work may include the scale-up production of these elastomer/CNC nanocomposites by melt processing without the use of a solvent for enhanced sustainability. Due to the thermoplastic nature of the elastomer, processing and forming approaches such as injection moulding, extrusion, electrical spraying/spinning, centrifugal spinning and pressurised gyration11,30 may be employed to process these nanocomposites into parts with complex shapes, sheets, tubes, films, particles, fibres, etc. for various potential applications.
Author contributions
YN: methodology, conducting the experiments, obtaining and analysing the data, writing the original draft of the manuscript, and editing; BC: supervision, conceptualization, methodology, resources, writing, reviewing and editing.Conflicts of interest
The authors declare no conflicts of interest.Acknowledgements
YN thanks the Indonesia Endowment Fund for Education (LPDP) for a PhD scholarship.References
- R. J. Moon, A. Martini, J. Nairn, J. Simonsen and J. Youngblood, Chem. Soc. Rev., 2011, 40, 3941–3994 RSC.
- X. Cao, H. Dong and C. M. Li, Biomacromolecules, 2007, 8, 899–904 CrossRef CAS PubMed.
- D. A. Osorio, E. Niinivaara, N. C. Jankovic, E. C. Demir, A. Benkaddour, V. Jarvis, C. Ayranci, M. T. McDermott, C.-F. de Lannoy and E. D. Cranston, ACS Appl. Polym. Mater., 2021, 3, 4673–4684 CrossRef CAS.
- A. Jalaee, M. Kamkar, V. French, O. J. Rojas and E. J. Foster, Carbohydr. Polym., 2023, 314, 120932 CrossRef CAS PubMed.
- T. Wu, M. Frydrych, K. O'Kelly and B. Chen, Biomacromolecules, 2014, 15, 2663–2671 CrossRef CAS PubMed.
- M. E. V. Hormaiztegui, B. Daga, M. I. Aranguren and V. Mucci, Prog. Org. Coat., 2020, 144, 105649 CrossRef CAS.
- V. L. Mucci, A. Ivdre, J. M. Buffa, U. Cabulis, P. M. Stefani and M. I. Aranguren, Polym. Eng. Sci., 2018, 58, 125–132 CrossRef CAS.
- L. Yue, A. Maiorana, F. Khelifa, A. Patel, J.-M. Raquez, L. Bonnaud, R. Gross, P. Dubois and I. Manas-Zloczower, Polymer, 2018, 134, 155–162 CrossRef CAS.
- C. Rader, C. Weder and R. Marti, Macromol. Mater. Eng., 2021, 306, 2000668 CrossRef CAS.
- Y. Nurhamiyah, S. Yoon and B. Chen, Macromol. Mater. Eng., 2022, 307, 2200120 CrossRef CAS.
- Y. Nurhamiyah, A. Amir, M. Finnegan, E. Themistou, M. Edirisinghe and B. Chen, ACS Appl. Mater. Interfaces, 2021, 13, 6720–6730 CrossRef CAS PubMed.
- Y. Nurhamiyah, G. Irvine, E. Themistou and B. Chen, Macromol. Chem. Phys., 2021, 222, 2100218 CrossRef CAS.
- Y. Nurhamiyah and B. Chen, Macromol. Chem. Phys., 2023, 224, 2300013 CrossRef CAS.
- K. Prashantha, M.-F. Lacrampe and P. Krawczak, eXPRESS Polym. Lett., 2011, 5, 295–307 CrossRef CAS.
- Y. P. Khanna, N. S. Murthy, W. P. Kuhn and E. D. Day, Polym. Eng. Sci., 1999, 39, 2222–2232 CrossRef CAS.
- M. Mariano, N. El Kissi and A. Dufresne, J. Polym. Sci., Part B: Polym. Phys., 2014, 52, 791–806 CrossRef CAS.
- K. K. Pandey, J. Appl. Polym. Sci., 1999, 71, 1969–1975 CrossRef CAS.
- A. Santamaria-Echart, L. Ugarte, C. García-Astrain, A. Arbelaiz, M. A. Corcuera and A. Eceiza, Carbohydr. Polym., 2016, 151, 1203–1209 CrossRef CAS PubMed.
- M. A. S. A. Samir, F. Alloin, J.-Y. Sanchez and A. Dufresne, Polymer, 2004, 45, 4149–4157 CrossRef.
- S. Maiti, J. Jayaramudu, K. Das, S. M. Reddy, R. Sadiku, S. S. Ray and D. Liu, Carbohydr. Polym., 2013, 98, 562–567 CrossRef CAS PubMed.
- N. Saba, A. Safwan, M. L. Sanyang, F. Mohammad, M. Pervaiz, M. Jawaid, O. Y. Alothman and M. Sain, Int. J. Biol. Macromol., 2017, 102, 822–828 CrossRef CAS PubMed.
- C. Birck, S. Degoutin, N. Tabary, V. Miri and M. Bacquet, eXPRESS Polym. Lett., 2014, 8, 941–952 CrossRef.
- K. Balani, V. Verma, A. Agarwal and R. Narayan, in Biosurfaces, John Wiley & Sons, Ltd, 2015, pp. 329–344 Search PubMed.
- N. Gray, Y. Hamzeh, A. Kaboorani and A. Abdulkhani, Ind. Crops Prod., 2018, 115, 298–305 CrossRef CAS.
- P. Rittigstein, R. D. Priestley, L. J. Broadbelt and J. M. Torkelson, Nat. Mater., 2007, 6, 278–282 CrossRef CAS PubMed.
- F. Dalmas, J.-Y. Cavaillé, C. Gauthier, L. Chazeau and R. Dendievel, Compos. Sci. Technol., 2007, 67, 829–839 CrossRef CAS.
- J. C. H. Affdl and J. L. Kardos, Polym. Eng. Sci., 1976, 16, 344–352 CrossRef.
- C. Wan and B. Chen, J. Mater. Chem., 2012, 22, 3637–3646 RSC.
- M. M. Shokrieh and H. Moshrefzadeh-Sani, Polymer, 2016, 106, 14–20 CrossRef CAS.
- Y. Dai, J. Ahmed and M. Edirisinghe, Macromol. Mater. Eng., 2023, 308, 2300033 CrossRef CAS.
| This journal is © The Royal Society of Chemistry 2023 |