DOI:
10.1039/D2SU00057A
(Paper)
RSC Sustain., 2023,
1, 159-166
Color stability of blue aluminates obtained from recycling and applied as pigments
Received
22nd September 2022
, Accepted 11th November 2022
First published on 2nd December 2022
Abstract
Aluminates have been used as synthetic inorganic pigments due to their structural stability. In this context, we report on the synthesis of blue aluminates obtained from the boehmite combination with Co2+ and Ni2+ ions and calcination at 1000 °C. The boehmite was obtained from recycling aluminum metal from can seals. The aluminates were characterized by X-ray diffractometry (XRD) and Raman spectroscopy. The oxidation state of the ions responsible for the color was evaluated by XPS and UV-vis, suggesting the presence of divalent Co and Ni ions. Colorimetry confirmed the blue coloration and different shades. The colorimetric stability of the blue aluminates in harsh environments for pigments was evaluated. Both pigments were stable after 240 hours of exposure, showing no strong color difference.
Sustainability spotlight
This work reports on the production of synthetic inorganic pigments from recycling aluminum can seals. In this way, it contributes to the circular economy because the can seals leave the beverage industry and become part of the pigment industry (goal 9). In addition, the development of our research has the potential to generate jobs (recyclable waste pickers) meeting the UN goals 1 and 8 of sustainable development, to preserve natural resources (goals 12 and 13), and to promote partnerships (goal 17), as it involved educational institutions in Brazil and Belgium. Therefore, the subject of our study aims at promoting the sustainable development.
|
1. Introduction
The circular economy aims at harmonizing the market, society and the environment, with an ecologically correct vision. For this purpose, it encourages the use of alternative secondary resources such as a recycled material to obtain products.1 Within this context, a fully recyclable material is the aluminum can; for each kilo of secondary (recycled) aluminum, about 5 kilos of bauxite are saved. Furthermore, for a ton of aluminum recycled, 95% of the energy to produce the same amount of primary aluminum is saved.1
Synthetic inorganic pigments have applications in different areas due to their high hiding power, color stability, weather resistance, and surface protection.2 The doping of metallic oxides with coloring ions has been the most used strategy for their synthesis.3,4 Both structural and physicochemical properties of the pigments depend on the precursors and synthetic routes used.5 Some metal oxides widely used as a matrix for pigments are titanium, aluminum, zirconium, and silicon oxide.6 The attribution of color to these matrices occurs with the insertion of chromophore ions; transition metals such as V, Cr, Mn, Fe, Co, Ni, and Cu are commonly used for this purpose.7 In general, the use of inorganic compounds tends to increase the chemical and physical stability of the pigments,8 ensuring greater durability.
The cobalt blue pigment with spinel structure (CoAl2O4) is known to be an environmentally friendly blue pigment.9 In addition, this pigment can be applied in various areas, such as ceramic pigment,10 anti-corrosion inks,11 in printing ink,12 and as a near-infrared reflection pigment.13 Another way to produce blue colored pigment is to use the transition ion Co2+ to Ni2+, resulting in different shades of blue. However, it is necessary to find a stable structure for these ions.14 In this context, there is the possibility of preparing aluminates.
Aluminates have been widely used as dyes and pigments due to their structural arrangement in the spinel form (A2+B23+O42−) that allows the insertion of chromophore ions, which guarantee intense color and high thermal stability, in addition to resistance to chemically aggressive environments.15,16 The synthetic routes most used to obtain aluminates are coprecipitation,17 mixed oxide calcination,18 solid-state reactions,19 and the sol–gel method.20 In addition, there is the possibility of recycling aluminum to be used as a pigment precursor,17 providing a more sustainable synthesis compatible with the circular economy concept, which is based on reducing, repairing, recycling, remanufacturing, and redirecting the materials life cycle,21,22 contributing to the production of more sustainable materials.
Within the context of circular economy, the objective of this study is to evaluate the color stability in environments containing hydrochloric acid (HCl) and sodium hydroxide (NaOH) of blue aluminates obtained from recycled aluminum for their application as synthetic inorganic pigments.
2. Material and methods
2.1 Synthesis of boehmite: metallic aluminum acid digestion
Aluminum can seals were recycled through acid digestion using hydrochloric acid (HCl) at a concentration of 1.1 mol L−1 and a ratio of 1 g/100 mL (Fig. 1). The reaction lasted about 24 hours, which is the time necessary for the stabilization of the reaction medium. The solution containing the Al3+ ions had an acid pH of 0.35 17.
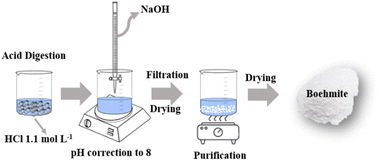 |
| | Fig. 1 Scheme of the synthetic route used to obtain boehmite. (Adapted from ref. 23). | |
2.2 Obtaining boehmite (γ-AlOOH)
To obtain the boehmite phase (Fig. 1), the pH of the solution containing Al3+ ions was modified through the addition of sodium hydroxide (NaOH) by dripping until pH 8, referring to the formation of the phase of interest. After precipitation, the oxide-hydroxide was vacuum filtered and oven dried at 70 °C.17,23
2.3 Boehmite purification
For purification (Fig. 1), the obtained product was washed in hot water to solubilize and remove sodium chloride (secondary product of the reaction). After this step, the boehmite was filtered and dried at 70 °C.17,23 To obtain the white sample, the boehmite was calcined at 1000 °C.
2.4 Aluminates synthesis
Transition metal chlorides (coloring ion): CoCl2 and NiCl2 were used to obtain blue aluminates (Fig. 2). First, the transition metal chloride (10% in relation to the total mass of boehmite powder (m m−1)) is added to 50 mL of water. Then, 3 g of boehmite is added and left under constant stirring (600 rpm) for 24 hours. After this period, the mixture is calcined at 1000 °C, macerated, and stored. The obtained materials were labeled CoAl2O4 and NiAl2O4, respectively.
 |
| | Fig. 2 Scheme of the synthetic route used to obtain aluminates. | |
2.5 Application as pigments
For application as a pigment, the aluminate samples were dispersed in white paint (10% aluminate, 90% white paint) prepared in the proportion of 2![[thin space (1/6-em)]](https://www.rsc.org/images/entities/char_2009.gif) :
:![[thin space (1/6-em)]](https://www.rsc.org/images/entities/char_2009.gif) 1 paint
1 paint![[thin space (1/6-em)]](https://www.rsc.org/images/entities/char_2009.gif) :
:![[thin space (1/6-em)]](https://www.rsc.org/images/entities/char_2009.gif) water.17 The mixture was applied on plaster substrates and painted with two paint coats, according to the manufacturer's instructions.
water.17 The mixture was applied on plaster substrates and painted with two paint coats, according to the manufacturer's instructions.
2.6 Color stability
The color stability test was carried out in acidic and alkaline environments, using desiccators as a controlled experimental environment. Separately, Petri dishes with hydrochloric acid (HCl) or sodium hydroxide (NaOH) were placed in different desiccators in order to mimic aggressive environments with vapors.24 The coated substrates, the plaster blocks, were added to the desiccators; further, these were sealed. Colorimetric measurements were performed before the test and after 120 and 240 hours in order to verify the colorimetric stability of the aluminates applied as synthetic inorganic pigments.
2.7 Characterization
The samples were characterized by X-ray diffraction (XRD), carried out in a Bruker D2 Phaser diffractometer, which uses a copper cathode with copper kα emission (λ = 1.5418 Å) and equipped with a LynxEye high-performance detector, with a power of 300 W. A scanning electron microscope Hitachi SU8020 SEM was used to obtain morphology information. The oxidation state and chemical composition of the aluminates were evaluated by X-ray photoelectron spectroscopy (XPS) (Versaprobe PHI 5000, from Physical Electronics, Chanhassen, MN, USA), equipped with a monochromatic Al Kα X-ray source. The spectra were analyzed using the CASA-XPS software, and the binding energy of the XPS spectra was calibrated using the C 1s peak at 284.6 eV.25 Multipack version 9.8 software (ULVAC-PHI, 2017, Chigasaki, Japan) was used to evaluate the relative composition of the elements. Raman spectra were recorded using a micro-Raman system (Senterra Bruker Optik GmbH, Massachusetts, USA), λ = 532 nm, laser power 10 mW. The visible spectra were obtained using the Ocean Optics spectrophotometer (USB 2000), equipped with optical fiber, tungsten–halogen source, and silicon (350–720 nm) and germanium (720–1050 nm) detectors.
The colorimetric analysis was performed on the pigments in the form of powder, and after application on the plaster substrate, a portable colorimeter (3nh, model NR60CP) with a D65 light source. The data representative of colorimetric (CIEL*a*b*) analyses are: the L* parameter is the brightness and ranges from 0 to 100. The parameter a* represents the variation between red and green, where +a tends to red and −a* tends to green. The parameter b* is the variation between blue and yellow, where +b* tends to yellow and −b* tends to blue.17 The h* parameter refers to the hue angle (tan−1![[thin space (1/6-em)]](https://www.rsc.org/images/entities/char_2009.gif) b*/a*).26 The value of C*
b*/a*).26 The value of C*  is the chroma and represents the color saturation of the samples.26 The total color deviation is expressed by the value of ΔE, which was created by the CIE to designate a metric distance and can be calculated using equation
  .
.
3. Results and discussion
3.1 X-ray diffractometry (XRD)
The obtention boehmite phase was confirmed by the crystallographic chart [96-901-22-49] (Fig. 3a). The pristine Al2O3 sample (Fig. 3b) shows the crystallographic phase θ – Al2O3, this phase is obtained when boehmite is calcined above 900 °C.27 The XRD pattern of the CoAl2O4 sample (Fig. 3c), suggests the formation of the cobalt aluminate spinel [96-900-5204] crystallographic phase. This phase presents a cubic arrangement,28 where the divalent cations (Co2+) occupy 1/8 of the tetrahedral sites of this structure.15 Whereas in the XRD of the NiAl2O4 sample (Fig. 3d), only the crystallographic phase of nickel aluminate [96-900-1433] was observed.29 The homogeneous coloration observed in the samples is associated with the formation of monophase aluminates since there is no presence of possible interferents such as Al2O3.15 The aluminates obtention samples caused a decrease in crystallinity (Table 1) compared to the Al2O3 sample due to the difference in the ionic radius of these metals that can cause deformations in the crystal lattice.30
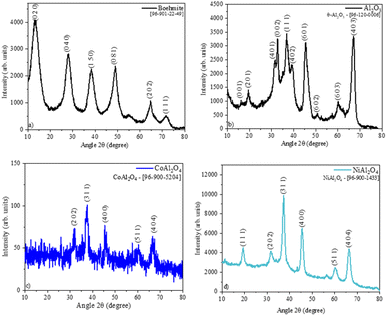 |
| | Fig. 3 Sample diffractograms: (a) boehmite, (b)Al2O3, (c) CoAl2O4 (cobalt aluminate), and (c) NiAl2O4 (nickel aluminate). | |
Table 1 Phase, crystallographic chart, crystallinity of the samples
| Sample |
Phase |
Chart |
Crystallinity (%) |
| Al2O3 |
θ – Al2O3 |
[96-120-0006] |
63.9 |
| CoAl2O4 |
Spinel – CoAl2O4 |
[96-900-5204] |
30.8 |
| NiAl2O4 |
Spinel – NiAl2O4 |
[96-900-1433] |
58.7 |
3.2 Raman spectroscopy
Raman spectroscopy allows the characterization of both crystalline as well as low-crystallinity materials such as CoAl2O4, therefore Raman spectroscopy was used to verify the suggested structures by XRD. The Raman spectra (Fig. 4) show bands at low frequencies (centered at 250 cm−1 for Al2O3 (Fig. 4a), 198 cm−1 for CoAl2O4 (Fig. 4b), 373 cm−1 for NiAl2O4 (Fig. 4c)) that were attributed to the Al–O octahedral vibration,31,32 as well as a low-intensity band near 500 cm−1 that was attributed to metal–oxygen bonding, specifically to the symmetrical Al–O stretching related to octahedral groups,17,33 verifying the X-ray diffractometry results. Bands near 400 cm−1 (Fig. 4b and c) refer to Al–O vibrations, indicating greater organization in normal spinel-like structures.15 In the NiAl2O4 sample, the signal extending from ∼470 to 650 was associated with the normal cubic spinel Fd3m of NiAl2O4.34 The low-intensity band centered at 780 cm−1 can be associated with metal–Ni–oxygen bonds.17,35 The effect of tetrahedral cation substitution on the Raman bands can be evaluated, through the analyses of the internal vibrations of the AlO6 octahedron and/or A2+O4 tetrahedron. The Raman shift of the F2g mode varies linearly with the radius of the tetrahedral cation, being 0.65 Å for cobalt and 0.69 Å for nickel. According to the literature, the F2g mode is assigned to AO4 within the spinel structure. The A1g mode Raman shift varies significantly less than in the other modes. This Raman mode reveals a minor dependence on the type of divalent cation, although it has been attributed to the A2+-O stretching vibration of the AlO4 groups.36,37
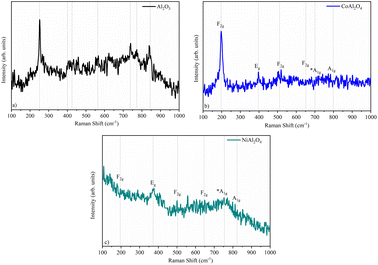 |
| | Fig. 4 Raman spectroscopy of samples: (a) Al2O3 (alumina), (b) CoAl2O4 (cobalt aluminate), and (c) NiAl2O4 (nickel aluminate). | |
3.3 Scanning electron microscopy (SEM)
The Al2O3 sample (Fig. 5a) is characterized by large particles with a rough and irregular surface, with an average particle size equal to 8.2 μm. The SEM image of the cobalt aluminate sample (Fig. 5c) shows large particles with an average size value of 7.6 μm. It can be observed that smaller particles (with a size of approximately 0.18 μm) are distributed over the surface (Fig. 5d). For the nickel aluminate sample, the observed average particle size was ∼2.6 μm. The difference in particle size among the samples can be attributed to structural disorder, resulting from different ionic radii of the cations and particle clustering.38
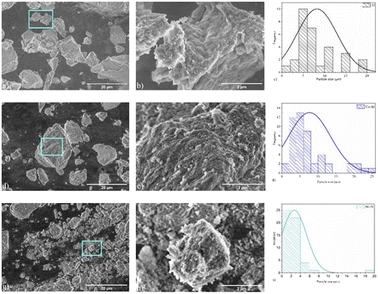 |
| | Fig. 5 Scanning electron microscopy images of samples: (a) Al2O3, (b) Al2O3, (c) histogram of Al2O3 particle size distribution, (d) CoAl2O4, (e) CoAl2O4, (f) histogram of CoAl2O4 particle size distribution, (g) NiAl2O4, (h) NiAl2O4, and (i) histogram of NiAl2O4 particle size distribution. In the high magnification SEM images, we can observe the presence of grooves all over the surface of the particles. | |
3.4 X-ray photoelectron spectroscopy (XPS)
The Al2O3, CoAl2O4, and NiAl2O4 XPS survey spectra are presented in Fig. 6, the chemical elements found are labeled, and the elemental quantification is presented in Table 2. The XPS spectra recorded in the Al 2p region (Fig. 7a, b and d) show a peak fitted with two components centered at 73.6 eV and 74.0 of binding energy, generated by photoelectrons emitted from the Al 2p3/2 and Al 2p1/2 electronic levels respectively. These indicate the presence of Al2O3 in all samples.35,40
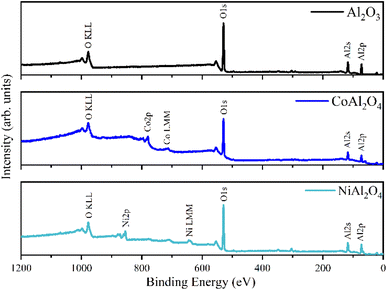 |
| | Fig. 6 XPS survey spectra of samples: (a) Al2O3 (alumina), (b) CoAl2O4 (cobalt aluminate) and (c) NiAl2O4 (nickel aluminate). | |
Table 2 Aluminates composition obtained from XPS spectra
| Sample |
Atomic (%) |
| Al |
O |
Co |
Ni |
| Al2O3 |
32.6 |
67.4 |
— |
— |
| CoAl2O4 |
31.8 |
64.2 |
3.9 |
— |
| NiAl2O4 |
28.4 |
66.7 |
— |
4.9 |
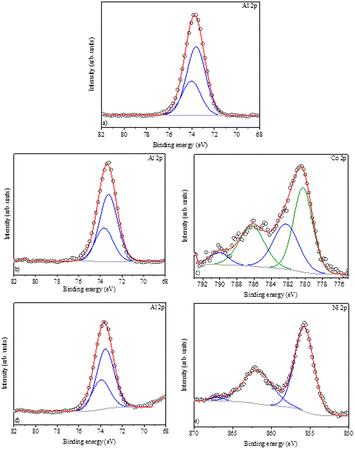 |
| | Fig. 7 XPS spectra: (a) Al2p – Al2O3 (alumina), (b) Al2p – CoAl2O4 (cobalt aluminate), (c) Co2p – CoAl2O4 (cobalt aluminate), (d) Al2p – NiAl2O4 (nickel aluminate), and (e) Ni2p – NiAl2O4 (nickel aluminate). | |
The Co 2p spectrum (Fig. 7c) shows a peak centered at 780.7 eV (Co 2p3/2) with a wide satellite at 786.2 eV, and the main peak can be reproduced by two components characteristic of cobalt aluminate, corroborating with the XRD data and confirming the presence of Co2+,41,42 which is typical of high-spin divalent cobalt.42 Furthermore, the high-resolution Ni 2p spectrum (Fig. 7e) is characteristic of Ni2+ with the Ni 2p3/2 component centered at 855.8 eV and a satellite at 862.0 eV.43 The distance between the main peak and its satellite is approximately 6.0 eV, which coincides with the reference values for nickel aluminates.39,44
3.5 UV-vis absorbance
The Al2O3 sample (Fig. 8a) is a white powder and therefore shows no bands in the visible region.17 The triplet band observed in the CoAl2O4 sample (Fig. 8b) centered at ∼540, 580, and 640 nm was reported to be related to the 4A2 (F) → 4T1 (P) transition of cobalt ions in a tetrahedral arrangement, confirming the obtention of CoAl2O4.45 The bands observed at approximately 590 and 640 nm in the NiAl2O4 sample (Fig. 8c) were attributed to the 3T1 (F) → 3T1 (P) transitions, corresponding to tetrahedral nickel,46 characteristic of the spinel phase of this aluminate, verifying the XRD results.
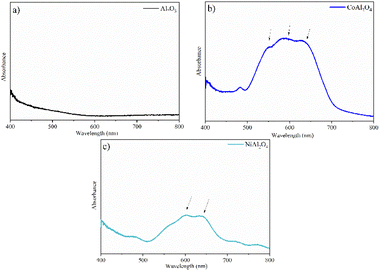 |
| | Fig. 8 Absorption spectra in the visible region: (a) Al2O3 (alumina), (b) CoAl2O4 (cobalt aluminate) and (c) NiAl2O4 (nickel aluminate). | |
3.6 Colorimetry
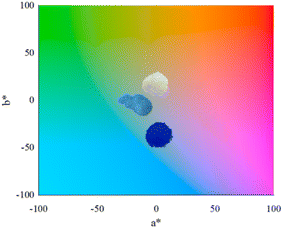
Regarding the colorimetric parameters (Table 3), the most luminous sample was the pristine Al2O3 (79.75); this was also the sample with the lowest chromaticity (C*). The highest chromaticity was observed in CoAl2O4, and it presented the lowest luminosity (21.00). The addition of dopants made the color difference very strong in the samples compared to the Al2O3 sample, varying the chromatic parameters and, consequently, modifying the color,17 as observed in the distribution of aluminates within the 3D color space (Fig. 9). The CoAl2O4 sample is in the red/blue (+a/−b) quadrant, and NiAl2O4 in green/blue (−a/−b) (Fig. 10), corroborating the hue values (h*) (285.25 and 211.33) observed.47 The hue refers to the pure color of the material, and its tonality, without considering white and black.47 Aluminates are present in different shades of blue of the hue, as shown in Fig. 11, demonstrating the possibility of obtaining pigments in different colors through simple synthesis and recycling.
Table 3 Aluminates colorimetric parameters
| Sample |
Colorimetric parameters |
|
L* |
a* |
b* |
C* |
h* |
ΔE |
Photo |
| Al2O3 |
79.8 |
0.5 |
9.4 |
9.4 |
87.2 |
— |

|
| CoAl2O4 |
13.0 |
11.8 |
−43.4 |
45.0 |
285.3 |
85.9 |

|
| NiAl2O4 |
42.5 |
−14.4 |
−8.7 |
16.8 |
211.3 |
44.0 |

|
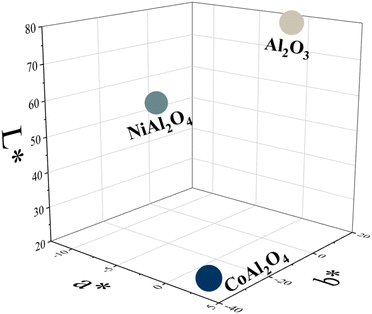 |
| | Fig. 9 Distribution of Al2O3 (alumina), CoAl2O4 (cobalt aluminate), and NiAl2O4 (nickel aluminate) in 3D CIEL*a*b* color space. | |
 |
| | Fig. 10 Al2O3 (alumina), CoAl2O4 (cobalt aluminate), and NiAl2O4 (nickel aluminates) distribution according to color quadrant. | |
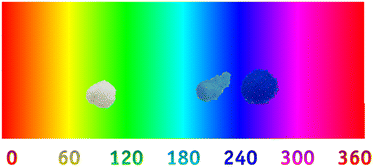 |
| | Fig. 11 Al2O3 (alumina), CoAl2O4 (cobalt aluminate), and NiAl2O4 (nickel aluminate) distribution according to hue color. | |
3.7 UV-vis reflectance
The Al2O3 sample (Fig. 12a) showed high reflectance, confirming the high luminosity observed in the colorimetric analysis. Furthermore, the yellowish hue of the Al pigment was confirmed by the broadband from ∼500 nm. The bluish hue of CoAl2O4 is confirmed by the broadband in the blue region of the visible spectrum (Fig. 12b). In the NiAl2O4 sample, the shift towards red in this band (Fig. 12c) justifies its blue-green coloration, with negative colorimetric parameters a* and b*.
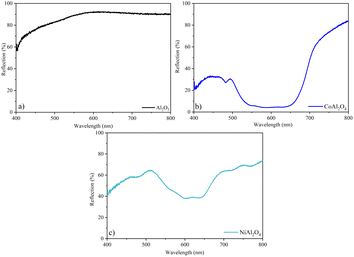 |
| | Fig. 12 Reflection spectra in the visible region: (a) Al2O3 (alumina), (b) CoAl2O4 (cobalt aluminate), and (c) NiAl2O4 (nickel aluminate). | |
3.8 Pigments application
3.8.2 Color stability.
A comparative color study (ΔE) (Table 5) of the applied pigments was performed before, after 120, and 240 hours of exposure to acid and alkaline environments. In general, it was observed that the color difference increased after 240 hours of exposure. However, none of the samples showed a very strong color difference under any conditions studied, demonstrating colorimetric stability.17 The white sample Al2O3 at 120 hours showed greater stability in the alkaline environment. However, the color variation increased by 0.55 after 240 hours, while in an acid environment, it varied by only 0.21, indicating greater stability after a longer period of exposure. For the CoAl2O4 sample, the highest stability was observed in an alkaline environment, varying by only 0.52. In both environments, the observed color variation can be considered weak.17 Whereas for the NiAl2O4 sample, the acidic environment was more stable and had a variation of 1.13. The biggest difference was observed in the NiAl2O4 sample after 240 h in alkali environment with ΔE = 4.8 and large variation in hue (from 182.9 to 103.9). In general, the color of the pigments was not drastically affected, demonstrating the good color stability of these compounds. This was due to the structural arrangement of aluminates in the spinel form, which is stable even in harsh environments.15,48Fig. 13 shows the graph ΔE vs. exposure time of the samples in both environments studied, and it is possible to see that the least stable coloration in both environments was the one obtained with the NiAl2O4 sample, indicating lower stability compared to cobalt aluminate. This may be due to the lower stability of the normal nickel spinel, which is more stable in the inverse spinel form,49 or the chemical nature of this compound.
Table 5 Colorimetric parameters of aluminates after 120 and 240 hours in an acid and alkaline environment
| Environment |
Sample |
Colorimetric parameters |
|
L* |
a* |
b* |
C* |
h* |
ΔE |
Photo |
| Acid |
Al2O3 – 120 h |
93.3 |
−0.5 |
2.2 |
2.20 |
103.1 |
0.5 |

|
| Al2O3 – 240 h |
94.3 |
−0.4 |
2.1 |
2.11 |
100.6 |
0.7 |

|
| CoAl2O4 – 120 h |
85.6 |
−3.4 |
−8.4 |
9.09 |
247.9 |
0.2 |

|
| CoAl2O4 – 240 h |
87.2 |
−3.4 |
−8.4 |
9.04 |
247.7 |
1.5 |

|
| NiAl2O4 – 120 h |
91.1 |
−3.4 |
−0.4 |
3.38 |
187.0 |
1.6 |

|
| NiAl2O4 – 240 h |
92.2 |
−3.5 |
−0.3 |
3.48 |
184.4 |
2.7 |

|
| Alkali |
Al2O3 – 120 h |
93.6 |
−0.4 |
2.4 |
2.38 |
99.2 |
0.2 |

|
| Al2O3 – 240 h |
94.4 |
−0.3 |
2.2 |
2.20 |
98.2 |
0.7 |

|
| CoAl2O4 – 120 h |
86.2 |
−3.3 |
−8.5 |
9.09 |
248.7 |
0.5 |

|
| CoAl2O4 – 240 h |
86.6 |
−3.4 |
−8.7 |
9.34 |
248.68 |
1.0 |

|
| NiAl2O4 – 120 h |
91.2 |
−3.1 |
−0.2 |
3.08 |
182.9 |
1.7 |

|
| NiAl2O4 – 240 h |
86.5 |
−0.6 |
2.3 |
2.35 |
103.9 |
4.8 |

|
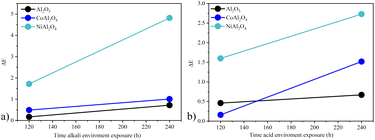 |
| | Fig. 13 Color stability ΔE vs. sample exposure time in the different environments studied: (a) acid environment and (b) alkali environment. | |
4. Conclusions
X-ray diffractometry data indicated that boehmite was successfully formed, and the addition of coloring ions followed by calcination at 1000 °C generated cobalt and nickel aluminates. The oxidation state (2+) of the ions responsible for the coloration was confirmed by UV-vis and XPS. The colorimetry indicates that through a synthesis strategy using recycling as a first step, blue aluminates can be obtained. Their color is distributed in different color quadrants, with CoAl2O4 in the blue/red quadrant and NiAl2O4 in the blue/green quadrant, as they have different shades of hue. The pigments show color stability in acid and alkaline environments, with minor color variation in the time range studied; this characteristic can be associated with the stability of spinel-like structures, which was confirmed by Raman spectroscopy.
Author contributions
Conceptualization, D. F. L. H. and C. B.; methodology, D. F. L. H. and N. B.; validation, J. d. O. P. and D. F. L. H.; formal analysis, D. F. L. H.; investigation, D. F. L. H., and J. d. O. P.; resources, F. J. A. and C. B.; writing—original draft preparation, D. F. L. H., J. d. O. P. and C. B.; writing—review and editing, D. F. L. H., F. J. A. and C. B.; visualization, D. F. L. H. and C. B.; supervision C. B.; project administration, F. J. A. and C. B.; funding acquisition, F. J. A. and C. B. All authors have read and agreed to the published version of the manuscript.
Conflicts of interest
There are no conflicts to declare.
Acknowledgements
D. F. L. H, J. d. O. P. and N. B. appreciates the Coordenação de Aperfeiçoamento de Pessoal de Nível Superior-Brasil (CAPES)—Finance Code 001 for a graduate scholarship, D. F. L. H. thanks UMONS for the PhD grant, J. d. O. P. thanks the FNRS for mobility grant (2021/V6/5/003–JG/MF–726). C. B. is a Research Associate of the FRS-FNRS, Belgium. C. B., J. P., and A. D. thank the Belgian Fund for Scientific Research under the FRFC contract EQP 40002995 (PHOTOFUN). F. J. A. is thankful for a CNPq Productivity grant (308625/2019-6), and the grants CNPq–427127/2018-1 and Fundação Araucária–CBPA-001/2016. Project NARROWW (CONFAP-WBI).
References
- S. Capuzzi and G. Timelli, Metals, 2018, 8 Search PubMed.
- J. Zou, Y. Chen and P. Zhang, Ceram. Int., 2021, 47, 12661–12666 CrossRef CAS.
- J. Cao, T. Hasegawa, Y. Asakura, P. Sun, S. Yang, B. Li, W. Cao and S. Yin, Adv. Powder Technol., 2022, 33, 103576 CrossRef CAS.
- A. Riapanitra, Y. Asakura and S. Yin, Tungsten, 2019, 1, 306–317 CrossRef.
- E. Aslan, M. Bulut, A. Grijalbo and B. Çiçek, Adv. Powder Technol., 2022, 33, 103421 CrossRef CAS.
- M. C. F. Karlsson, Z. Abbas, R. Bordes, Y. Cao, A. Larsson, P. Taylor and B. M. Steenari, Dyes Pigm., 2019, 162, 145–152 CrossRef CAS.
- S. W. Kim, G. E. Sim, J. Y. Ock, J. H. Son, T. Hasegawa, K. Toda and D. S. Bae, Dyes Pigm., 2017, 139, 344–348 CrossRef CAS.
- G. R. S. Cavalcanti, F. Rodrigues, G. Zhuang, S. Balme, J. M. Janot, M. G. Fonseca and M. Jaber, Dyes Pigm., 2021, 190, 109306 CrossRef CAS.
- H. Yang, B. Mu, S. Li, N. Wang, A. Hui and A. Wang, J. Ind. Eng. Chem., 2022, 112, 440–450 CrossRef CAS.
- X. He, F. Wang, H. Liu, L. Niu and X. Wang, J. Am. Ceram. Soc., 2018, 101, 2578–2588 CrossRef CAS.
- A. Zhang, F. Teng, Q. Zhang, Y. Zhai, Z. Liu, Z. Liu, W. Gu, W. Hao, Z. U. Abideen and Y. Teng, Appl. Surf. Sci., 2018, 428, 586–592 CrossRef CAS.
- S. Zhao, J. Guo, W. Li, H. Guo and B. You, Dyes Pigm., 2018, 151, 130–139 CrossRef CAS.
- C. M. Álvarez-Docio, J. J. Reinosa, A. del Campo and J. F. Fernández, Dyes Pigm., 2017, 137, 1–11 CrossRef.
- G. Costa, M. J. Ribeiro, W. Hajjaji, M. P. Seabra, J. A. Labrincha, M. Dondi and G. Cruciani, J. Eur. Ceram. Soc., 2009, 29, 2671–2678 CrossRef CAS.
- S. Yaemphutchong, W. Wattanathana, K. Chansaenpak, S. Singkammo, P. Kanjanaboos, P. Siri-apai, S. Janejobsakonkit, P. Pipattanaporn, N. Suetrong, S. Wannapaiboon and Y. Hanlumyuang, Ceram. Int., 2022, 48, 18490–18501 CrossRef CAS.
-
C. E. Housecroft and A. G. Sharpe, Inorganic chemistry, Pearson Education, 2008, vol. 1 Search PubMed.
- D. F. L. Horsth, J. O. Primo, M. Dalpasquale, C. Bittencourt and F. J. Anaissi, Cleaner Engineering and Technology, 2021, 5, 100313 CrossRef.
- R. Salomão, L. F. Amaral and v. C. Pandolfelli, Cerâmica, 2010, 56, 135–140 CrossRef.
- S. A. Ahmed, Cryst. Res. Technol., 2017, 52, 1600335 CrossRef.
- B. K. Kwak, D. S. Park, Y. S. Yun and J. Yi, Catal. Commun., 2012, 24, 90–95 CrossRef CAS.
- S. Luthra, S. K. Mangla, J. Sarkis and M. L. Tseng, Resour. Policy, 2022, 77, 102652 CrossRef.
- H. Desing, G. Braun and R. Hischier, Resour., Conserv. Recycl., 2021, 164, 105179 CrossRef.
- D. F. L. Horsth, J. d. O. Primo, N. Balaba, J. S. Correa, C. M. Zanette, D. K. Silva, C. Bittencourt and F. J. Anaissi, Nanomaterials, 2022, 12, 2771 CrossRef CAS PubMed.
- L. C. B. Lima, F. C. Silva, E. C. Silva-Filho, M. G. Fonseca, G. Zhuang and M. Jaber, Appl. Clay Sci., 2020, 191, 105604 CrossRef CAS.
- S. Parres-Esclapez, I. Such-Basañez, M. J. Illán-Gómez, C. Salinas-Martínez De Lecea and A. Bueno-López, J. Catal., 2010, 276, 390–401 CrossRef CAS.
-
B. B. Bible and S. Singha, Canopy Position Influences CIELAB Coordinates of Peach Color, 1993, vol. 28 Search PubMed.
- X. Sun, X. Jiang, Y. Shan, X. Han, J. Xu and J. Li, Ceram. Int., 2022, 48, 17471–17480 CrossRef CAS.
- R. Khalighi, F. Bahadoran, M. H. Panjeshahi, A. Zamaniyan and N. Tahouni, Microporous Mesoporous Mater., 2020, 305, 110371 CrossRef CAS.
- C. Venkataramana, S. M. Botsa, P. Shyamala and R. Muralikrishna, Chemosphere, 2021, 265, 129021 CrossRef CAS PubMed.
- G. Raja, A. Nallathambi, A. Prakasam, S. Gopinath, C. Ragupathi, S. Narayanan, P. Tamizhdurai, R. Kumaran, N. S. Alsaiari, K. M. Abualnaja and M. Ouladsmane, J. Saudi Chem. Soc., 2022, 26, 101440 CrossRef CAS.
- M. Müller, J. C. Villalba, F. Q. Mariani, M. Dalpasquale, M. Z. Lemos, M. F. G. Huila and F. J. Anaissi, Dyes Pigm., 2015, 120, 271–278 CrossRef.
- S. v. Stefanovsky, O. I. Stefanovsky and M. I. Kadyko, J. Non-Cryst. Solids, 2016, 443, 192–198 CrossRef CAS.
- M. Dalpasquale, F. Q. Mariani, M. Müller and F. J. Anaissi, Dyes Pigm., 2016, 125, 124–131 CrossRef CAS.
- A. S. B. Neto, A. C. Oliveira, J. M. Filho, N. Amadeo, M. L. Dieuzeide, F. F. de Sousa and A. C. Oliveira, Adv. Powder Technol., 2017, 28, 131–138 CrossRef CAS.
- M. Bouchard and A. Gambardella, J. Raman Spectrosc., 2010, 41, 1477–1485 CrossRef.
- V. D'Ippolito, G. B. Andreozzi, D. Bersani and P. P. Lottici, J. Raman Spectrosc., 2015, 46, 1255–1264 CrossRef.
- O. N. Shebanova and P. Lazor, J. Solid State Chem., 2003, 174, 424–430 CrossRef CAS.
- C. Ragupathi, J. J. Vijaya, P. Surendhar and L. J. Kennedy, Polyhedron, 2014, 72, 1–7 CrossRef CAS.
- A. Navabi, M. Vandadi, T. Bond, V. Rahneshin, J. Obayemi, R. Ahmed, J. E. Oghenevweta, V. Champagne, N. Rahbar and W. O. Soboyejo, J. Mater. Sci. Eng. A, 2022, 841, 143036 CrossRef CAS.
- T. Tago, N. Kataoka, H. Tanaka, K. Kinoshita and S. Kishida, Procedia Eng., 2017, 216, 175–181 CrossRef.
- N. Srisawad, W. Chaitree, O. Mekasuwandumrong, P. Praserthdam and J. Panpranot, J. Nanomater., 2012, 2012, 108369 Search PubMed.
- X. Duan, M. Pan, F. Yu and D. Yuan, J. Alloys Compd., 2011, 509, 1079–1083 CrossRef CAS.
- M. Gil-Calvo, C. Jiménez-González, B. de Rivas, J. I. Gutiérrez-Ortiz and R. López-Fonseca, Appl. Catal., B, 2017, 209, 128–138 CrossRef CAS.
- J. L. Rogers, M. C. Mangarella, A. D. D'Amico, J. R. Gallagher, M. R. Dutzer, E. Stavitski, J. T. Miller and C. Sievers, ACS Catal., 2016, 6, 5873–5886 CrossRef CAS.
- Y. el Jabbar, H. Lakhlifi, R. el Ouatib, L. Er-Rakho, S. Guillemet-Fritsch and B. Durand, J. Non-Cryst. Solids, 2020, 542, 120115 CrossRef.
- V. Elakkiya, R. Abhishekram and S. Sumathi, Chin. J. Chem. Eng., 2019, 27, 2596–2605 CrossRef CAS.
- A. Flachot and K. R. Gegenfurtner, Vision Res., 2021, 182, 89–100 CrossRef PubMed.
- M. Salavati-Niasari, M. Farhadi-Khouzani and F. Davar, J. Sol-Gel Sci. Technol., 2009, 52, 321–327 CrossRef CAS.
- J. N. Roelofsen, R. C. Peterson and M. Raudsepp, Am. Mineral., 1992, 77, 522–528 CAS.
|
| This journal is © The Royal Society of Chemistry 2023 |
 Open Access Article
 *ab,
Julia de O.
Primo
ab,
Nayara
Balaba
b,
Fauze J.
Anaissi
 b and
Carla
Bittencourt
 *a
*a

![[thin space (1/6-em)]](https://www.rsc.org/images/entities/char_2009.gif) :
:![[thin space (1/6-em)]](https://www.rsc.org/images/entities/char_2009.gif) 1 paint
1 paint![[thin space (1/6-em)]](https://www.rsc.org/images/entities/char_2009.gif) :
:![[thin space (1/6-em)]](https://www.rsc.org/images/entities/char_2009.gif) water.17 The mixture was applied on plaster substrates and painted with two paint coats, according to the manufacturer's instructions.
water.17 The mixture was applied on plaster substrates and painted with two paint coats, according to the manufacturer's instructions.
![[thin space (1/6-em)]](https://www.rsc.org/images/entities/char_2009.gif) b*/a*).26 The value of C*
b*/a*).26 The value of C*  is the chroma and represents the color saturation of the samples.26 The total color deviation is expressed by the value of ΔE, which was created by the CIE to designate a metric distance and can be calculated using equation
  .
.


