
 Open Access Article
 This Open Access Article is licensed under a
 Creative Commons Attribution 3.0 Unported Licence
Methane dry reforming via a ceria-based redox cycle in a concentrating solar tower
Mario
Zuber
 a,
Moritz
Patriarca
ab,
Simon
Ackermann
b,
Philipp
Furler
b,
Ricardo
Conceição
c,
José
Gonzalez-Aguilar
c,
Manuel
Romero
c and
Aldo
Steinfeld
*a
a,
Moritz
Patriarca
ab,
Simon
Ackermann
b,
Philipp
Furler
b,
Ricardo
Conceição
c,
José
Gonzalez-Aguilar
c,
Manuel
Romero
c and
Aldo
Steinfeld
*a
aETH Zurich, Department of Mechanical and Process Engineering, 8092 Zurich, Switzerland. E-mail: aldo.steinfeld@ethz.ch
bSynhelion SA, Via Cantonale 19, 6900 Lugano, Switzerland
cHigh-Temperature Processes Unit, IMDEA Energy, E-28935 Móstoles, Spain
First published on 28th February 2023
Abstract
Drop-in fuels produced using solar energy can provide a viable pathway towards sustainable transportation, especially for the long-haul aviation sector which is strongly dependent on jet fuel. This study reports on the experimental testing of a solar reactor using concentrated solar energy for the production of syngas, a mixture of mainly H2 and CO, which serves as the precursor for the synthesis of kerosene and other liquid hydrocarbon fuels. The thermochemical conversion route is based on the dry reforming of CH4via a 2-step redox cyclic process utilizing the intermediation of non-sacrificial ceria (CeO2), comprising: (1) the endothermal reduction of CeO2−δox with CH4 to form CeO2−δred and syngas (δ denoting the non-stoichiometry); and (2) the exothermal oxidation of CeO2−δred with CO2 to form CO and the oxidized state of CeO2−δox. The solar reactor consists of a cavity-receiver lined with a reticulated porous ceramic (RPC) structure and an axial tubular section at the cavity's rear filled with a packed-bed of agglomerates, both RPC and agglomerates made of pure ceria. Testing is performed at a high-flux solar tower at conditions and scale relevant to industrial implementation. For a solar radiative power input of 10 kW (corresponding to a mean solar flux of 560 suns) at temperatures in the range 800–1000 °C, with reacting gas flow rates of 105 normal L min−1 and concentrations of CH4 (reduction step) and CO2 (oxidation step) of up to 20% in Ar, the solar-driven redox reforming process yields a peak CH4 molar conversion of 70% and a peak H2 selectivity of 68%. Co-feeding of CH4 and CO2 during the reduction step resulted in the highest solar-to-fuel energy efficiency of 27%, defined as the ratio of the higher heating value of the syngas produced over the sum of the solar radiative power input through the solar reactor's aperture and the higher heating value of CH4 fed to the solar reactor. Regardless of the operational mode, the syngas product composition was similar at equal δ attained during the reduction. The addition of the tubular packed bed increased the syngas yield by 32%.
Introduction
Solar thermochemical processes driven by concentrated solar radiation utilize the entire solar spectrum as the source of high-temperature process heat and therefore offer a thermodynamically efficient pathway to the synthesis of sustainable fuels.1 Of particular interest is the solar thermochemical production of syngas – a specific mixture of mainly H2 and CO which can be further processed to synthesize drop-in fuels for transportation, and in particular solar kerosene for long-haul aviation.2,3 Syngas can be produced by solar-driven reforming, which has been extensively studied.4–12 The catalytic reforming of CH4 with CO2 (dry) or H2O (wet) is represented by the net reactions:Dry reforming:
 | (R1) |
 | (R2) |
Both reactions are highly endothermic and proceed at temperatures above 600 °C. Relevant side reactions are the Boudouard (2CO → CO2 + C(s)) and methane decomposition (CH4 → 2H2 + C(s)), both resulting in carbon formation, and the reverse water-gas shift (RWGS: H2 + CO2 → H2O + CO), which affects the syngas quality.13 An additional concern is catalyst deactivation due to oxidation, thermal sintering, and/or carbon deposition.13
Syngas can be also produced from H2O and CO2via a 2-step thermochemical redox cycle using metal oxides.14 Ceria (CeO2) is an attractive metal oxide for such a cycle because of its stability and rapid kinetics.15–17 The H2O/CO2-splitting redox cycle based on ceria is represented by:
Reduction:
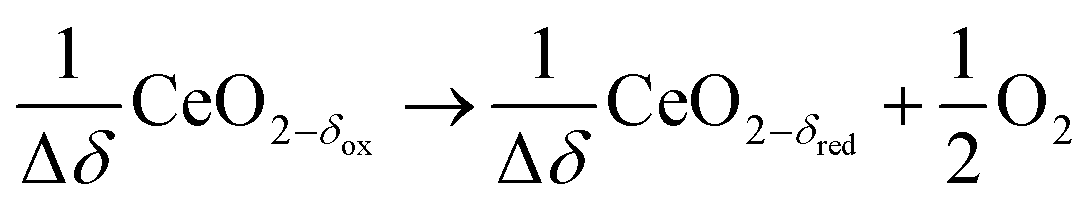 | (R3) |
Oxidation with CO2:
 | (R4) |
Oxidation with H2O:
 | (R5) |
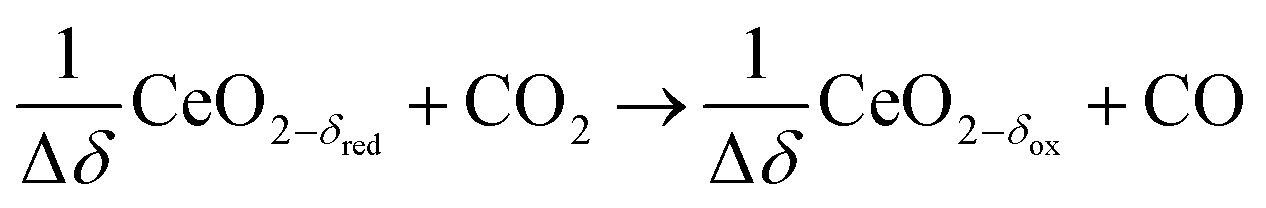
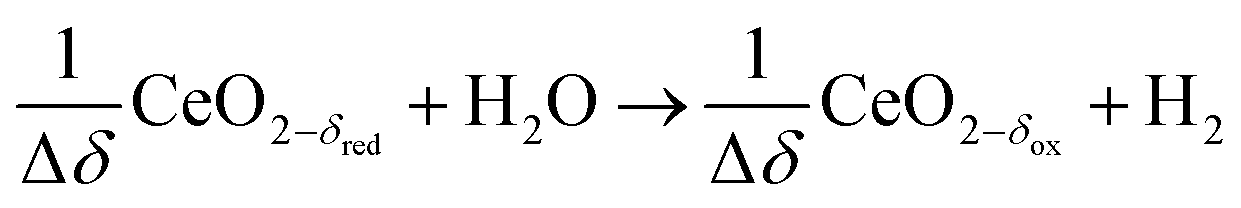
δ denotes the non-stoichiometry – the measure of the redox extent. Ceria is not consumed but undergoes consecutive redox cycles. The redox cycle is operated under a temperature-swing mode and/or a pressure-swing mode to control the oxygen exchange capacity of ceria Δδ = δred − δox, and thereby the fuel yield per cycle and per mole of metal oxides. Typically, the reduction step is performed at 1500 °C and 10 mbar and the oxidation step at 900 °C and 1 bar, for which Δδ ≈ 0.03.16 These temperature and pressure swings impose severe thermal and mechanical stresses on the solar reactor materials. In contrast, the catalytic reforming process (R1 and R2) proceeds at more moderate and constant temperatures but at the expense of introducing a carbonaceous fuel (CH4) which undergoes partial oxidation. Of particular interest is the methanothermal reduction of ceria through the combination of the two aforementioned routes for syngas production, namely the catalytic reforming ((R1) and (R2), and the H2O/CO2-splitting redox cycle R3–R5), into the so-called “dry/wet redox reforming” cyclic process,15,18–25 represented by:
Reduction:
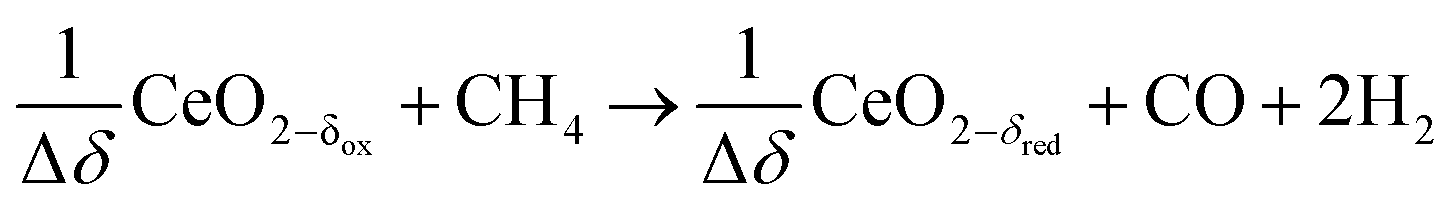 | (R6) |
Oxidation with CO2 (dry):
 | (R7) |
Oxidation with H2O (wet):
 | (R8) |
This cyclic process operates in an isobaric and isothermal manner, thus eliminating the temperature and pressure swings of the H2O/CO2-splitting redox cycle. Furthermore, higher non-stoichiometric ranges are possible (Δδ ⪅ 0.345) at significantly lower and more feasible temperatures (≈1000 °C), thus acting as a bridge technology to the H2O/CO2-splitting redox cycle.26,27 A recent thermodynamic analysis comparing the conventional catalytic reforming with the redox reforming highlights a favorable selectivity and tunable syngas composition of the latter approach, but at the expense of additional thermodynamic constraints which are sensitive to carbon formation and lead to a greater energy demand relative to catalytic reforming.27 A relevant unwanted reaction for the redox reforming process is the complete oxidation of CH4 which occurs at low non-stoichiometries of the reduced form of ceria (e.g. δred ⪅ 0.05 at 1000 °C):
 | (R9) |
At low δ, ceria can be more easily reduced; as is often seen when initially reducing fully oxidized ceria. Thus, operating at higher δ results in improved syngas selectivity and higher H2![[thin space (1/6-em)]](https://www.rsc.org/images/entities/char_2009.gif) :CO ratios during reduction, as well as improved CO2 conversion during oxidation. The high δ range combined with the dependence of the product composition on δ elucidate the importance of defining reduced (δred) and oxidized (δox) states of ceria. In (R6), CH4 serves as reducing agent of the metal oxide, as previously proposed for the co-production of metals and syngas using solar process heat.28–30 The redox reforming process can also be performed by co-feeding H2O and/or CO2. The CeO2 remains active and its state is affected by the feeding molar ratios H2O:CH4 and CO2:CH4 until equilibrium is reached (δeq). CeO2 has often been employed to act as a basic catalyst support which improves CO2 adsorption and promotes the RWGS.13 It further enhances reducibility, oxygen mobility, material stability, and is resistant to deactivation via sintering at high temperatures.13,31–33
:CO ratios during reduction, as well as improved CO2 conversion during oxidation. The high δ range combined with the dependence of the product composition on δ elucidate the importance of defining reduced (δred) and oxidized (δox) states of ceria. In (R6), CH4 serves as reducing agent of the metal oxide, as previously proposed for the co-production of metals and syngas using solar process heat.28–30 The redox reforming process can also be performed by co-feeding H2O and/or CO2. The CeO2 remains active and its state is affected by the feeding molar ratios H2O:CH4 and CO2:CH4 until equilibrium is reached (δeq). CeO2 has often been employed to act as a basic catalyst support which improves CO2 adsorption and promotes the RWGS.13 It further enhances reducibility, oxygen mobility, material stability, and is resistant to deactivation via sintering at high temperatures.13,31–33
Four reviews summarize the solar reactor developments.34–37 Solar reactor concepts applied for the redox reforming process include particle-flow transport,20 a vortex-flow reactor,38 a tubular packed bed,39,40 a tubular array with bi-directional flow,24 and a cavity-receiver containing a foam-type structure.18,41–43 A cavity-receiver lined with a reticulated porous ceramic (RPC) structure made of ceria has been previously applied for the H2O/CO2-splitting redox cycle with a 4 kW solar reactor in a solar dish concentrator,2 and with a 50 kW solar reactor in a solar tower.3 In this study, we employ a modified version of that solar reactor concept to perform the dry redox reforming cyclic process (R6 and R7), with and without co-feeding of CO2 in the reduction step. Focus is on this process as it supports complete dry reforming due to ceria's oxygen exchange properties, offers high selectivity, improves the syngas quality required for downstream Fischer–Tropsch synthesis, and contributes to the technology development for the H2O/CO2-splitting redox cycle with purely thermal reduction (R3). Furthermore, the use of CO2 as oxidizing agent provides a path for producing carbon-neutral drop-in fuels, provided CO2 is derived from a biogenic source of captured from the air.2 The study highlights the use of ceria as redox material for solar reforming in a coupled (i.e. cavity) and decoupled (i.e. packed bed) solar receiver-reactor, operated in cyclic or co-feeding modes. Experimentation is carried out in a solar tower with a heliostat field, which offers a platform for on-sun testing the solar reactor and its peripheral components at conditions and scale relevant to industrial implementation.
Solar reactor and experimental setup
Solar concentrating system
The experimental campaign was conducted at the solar tower facility of IMDEA Energy in Móstoles, Spain.3,44 It consists of a solar field with 169 heliostats, each with a facet area of ≈3 m2, which track the sun and concentrate the direct normal solar irradiance (DNI) onto the solar reactor located at the top of a 15 m solar tower. The entire heliostat field was designed to supply a solar radiative power of 250 kW for a DNI ≈850 W m−2 at equinox noon. The experimental campaign used an average of 38 heliostats, which resulted in a mean solar concentration ratio of 560 suns, delivering approximately 10 kW into the 160 mm dia. aperture of the solar reactor.Solar reactor design
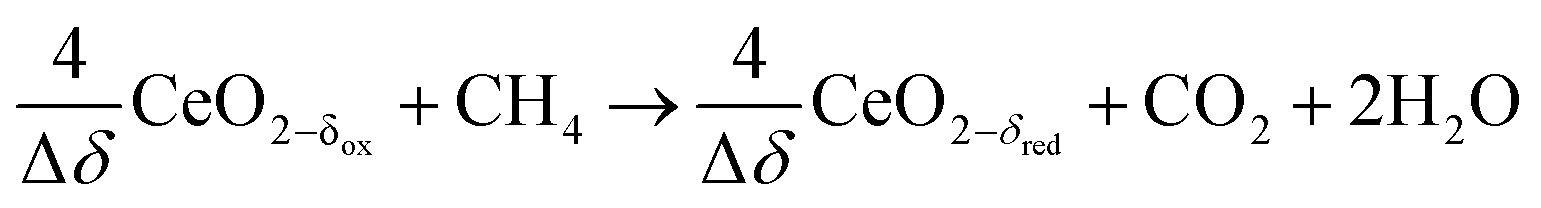
The solar reactor is shown schematically in Fig. 1. The main design features are highlighted here. It consists of a cavity-receiver with 160 mm dia. aperture sealed with a 12 mm thick quartz disk for the access of concentrated solar radiation. The inner cavity is Iined with RPC bricks made of pure ceria, creating a 350 mm dia., 375 mm length near-cylindrical (hexadecagon) enclosure. With this arrangement, the RPC structure is directly exposed to the incoming concentrated solar flux, providing volumetric radiative absorption and efficient heat transfer directly to the reaction site.45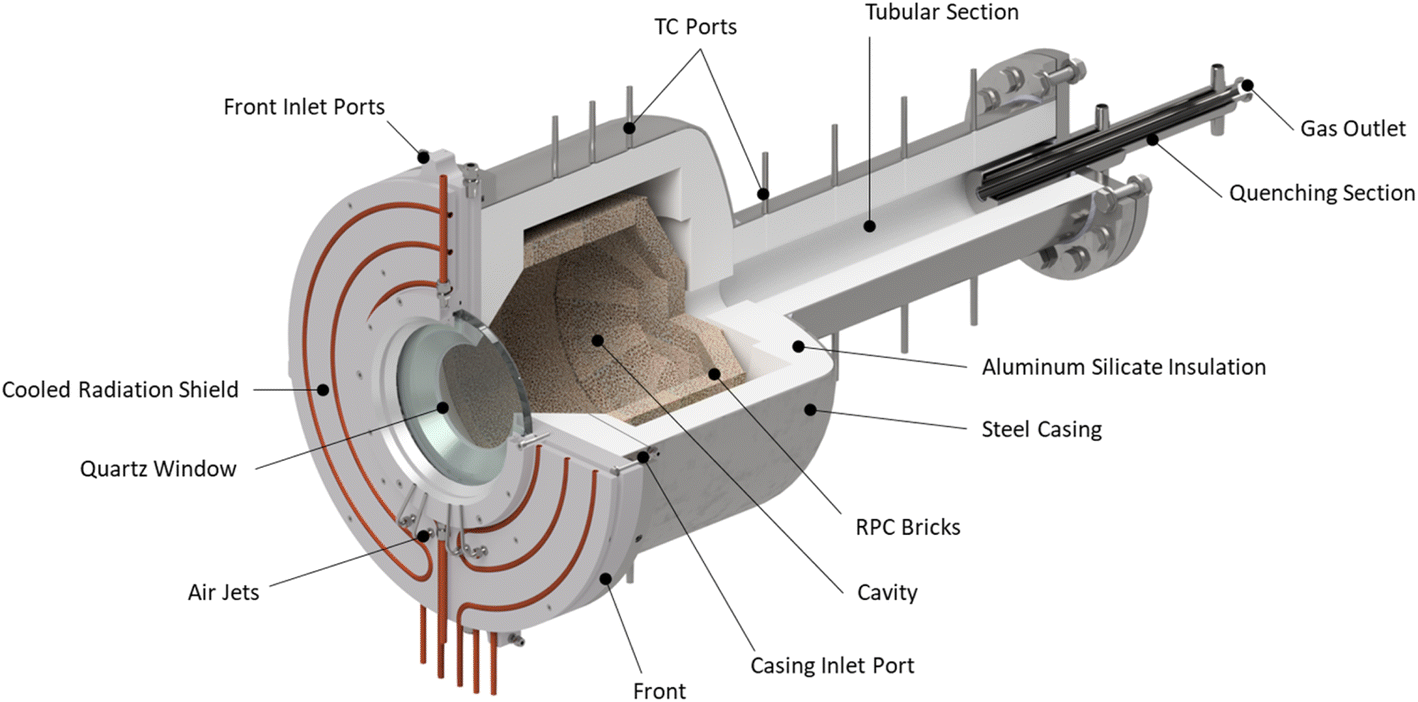 | ||
| Fig. 1 Solar reactor configuration, consisting of a cavity-receiver with a windowed aperture containing a reticulated porous ceramic (RPC) structure made of ceria. | ||
The actively cooled aluminum front serves as a shield from radiation spillage, and air jets provide active cooling on the quartz window. The steel cavity casing is lined with aluminum silicate insulation (Al2O3–SiO2, Rath Inc., type KVS 184/400) behind the RPC bricks. Gases primarily enter the cavity via ports on the front (see Fig. 2), while a port on the steel casing allows for a safety bypass channel. (1) the front inlet port for reactive and inert gases injected tangential to and behind the aperture through four channels, thus creating a counterclockwise (CCW) swirl as seen from the front; (2) the window inlet port for inert gas entering via grooves in the graphite seal located between the quartz window and aluminum front, which are angled at 25° to induce a CCW swirl; (3) the casing inlet port for inert gas preventing heating of upstream sensors and as a safety bypass channel in the event of overpressure.
 | ||
| Fig. 2 Front of solar reactor in a transparent view detailing the two main gas inlet ports: the front inlet port (green) for reactive and inert gases, and the window inlet port (yellow) for inert gases. The cooling water channel (blue) prevents the conical aperture from overheating. | ||
Downstream to the cavity, the gases flow into the tubular section (95 mm dia., 500 mm length) which is lined with alumina and a ceramic fiber tube. This tubular section can be used as an additional redox material installation zone thus extending the residence time. Contrary to the vortex flow regime in the cavity, a plug flow regime with a low Reynolds number is characteristic of the tubular packed bed, whereby the reactant gases are forced to flow through the reactive material contrary to the cavity flow where only a fraction of the reactant gas flow may interact with the ceria. The packed bed increases the thermal mass and mimics the behaviour of a thermocline heat storage, allowing reactions to proceed even when Psolar is interrupted due to clouds. Finally, a quenching section rapidly cools the off-gas prior to entering the chemical analysis equipment.
Materials
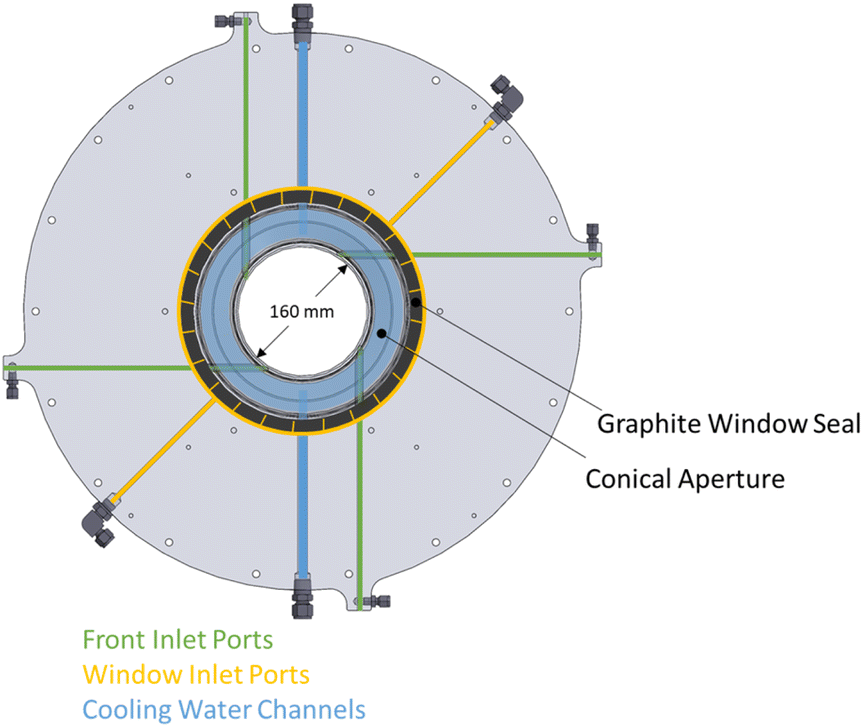
Ceria (cerium(IV) oxide, CeO2) is the redox material at the core of the solar reactor. There are two main installation zones for the redox material: the cavity and the tubular section, as depicted in Fig. 3, thus presenting the possibility for various loading configurations. The cavity contains ceria RPC bricks with dual-scale interconnected porosity in the mm and μm ranges for enhanced heat and mass transfer.46 They are made by the replica method,46 with 7 ppi (pores per inch) polyurethane (PU) foam, 27 vol% pore former content (PFC) using 150 μm cylindrical carbon fibers, and sintered at 1600 °C resulting in an effective density of 1.50 cm3 g−1 and SSA (specific surface area) of 0.04 m2 g−1 (measured by mercury intrusion porosimetry). The total mass of ceria RPC is 20.7 kg of roughly 34 mm thickness, with a total surface area of 828 m2. The tubular section contains a packed bed of 8 mm mean dia. ceria agglomerates, formed with 27 vol% PFC of 150 μm cylindrical carbon fibers, sintered at 1100 °C, resulting in an SSA of 1.44 m2 g−1 (measured by gas adsorption analysis and a Brunauer–Emmett–Teller measurement). The total mass of the packed bed is 4.5 kg which equates to a surface area of 6480 m2, thus augmenting the kinetic rates. The agglomerate morphology does not have to absorb direct irradiation nor be self-supporting. Agglomerates were used because of their relatively high SSA and their overall fast kinetic rates obtained in preliminary lab tests with a packed-bed tubular reactor. Fig. 3 shows the scanning electron microscopy (SEM) images, detailing the microstructure of the RPC and agglomerates. | ||
| Fig. 3 Cross section of the solar reactor with two ceria installation zones, namely: the cavity and the tubular section. The cavity is lined with ceria RPC bricks. The tubular section is filled with a packed bed of ceria agglomerates. SEM images are shown detailing their microstructure. Thermocouples' locations are indicated by colored dots: B-type (yellow), K-type in cavity (red), K-type in the tubular section (green). | ||
Experimental setup
The experimental setup, including the solar reactor, the feeding and handling of reactant and product gases, and the measurement instrumentation, is schematically shown in Fig. 4. The solar reactor is positioned on the top of the solar tower at the west operating position, and tilted 40° down towards the heliostat field. A water calorimeter is installed in the east operating position of the solar tower and is used to determine the solar radiative power input Psolar entering through the aperture of the solar reactor.3,47 A radiative shield that moves in front of the solar reactor is used to block Psolar. Gas flows are controlled by mass flow controllers (MFC, Bronkhorst EL-FLOW Select). Pressure sensors (Leybold Thermovac, Gefran KS) are installed at each inlet and before the soot filter and the unidirectional check valve. B-Type thermocouples (TCs) are installed inside the cavity and K-Type TCs are positioned throughout the system to monitor cooling loops, surfaces, and outlet gas temperatures. The hot gas flowing out of the quenching section passes through metal tubes before reaching a soot filter and the final exhaust port. The gas analysis unit (ULTRAMAT 23 and CALOMAT 6, Siemens AG) is placed in parallel to the main outlet flow and draws in 1–2 Ln min−1 of gas (Ln denotes normal liters) through a condenser and filter (MAK 10 – AGT Thermotechnik GmbH & Co KG) to measure the concentrations of CO, CO2, CH4, and H2. A mass flow meter (Bronkhorst EL-FLOW Select) is connected downstream to monitor the flow through the gas analysis unit and to ensure there are appropriate flow levels for accurate measurement of gas concentrations. Three video cameras are installed in the experimental area of the solar tower for live monitoring. Additional safety peripherals include a flashback arrestor, pressure controller, overpressure relief valves, ceiling mounted CH4 and CO sensors, and an emergency shutdown located in the control room. The system is monitored and controlled from the control room via a system control and data acquisition system. | ||
| Fig. 4 Experimental setup at the solar tower of IMDEA Energy, depicting the solar reactor, the feeding and handling of reactant gases, and the measurement instrumentation. | ||
Experimental procedure
When the DNI >750 W m−2, the solar cavity is heated up to the desired steady-state operating temperature in the range 800–1200 °C. Standard flows during an experimental run are 50 Ln min−1 argon (Ar) through the window inlet port (to act as a protective curtain), 50 Ln min−1 reacting gas mixture through the front inlet port, and 5 Ln min−1 Ar through the casing inlet port. Typical pressures in the cavity range between 900–1200 mbar. When carbon deposition is observed, testing is halted to reduce the chance of overpressure due to clogging, or window fracture. At the end of the run, the heliostats are defocused and the ceria is re-oxidized. The nominal cavity temperature, Tnominal, is defined as the average of all the B-Type TCs located in the cavity and touching the back of the RPCs (Fig. 3, yellow dots). The nominal packed bed temperature, Tpb,nominal, is defined as the average of all the K-Type TCs located in the tubular section (Fig. 3, green dots). The following performance indicators of the solar thermochemical fuel process are determined.48The conversion of an educt, i, is given by:
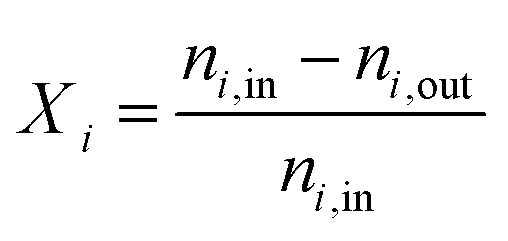 | (1) |
The total moles in and out of the system are taken across a single cycle or time range. The selectivity of a product k describes how much of the converted educt i forms the desired product k, defined as:
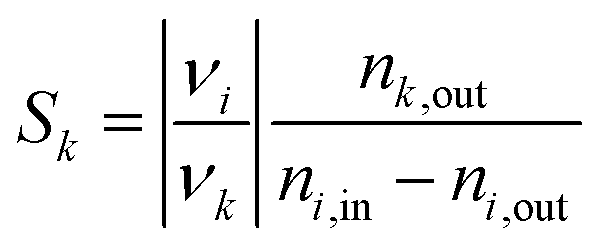 | (2) |
Eqn (1) and (2) define the instantaneous Xi and Sk. Since the process is transient by nature, the values of Xi and Sk are determined by integration over a complete cycle.
The change in δ of CeO2−δ is based on the change in oxygen atoms between the products and educts (ΔnO), where the H2O across a cycle or time range can be determined from a molar balance:
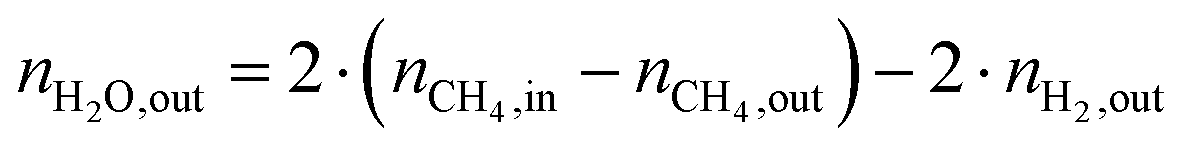 | (3) |
 | (4) |
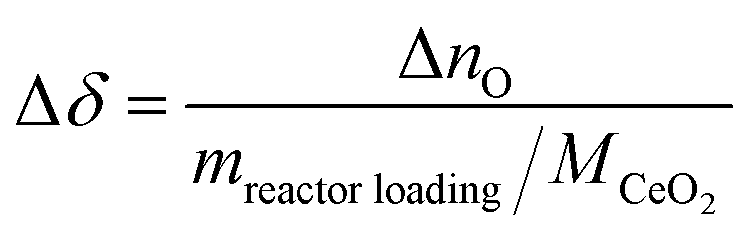 | (5) |
The Δδ across a data point with an inert reactor was zero (i.e. Δδ = −6.35·10−6), and corroborates the molar balance. The solar-to-fuel energy efficiency for the solar reactor is defined as the ratio of the high heating value of the syngas (H2 and CO) to the total energy input into the reactor, i.e. the sum of Qsolar during both redox steps and the higher heating value of CH4 injected during the reduction step:
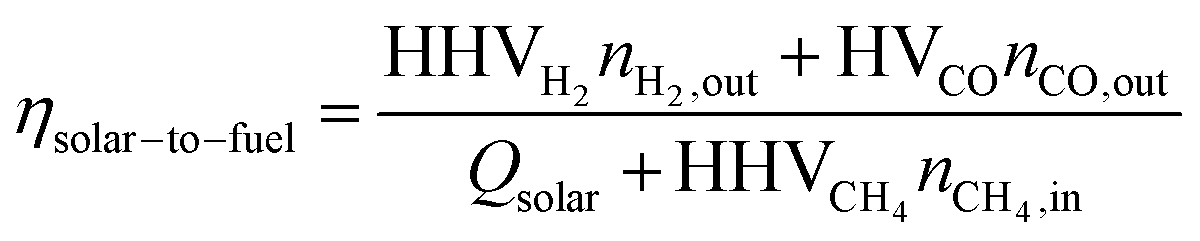 | (6) |
Note that this definition of energy efficiency refers to the performance of the solar reactor only; it does not consider the optical efficiency of the concentrating solar tower facility. Note also that Qsolar= ∫Psolardt (over the duration of a cycle/run) and Psolar typically represented about 1/25 of the concentrated solar radiative power that theoretically can be delivered by the entire heliostat field.
Results and discussion
The experimental results were collected over 24 testing days. Throughout the entire testing campaign, the calorimeter was used to measure the solar radiative power input Psolar onto the reactor aperture (incident on the quartz window), which was curve fitted with respect to the number of heliostats pointing at the aperture, the DNI, and the average field cosine factors,49 resulting in an accuracy of ± 2.0 kW based on a 90% confidence interval. Prior to testing with ceria, the solar reactor was tested with an inert cavity of alumina liner to prove the cavity can endure high flow rates of up to 300 Ln min−1 at Tnominal = 1049 °C. Multiple tests were also conducted with varying Ar flow distributions and seal angle configurations (e.g. 25° counterclockwise (CCW) or 0° causing no swirl) to elucidate the effect of the flow combinations on the fluid dynamics within the cavity. These experimental findings along with past studies investigating the effects of Reynolds and swirl numbers on window depositions motivated a flow configuration consisting of 50% through the reactor inlet and 50% through the window inlet using the 25°CCW seal for all subsequent testing to protect the window from depositions.50 With this arrangement there was no evidence of dust depositions on the window for the redox reforming and co-feeding tests.CH4 cracking
Co-producing carbon and H2 by thermal decomposition of CH4 – also referred to as CH4 cracking – can be seen as a bridge technology to a hydrogen economy,51–53 and the solar-driven process has been studied experimentally.54–56 However, in the present study, it is an unwanted reaction as the C from the CH4 should go into producing CO. Furthermore, the CH4 cracking reaction is detrimental for the operation of the solar reactor because carbon deposition can reduce the structural integrity of the window, induces pressure increase via clogging of downstream components, and as a consequence compromises the overall safety. The means of detecting CH4 cracking in order of occurrence are: (1) carbon cloud or swirl seen at the aperture with the CCD (charge-coupled device) camera; (2) sharp temperature increase on the K-Type TC located in the cavity behind the aperture, attributed to radiative absorption by the carbon particle cloud; (3) observable carbon depositions on the MAK 10 soot filter, viewed by video camera; (4) pressure increase due to clogging of downstream components; and (5) spike in the H2 outlet concentration. Fig. 5 shows a test map of inlet CH4 concentration and Tnominal points, and details a transition region (indicated by the grey line) between instances with cracking (symbol x) and without cracking (symbol green dot). The experimental conditions that presumably caused CH4 cracking were the relatively higher temperatures or inlet CH4 concentrations (symbol red x), transient heating effects caused by heliostat additions or varying DNI (symbol pink x), lower flow conditions (<105 L min−1) (symbol blue x), and an inert or deactivated ceria cavity which does not exchange oxygen for the partial oxidation of CH4 (symbol yellow/black x). The deactivated ceria cavity occurred from a co-feed test in which transient heating caused CH4-cracking and resulted in carbon depositions on the reactor cavity thus resulting in deactivation of the CeO2 redox material. To oxidize all of the carbon depositions in the cavity and to reactivate the redox activity of the ceria, CO2 was fed into the reactor at high concentrations (>40%) while ramping Tnominal up to 1200 °C.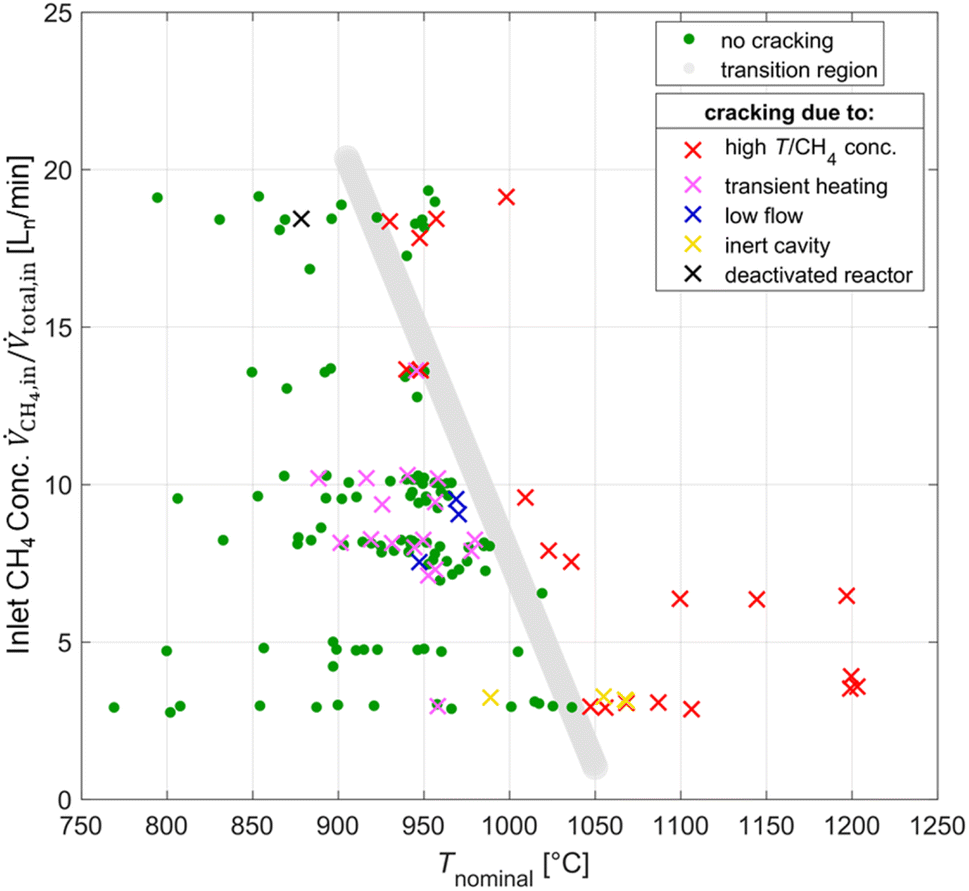 | ||
| Fig. 5 Test map of operational parameters of inlet CH4 concentration and Tnominal points. Standard conditions involve a flow rate at 105 Ln min−1 and a cavity lined with CeO2 RPCs. A transition region (grey line) separates the conditions of no CH4 cracking (green dots) from conditions that lead to CH4 cracking (x). Conditions for cracking include too high temperatures or inlet CH4 concentrations (red x), transient heating effects caused by heliostat additions or varying DNI (pink x), lower flow conditions (<105 L min−1) (blue x), and an inert or deactivated ceria cavity which does not exchange oxygen for the partial oxidation of CH4 (yellow/black x). | ||
Redox reforming
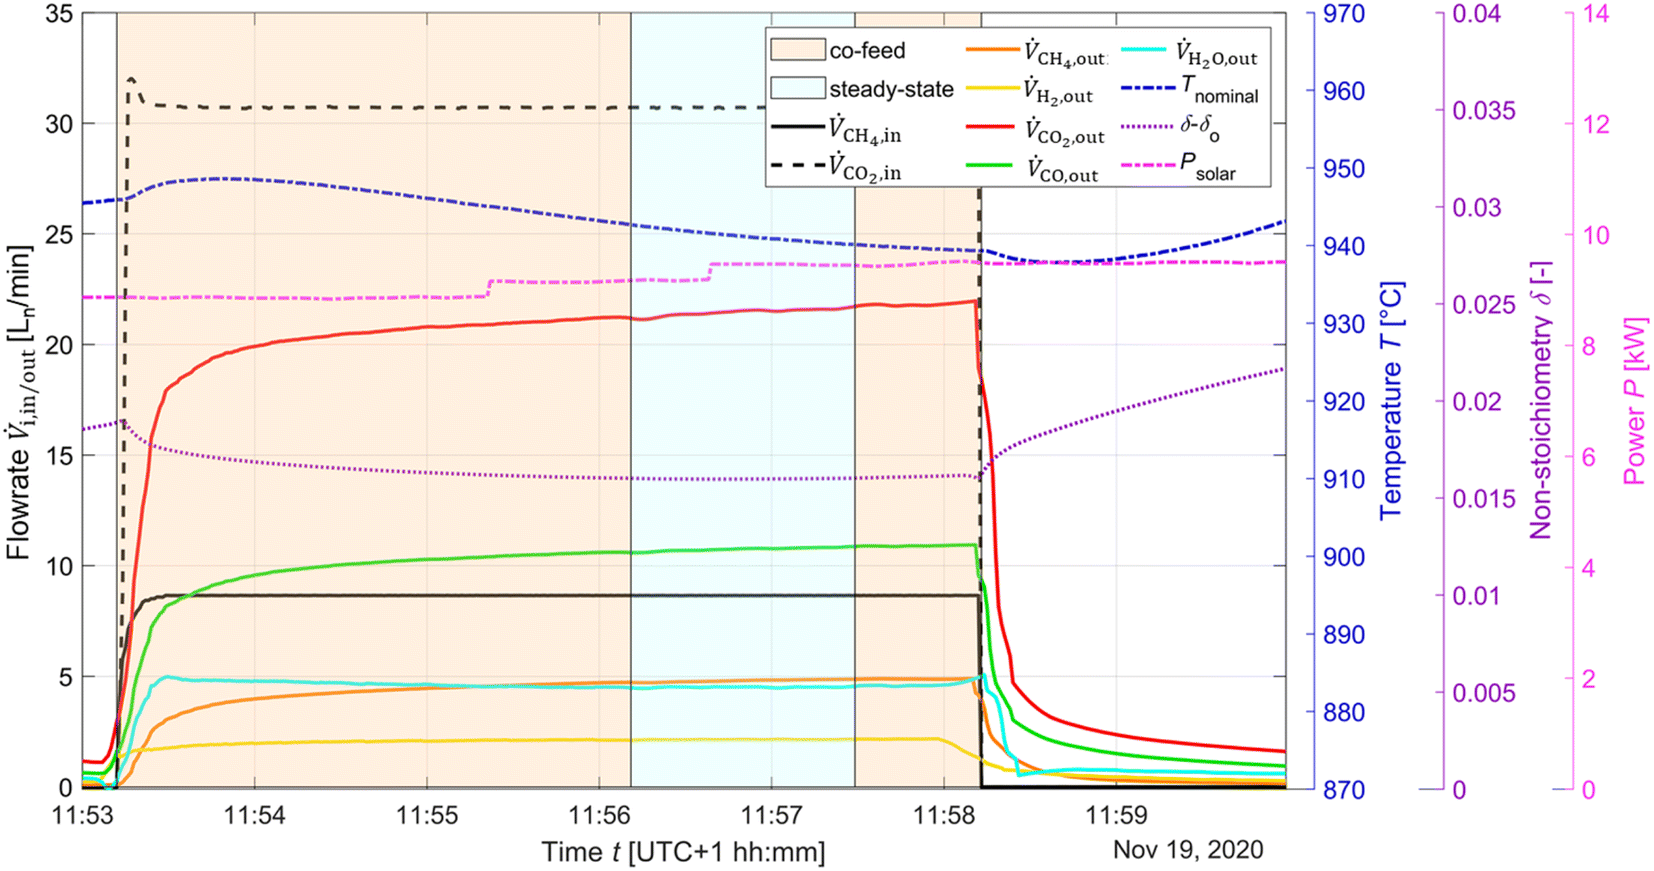
The typical redox reforming cycle consists of a reduction step of 30 s and an oxidation step of 90 s separated by an inert step of 60 s where only Ar is injected. The short reduction times are chosen to prevent any local increase in δ that may cause a phase change at elevated δ (⪆0.25) and can lead to mechanical instabilities, crystallographic changes, dampened thermodynamic properties, and/or barriers preventing stable redox cycles.18,26,57–60 On the other hand, the oxidation step is typically set to a longer duration to ensure complete re-oxidation of the ceria structure. Another means of implementing the redox reforming cycle is via the high-δ scheme. This approach aims to take advantage of the improved syngas selectivity at higher δ. First, δ is increased either by injecting CH4 or a mixture of CH4 and CO2. Then, the redox steps proceed during 60 s each by injecting CH4 during reduction and CO2 during oxidation to prevent a significant change in the δ regime. The solar radiative power input, nominal temperature, inlet/outlet gas compositions, and δ of CeO2−δ are shown in Fig. 6 as a function of time during high-δ redox reforming cycles. The solar radiative input varied throughout the test due to DNI changes. The endothermicity of the reduction step and exothermicity of the oxidation step led to respective decrease and increase of Tnominal. During reduction, CO and H2 (from R6), CO2 and H2O (from R9) and unconverted CH4 were observed, while δ increased and the selectivity of CO and H2 followed. During oxidation, unconverted CO2 and CO (from R7) were observed, while δ decreased and higher CO2 conversions occurred at the higher values of δ.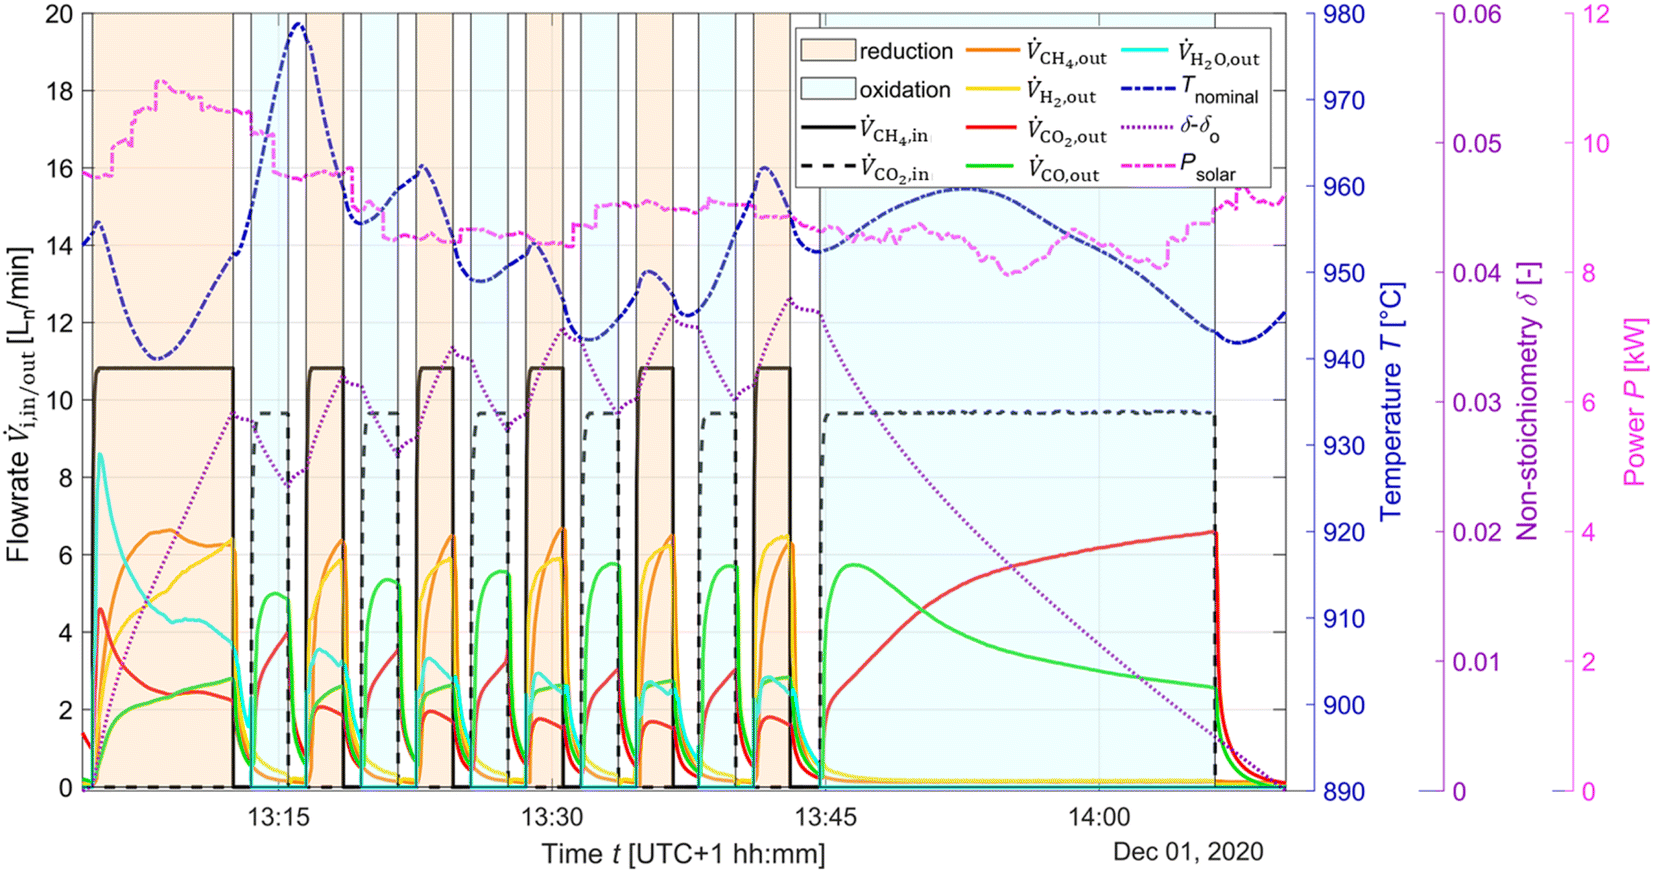 | ||
| Fig. 6 Solar radiative power input, nominal temperature, inlet/outlet gas compositions, and δ of CeO2−δ as a function of time during high-δ redox reforming cycles. Flow rate data was smoothed using a local regression with weighted linear least squares and a 2nd degree polynomial. H2O flowrate data was determined via C:H ratio balance. To illustrate the high-δ cycles, the δ − δo plot is adjusted with the start point as δo and the subsequent values are linearly and uniformly shifted to ensure δend − δo ≈ 0. In reality, δend = 0.038 due to a gradual shift over the cycling. | ||
A parametric study was performed for the redox reforming cycles in the range 800–1000 °C (isothermal for both redox steps) and for inlet reacting gas concentrations of 3, 5, 10, and 20% CH4-Ar during the reduction step and 3, 5, 10, and 20% CO2-Ar during the oxidation step (same concentrations of CH4 and CO2 for the same cycle), using a total flow of 105 Ln min−1. Different flow rates and flow configurations were tested during the commissioning stage to find the optimal configuration for uniform flow distribution within the cavity and for preventing backflow and possible carbon depositions on the quartz window. Inlet reacting gas concentrations were ramped up to determine the feasibility of running such a system under conditions closely matching industrial operation. The reactor was monitored for carbon depositions at each testing interval. Note that the residence time was not an experimental parameter for controlling coking because it was practically fixed for the optimal flow configuration. Three cycles were performed at each parameter point (the average of which is reported) to ensure reproducibility and approximate steady-state conditions, determined by minimal variation in the product composition between cycles. The initial reduction step and final oxidation step during high-δ redox reforming cycles are not included in the analysis. A few patterns observed in the results are attributed to the order of testing: from low to high gas concentrations and from low to high temperatures. Data points were collected on the same day apart from the runs at 1000 °C and at 20% and 950 °C. A longer oxidation with 20% CO2 occurred prior to the run at 850 °C, affecting the results. There was evidence of CH4 cracking for the run at 20% and 1000 °C which is included in the analysis for completeness of the data set. A few patterns observed in the packed-bed data points are attributed to the relative testing time: the difference between Tnominal and Tpb,nominal (ΔTaverage = 210 °C) was highest at the start of testing (ΔTaverage = 404 °C), and lowest at the end of testing (ΔTaverage = −14 °C). Along the packed bed an axial temperature gradient of ΔTaverage = 302 °C was observed. Note that the RPCs remained in the cavity with the packed bed installation.
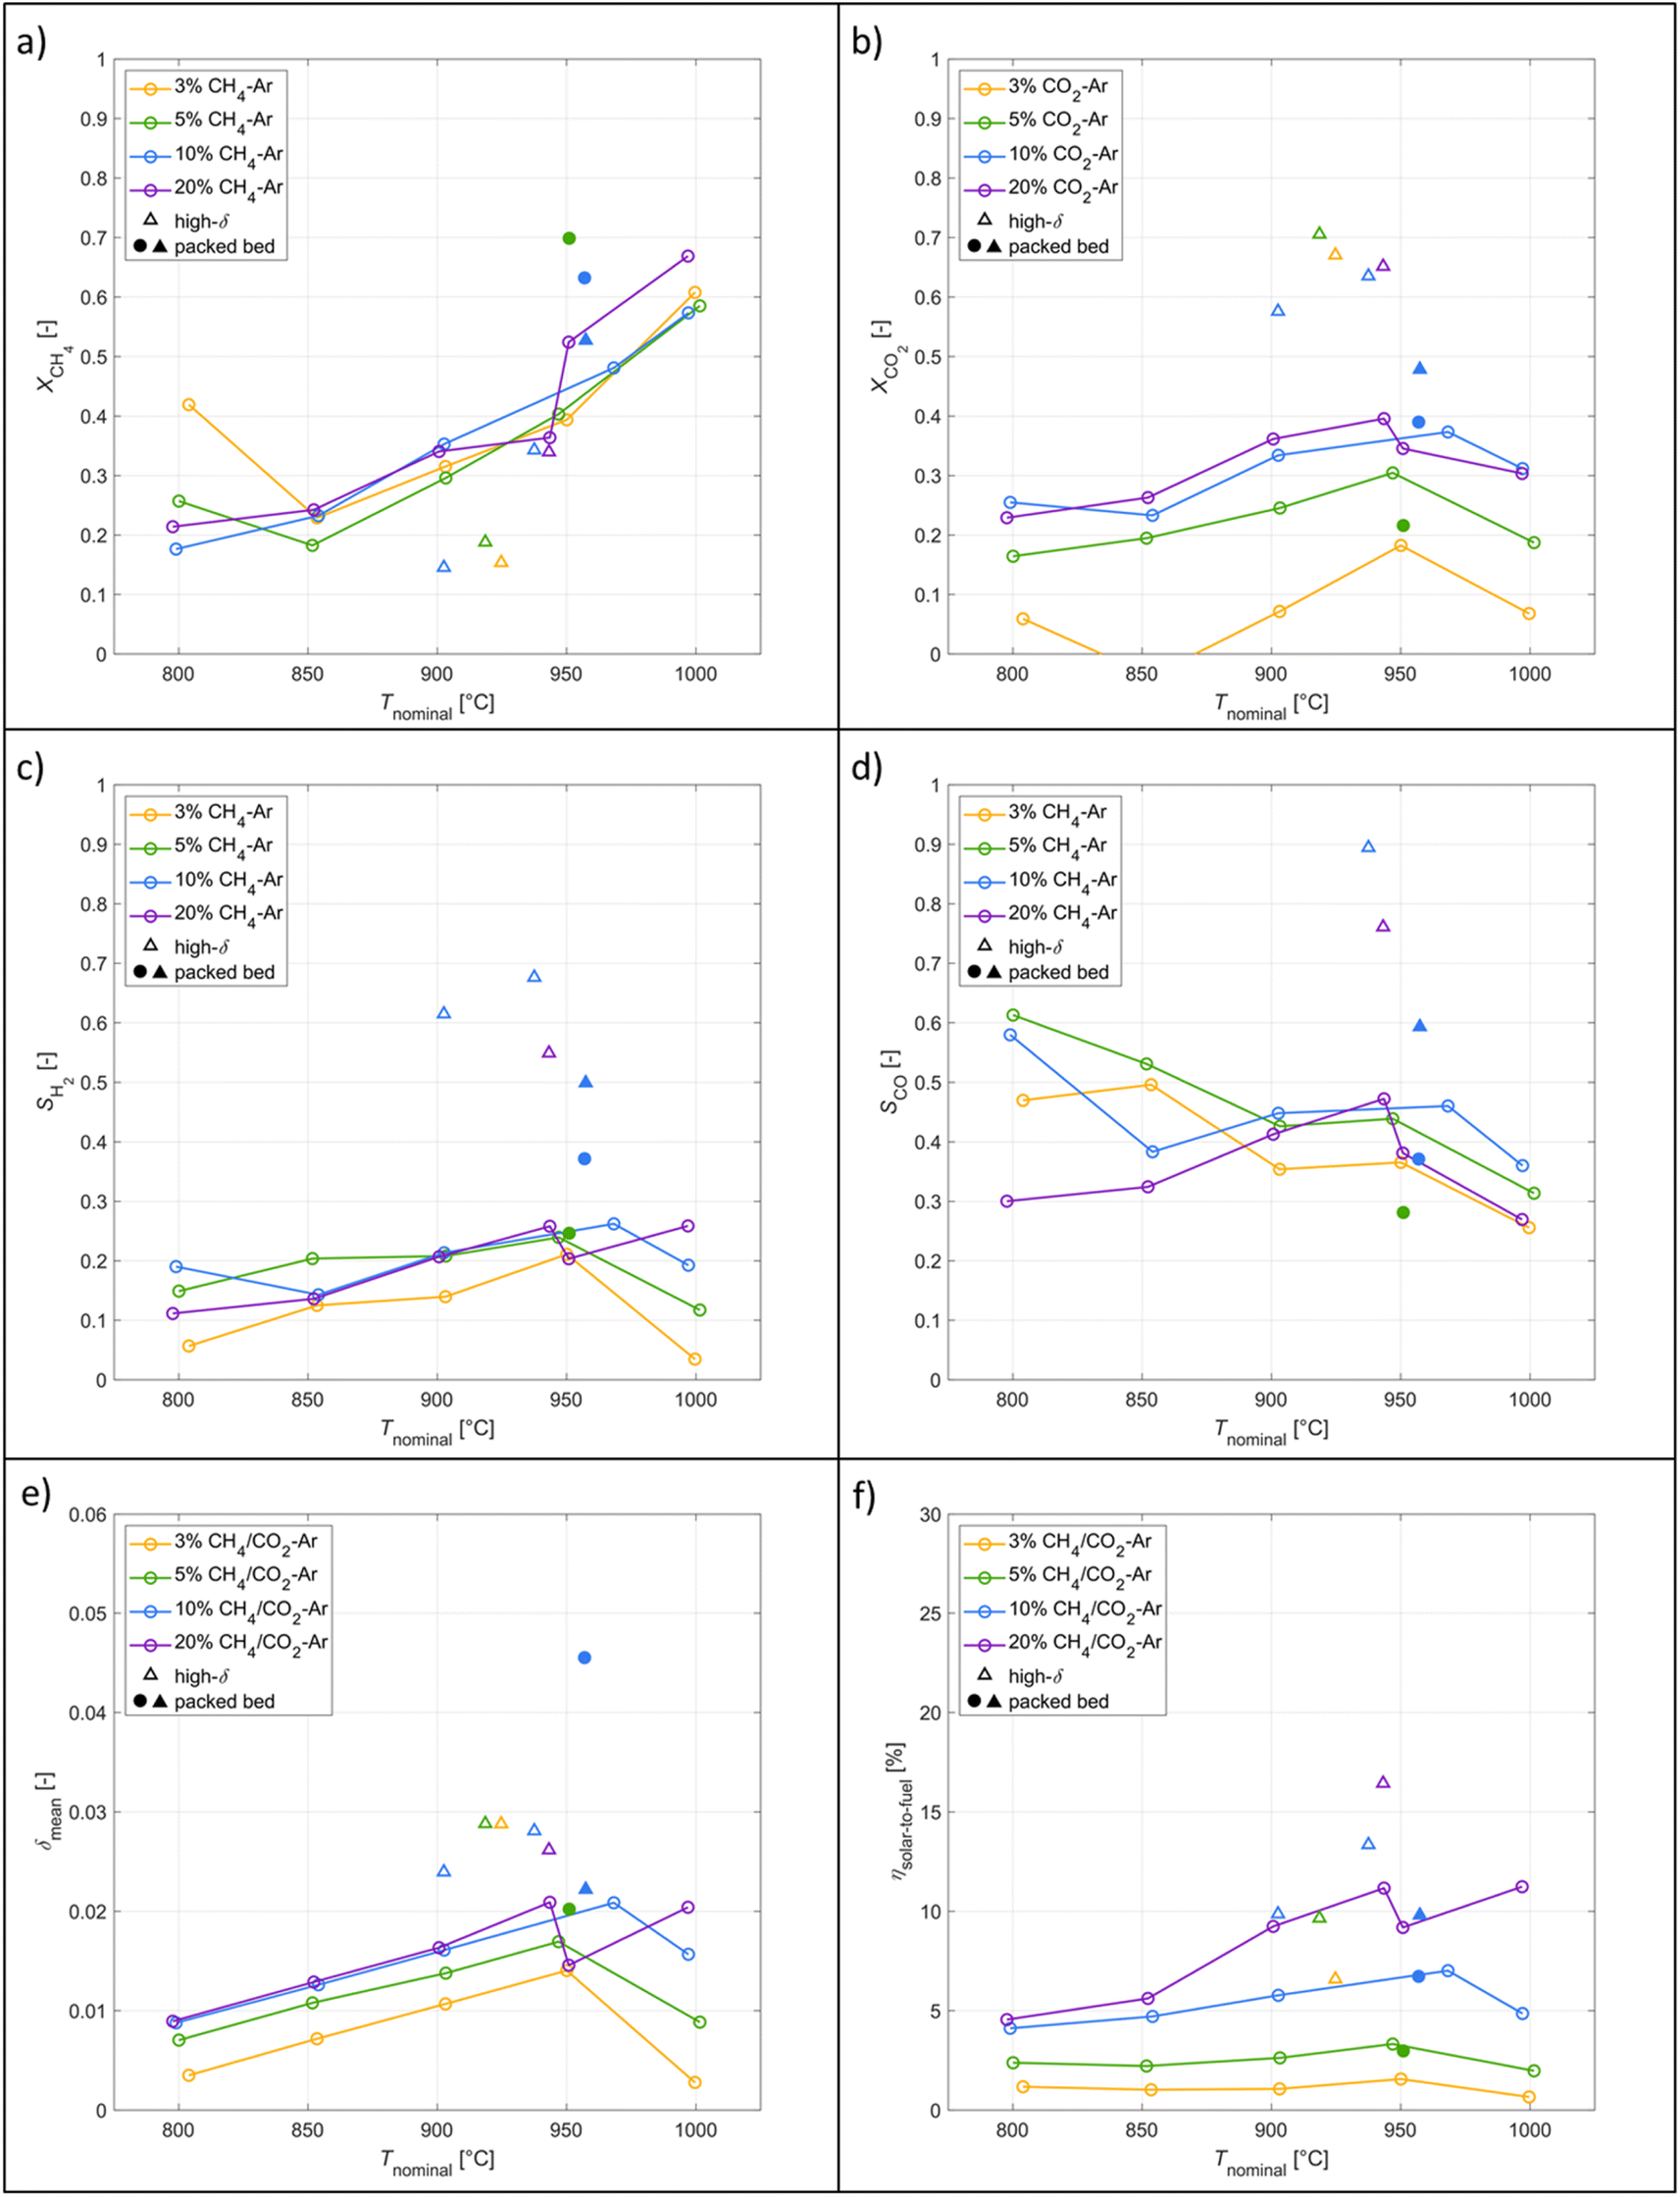 | ||
| Fig. 7 Experimental results as a function of the nominal temperature for redox reforming cycles: (a) CH4 molar conversion for the reduction step. (b) CO2 molar conversion for the oxidation step. (c) H2 selectivity of the reduction step. (d) CO selectivity of the reduction step. (e) Average δ of CeO2−δ across a complete redox reforming cycle. (f) Solar-to-fuel energy efficiency. Tests were performed at varying inlet reacting gas concentrations (3%, 5%, 10%, 20%), high-δ cycles, and with the packed bed installation in the tubular section. | ||
Co-feeding CH4 and CO2
Experimental runs were performed by co-feeding CH4 and CO2, i.e. by combining the reduction and oxidation steps in one continuous feed flow, according to: | (R10) |
To determine the viability of continuously producing syngas in a single step similar to the catalytic dry reforming (R1). CO2 and CH4 were injected at a given CO2:CH4 molar ratio, which is maintained above unity to prevent excessive ceria reduction. According to thermodynamics, a CO2:CH4 = 1.2:1 at 950 °C corresponds to δeq ≈ 0.12. The solar radiative power input, nominal temperature, inlet/outlet gas composition, and δ of CeO2−δ are shown in Fig. 8 as a function of time for the co-feeding run. Isothermal operation was easier to control than redox reforming due to continuous flow of reactants. The endothermicity of the reaction led to gradual decrease of Tnominal. During co-feeding, unconverted CH4 and CO2, and CO and H2 (from R10), and H2O from side reactions (e.g. RWGS, and R9) were observed. The δ reached a steady-state value. Note that long co-feeding runs produced significant delays in the system, as can be seen in the variation in the δ value after co-feeding.
 | ||
| Fig. 8 Solar radiative power input, nominal temperature, inlet/outlet gas compositions, and δ of CeO2−δ as a function of time for the co-feeding run. Flowrate data was smoothed using a local regression with weighted linear least squares and a 2nd degree polynomial. H2O flow rate data was determined via C:H ratio balance. | ||
The co-feeding runs were performed in the range 800–950 °C under standard total flow of 105 Ln min−1, and reacting gas concentration of 40% with CO2:CH4 = 4:1, 3:1, 2:1, and 1.2:1. The data taken for subsequent analysis was obtained during approximate steady-state conditions assumed by stable product composition during roughly 200 s. Higher temperatures were not tested due to the risk of CH4 cracking. A few patterns observed in the results are attributed to transient heating effects and the endothermicity of the reforming reaction, which have a notable effect on Tnominal and on reaching steady-state conditions. Refer to the section on Redox reforming for the patterns observed in results with respect to the packed-bed.
:CH4 molar ratio as a larger percentage of CO2 can react with CH4. On the contrary, the CH4 conversion did not vary with CO2:CH4 molar ratio suggesting another limitation such as the residence time. Analogous to the redox reforming, XCH4 and XCO2 were higher with the packed bed.
 | ||
| Fig. 9 Experimental results as a function of the nominal temperatures for the co-feeding runs: (a) CH4 molar conversion. (b) CO2 molar conversion. (c) H2 selectivity. (d) CO selectivity. (e) Average δ of CeO2−δ. (f) Solar-to-fuel energy efficiency. Tests were performed at varying inlet CO2:CH4 (3:1, 3:1, 2:1, 1.2:1) 40% diluted in Ar, and with the packed bed installation in the tubular section. | ||
:CH4 as there was less CO2 in the system to drive the RWGS turning H2 into H2O. Analogous to the redox reforming, the packed bed resulted in higher SH2 and commensurate SCO to that of the RPC cavity tests.
:CH4 because of less excess CO2 to oxidize ceria. Analysis of Δδ across the steady-state regime shows near zeros values indicating little change in the oxidation state of ceria. Slight deviation towards negative values are attributed to the endothermicity of the reforming reaction thus gradually decreasing Tnominal. δmean were higher with the packed bed as the additional CeO2 with higher SSA improved the reaction rate. The co-feeding runs at 4:1 CO2:CH4 at 937 °C and 3:1 CO2:CH4 at 947 °C did not show this behaviour due to the relative testing time: these runs were conducted at the start of testing when the system was still heating up and yet to reach steady temperatures in the packed bed. The co-feeding runs at 2:1 CO2:CH4 also did not show larger δmean values as these points were gathered after transient heating effects.
:CH4, presumably because the endothermic reaction required more solar thermal energy to maintain a certain temperature. Furthermore, the syngas produced per mol of CH4 is independent of CO2:CH4 as the RWGS can convert the H2 and the excess CO2 in the product into H2O and CO. Analogous to the redox reforming, ηsolar-to-fuel showed improvement with the packed-bed to that of the RPC cavity tests due to increased educt conversions and syngas selectivities. Comparing experimentally measured energy efficiencies of previous studies is challenging due to varying setups and definitions, and the lack of data to convert the reported values to our definition of ηsolar-to-fuel given by eqn (6). According to eqn (6), Fosheim et al.24 reported a value of 30%, and Warren et al. 17%. Based on an analogous definition but only considering the converted CH4 in the denominator of eqn (6), Welte et al.20 reported a value of 12%, Warren et al.39 21%, and we report in this study a peak value of 23% for redox reforming and 42% for the co-feeding mode.
Comparing operating modes
Tests are conducted to directly compare the operating modes of co-feeding and redox reforming. The system is injected with a total flow of 105 Ln min−1 under isothermal conditions. First the system is run in co-feeding operation until steady-state conditions are reached. Subsequently, redox reforming cyclic operation begins with reduction in which the injection times and concentrations are adjusted to mimic that of the co-feed operation. Performing redox reforming cycles directly after the co-feed run ensures a similar δ regime. The two operating modes outline the difference between continuous and batch production of H2. XCH4 between the co-feed and the respective redox reforming cycle varied by less than 0.05, as the conversions were highly dependent on Tnominal. Redox reforming cycles displayed XCO2 0.12 higher than the co-feeding runs which is due to the increased δ caused by the reduction step, thus causing CO2 conversions to increase. Syngas selectivities between the operating modes varied by less than 0.05 due to the similar operating δ regime. The δmean for the comparison tests varied by less than 0.008 between the two operation modes, thus validating that they are within the same δ regime. The redox reforming cycles showed higher δmean, as expected since they follow of the co-feeding runs. ηsolar-to-fuel varied significantly between the two operation modes. The redox reforming mode operated at efficiencies (13%) 11 percentage points less than those seen during co-feeding (24%). This is due to the stepwise production of syngas during redox reforming. For this reason, syngas was produced at roughly half the rate as obtained for co-feeding operation, although Psolar was maintained at the same level to ensure a constant Tnominal. With respect to system operation Psolar during the co-feeding mode was also easier to control due to a constant endothermic reaction. The redox reforming cycles underwent endothermic and exothermic swings which caused difficulties when controlling Tnominal.Conclusions
The experimental campaign has some inherent challenges in obtaining clean and reproducible data, managing molar balances and predicting which reactions are taking place because there are a multitude of different reactions with and without non-stoichiometric ceria. The process runs under isothermal conditions which are difficult to maintain compared to a laboratory setup because of the fluctuating DNI throughout the day and the high reacting gas concentrations (≤40%), which lead to temperature fluctuations due to the endo/exothermic reactions.The position of the B-Type TCs is behind the RPCs while the inner surface is more susceptible to flux changes and also experiences first contact with the reacting gases. Hence, the nominal reactor temperature as determined by the B-Type TCs may not be indicative of the true reacting temperature. Previous heat transfer modelling of a solar reactor containing a RPC structure indicated significant temperature gradients between the irradiated frontside of the RPC and its backside.61
The transients within the system pose a challenge when aiming to achieve steady-state conditions. The thermal insulation and packed bed have high thermal inertia, and therefore take a significant fraction of a testing day to heat up and reach steady-state conditions. The management of the non-stoichiometry has its own challenges. The pure H2O/CO2-splitting redox cycle (R3–R5) operates in a Boolean manner between a reduced (at δ < 0.05) and a re-oxidized state. In contrast, due to the reducing agent redox reforming deals with a larger possible δ regime (⪅0.345),26 where a maximum δ is avoided to prevent phase changes. Due to the large variation in δ it is difficult to reproduce tests on another day and pseudo-steady-state conditions may be observed.
Keeping these challenges in mind, the experimental campaign proved successful in demonstrating feasible dry CH4 reforming in both the redox reforming and co-feeding operation modes using a directly-irradiated solar reactor tested in a solar tower configuration. Across 24 testing days, 12500 Ln of CH4 and 27300 Ln of CO2 were fed into the reactor, both having average conversions of 31%. This resulted in a total of 15200 Ln of syngas (i.e. H2 = 3800 Ln, CO = 11400 Ln).
A parametric study of the redox reforming with high-δ cycles was performed in which nominal temperatures (800–1000 °C) and educt concentrations varied (3, 5, 10, and 20% CH4/CO2-Ar). Conversions improved with temperature and maximum CH4 conversions reached 70%. H2 selectivities improved with high-δ cycles by 160% reaching a maximum value of 68%. The solar-to-fuel energy efficiency reached 16%. The parametric co-feeding study varied the nominal temperatures (800–1000 °C) and CO2:CH4 (4:1, 3:1, 2:1, and 1.2:1) at 40% diluted in Ar. Conversions improved with temperature reaching a maximum value of 59%, and H2 selectivities increased with lower CO2:CH4 reaching a maximum of 71%. The solar-to-fuel energy efficiency peaked at 27%. Overall, the two operation modes run similarly in terms of product compositions. However, the co-feeding mode benefits from continuous production and yields efficiencies approximately twice as high as the redox reforming cycles.
The implementation of a packed bed in the tubular reactor allowed for the use of a morphology with a high SSA. With the packed bed syngas productions improved by 32% by increasing the CeO2 mass by 22%. Overall, running the redox system in a co-feeding operation mode with a low inlet CO2:CH4 performs the best due to the continuous syngas production, while mitigating side reactions due to minimal excess CO2.
Nomenclature
| DNI | direct normal irradiance [W m−2] |
| Δδ | change in non-stoichiometry |
| ΔH | heat of reaction [kJ mol−1] |
| δ | non-stoichiometry |
| δ eq | equilibrium non-stoichiometry |
| δ mean | average non-stoichiometry |
| δ red | non-stoichiometry in reduced state |
| δ o | initial non-stoichiometry |
| δ ox | non-stoichiometry in oxidized state |
| η solar-to-fuel | solar-to-fuel energy efficiency [%] |
| HHV | higher heating value [kJ mol−1] |
| HV | heating value [kJ mol−1] |
| Ln | normal liters [L] |
| M CeO2 | molar mass of ceria, 172.115 [g mol−1] |
| m i | mass [g] |
| n i | moles [mol] |
| ṅi | molar flowrate [mol s−1] |
![[V with combining dot above]](https://www.rsc.org/images/entities/char_0056_0307.gif) i i | volumetric flowrate [Ln min−1] |
| ν i | stoichiometric coefficient |
| P | power [kW] |
| Q solar | solar radiative energy input through aperture [kJ] |
| P solar | solar radiative power input through aperture [kW] |
| ppi | pores per inch [in−1] |
| RPC | Reticulated porous ceramic |
| RWGS | reverse water-gas shift |
| S k | selectivity of product k [-] |
| SSA | specific surface area [m2 g−1] |
| TC | thermocouple |
| T | temperature [°C] |
| T nominal | nominal cavity temperature [°C] |
| T pb,nominal | nominal packed bed temperature [°C] |
| t | time [hh:mm] |
| X i | conversion of educt i [-] |
Conflicts of interest
Authors have financial interests in Synhelion SA.Acknowledgements
This work was funded by the Swiss Federal Office of Energy (Project HYBREC – Grant No. SI/501854-01) and by the European Union's Horizon 2020 Research Infrastructure Programme (Project SFERA-III – Grant No. 823802). We acknowledge the support of the Natural Sciences and Engineering Research Council of Canada (NSERC), [PGSD3-545236-2020]. We thank the technical support from the Synhelion team: Marco Gil, Adriano Patané, David Rutz, Gianluca Ambrosetti, and Philipp Good, the IMDEA Energy team: Alejandro Martínez Hernández, Mario Sánchez Redero, the control systems support from Martin Keller, and scientific advice from Brendan Bulfin.References
- M. Romero and A. Steinfeld, Energy Environ. Sci., 2012, 5, 9234–9245 RSC.
- R. Schäppi, D. Rutz, F. Dahler, A. Muroyama, P. Haueter, J. Lilliestam, A. Patt, P. Furler and A. Steinfeld, Nature, 2022, 601, 63–68 CrossRef PubMed.
- S. Zoller, E. Koepf, D. Nizamian, M. Stephan, A. Patané, P. Haueter, M. Romero, J. Gonzalez-Aguilar, D. Lieftink, E. de Wit, S. Brendelberger, A. Sizmann and A. Steinfeld, Joule, 2022, 6, 1606–1616 CrossRef CAS PubMed.
- A. Segal and M. Epstein, Sol. Energy, 2003, 75, 479–490 CrossRef CAS.
- A. Berman, R. K. Karn and M. Epstein, Green Chem., 2007, 9, 626–631 RSC.
- R. Diver, J. D. Fish, R. Levitan, M. Levy, E. Meirovitch and H. Rosin, Sol. Energy, 1992, 48, 21–30 CrossRef CAS.
- R. Buck, J. F. Muir, R. E. Hogan and R. D. Skocypec, Sol. Energy Mater., 1991, 24, 449–463 CrossRef CAS.
- J. F. Muir, R. E. Hogan, R. D. Skocypec and R. Buck, Sol. Energy, 1994, 52, 467–477 CrossRef CAS.
- T. Kodama, T. Shimizu, T. Satoh, M. Nakata and K. I. Shimizu, Sol. Energy, 2002, 73, 363–374 CrossRef CAS.
- M. Levy, R. Levitan, E. Meirovitch, A. Segal, H. Rosin and R. Rubin, Sol. Energy, 1992, 48, 395–402 CrossRef CAS.
- S. Wang and L. G. Q. Max, Energy Fuels, 1996, 10, 896–904 CrossRef CAS.
- A. Worner and R. Tamme, Catal. Today, 1998, 46, 165–174 CrossRef CAS.
- A. Abdulrasheed, A. A. Jalil, Y. Gambo, M. Ibrahim, H. U. Hambali and M. Y. Shahul Hamid, Renewable Sustainable Energy Rev., 2019, 108, 175–193 CrossRef CAS.
- A. Steinfeld, in Annual Review of Heat Transfer, Begell House, Inc., 2012, ch. 8, pp. 255–275 Search PubMed.
- M. M. Nair and S. Abanades, Energy Fuels, 2016, 30, 6050–6058 CrossRef CAS.
- D. Marxer, P. Furler, M. Takacs and A. Steinfeld, Energy Environ. Sci., 2017, 10, 1142–1149 RSC.
- W. C. Chueh, C. Falter, M. Abbot, D. Scipio, P. Furler, S. M. Haile and A. Steinfeld, Science, 2010, 330, 1797–1801 CrossRef CAS PubMed.
- S. Chuayboon, S. Abanades and S. Rodat, Chem. Eng. J., 2019, 356, 756–770 CrossRef.
- K. J. Warren, J. Reim, K. Randhir, B. Greek, R. Carrillo, D. W. Hahn and J. R. Scheffe, Energy Technol., 2017, 5, 2138–2149 CrossRef CAS.
- M. Welte, K. Warren, J. R. Scheffe and A. Steinfeld, Ind. Eng. Chem. Res., 2017, 56, 10300–10308 CrossRef CAS PubMed.
- F. He, J. Trainham, G. Parsons, J. S. Newman and F. Li, Energy Environ. Sci., 2014, 7, 2033–2042 RSC.
- T. Kodama, H. Ohtake, S. Matsumoto, A. Aoki, T. Shimizu and Y. Kitayama, Energy, 2000, 25, 411–425 CrossRef CAS.
- P. T. Krenzke, J. R. Fosheim, J. Zheng and J. H. Davidson, Int. J. Hydrogen Energy, 2016, 41, 12799–12811 CrossRef CAS.
- J. R. Fosheim, B. J. Hathaway and J. H. Davidson, Energy, 2019, 169, 597–612 CrossRef CAS.
- F. Donat and C. R. Müller, Appl. Catal., B, 2020, 278, 119328 CrossRef CAS.
- B. Bulfin, L. Hoffmann, L. de Oliveira, N. Knoblauch, F. Call, M. Roeb, C. Sattler and M. Schmucker, Phys. Chem. Chem. Phys., 2016, 18, 23147–23154 RSC.
- B. Bulfin, S. Ackermann, P. Furler and A. Steinfeld, Sol. Energy, 2021, 215, 169–178 CrossRef CAS.
- A. Steinfeld, P. Kuhn and J. Karni, Energy, 1993, 18, 239–249 CrossRef CAS.
- A. Steinfeld and G. Thompson, Energy, 1994, 19, 1077–1081 CrossRef CAS.
- A. Steinfeld, A. Frei, P. Kuhn and D. Wuillemin, Int. J. Hydrogen Energy, 1995, 20, 793–804 CrossRef CAS.
- Y. Zheng, K. Li, H. Wang, D. Tian, Y. Wang, X. Zhu, Y. Wei, M. Zheng and Y. Luo, Appl. Catal., B, 2017, 202, 51–63 CrossRef CAS.
- T. Stroud, T. J. Smith, E. Le Saché, J. L. Santos, M. A. Centeno, H. Arellano-Garcia, J. A. Odriozola and T. R. Reina, Appl. Catal., B, 2018, 224, 125–135 CrossRef CAS.
- S. Das, J. Ashok, Z. Bian, N. Dewangan, M. H. Wai, Y. Du, A. Borgna, K. Hidajat and S. Kawi, Appl. Catal., B, 2018, 230, 220–236 CrossRef CAS.
- C. Agrafiotis, H. von Storch, M. Roeb and C. Sattler, Renewable Sustainable Energy Rev., 2014, 29, 656–682 CrossRef CAS.
- E. J. Sheu, E. M. A. Mokheimer and A. F. Ghoniem, Int. J. Hydrogen Energy, 2015, 40, 12929–12955 CrossRef CAS.
- D. S. A. Simakov, M. M. Wright, S. Ahmed, E. M. A. Mokheimer and Y. Román-Leshkov, Catal. Sci. Technol., 2015, 5, 1991–2016 RSC.
- S. A. M. Said, M. Waseeuddin and D. S. A. Simakov, Renewable Sustainable Energy Rev., 2016, 59, 149–159 CrossRef CAS.
- A. Steinfeld, M. Brack, A. Meier, A. Weidenkaff and D. Wuillemin, Energy, 1998, 23, 803–814 CrossRef CAS.
- K. J. Warren, R. J. Carrillo, B. Greek, C. M. Hill and J. R. Scheffe, Energy Technol., 2020, 8, 2000053 CrossRef CAS.
- T. Shimizu, K. Shimizu, Y. Kitayama and T. Kodama, Sol. Energy, 2001, 71, 315–324 CrossRef CAS.
- J. T. Jang, K. J. Yoon, J. W. Bae and G. Y. Han, Sol. Energy, 2014, 109, 70–81 CrossRef CAS.
- A. Haeussler, S. Chuayboon and S. Abanades, AIP Conf. Proc., 2020, 2303, 170009 CrossRef CAS.
- S. Chuayboon and S. Abanades, Fuel Process. Technol., 2021, 211, 106572 CrossRef CAS.
- M. Romero, J. González-Aguilar, A. Sizmann, V. Batteiger, C. Falter, A. Steinfeld, S. Zoller, S. Brendelberger and D. Lieftink, ISES SWC2019/SHC2019 Conference Proceedings, 2019 Search PubMed.
- S. Ackermann, M. Takacs, J. Scheffe and A. Steinfeld, Int. J. Heat Mass Transfer, 2017, 107, 439–449 CrossRef CAS.
- P. Furler, J. Scheffe, D. Marxer, M. Gorbar, A. Bonk, U. Vogt and A. Steinfeld, Phys. Chem. Chem. Phys., 2014, 16, 10503–10511 RSC.
- E. Koepf, S. Zoller, S. Luque, M. Thelen, S. Brendelberger, J. González-Aguilar, M. Romero and A. Steinfeld, AIP Conf. Proc., 2019, 2126, 180012 CrossRef.
- B. Bulfin, M. Miranda and A. Steinfeld, Front. Energy Res., 2021, 9, 677980 CrossRef.
- M. Blanco-Muriel, D. C. Alacon-Padilla, T. L. Lopez-Moratalla and M. Lara-Coira, Sol. Energy, 2001, 70, 431–441 CrossRef.
- E. Koepf, W. Villasmil and A. Meier, Energy Procedia, 2015, 69, 1780–1789 CrossRef CAS.
- N. Muradov and T. Vezirolu, Int. J. Hydrogen Energy, 2005, 30, 225–237 CrossRef CAS.
- T. Keipi, H. Tolvanen and J. Konttinen, Energy Convers. Manage., 2018, 159, 264–273 CrossRef CAS.
- L. Weger, A. Abánades and T. Butler, Int. J. Hydrogen Energy, 2017, 42, 720–731 CrossRef CAS.
- G. Maag, G. Zanganeh and A. Steinfeld, Int. J. Hydrogen Energy, 2009, 34, 7676–7685 CrossRef CAS.
- A. Kogan, M. Kogan and S. Barak, Int. J. Hydrogen Energy, 2005, 30, 35–43 CrossRef CAS.
- S. Abanades and G. Flamant, Int. J. Hydrogen Energy, 2007, 32, 1508–1515 CrossRef CAS.
- S. Ackermann, L. Sauvin, R. Castiglioni, J. L. Rupp, J. R. Scheffe and A. Steinfeld, J. Phys. Chem. C, 2015, 119, 16452–16461 CrossRef CAS PubMed.
- D. J. M. Bevan and J. Kordis, J. Inorg. Nucl. Chem., 1963, 26, 1509–1523 CrossRef.
- R. Korner, M. Ricken and J. Nolting, J. Solid State Chem., 1989, 78, 136–147 CrossRef CAS.
- M. Zinkevich, D. Djurovic and F. Aldinger, Solid State Ionics, 2006, 177, 989–1001 CrossRef CAS.
- S. Zoller, E. Koepf, P. Roos and A. Steinfeld, J. Sol. Energy Eng., 2019, 141, 021014 CrossRef CAS.
| This journal is © The Royal Society of Chemistry 2023 |