
 Open Access Article
 This Open Access Article is licensed under a
 Creative Commons Attribution 3.0 Unported Licence
Insights into alloy/oxide or hydroxide interfaces in Ni–Mo-based electrocatalysts for hydrogen evolution under alkaline conditions
Min
Luo
a,
Jietian
Yang
a,
Xingang
Li
 a,
Miharu
Eguchi
bc,
Yusuke
Yamauchi
bc and
Zhong-Li
Wang
*a
a,
Miharu
Eguchi
bc,
Yusuke
Yamauchi
bc and
Zhong-Li
Wang
*a
aTianjin Key Laboratory of Applied Catalysis Science and Technology, School of Chemical Engineering and Technology, Tianjin University, Tianjin 300072, China. E-mail: wang.zhongli@tju.edu.cn
bJST-ERATO Yamauchi Materials Space-Tectonics Project, International Center for Materials Nanoarchitectonics (WPI-MANA), National Institute for Materials Science (NIMS), 1-1Namiki, Tsukuba, Ibaraki 305-0044, Japan
cSchool of Chemical Engineering and Australian Institute for Bioengineering and Nanotechnology (AIBN), The University of Queensland, Brisbane, QLD 4072, Australia
First published on 19th January 2023
Abstract
Nickel–molybdenum (Ni–Mo) alloys are promising non-noble metal electrocatalysts for the hydrogen evolution reaction (HER) in alkaline water; however, the kinetic origins of their catalytic activities still remain under debate. In this perspective, we systematically summarize the structural characteristics of Ni–Mo-based electrocatalysts recently reported and find that highly active catalysts generally have alloy–oxide or alloy–hydroxide interface structures. Based on the two-step reaction mechanism under alkaline conditions, water dissociation to form adsorbed hydrogen and combination of adsorbed hydrogen into molecular hydrogen, we discuss in detail the relationship between the two types of interface structures obtained by different synthesis methods and their HER performance in Ni–Mo based catalysts. For the alloy–oxide interfaces, the Ni4Mo/MoOx composites produced by electrodeposition or hydrothermal combined with thermal reduction exhibit activities close to that of platinum. For only the alloy or oxide, their activities are significantly lower than that of composite structures, indicating the synergistic catalytic effect of binary components. For the alloy–hydroxide interfaces, the activity of the NixMoy alloy with different Ni/Mo ratios is greatly improved by constructing heterostructures with hydroxides such as Ni(OH)2 or Co(OH)2. In particular, pure alloys obtained by metallurgy must be activated to produce a layer of mixed Ni(OH)2 and MoOx on the surface to achieve high activity. Therefore, the activity of Ni–Mo catalysts probably originates from the interfaces of alloy–oxide or alloy–hydroxide, in which the oxide or hydroxide promotes water dissociation and the alloy accelerates hydrogen combination. These new understandings will provide valuable guidance for the further exploration of advanced HER electrocatalysts.
1. Introduction
The increasing energy crisis induced by fast depletion of limited fossil fuels and environmental impacts have resulted in an urgent demand for clean and renewable energy resources. Owing to its high energy density and environmentally friendly characteristics, molecular hydrogen is an attractive energy carrier to meet future global energy demands.1–4 Electrochemical water splitting that converts water into hydrogen and oxygen is a promising way for sustainable production of hydrogen, especially when it is driven by green electricity from sunlight, wind, hydropower, etc. Alkaline water electrolysis is one of the most mature and widely used electrolysis technologies for hydrogen production due to its low-cost components and high durability. However, the sluggish reaction kinetics of the hydrogen evolution reaction (HER) in alkaline media lead to high overpotentials for practical water splitting. To promote the HER kinetics, efficient electrocatalysts are necessary to decrease the reaction overpotentials, thus making the water splitting more energy-saving. As a benchmark HER electrocatalyst, precious metal platinum (Pt)-based materials are almost still the catalysts with the highest intrinsic activity.5 Unfortunately, the scarcity and high cost of Pt seriously impede its large-scale applications in the electrocatalytic HER.To develop efficient and earth-abundant alternatives to Pt as HER electrocatalysts, great efforts have been made to explore transition metal-based electrocatalysts over the past decade, including metal oxides,6–8 metal alloys,9–12 traditional metal phosphides,13–17 carbides,18,19 and sulfides.20–22 Among them, nickel-based materials are the most used electrocatalysts in alkaline electrolyzers, and especially, nickel–molybdenum (Ni–Mo) bimetallic catalysts exhibit the best HER catalytic performance among all the non-noble metal-based materials.23–42 Typically, Ni4Mo alloy nanoparticles supported by MoO2 cuboids on nickel foam exhibited zero onset overpotential, an overpotential of 15 mV at 10 mA cm−2 and a low Tafel slope of 30 mV dec−1 in 1 M KOH.23 Such performance is comparable to that of Pt and superior to those of state-of-the-art Pt-free electrocatalysts. However, the detailed mechanism for the enhanced activity of Ni–Mo catalysts remains controversial, and several mechanisms have been proposed to account for the high HER activity of Ni–Mo-based electrocatalysts. One prevailing explanation is related to the electronic synergy of Ni and Mo in the alloy, leading to an appropriate hydrogen adsorption energy of the catalyst surface.43,44 The second proposed mechanism is that Ni activates water dissociation to produce adsorbed hydrogen species which then transfer to the Mo surface via hydrogen spillover to produce molecular hydrogen, called the hydrogen-spillover effect.45 And the third explanation is that the intrinsic activity of the Ni–Mo alloy originates from Ni and surface area enhancement through Mo dissolution improves the current density.46 These three mechanisms focus on the role of metallic Ni as the primary active site. However, the recent results demonstrated that a Mo oxo species (most likely Mo3+) supported on metallic Ni or the NixMoy alloy was responsible for the high activity of a Ni–Mo catalyst for water reduction to form hydrogen.47 It can be clearly seen that these mechanisms are inconsistent, indicating the complexity of the Ni–Mo catalytic system. Therefore, it is necessary to further explore the factors that affect the activity of the Ni–Mo catalyst and deeply understand the nature of high activity.
As shown in Fig. 1, the HER kinetics in alkaline solutions involves two steps: water dissociation to form adsorbed hydrogen (Volmer step) and combination of adsorbed hydrogen into molecular hydrogen (Heyrovsky or Tafel step).48,49 Compared to the HER under acidic conditions, where protons are directly used as reactants, the reactants in an alkaline solution switch from protons to water as the hydrogen source, and an additional water dissociation step needs to occur to release protons, which significantly decreases the reaction rate of the HER. As a result, even for Pt-based catalysts, the catalytic performance and kinetics are hindered by the slow rate of water cleavage in the Volmer step. Due to this reason, the reaction rate on Pt is usually 2–3 orders lower in an alkali than that in an acid.50 Therefore, efficient HER under alkaline conditions requires that the active sites of the catalyst simultaneously accelerate the water dissociation and hydrogen combination reactions. Interestingly, the decoration of Ni(OH)2 on the Pt surfaces has been demonstrated to drastically increase the HER performance of Pt catalysts under alkaline conditions, and it is proposed that Ni(OH)2 promotes the cleavage of H–OH bonds in the water dissociation step, while Pt facilitates adsorption and combination of the generated hydrogen intermediates to form H2 molecules.5 Pt/Ni(OH)2-based systems have not only advanced electrocatalytic performances but also provided insight into reaction mechanisms.
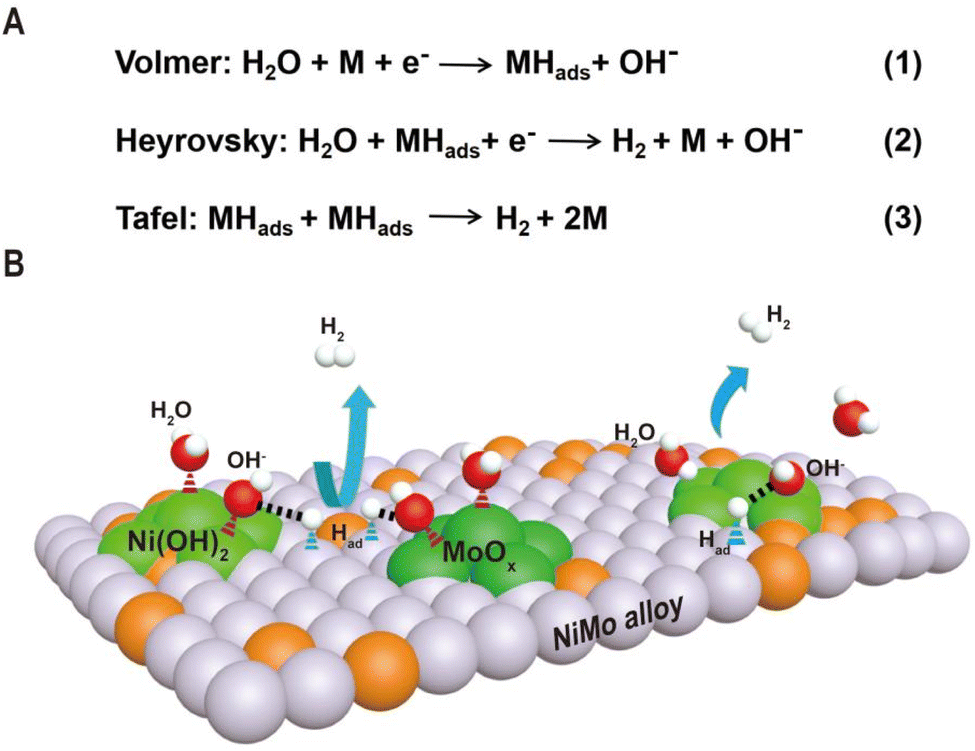 | ||
| Fig. 1 (A) The reaction mechanism for the HER in alkaline electrolytes and two pathways are presented in the forms of the Volmer–Heyrovsky mechanism and the Volmer–Tafel mechanism. (B) Schematic diagram of synergetic catalysis of alloy–oxide or alloy–hydroxide interface structures, in which the oxide or hydroxide promotes water dissociation and the alloy accelerates hydrogen combination. | ||
Inspired by the fundamental HER mechanism that occurs on Pt/Ni(OH)2 interface, we systematically summarize the structural characteristics of Ni–Mo-based electrocatalysts recently reported, and find surprisingly that highly active catalysts generally have alloy–oxide or alloy–hydroxide interface structures. It is not difficult to speculate that the two components at the interface may jointly promote the two-step reaction of the HER in Ni–Mo systems. Based on this understanding, we discuss in detail the relationship between the two types of interface structures obtained by different synthesis methods and their HER performance in Ni–Mo-based catalysts. For the alloy–oxide interfaces, the Ni4Mo/MoOx (mixed oxide with the Mo ion valence from +4 to +6) composites produced by electrodeposition or hydrothermal combined with thermal reduction exhibit activities close to that of platinum. For only the alloy or oxide, their activities are significantly lower than that of composite structures, indicating the synergistic catalytic effect of binary components. For the alloy–hydroxide interfaces, the activity of the NixMoy alloy with different Ni/Mo ratios is greatly improved by constructing heterostructures with hydroxides such as Ni(OH)2 or Co(OH)2. In particular, pure alloys obtained by metallurgy must be activated to produce a layer of mixed Ni(OH)2 and MoOx on the surface to achieve high activity. Therefore, it can be seen that the activity of Ni–Mo catalysts probably originates from the interfaces of alloy–oxide or alloy–hydroxide, in which the oxide or hydroxide promotes water dissociation and the alloy accelerates hydrogen combination. These new understandings will provide valuable guidance for the further exploration of advanced HER electrocatalysts.
2. Ni–Mo alloy/oxide interfaces
The preparation of the Ni–Mo alloy can be divided into two categories according to different raw materials: chemical method and metallurgical method. The chemical method generates alloys from Ni and Mo metal salts through a series of chemical reactions, while the metallurgical method directly produces alloys from two metals at high temperatures. Chemical methods are widely used in the synthesis of Ni–Mo alloy catalysts due to their advantages such as simple operation and controllable structure. According to the reaction process, chemical methods can also be divided into two types: one is the direct reduction of metal salts to produce alloys in one step, such as electrochemical reduction deposition, and the other is the two-step method, i.e., the metal salts first form oxide intermediates, such as NiMoO4 through a hydrothermal reaction, and then the intermediates are reduced in a hydrogen atmosphere to produce alloys. Since Mo6+ is more difficult to reduce than Ni2+, only part of Mo ions is reduced to form alloys during the reduction of metal salts or oxide intermediates, and excessive Mo ions will form oxides, resulting in a large number of alloy/oxide interface structures. Therefore, the proportion of Ni/Mo and the reduction conditions determine the composition of the products, mainly including the type of Ni–Mo alloy, the content, and valence of MoOx. Under general chemical reduction conditions, such as electrochemical reduction or hydrogen reduction below 600 °C, the Ni–Mo alloy is mainly Ni4Mo, and MoOx is a mixed oxide with the Mo ion valence from +4 to +6. In the following, we will introduce several Ni–Mo-based catalysts prepared by a chemical method, focusing on the interface structures of N4Mo/MoOx and their HER performances.The Ni4Mo nanodot/amorphous MoOx nanosheet interface structure was synthesized on copper foam via a one-step electrodeposition process as shown in Fig. 2A.51 In the electrodeposition process, the MoO42− anions, Ni2+ cations, and the citrate anions first formed [(NiCit)(MoOx)]ads−, followed by the reduction of Ni2+ to metallic Ni0, and then the resulting Ni atoms acted as the active sites for the depositing the Ni4Mo alloy on the MoOx surface. By changing the ratio of Ni/Mo and electroreduction current density, the samples of Ni4Mo and pure Ni were also synthesized for the comparison experiment. The as-synthesized composite catalyst exhibits ultrathin nanosheet morphology (Fig. 2B) and many nanoparticles with a diameter of about 5 nm are homogeneously distributed on the nanosheets (Fig. 2C). The high-resolution transmission electron microscope (HRTEM) image (Fig. 2D) and selective area electron diffraction (SAED) pattern (Fig. 2E) show lattice fringes of (121) and (310) planes of the Ni4Mo nanoparticle, while no crystal lattice of MoOx nanosheets could be observed, suggesting the amorphous nature of the MoOx nanosheets. The strong Raman peaks in the range of 550–1000 cm−1 also verify the presence of amorphous molybdenum oxide, and the X-ray photoelectron spectroscopy (XPS) with Ar etching shows that all Ni2+ is reduced to Ni0, while the Mo element exists not only in the form of Mo0 but also oxidized forms including Mo4+ and Mo5+. Fig. 2F shows the polarization curves of Ni metal, Ni4Mo alloy, and Ni4Mo/MoOx for HER electrocatalysis. The overpotential of Ni4Mo/MoOx at a current density of 10 mA cm−2 is only 16 mV, close to that of Pt/C, and much lower than that of Ni metal (169 mV) and the Ni4Mo alloy (40 mV). Evidently, the HER activity of Ni increases substantially by forming an alloy with Mo and is further boosted by constructing the Ni4Mo/MoOx nanointerfaces, indicating the beneficial bimetallic ligand effect and synergetic effect between the metal and metal oxide. The theoretical study shows that the Ni4Mo/MoOx has a strong bonding at the interface and the electronic distribution indicates that the Ni4Mo alloy is more electron-rich (Fig. 2G), compared with the hole-rich MoOx. The comparison of projected density of states (PDOS) indicates that the d-band center of Ni at the interface downshifts toward lower energy levels, which optimizes the bonding strength of *H on the alloy. In MoOx, the deep localized O-2p band overlaps with the Mo-4d-t2g state propelling more electrons towards the Mo-4d-eg level, which leads Mo sites to high binding activities for the O-related species such as *OH intermediates. Therefore, Ni4Mo/MoOx interface provides a high active area for bond-cleavage of water-splitting under alkaline conditions. The free energy profile for the HER pathway under alkaline conditions is also studied (Fig. 2H), and the Ni4Mo/MoOx interface shows substantial energetic favorable with reaction energy (−1.35 eV) gained for the HER.
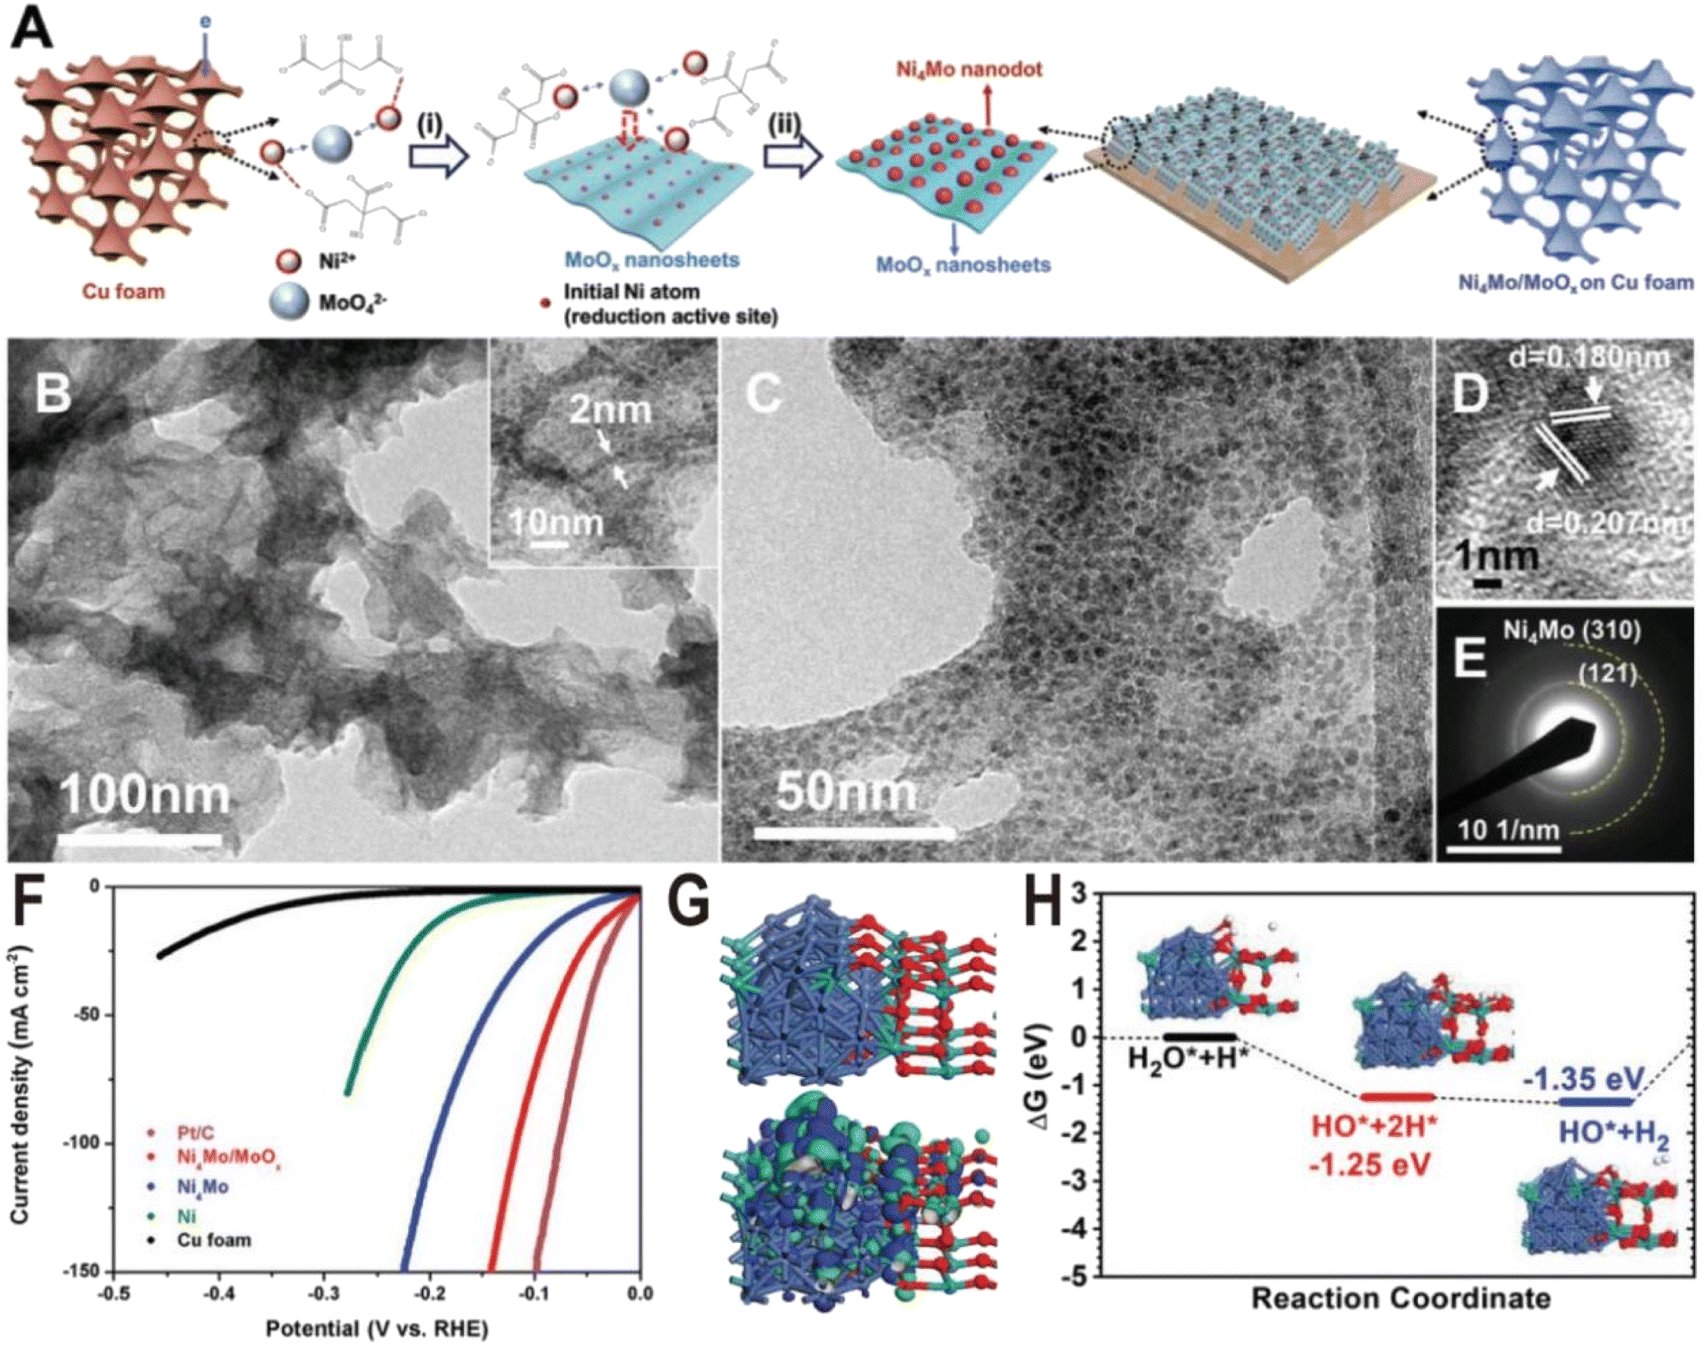 | ||
| Fig. 2 (A) Schematic of the Ni4Mo/MoOx synthesis route on Cu foam. (i) Induced codeposition; (ii) formation of nanointerfaces with the dispersion of the alloy nanoparticles. (B and C) TEM images, (D) HRTEM image, and (E) SAED pattern of Ni4Mo nanoparticles on amorphous MoOx nanosheets. (F) Polarization curves of Pt/C, bare Cu foam, Ni, Ni4Mo alloy, and Ni4Mo/MoOx. (G) Electronic properties of interface model systems. Brown balls = Cu; cyan balls = Mo; blue balls = Ni; and red balls = O. (H) Free energy pathway, chemisorption, and formation energy for the HER. Reproduced with permission.51 Copyright 2019, Wiley-VCH. | ||
In addition to one-step direct reduction, the two-step method is also widely used in the synthesis of the Ni4Mo/MoOx interface. Typically, NiMoO4 nanorod arrays were first grown on Ni foam via a solvothermal process using Ni foam itself as a Ni source and ammonium molybdate as a Mo source, and then NiMoO4 was partially decomposed to MoNi4 nanocrystals and amorphous MoO3−x by annealing in a H2/Ar atmosphere at 350 °C (Fig. 3A).52 The HRTEM image (Fig. 3B) displays clear lattice fringes with distances of 1.81 and 2.07 Å corresponding to the (310) and (121) planes of the MoNi4 alloy, suggesting the production of MoNi4 nanocrystals. Due to the amorphous phase of MoO3−x, no continuous lattice fringes are observed in the HRTEM image, but Raman and XPS spectra clearly evidence the existence of MoO3−x. As shown in Fig. 3C, the annealed MoNi4/MoO3−x exhibits three new peaks at 121, 480, and 719 cm−1 compared to the NiMoO4 precursor, and the three peaks could be ascribed to the lattice deformation mode, deformation of Mo![[double bond, length as m-dash]](https://www.rsc.org/images/entities/char_e001.gif) O stretching mode, and modification of the Mo2–O bond for MoO3−x species, respectively. The high-resolution Mo 3d XPS spectra (Fig. 3D) of MoNi4/MoO3−x further demonstrate the existence of Mo0, Mo4+, Mo5+, and Mo6+, and the low-valence states of Mo (Mo5+ and Mo4+) imply the formation of MoO3−x with oxygen vacancies. As dual active components, the MoNi4/MoO3−x hybrid exhibits a remarkable HER activity with low overpotentials of 17 mV at 10 mA cm−2 and 114 mV at 500 mA cm−2 (Fig. 3E), comparable to the values of the Pt catalyst (13 and 59 mV). The turnover frequency (TOF) is also estimated, and at an overpotential of 100 mV, the TOF of MoNi4/MoO3−x is 1.13 s−1, much higher than that of Ni foam (0.06 s−1). After the 20 h chronoamperometry test at 20 or 30 mA cm−2, the decline of overpotential is negligible and the structure of nanorod arrays and composition remain almost unchanged, keeping the similar valence states of Mo0, Mo4+, and Mo5+. In order to investigate the origin of intrinsic activity, the Mo0 and Ni0 as well as Mo4+ and Mo5+ in MoNi4/MoO3−x were oxidized to the high valence states of Mo6+ and Ni2+ by in situ electrochemical oxidation. As a result, HER activity decreases significantly (Fig. 3F), indicating that the activity of high valence molybdenum oxide is very low. Interestingly, the control sample annealed in an Ar atmosphere exhibits better activity than the completely oxidized sample due to the existence of little MoO3−x; however, since there is no MoNi4 alloy produced, its activity is still much lower than that of the samples obtained in a reducing atmosphere (Fig. 3G). Therefore, the MoNi4 alloy and MoO3−x should synergistically catalyze the HER at the interface. Other MoNi4/MoO3−x or MoNi4/NiMoOx interfaces with different structures such as hollow, branch-leaf hierarchical, or nanowire structures have been prepared by reducing the NiMoO4 intermediate, and all exhibited excellent HER performance with the overpotentials from 29 to 38 mV at 10 mA cm−2, further demonstrating the unique advantages of Ni4Mo/MoOx interfaces.53–56
O stretching mode, and modification of the Mo2–O bond for MoO3−x species, respectively. The high-resolution Mo 3d XPS spectra (Fig. 3D) of MoNi4/MoO3−x further demonstrate the existence of Mo0, Mo4+, Mo5+, and Mo6+, and the low-valence states of Mo (Mo5+ and Mo4+) imply the formation of MoO3−x with oxygen vacancies. As dual active components, the MoNi4/MoO3−x hybrid exhibits a remarkable HER activity with low overpotentials of 17 mV at 10 mA cm−2 and 114 mV at 500 mA cm−2 (Fig. 3E), comparable to the values of the Pt catalyst (13 and 59 mV). The turnover frequency (TOF) is also estimated, and at an overpotential of 100 mV, the TOF of MoNi4/MoO3−x is 1.13 s−1, much higher than that of Ni foam (0.06 s−1). After the 20 h chronoamperometry test at 20 or 30 mA cm−2, the decline of overpotential is negligible and the structure of nanorod arrays and composition remain almost unchanged, keeping the similar valence states of Mo0, Mo4+, and Mo5+. In order to investigate the origin of intrinsic activity, the Mo0 and Ni0 as well as Mo4+ and Mo5+ in MoNi4/MoO3−x were oxidized to the high valence states of Mo6+ and Ni2+ by in situ electrochemical oxidation. As a result, HER activity decreases significantly (Fig. 3F), indicating that the activity of high valence molybdenum oxide is very low. Interestingly, the control sample annealed in an Ar atmosphere exhibits better activity than the completely oxidized sample due to the existence of little MoO3−x; however, since there is no MoNi4 alloy produced, its activity is still much lower than that of the samples obtained in a reducing atmosphere (Fig. 3G). Therefore, the MoNi4 alloy and MoO3−x should synergistically catalyze the HER at the interface. Other MoNi4/MoO3−x or MoNi4/NiMoOx interfaces with different structures such as hollow, branch-leaf hierarchical, or nanowire structures have been prepared by reducing the NiMoO4 intermediate, and all exhibited excellent HER performance with the overpotentials from 29 to 38 mV at 10 mA cm−2, further demonstrating the unique advantages of Ni4Mo/MoOx interfaces.53–56
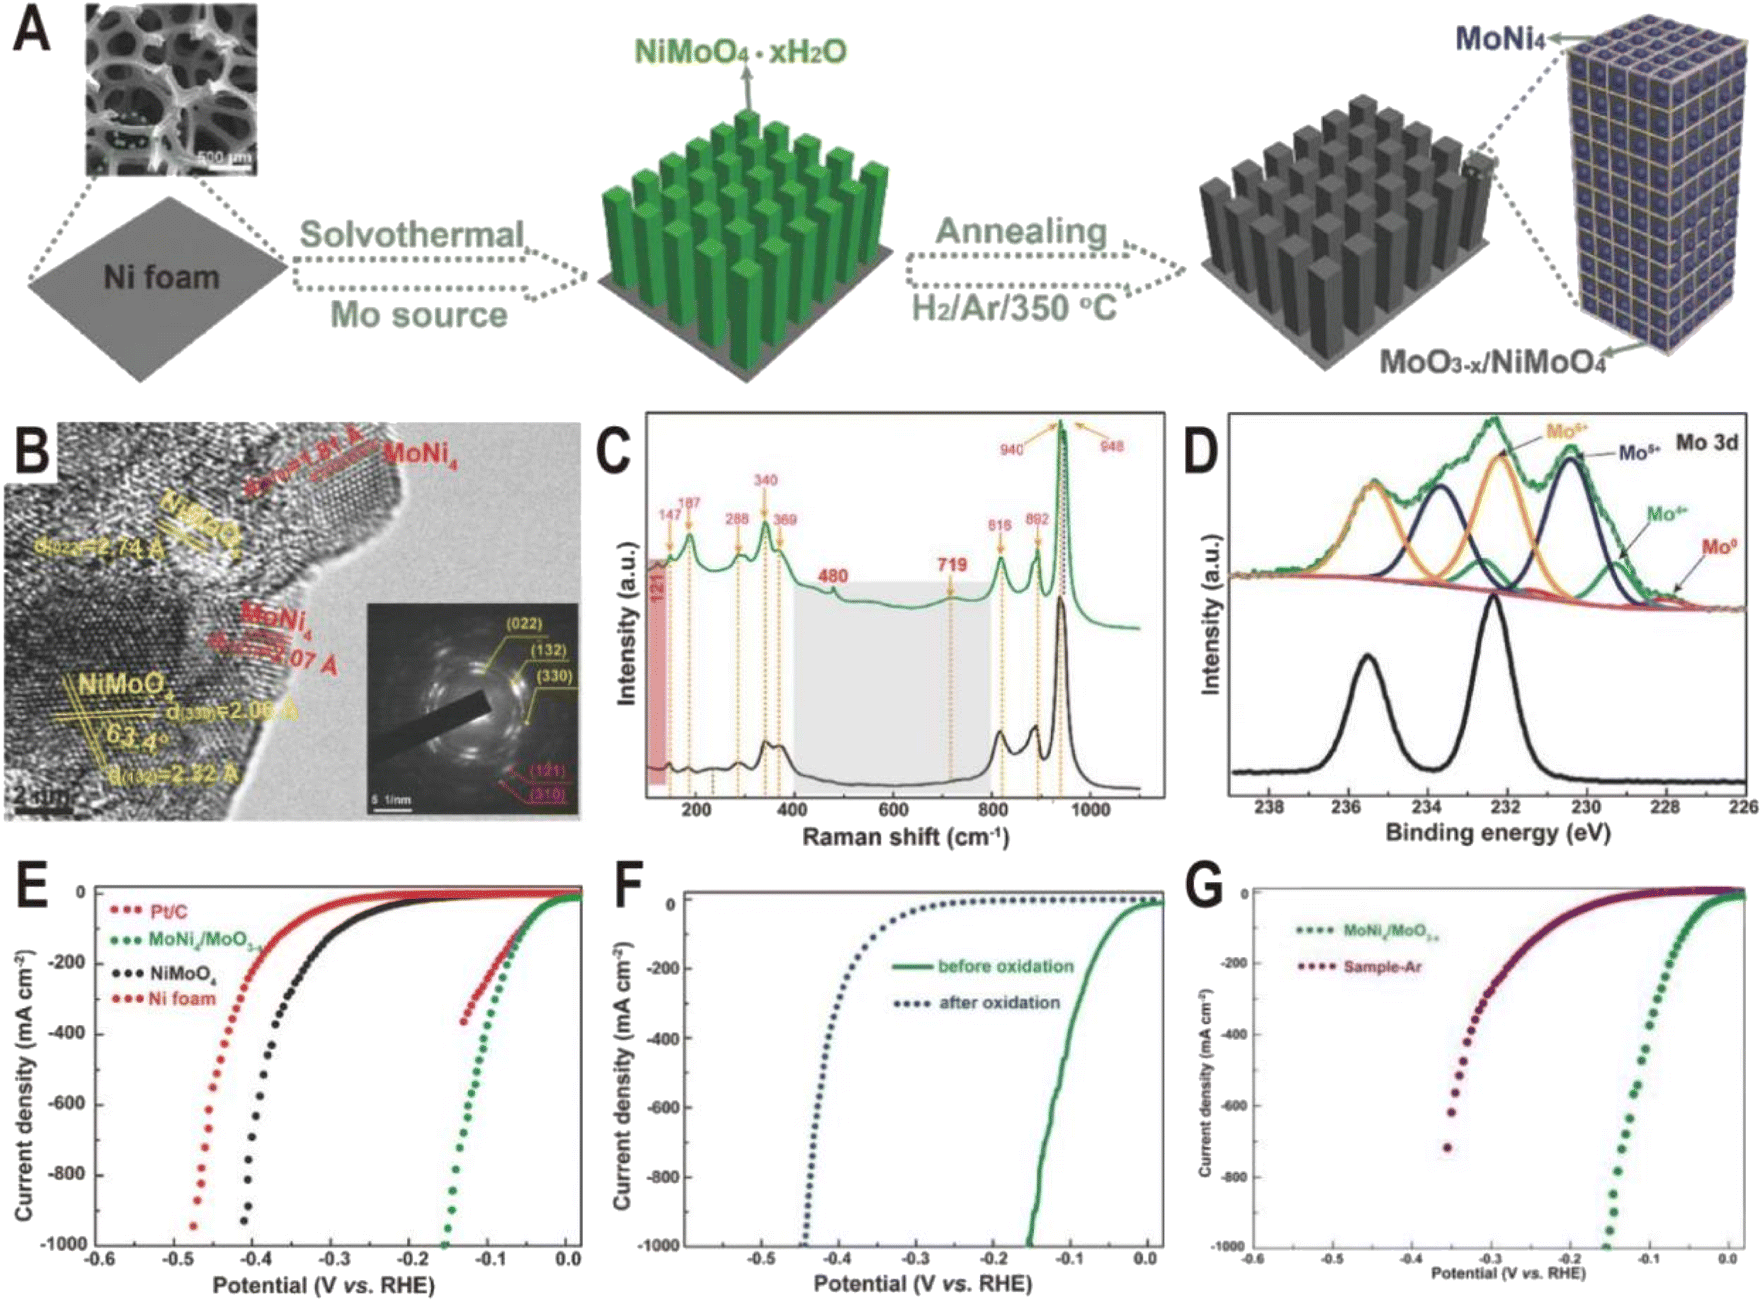 | ||
| Fig. 3 (A) Schematic illustration of the formation of MoNi4/MoO3−x nanorod arrays on Ni foam. (B) HRTEM image for MoNi4/MoO3−x (inset: SAED pattern). (C) Raman spectra of NiMoO4 (black) and MoNi4/MoO3−x (green). (D) Mo 3d XPS spectra of NiMoO4 (black) and MoNi4/MoO3−x (green). (E) Polarization curves for Pt/C, Ni foam, NiMoO4, and MoNi4/MoO3−x. (F) Polarization curves of MoNi4/MoO3−x for the HER before and after electrochemical oxidation. (G) Polarization curves of MoNi4/MoO3−x and NiMoO4 annealed in an Ar atmosphere (sample-Ar). Scan rate: 2 mV s−1. Reproduced with permission.52 Copyright 2017, Wiley-VCH. | ||
The Ni4Mo/MoOx interface structure of different components can be derived from the NiMoO4 intermediate by regulating the reduction temperature. The reduction temperature determines the reduction degree of Mo6+ ions in MoOx. For example, the Ni4Mo/MoO2 interface was obtained by reducing NiMoO4 cuboids in a H2/Ar atmosphere at 500 °C for 2 h.23 The NiMoO4 cuboids were grown beforehand on a piece of nickel foam via a hydrothermal reaction, and after reduction, MoNi4 nanoparticles were directly constructed on the surfaces of the MoO2 cuboids (Fig. 4A–C). The HRTEM images of the samples show lattice fringes with lattice distances of 0.35 and 0.28 nm, which correspond to the (110) facet of MoO2 and the (200) facet of MoNi4, respectively (Fig. 4D–F). The energy-dispersive X-ray spectroscopy (EDX) analysis indicates that the surface nanoparticles are constituted by only Mo and Ni with an atomic ratio of 1![[thin space (1/6-em)]](https://www.rsc.org/images/entities/char_2009.gif) :3.84 (Fig. 4G), which well approaches 1:4. The polarization curves (Fig. 4H) show a zero onset potential and the overpotentials at current densities of 10 and 200 mA cm−2 for the Ni4Mo/MoO2 electrocatalyst were as low as 15 and 44 mV, respectively, which are significantly lower than the values for the Ni nanosheets, MoO2 cuboids, and commercial Pt/C. For the Pt/C electrocatalyst, it exhibits an overpotential of only 10 mV at a current density of 10 mV cm−2, but the maximum current density only reaches 80 mA cm−2 due to the Pt catalyst significantly peeling off from the support. In contrast, the three-dimensional (3D) cuboid array grown in situ on Ni foam enables the current density of Ni4Mo/MoO2 to reach 600 mA cm−2. Therefore, in addition to intrinsic activity, the 3D structure of the catalyst is also critical to the activity. Based on the electrochemical double-layer capacitances, the TOF of MoNi4/MoO2 is calculated to be 0.4 s−1 at the overpotential of 50 mV, which is higher than the TOF values of the previously reported Pt-free electrocatalysts. In addition, it can be seen from the polarization curve that MoO2 cuboids have a certain HER activity, which is much higher than that of Ni nanosheets. Interestingly, the HER activity of MoO2 loaded on carbon paper in acidic and alkaline media is very close (Fig. 4I), which indicates that the additional water dissociation in alkaline media does not reduce the reaction rate, and the overall low activity indicates that the binding capacity of H on MoO2 surface is poor. The Ni4Mo alloy just makes up for this shortcoming, and the combination of the two produces complementary and synergistic effects. The highly active Ni4Mo/MoO2 interface has also been demonstrated on other substrates such as stainless-steel wires obtained from worn-out tires (the overpotentials at the current densities of 100 and 200 mA cm−2 were only 63 and 77 mV, respectively).57
:3.84 (Fig. 4G), which well approaches 1:4. The polarization curves (Fig. 4H) show a zero onset potential and the overpotentials at current densities of 10 and 200 mA cm−2 for the Ni4Mo/MoO2 electrocatalyst were as low as 15 and 44 mV, respectively, which are significantly lower than the values for the Ni nanosheets, MoO2 cuboids, and commercial Pt/C. For the Pt/C electrocatalyst, it exhibits an overpotential of only 10 mV at a current density of 10 mV cm−2, but the maximum current density only reaches 80 mA cm−2 due to the Pt catalyst significantly peeling off from the support. In contrast, the three-dimensional (3D) cuboid array grown in situ on Ni foam enables the current density of Ni4Mo/MoO2 to reach 600 mA cm−2. Therefore, in addition to intrinsic activity, the 3D structure of the catalyst is also critical to the activity. Based on the electrochemical double-layer capacitances, the TOF of MoNi4/MoO2 is calculated to be 0.4 s−1 at the overpotential of 50 mV, which is higher than the TOF values of the previously reported Pt-free electrocatalysts. In addition, it can be seen from the polarization curve that MoO2 cuboids have a certain HER activity, which is much higher than that of Ni nanosheets. Interestingly, the HER activity of MoO2 loaded on carbon paper in acidic and alkaline media is very close (Fig. 4I), which indicates that the additional water dissociation in alkaline media does not reduce the reaction rate, and the overall low activity indicates that the binding capacity of H on MoO2 surface is poor. The Ni4Mo alloy just makes up for this shortcoming, and the combination of the two produces complementary and synergistic effects. The highly active Ni4Mo/MoO2 interface has also been demonstrated on other substrates such as stainless-steel wires obtained from worn-out tires (the overpotentials at the current densities of 100 and 200 mA cm−2 were only 63 and 77 mV, respectively).57
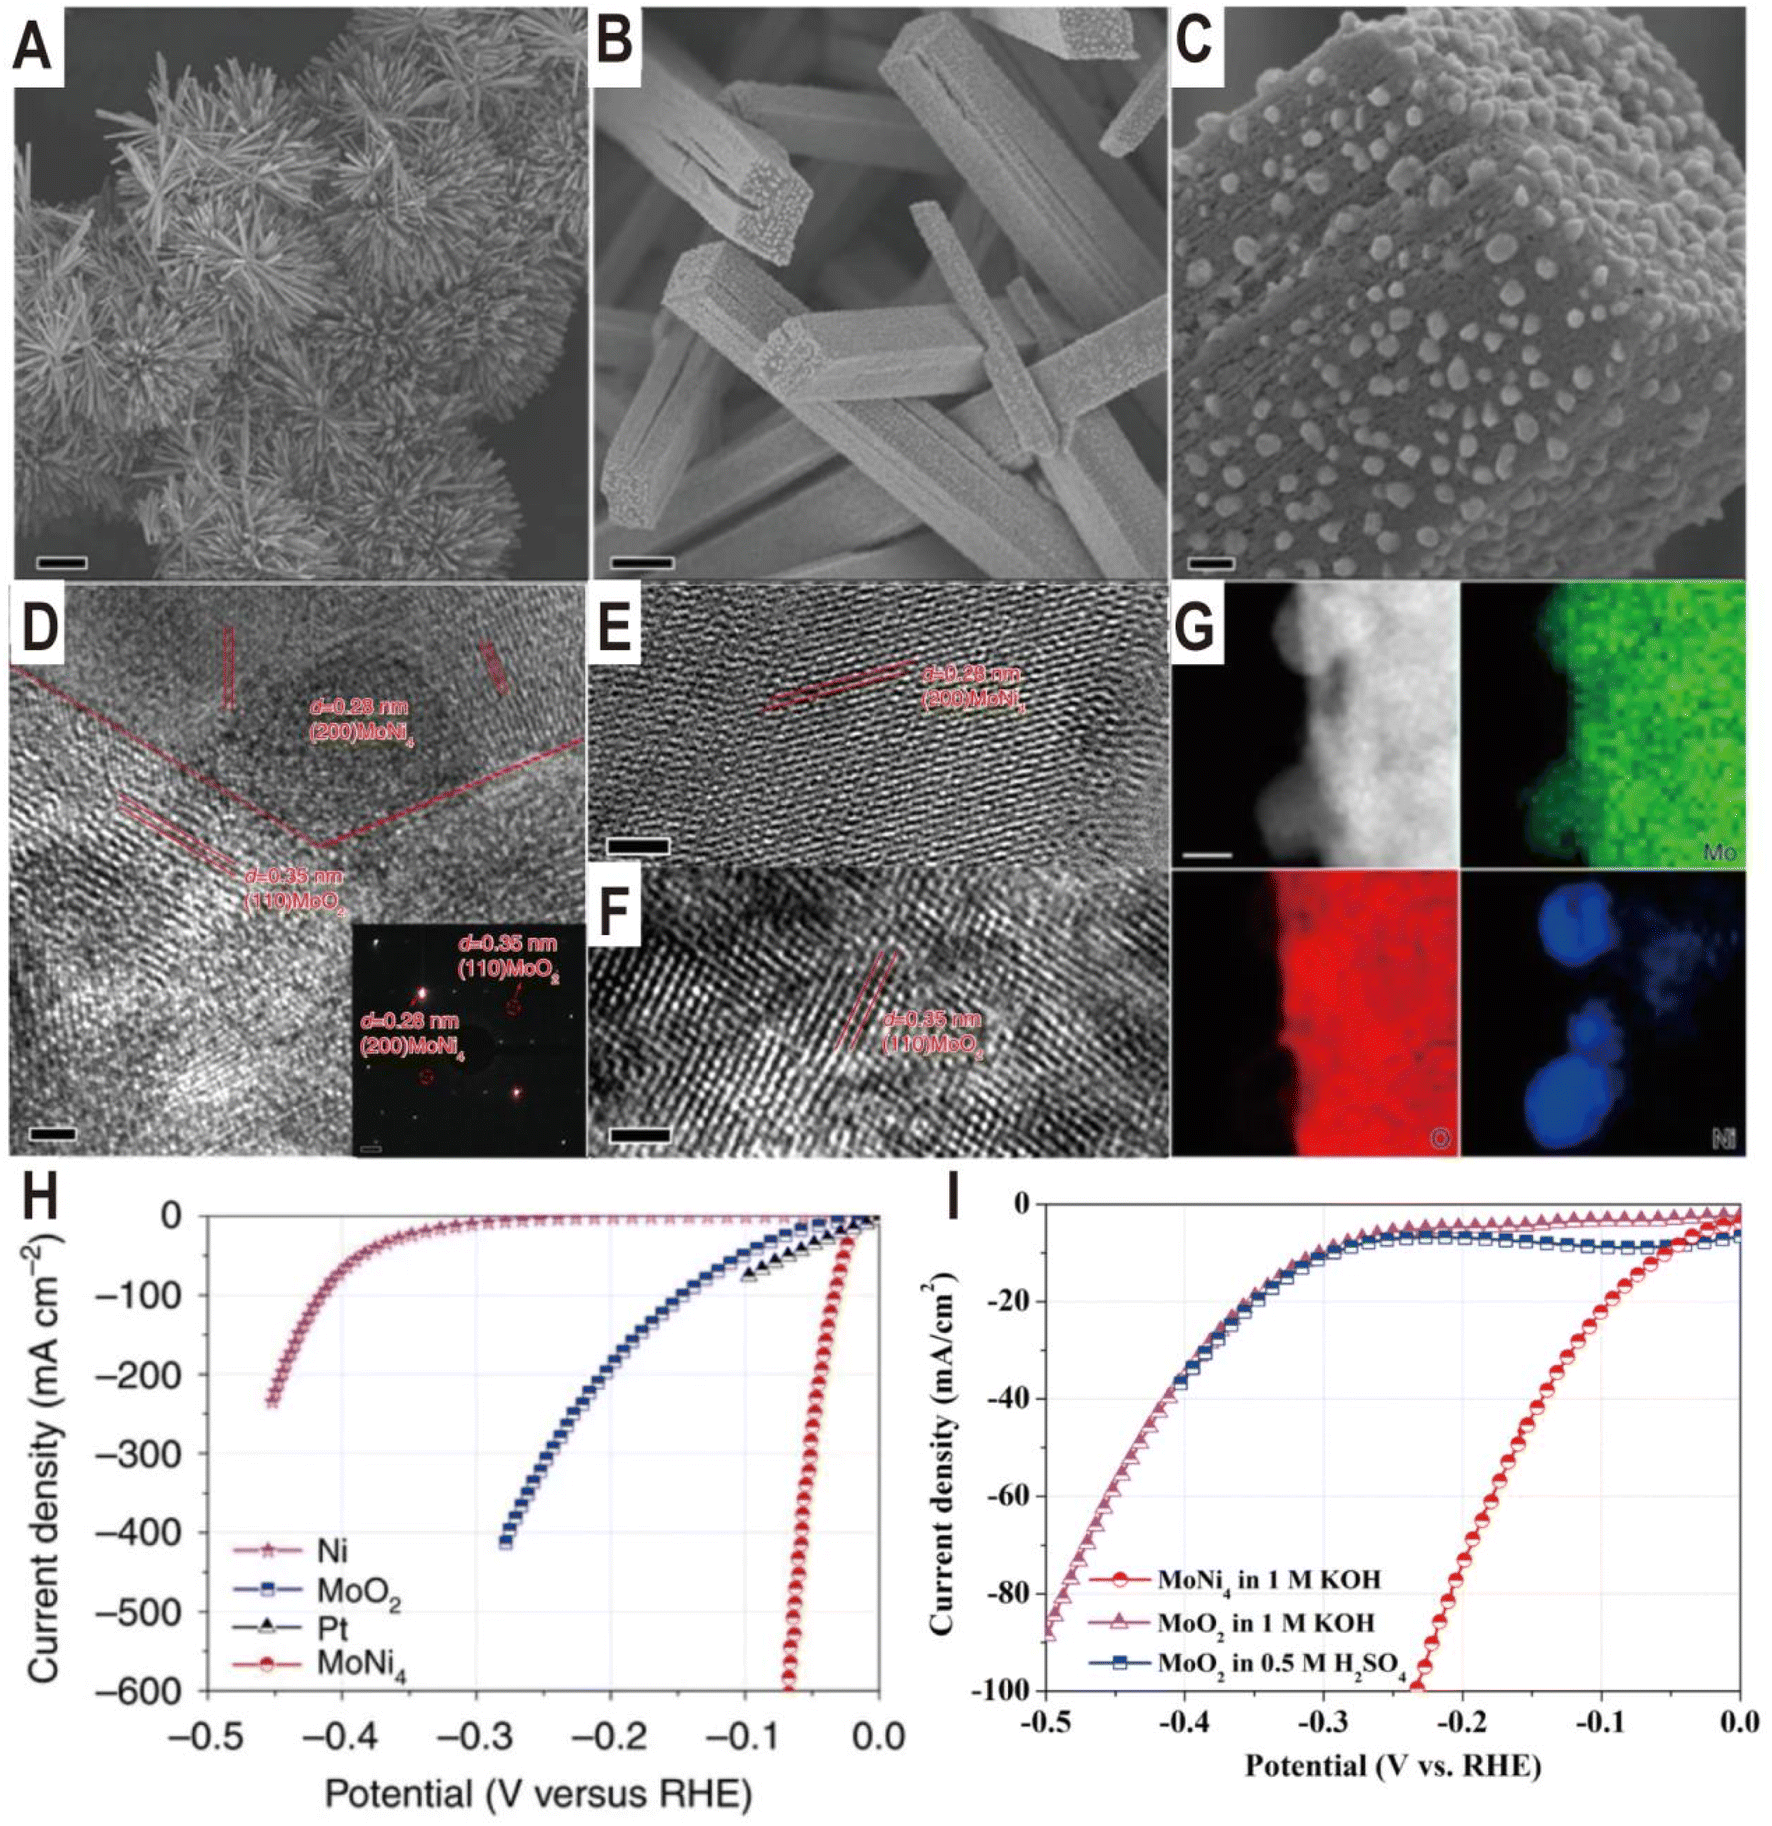 | ||
| Fig. 4 (A–C) Typical SEM images of MoNi4/MoO2@Ni. Scale bars, (A) 20 μm; (B) 1 μm; (C) 100 nm. (D–F) HRTEM images of MoNi4/MoO2@Ni. The inset image in (D) is the related selected-area electron diffraction pattern of the MoNi4 electrocatalyst and the MoO2 cuboids. Scale bars, (D–F) 2 nm; inset in (D), 1 1/nm. (G) Corresponding elemental mapping images of the MoNi4 electrocatalyst and the MoO2 cuboids. Scale bars: 20 nm. (H) Polarization curves of the MoNi4 electrocatalyst supported by the MoO2 cuboids, pure Ni nanosheets, and MoO2 cuboids on nickel foam. (I) Polarization curves of the MoO2 nanosheets and the MoNi4 electrocatalyst supported by the MoO2 cuboids on carbon cloth in different electrolytes. Reproduced with permission.23 Copyright 2017, Springer Nature. | ||
The Ni4Mo/MoOx active interface can be generated not only by controlling the synthesis conditions but also in the electrochemical activation process. Typically, it is demonstrated that some Mo in Ni4Mo is oxidized during the activation process and dissolved in the form of MoO42−.58 Then, the dissolved MoO42− will re-adsorb on the alloy surface and polymerize into the dimer Mo2O72− to form a highly active Ni4Mo (or Ni)/Mo2O72− interface. Fig. 5A and B show the SEM images of the as-prepared Ni4Mo nanorod arrays before and after the HER test. After the electrochemical activation, the nanorod array structure is nearly unchanged, except for the roughened surface and increased porosity. As shown in the polarization curves of Fig. 5C, the activated Ni4Mo displays an extremely low overpotential of only 86 mV at 100 mA cm−2, which is much better than that of commercial 20% Pt/C with the same mass loading. By analyzing the content of Mo and Ni in the electrolyte, it is found that the content of Ni keeps at a low level throughout the activation process while the content of Mo increases with time and reaches the summit after 4 h (Fig. 5D). The Mo 3d XPS spectra (Fig. 5E) show that the peaks of Mo0 obviously decrease after the HER test, while the peaks of Mo4+, Mo5+, and Mo6+ notably increase, indicating the oxidation of Mo. Similarly, in the Ni 2p XPS spectra (Fig. 5F), the ratio of Ni2+ also increases. X-ray absorption near edge structure (XANES) is further employed to investigate the change of valence state of Mo and Ni. In the Mo K-edge spectra (Fig. 5G), the post-HER absorption edge is obviously larger than that of the initial one, confirming the oxidation of Mo, while for the Ni K-edge spectra (Fig. 5H), both the initial and the post-HER samples show a similar absorption edge to Ni foil, indicating that Ni is mainly zero valent in the reaction process. In situ Raman spectra are then used to explore the change of Mo species during HER activation (Fig. 5I). Initially, there is no Raman signal, and after applying a voltage of 0.23 V, a peak centered at 894 cm−1 first appears, which can be assigned to MoO symmetric stretching vibration in the MoO4 tetrahedron, indicating the production of MoO42− ions. Interestingly, with the potential decreasing, another two peaks at 265 and 476 cm−1 arise and become strong, both of which correspond to the deformation mode and symmetric stretching mode of Mo–O–Mo, respectively. The appearance of these two new peaks indicates the possible polymerization of MoO42− into the dimer of Mo2O72−. The DFT calculations further demonstrate that the Ni (Ni4Mo)/Mo2O72− interface optimizes the bonding energy with the adsorbed hydrogen (Fig. 5J).
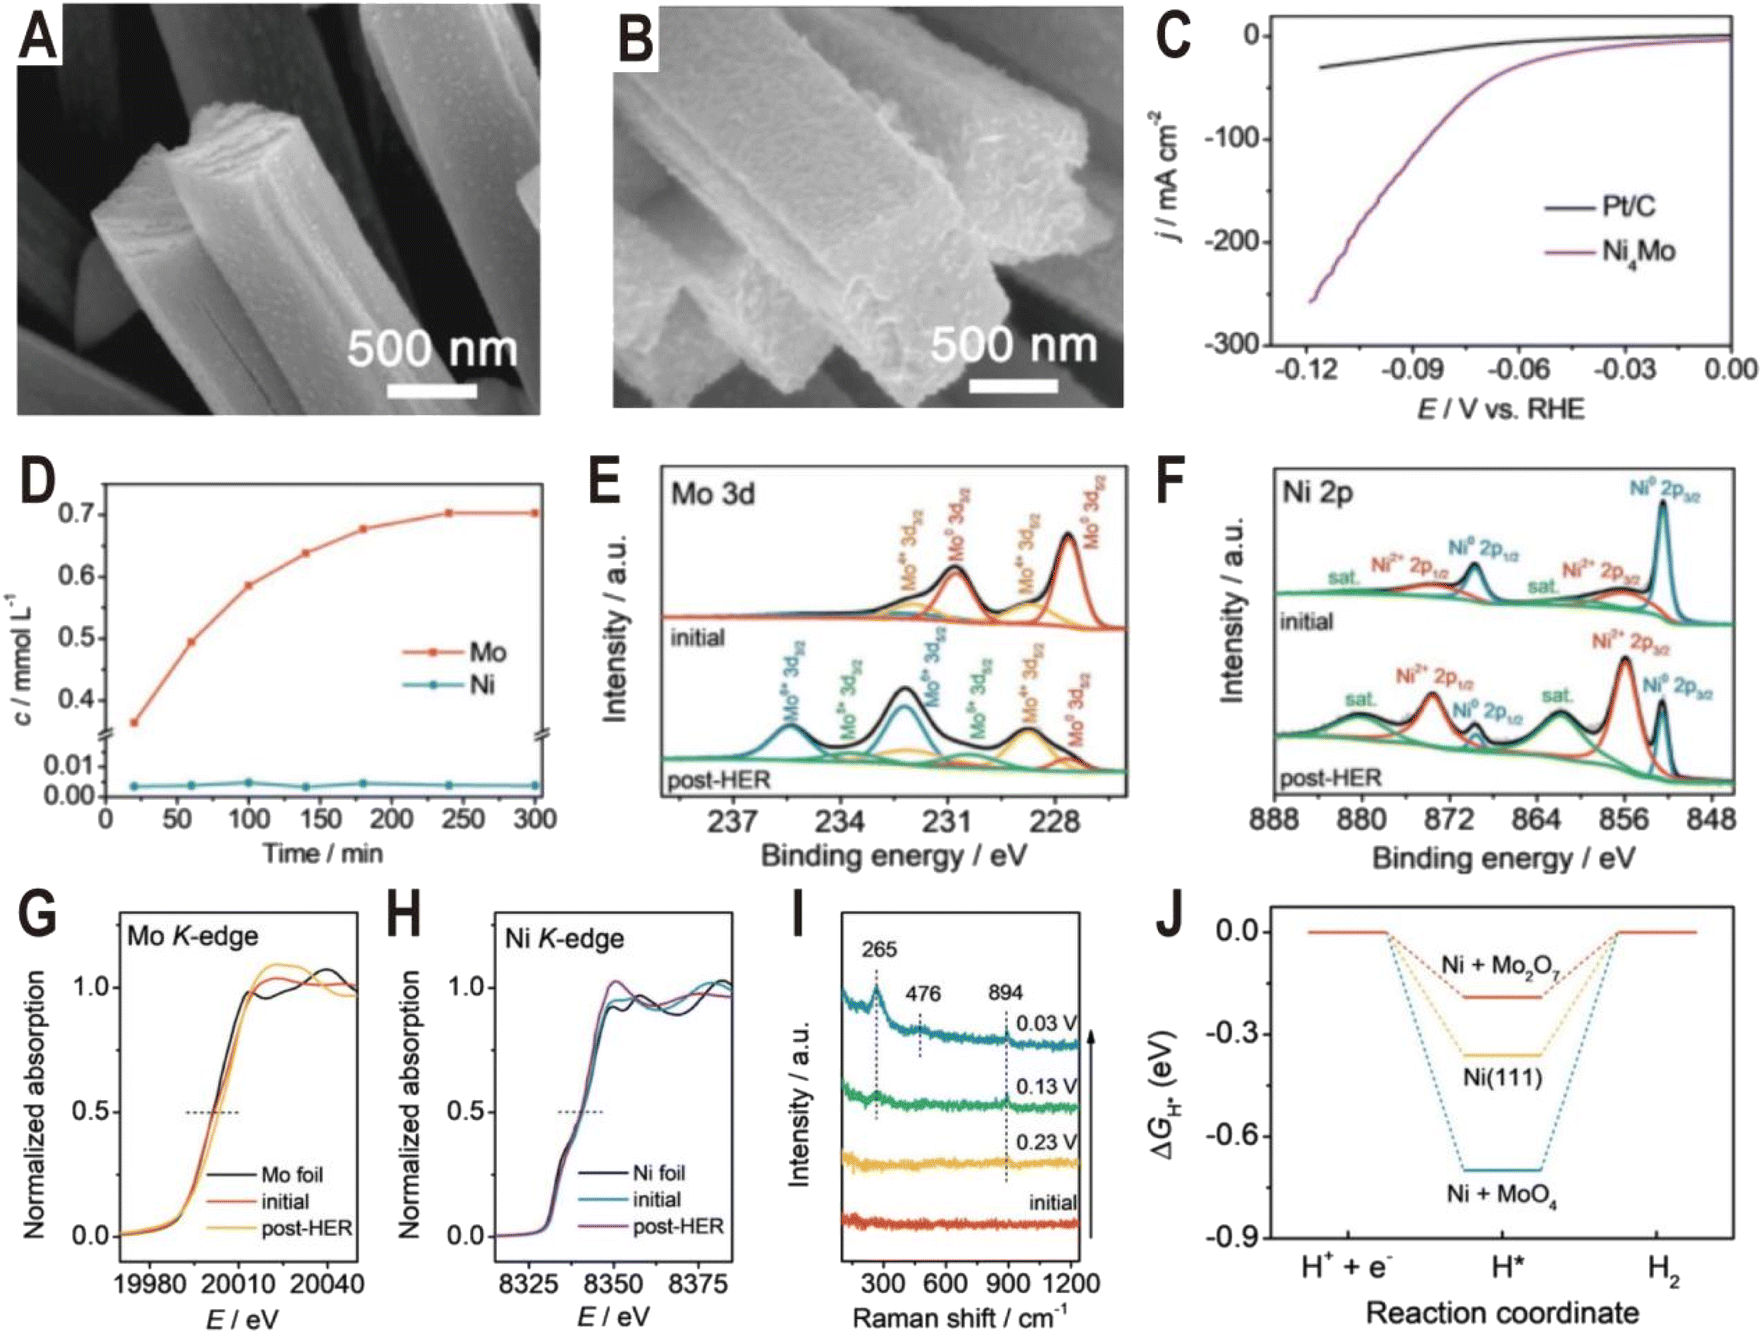 | ||
| Fig. 5 SEM images of the (A) as-prepared Ni4Mo nanorod arrays and (B) Ni4Mo nanorod arrays after the HER test for 12 h. (C) Polarization curves of the Ni4Mo alloy and Pt/C. (D) Time-dependent concentration of dissolved Mo and Ni in the electrolyte of the Ni4Mo alloy. (E) Mo 3d and (F) Ni 2p XPS spectra of Ni4Mo before and after the HER test. (G) Mo K-edge and (H) Ni K-edge XANES spectra of Ni4Mo before and after the HER test. (I) Potential-dependent in situ Raman spectra of Ni4Mo during the alkaline HER process. (J) Free energy diagrams of the HER on bare Ni(111), Ni(111) + MoO4, and Ni(111) + Mo2O7. Reproduced with permission.58 Copyright 2021, Wiley-VCH. | ||
3. NixMoy alloy/hydroxide interfaces
Except oxides, metal hydroxides such as Ni(OH)2 and Co(OH)2 are another kind of active component to promote the dissociation of water for the HER. For example, the Ni(OH)2 modified Mo0.84Ni0.16 alloy exhibited significantly enhanced activity for the HER compared to the unmodified alloy.59 The synthesis process of Mo0.84Ni0.16@Ni(OH)2 hybrids is illustrated in Fig. 6A. First the NiMoO4 nanowire precursors were grown on Ni foam by a facile hydrothermal process and then were calcined in a H2/Ar atmosphere to obtain the NiMoO4–Mo0.84Ni0.16 composites. Subsequently, the Ni(OH)2 nanosheets were modified on the surface of the composites by electrodeposition. As a result, the Mo0.84Ni0.16 alloy and Ni(OH)2 nanosheets formed a heterostructure (Mo0.84Ni0.16@Ni(OH)2). The HRTEM image of the interface (Fig. 6B) demonstrates the lattice distance of 0.27, 0.23, 0.20, and 0.34 nm, which corresponds to the (100), (101), (240), and (040) planes of Ni(OH)2, respectively, and the crystalline lattice distance of 0.24 nm and 0.28 nm corresponds to the (111) plane of Mo0.84Ni0.16 and (−111) plane of NiMoO4, respectively. In the O 1s XPS spectra (Fig. 6C), the intensity of the OH− peak becomes strong in Mo0.84Ni0.16@Ni(OH)2 compared to NiMoO4–Mo0.84Ni0.16 and both O 1s peaks also exhibit a positive shift, suggesting the strong electronic interaction between Mo0.84Ni0.16 and Ni(OH)2. As expected, due to the abundant interface structure and synergistic effect between Mo0.84Ni0.16 and Ni(OH)2, the Mo0.84Ni0.16@Ni(OH)2 heterostructure exhibited high HER activity with a very small overpotential at 10 mA cm−2 (10 mV), low Tafel slope (71 mV dec−1), and excellent stability (100 h) (Fig. 6D–F), which is much better than that of unmodified NiMoO4–Mo0.84Ni0.16. After the 100 h stability test, the SEM image of Mo0.84Ni0.16@Ni(OH)2 (the inset of Fig. 6F) displays the consistent surface morphology with the original Mo0.84Ni0.16@Ni(OH)2. Another more complex heterostructure is composed of Ni4Mo, Ni3N, Ni, and Ni(OH)2 (Fig. 6G and H), which was synthesized by low-temperature H2/N2 plasma activation of Mo-doped Ni(OH)2 nanosheets arrays (P–Mo–Ni(OH)2 NSAs).60 Due to the synergistic effect of different components, especially the interaction between Ni4Mo and Ni(OH)2, the optimized heterostructure only needs a low overpotential of 22 and 98 mV to deliver a current density of 10 and 100 mA cm−2 (Fig. 6I), respectively. At an overpotential of 50 mV, the TOF value of P–Mo–Ni(OH)2 is 1.325 s−1, which is much larger than that of Ni (OH)2 (0.42 s−1). After the 100 h stability test at an overpotential of 22 mV, the HRTEM image, XRD pattern, and XPS spectra imply that metallic Ni, Ni4Mo alloy, Ni3N, and Mo incorporated Ni(OH)2 still exist. Moreover, it is found that the Mo concentration in the electrolyte first increases from 0 to 1.13 ppm and then remains relatively stable, and except for the dissolution of a certain amount of Mo and N and the oxidation of some amount of metallic Ni, the chemical composition and valence states of the P–Mo–Ni(OH)2 change little during the HER. Theoretical and experimental studies show that the metallic Ni4Mo optimizes the Gibbs free energy for hydrogen adsorption and Ni(OH)2 can weaken the HO–H bond of absorbed water to facilitate water dissociation in the hetero-interface of Ni4Mo/Ni(OH)2.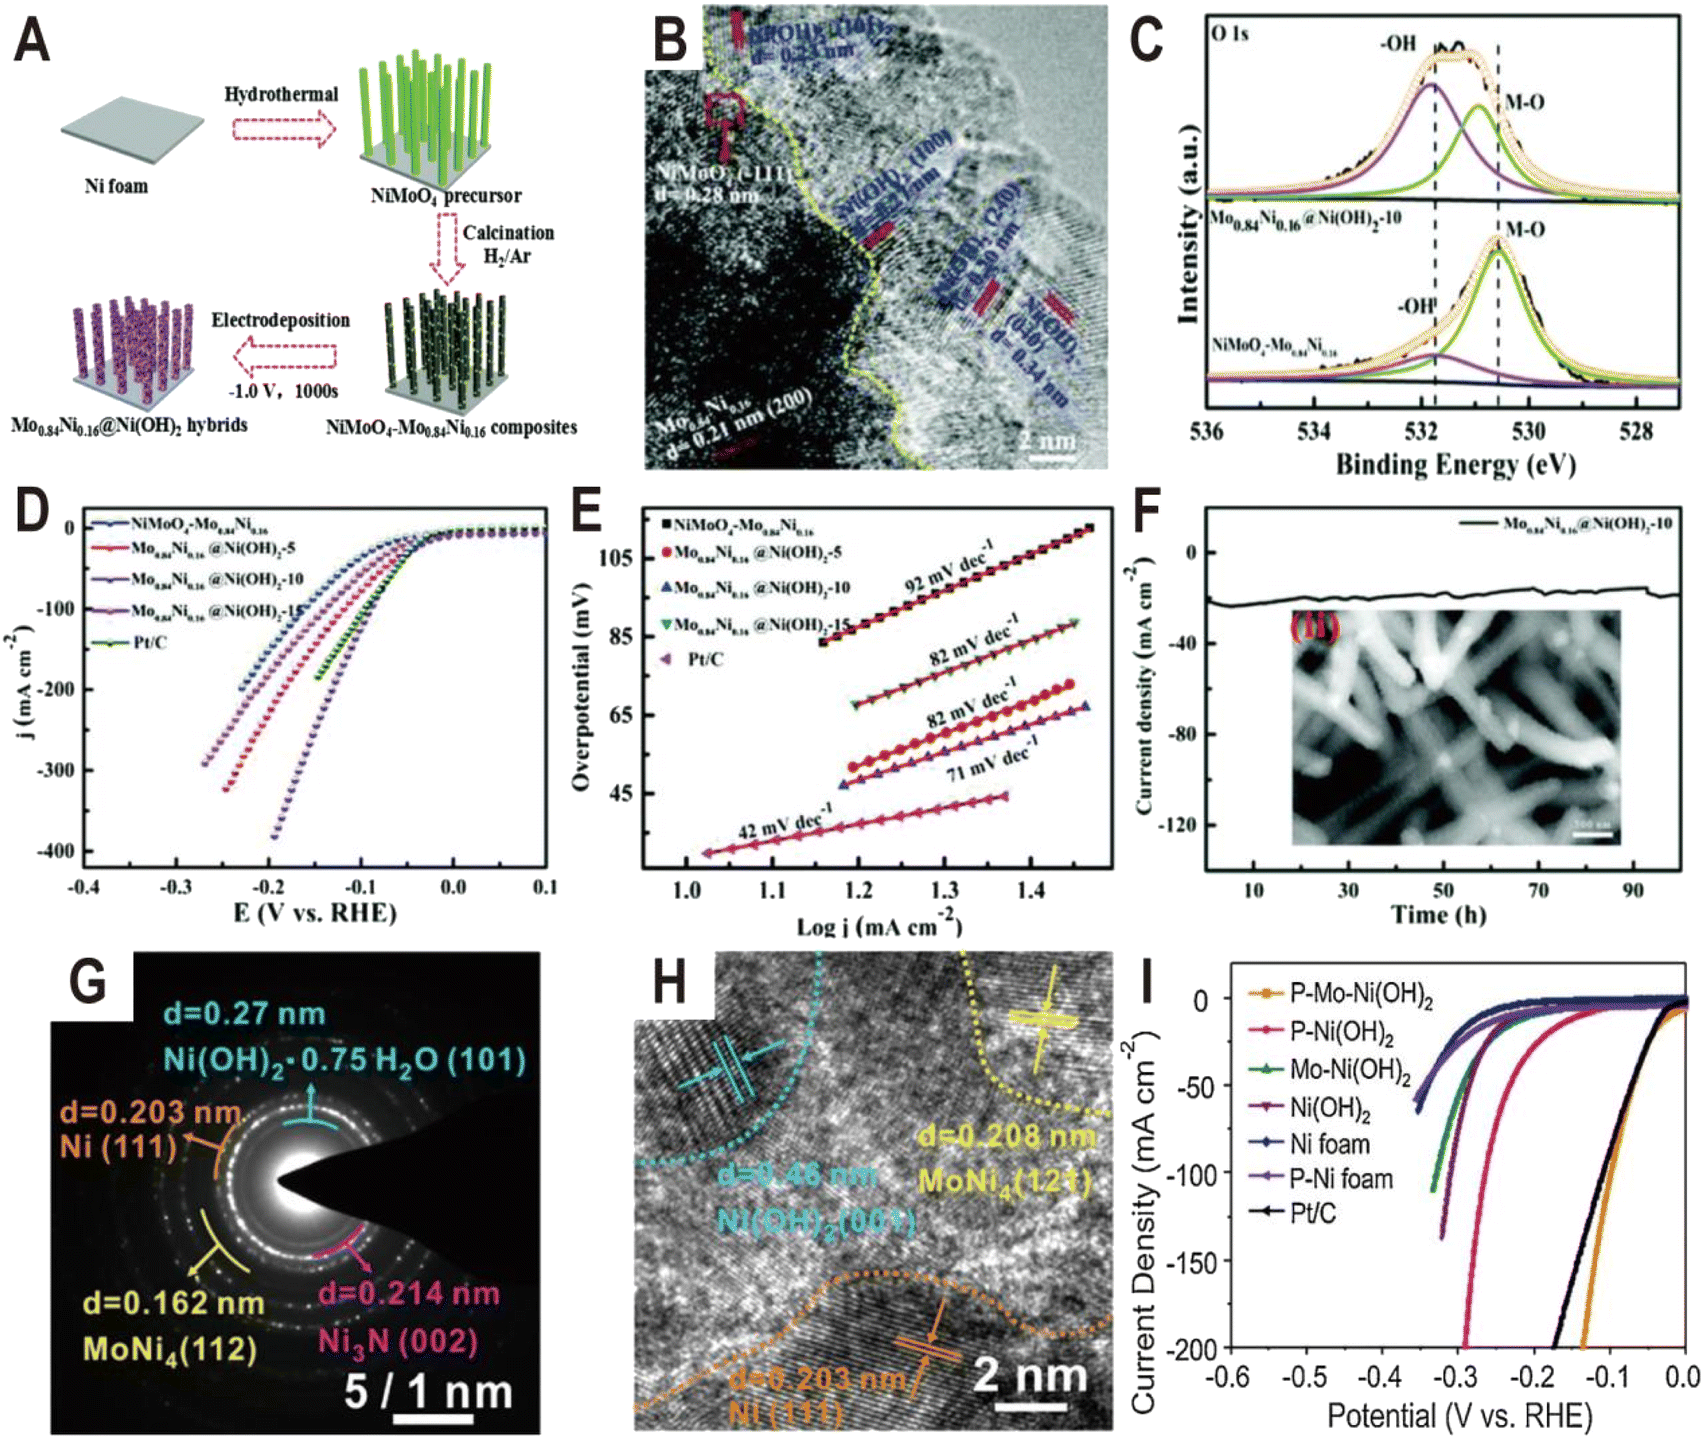 | ||
| Fig. 6 (A) Schematic illustration of the preparation of the Mo0.84Ni0.16@Ni(OH)2 heterostructure. (B) HRTEM image of Mo0.84Ni0.16@Ni(OH)2. (C) The high-resolution XPS spectra of O 1s for NiMoO4–Mo0.84Ni0.16 composites and the Mo0.84Ni0.16@Ni(OH)2 heterostructure. (D and E) Polarization curves and the corresponding Tafel plots of NiMoO4–Mo0.84Ni0.16, and Mo0.84Ni0.16@Ni(OH)2 with different deposition times of 5, 10, and 15 min, and Pt/C. (F) The chronoamperometric curve at an overpotential of 34 mV for Mo0.84Ni0.16@Ni(OH)2. The inset is the SEM image after the stability test. Reproduced with permission.59 Copyright 2020, Royal Society of Chemistry. (G and H) SAED pattern and HRTEM image of P–Mo–Ni(OH)2 NSAs. (I) Polarization curves of Ni foam, P–Ni foam, Ni(OH)2 NSAs, Mo–Ni(OH)2 NSAs, P–Ni(OH)2 NSAs, P–Mo–Ni(OH)2 NSAs, and Pt/C. Reproduced with permission.60 Copyright 2020, Elsevier. | ||
Ni(OH)2 on the NiMo alloy surface can not only be modified additionally but also be produced in situ by introducing Fe ions. It has been demonstrated that the presence of Fe on the surface of the Ni4Mo alloy can induce the conversion of the Ni to Ni(OH)2 by forming the Fe–(OH)4–Ni4 motif.50 This catalyst is composed of hydroxide-mediated Ni4Mo nanoparticles decorated with FeOx and anchored onto MoO2 nanosheets (h-NiMoFe). It was prepared by a two-step method: Fe-doped NiMoO4 microsphere precursors (Fe–NiMoO4) were first grown on Ni foam by the hydrothermal method and then reduced at 500 °C in a Ar/H2 atmosphere. The TEM image (Fig. 7A) shows that the catalyst is composed of ultrathin nanosheets with nanoparticles anchored onto them and the HRTEM images (Fig. 7B and C) show typical lattice spacings of 0.24 nm and 0.20 nm, corresponding to the (020) plane of MoO2 and the (220) plane of Ni4Mo, respectively, and no Fe-based compounds are detected. The polarization curves in Fig. 7D show that the activity of h-NiMoFe is much better than that of NiMo and Ni samples, indicating that alloying of Ni4Mo and addition of Fe play vital roles in the good performance of the h-NiMoFe catalyst. The overpotential of h-NiMoFe at 10 mA cm−2 is only 14 mV and even at an increased current density of 1000 mA cm−2, the overpotential is still very low (98 mV). After 40 h continuous operation, h-NiMoFe shows good stability and maintains its crystalline structure well. In the Ni 3s XPS spectra, it is found that there is a higher content of surface hydroxide on h-NiMoFe than those on the control NiMo and Ni samples due to the introduction of Fe (Fig. 7E). In situ XAS characterization results indicate that a new chemical species containing the Fe–O(H)–Ni motif forms and FT-EXAFS fitting results show that an iron site is coordinated by four O atoms (or OH groups) and four Ni atoms. Density functional theory (DFT) calculations confirm the local structure of one Fe connecting to four hydroxylated Ni sites on the Ni4Mo surface (denoted as Fe–(OH)4–Ni4, Fig. 7F and G). The added iron in h-NiMoFe extracts electrons from Ni atoms to lead to more unoccupied states of Ni sites, which remarkably changes the charge distribution of Ni sites. The comparison of PDOS shows that the d-band centers of Ni in h-NiMoFe exhibit more negative energy than the NiMo catalyst, indicating a stronger H bonding behavior. The energy diagrams of Gibbs free energies further show nearly 0 eV adsorption free energy of H (ΔGH) and a much lower energy barrier and fast kinetics for water dissociation for h-NiMoFe compared to Pt (Fig. 7H and I). In addition to Ni(OH)2, this system also contains MoO2, which can also promote water dissociation as discussed above, so this system may be a catalytic system with synergistic effects of two interfaces: Ni4Mo/Ni(OH)2 and Ni4Mo/MoO2.
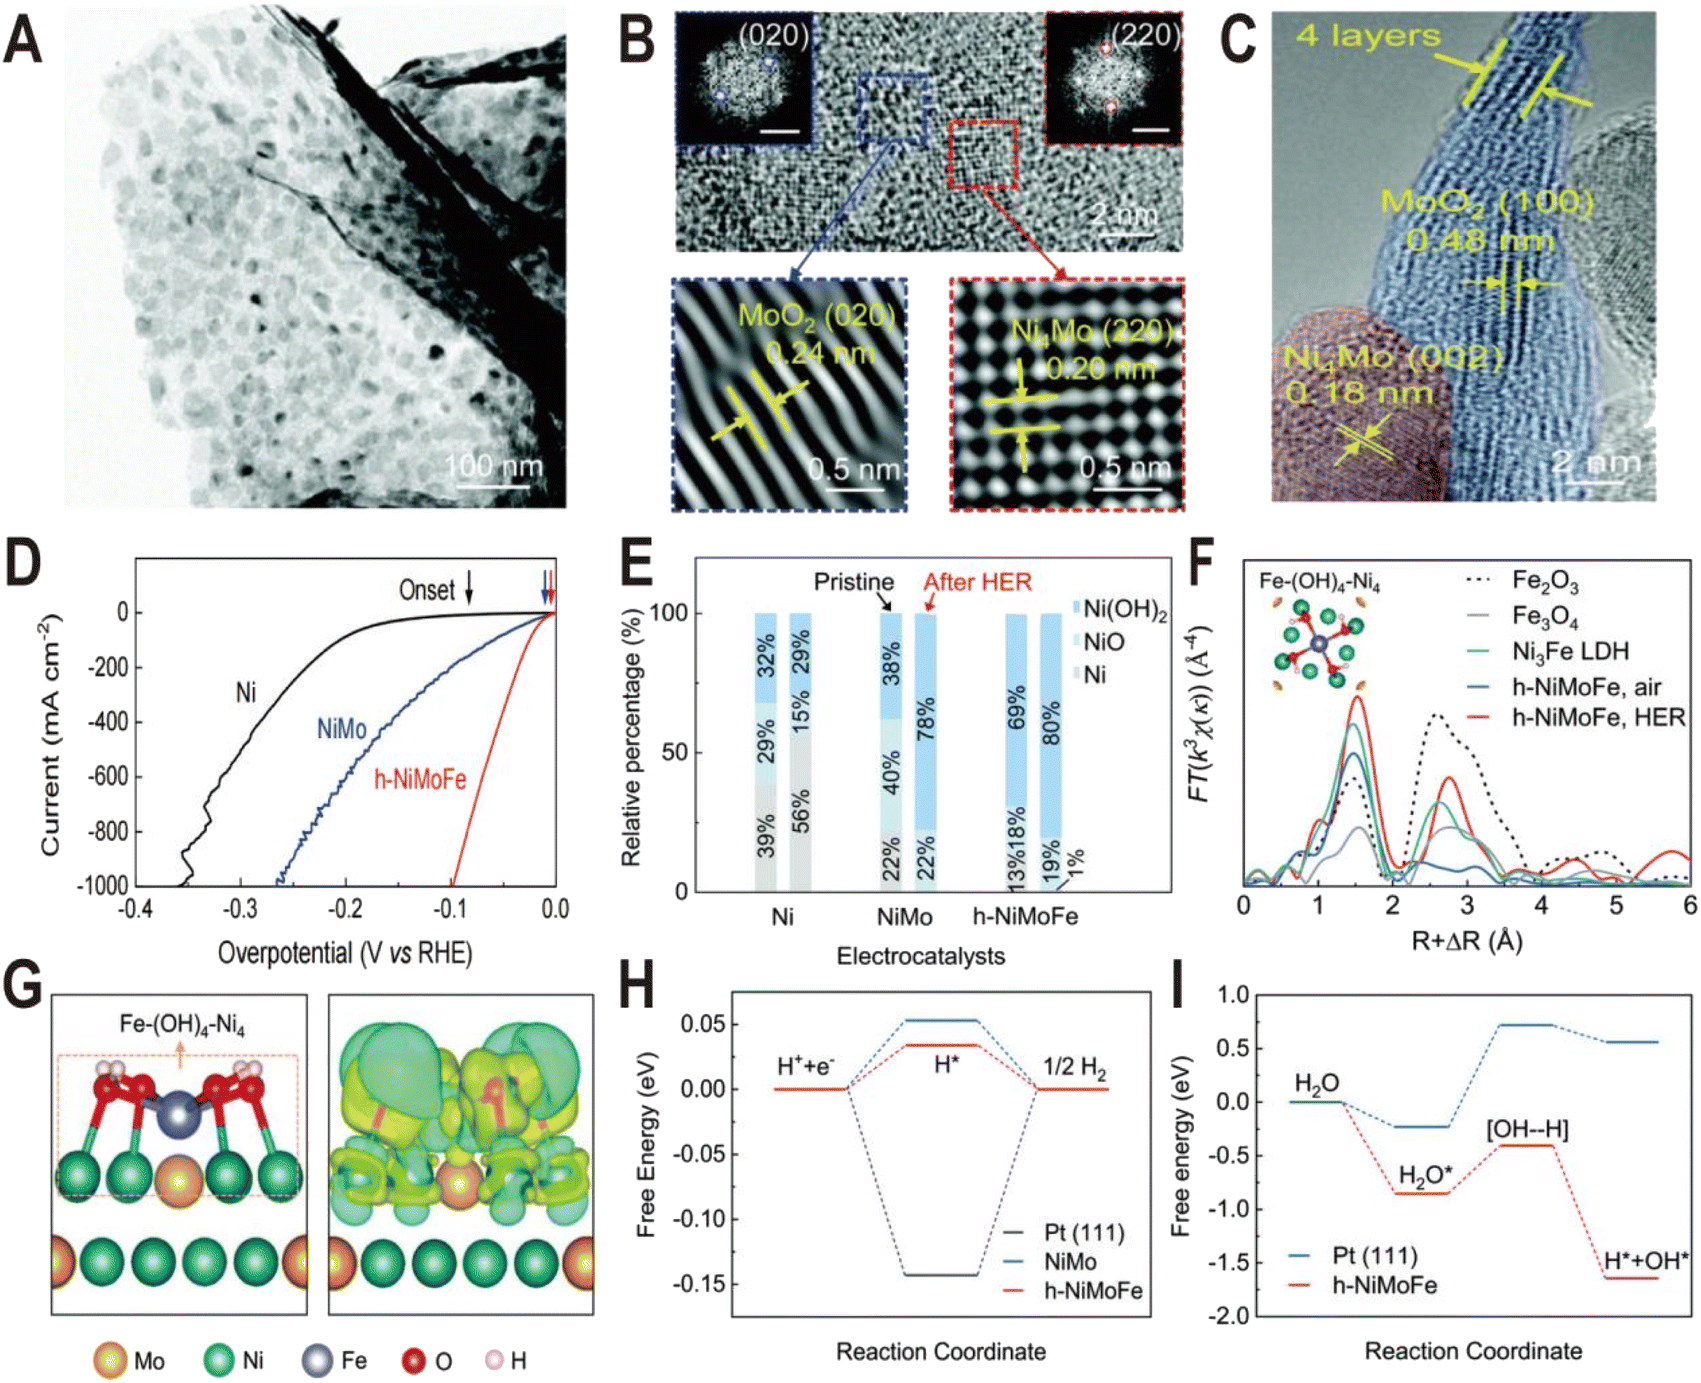 | ||
| Fig. 7 (A) TEM image of the h-NiMoFe catalyst. (B and C) HRTEM images of h-NiMoFe. (B) An enlarged view of h-NiMoFe, lattice fringes of a MoO2 nanosheet (blue box) and Ni4Mo nanoparticles (red box), scale bars in the insets are 5 1/nm; (C) side view of the MoO2 nanosheet. (D) Polarization curves of h-NiMoFe and its control samples. (E) Relative percentages of surface Ni species from the Ni 3s XPS spectra on the Ni, NiMo, and h-NiMoFe samples before and after the HER test. (F) FT-EXAFS of the h-NiMoFe catalyst and control samples at Fe K-edges. (G) Calculated relaxed configuration of an Fe–(OH)4–Ni4 motif on a Ni4Mo (002) slab and the corresponding charge density difference in this configuration. (H and I) Adsorption energies for H and dissociated H2O on h-NiMoFe and control samples. Reproduced with permission.50 Copyright 2021, Royal Society of Chemistry. | ||
Similar to Ni(OH)2, Co(OH)2 is also used to modify the NiMo alloy to improve the HER performance. The Co(OH)2 cavity array-encapsulated NiMo alloy on carbon cloth (Co(OH)2/NiMo CA@CC) was prepared by a two-step electrodeposition route.61 As shown in Fig. 8A, the NiMo alloy was first deposited on carbon cloth by chronopotentiometry (defined as NiMo@CC). And then, with the assistance of a layer of polystyrene (PS) template, Co(OH)2 was confined to nucleate and grow around the PS microspheres by the second electrodeposition. After dissolving the PS template, the uniform and ordered Co(OH)2 cavity array was obtained on the surface of NiMo@CC (defined as Co(OH)2/NiMo CA@CC). The NiMo alloy is composed of uniform nanoparticles with an average size of ∼70 nm and these nanoparticles are connected to the Co(OH)2 thin nanosheets. The HRTEM image at the boundary shows lattice fringes with a distance of 0.21 and 0.25 nm (Fig. 8B), corresponding to the (111) plane of Ni metal and the (100) plane of α-Co(OH)2, respectively, suggesting that metallic Ni as the dominant phase exists in the NixMoy alloy and forms a heterojunction interface with Co(OH)2. From the XPS spectra (Fig. 8C–E), it is found that both the Ni 2p peaks and Mo 3d peaks in Co(OH)2/NiMo CA@CC are shifted by 0.4 and 0.5 eV toward the lower binding energy relative to those of NiMo@CC, respectively, while the characteristic peaks of Co 2p are shifted toward high binding energy by 0.8 eV (Fig. 8E), indicating the transfer of electrons from Co of Co(OH)2 to the surface of the NiMo alloy. The HER polarization curves (Fig. 8F) show that Co(OH)2/NiMo CA@CC exhibits the highest catalytic activity among NiMo@CC, Co(OH)2@CC, and NiMo/Co(OH)2@CC with an overpotential of 30 mV to reach 10 mA cm−2. The comparative experiments demonstrate that the coupling of NiMo with Co(OH)2 and the cavity array structure can effectively boost the HER activity. The Gibbs free energy diagram (Fig. 8G) shows that water is more easily adsorbed on Co(OH)2 than on NiMo alloy, and the energy barrier to break the H–OH bond is only 0.58 eV on Co(OH)2, which is much lower than that of the NiMo alloy (up to 1.04 eV), indicating that the introduction of Co(OH)2 substantially accelerates the kinetics of the water adsorption and dissociation steps. Moreover, from the PDOS of d orbitals (Fig. 8H), the d-band center of Co(OH)2/NiMo (−1.80 eV) is downshifted relative to the single NiMo (−1.58 eV), which can weaken the bonding strength of H and thus promote the H2 evolution.
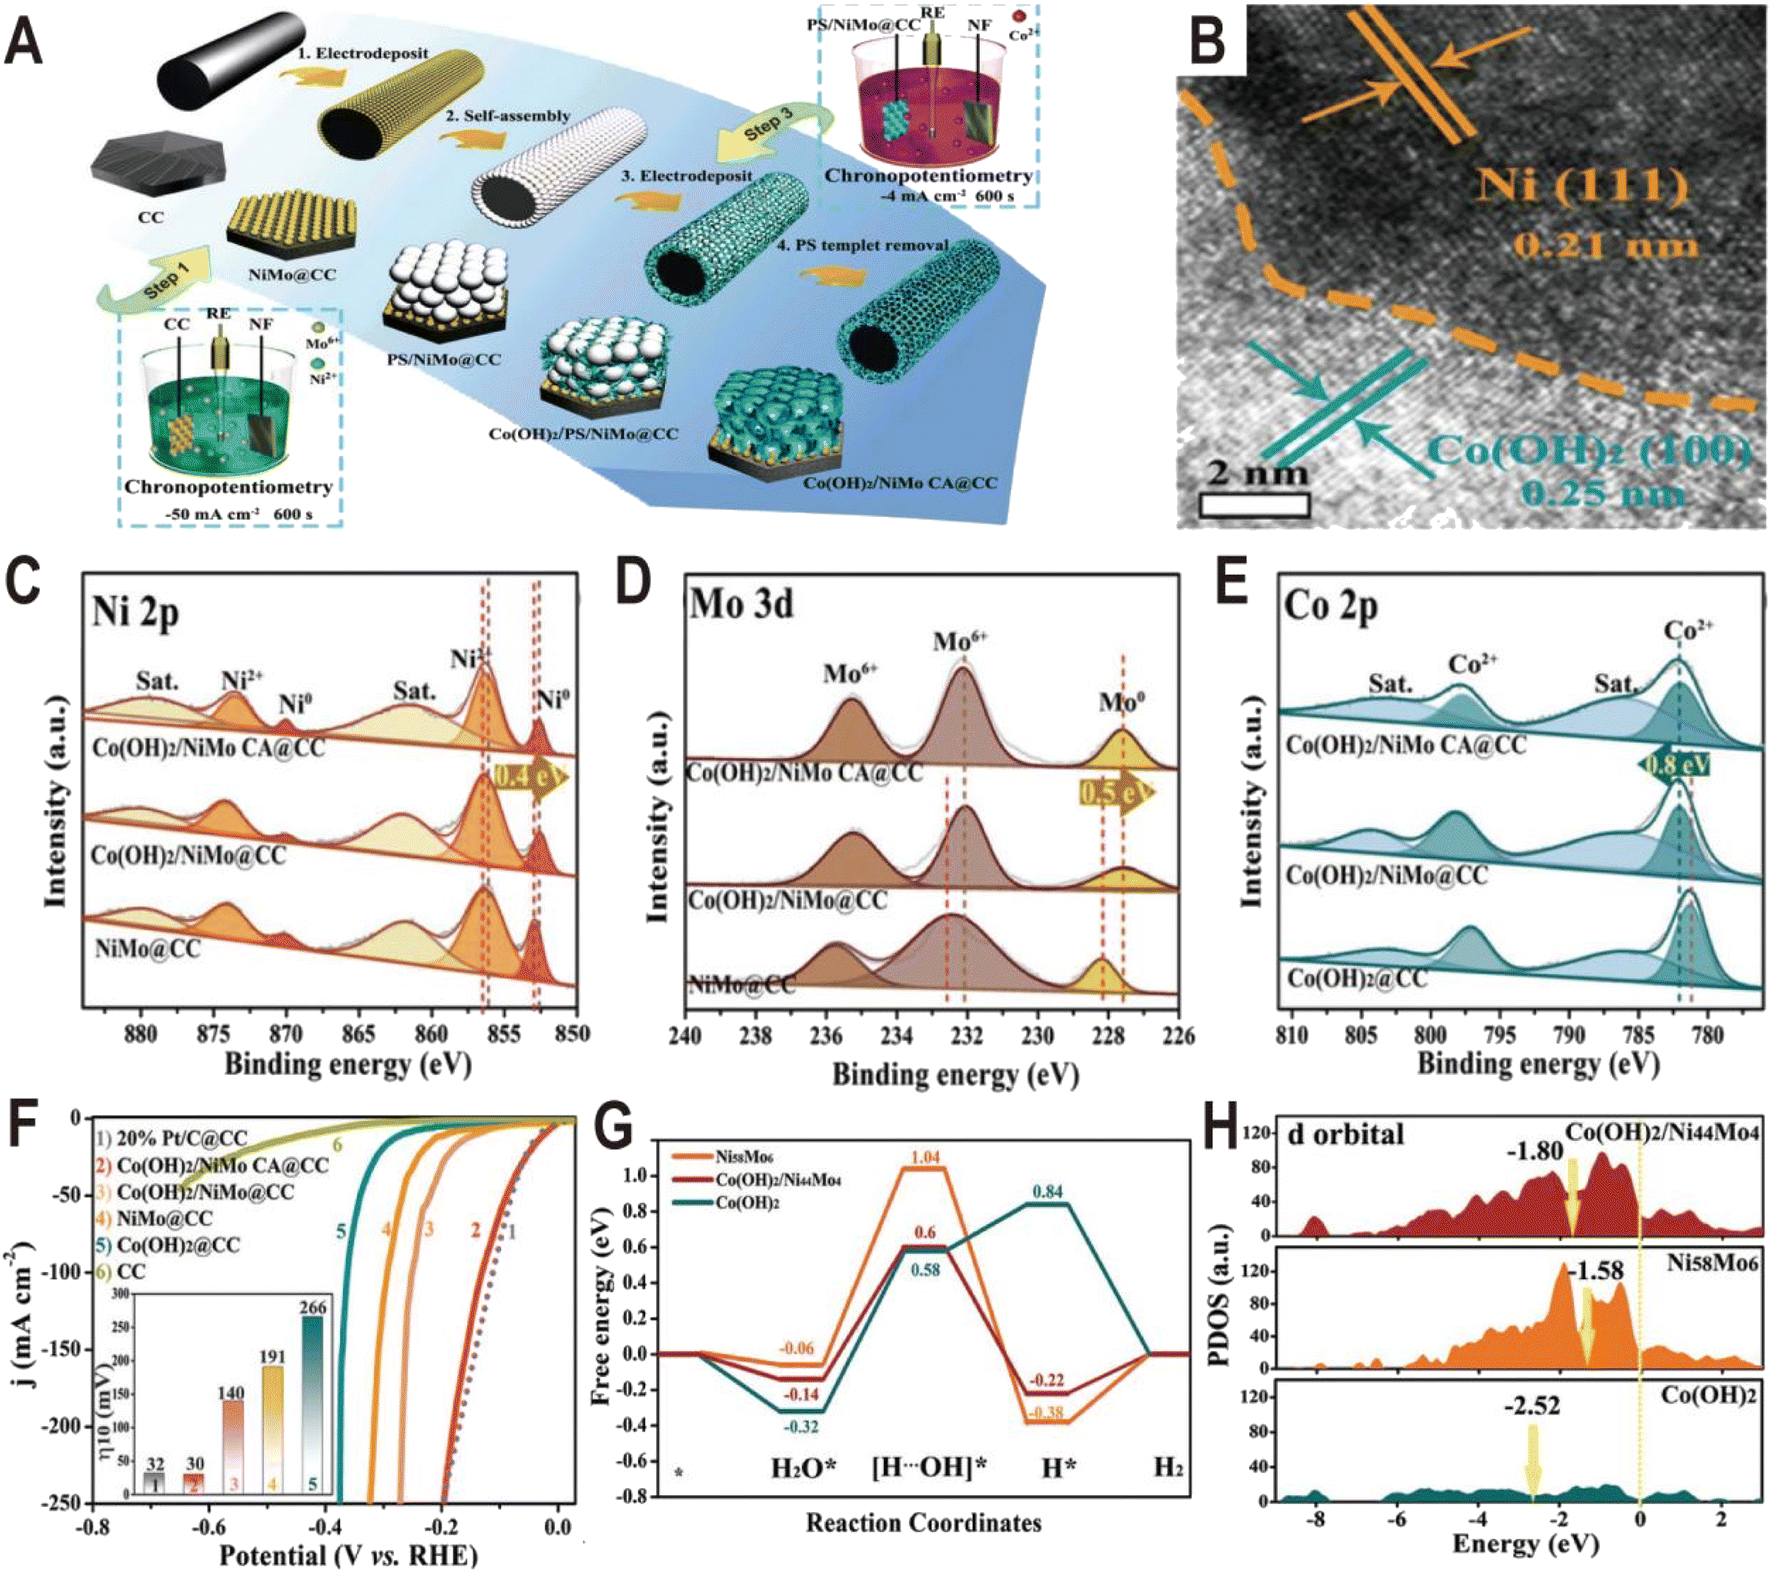 | ||
| Fig. 8 (A) Synthetic illustration of the fabrication process of Co(OH)2/NiMo CA@CC. (B) HRTEM image of NiMo alloy particles from Co(OH)2/NiMo CA@CC. (C–E) XPS spectra of Ni 2p, Mo 3d, and Co 2p of Co(OH)2/NiMo CA@CC, Co(OH)2/NiMo@CC, NiMo@CC, and Co(OH)2@CC. (F) Polarization curves of bare CC, Co(OH)2/NiMo CA@CC, Co(OH)2/NiMo@CC, NiMo@CC, Co(OH)2@CC, and Pt/C@CC toward the HER in 1.0 M KOH. (G) The free energy diagram for the HER on the surface of Ni58Mo6 and Co(OH)2, and the interface of Co(OH)2/Ni44Mo4. (H) The projected density-of-states of d orbitals of Ni58Mo6, Co(OH)2, and Co(OH)2/Ni44Mo4 with aligned Fermi levels. Reproduced with permission.61 Copyright 2021, Wiley-VCH. | ||
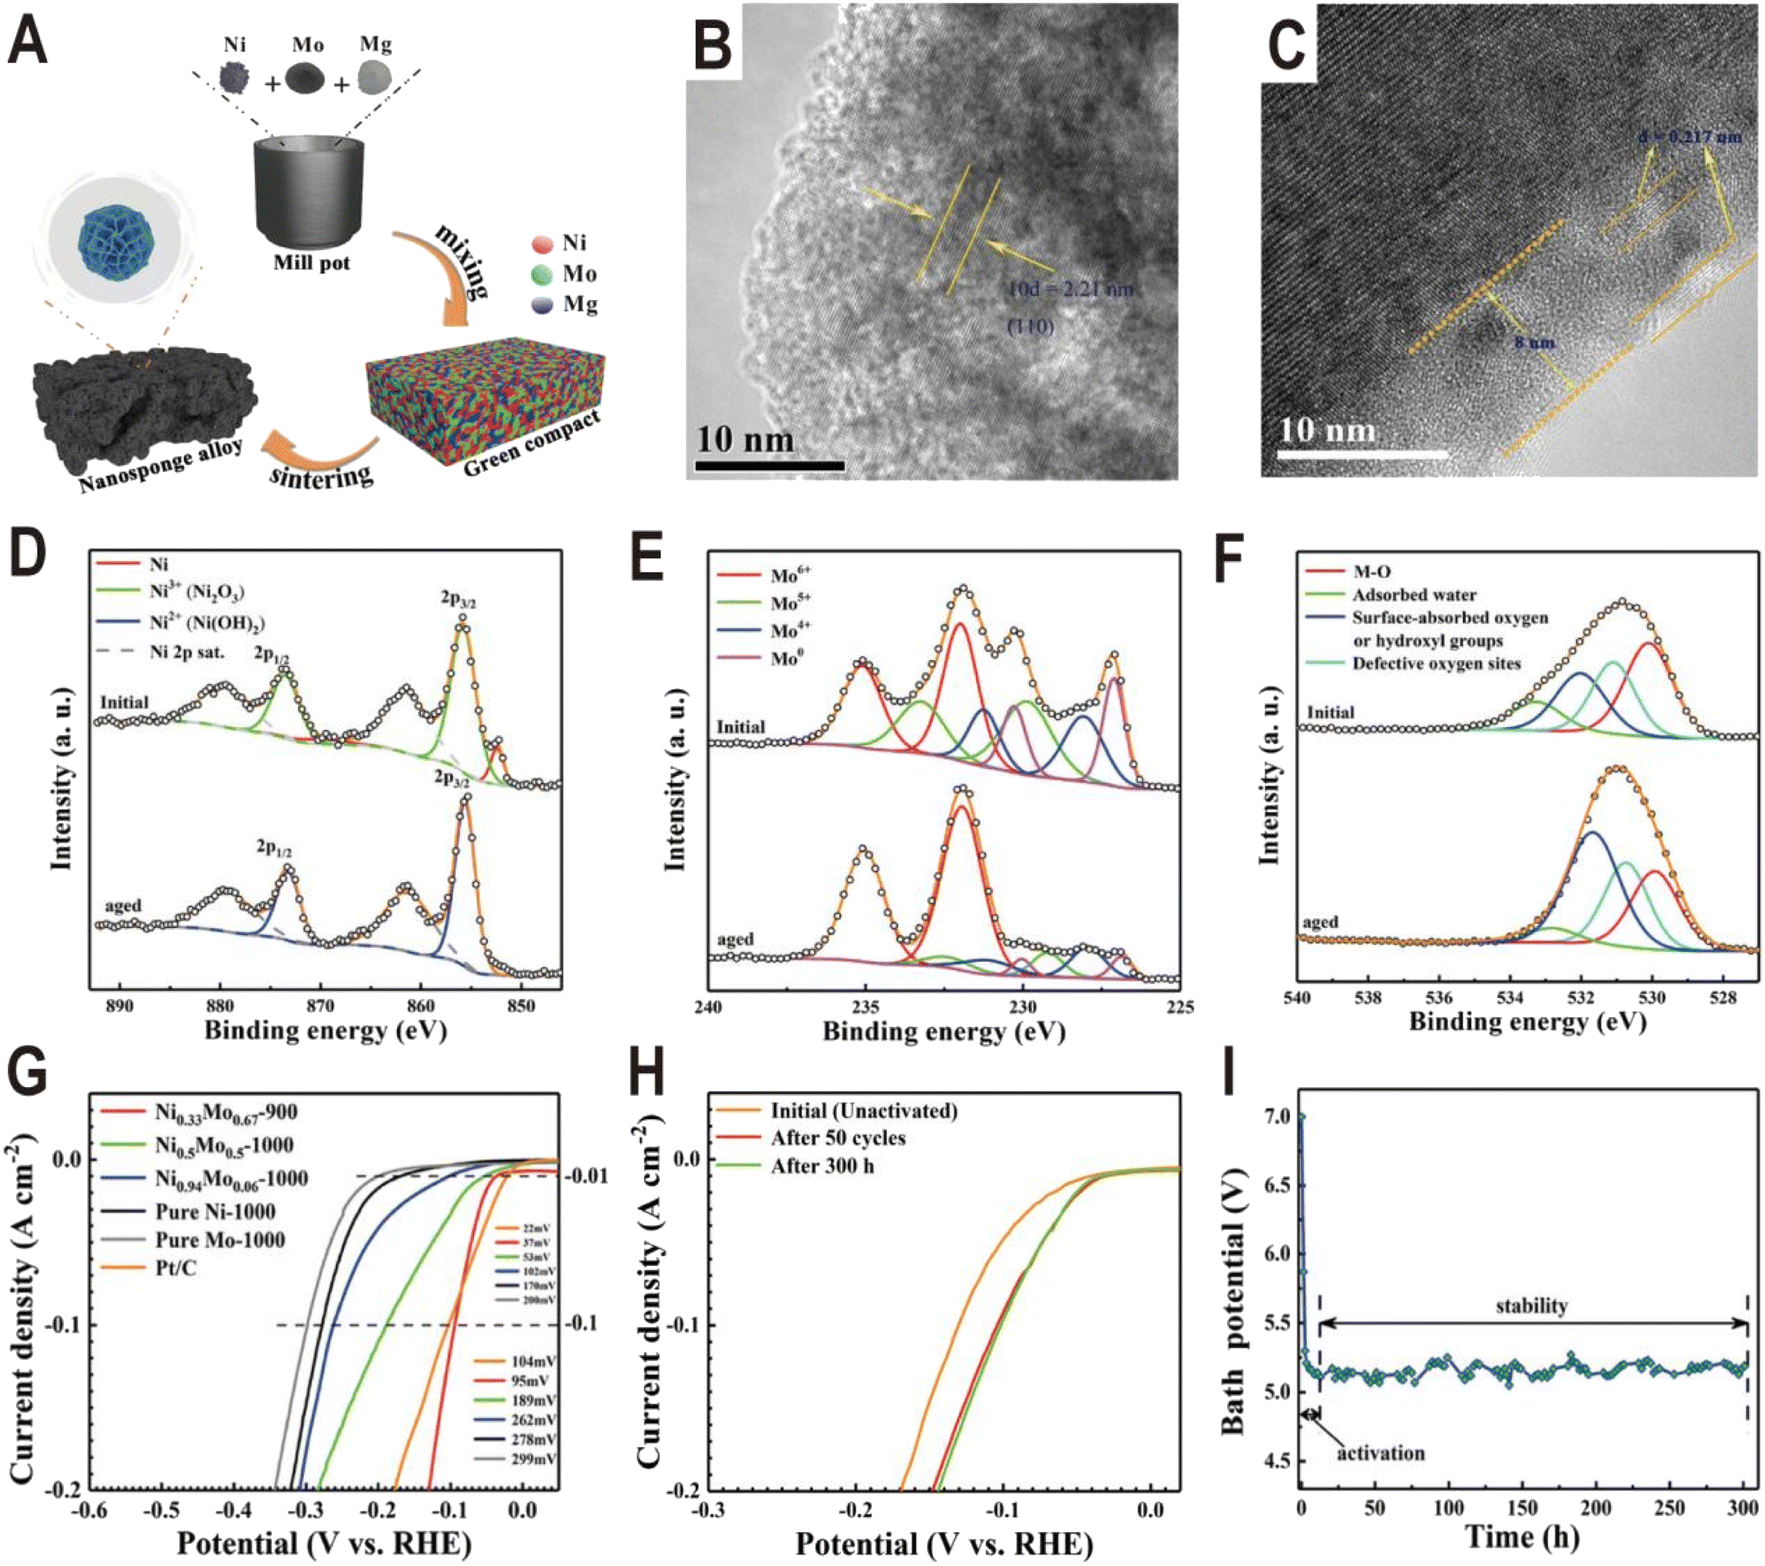
In addition to the interfaces of controllable synthesis, the NixMoy alloy/hydroxide interface can also be generated during electrochemical activation. For the NixMoy alloys obtained by high-temperature metallurgy, their HER activities are generally not high due to the lack of an interface structure, but their activities will be greatly improved after electrochemical activation to produce a layer of Ni(OH)2 or MoOx on the surface. A typical example is the nanosponge-like Ni0.33Mo0.67 solid solution catalyst synthesized via a one-step high-temperature (900 °C) sintering method by using metallic Ni, Mo, and magnesium (Mg) powders (Fig. 9A).62 Spherical Mg powder was added as a pore-making agent to prepare nanoporous alloys. The HRTEM image of the Ni0.33Mo0.67-900 solid solution shows an interplanar spacing of 0.221 nm (Fig. 9B), corresponding to the (110) facet of the metallic Mo body-centered cubic (bcc) structure. Interestingly, after an activation of 200 cycles with a scan rate of 10 mV s−1 and an overpotential range of 0–0.447 V (vs. RHE), an (oxy)hydroxide layer with a thickness of approximately 8 nm was clearly formed on the surface of Ni0.33Mo0.67-900, as shown in Fig. 9C. XPS spectra further prove the change of surface composition before and after activation. For Ni 2p (Fig. 9D), after aging, the peaks of Ni0 and Ni3+ at 852.4 eV and 855.8 eV disappear and the peak of Ni2+ at 855.6 eV is produced, corresponding to a phase of Ni(OH)2. For Mo 3d (Fig. 9E), the relative amount of Mo0, Mo4+, and Mo5+ species in the activated sample rapidly decreases relative to the pristine sample; in contrast, Mo6+ increases, indicating the formation of high valence MoOx. For O 1s (Fig. 9F), the peak intensity of hydroxyl groups has an obvious increase. The polarization curves in Fig. 9G show that the activated Ni0.33Mo0.67-900 solid solution catalyst exhibits a lower overpotential of 37 mV at a current density of 10 mA cm−2, and the performance of the sample without activation is obviously lower than that of the sample (Fig. 9H). The stability test curve also shows an obvious activation process, and the bath voltage demonstrates a fast decrease in the initial period of electrolysis, as shown in Fig. 9I. After activation, the Ni0.33Mo0.67-900 solid solution possesses an ultrahigh stability (>300 h) at 2 A cm−2 in a 1 M KOH electrolyte. As another example, the plasma sprayed RANEY®-type NiMo electrode also forms a layer of Ni(OH)2 and MoOx after chemical activation.63 Due to proper micropore/macropore distribution, appropriate amounts of active nickel and molybdenum species, and the oxidation degree, the activated NiMo electrode delivered a high current density of 200 mA cm−2 at 82 mV and stabilized with no measurable degradation over 47 days for the HER in 30 wt% KOH.
 | ||
| Fig. 9 (A) Schematic diagram of the fabrication process for a nanosponge-like NiMo solid solution prepared by high-temperature sintering. (B and C) HRTEM images of Ni0.33Mo0.67-900 before and after the HER test. (D–F) Ni 2p, Mo 3d, and O 1s XPS spectra of Ni0.33Mo0.67-900 before and after aging. (G) Polarization curves of pure Ni-1000, pure Mo-1000, Ni0.94Mo0.06-1000, Ni0.5Mo0.5-1000, Ni0.33Mo0.67-900, and Pt/C electrodes in a 1 M KOH solution. (H) Comparison of polarization curves of Ni0.33Mo0.67-900 obtained under different conditions. (I) Bath voltage variations at a current density of 2 A cm−2 in 1 M KOH solution. Reproduced with permission.62 Copyright 2020, American Chemical Society. | ||
From the above example analysis, it can be seen that the NixMoy alloy/hydroxide interface exhibits a bi-functional effect to simultaneously promote the dissociation of water and the combination of adsorbed hydrogen. The kinetics of the HER in alkaline solutions will depend both on the rate of desorption of OHad to accommodate the adsorption of H2O on hydroxide and on the rate of Had recombination, which is optimized on the alloy. For the dissociation of water, the activity will be controlled by the bond strength between metal hydroxides M(OH)x and OHad. In order to explore their interaction, a descriptor, OH–M2+δ bond strength (0 ≤ δ ≤ 1.5), was proposed, and it was found that the activity trend was Mn < Fe < Co < Ni, which was inversely proportional to the OH–M2+δ strength of Ni < Co < Fe < Mn.64 For the Fe and Mn hydroxides, due to their strong bonding with OHad, OHad cannot be desorbed and the reaction cannot continue, resulting in ‘poisoning’ of the surface. In contrast, for Ni hydroxides that bind OHad neither too strongly nor too weakly, the maximum activity was realized for the HER. Thus, the overall rate of the HER may, in principle, be controlled by optimizing the density and the nature of the sites required for dissociation of water on M(OH)x, as well as the OH–M2+δ and alloy-Had energetics.
4. Conclusions and perspectives
In this perspective, we systematically summarize the characteristics of structures and components obtained by different synthesis methods in Ni–Mo-based catalysts, and discuss their corresponding relationship with HER performance in detail. It can be found that most of the currently reported highly active Ni–Mo-based catalysts have alloy–oxide or alloy–hydroxide interface structures, as summarized in Tables 1 and 2. According to the logic of synthesis–structure–performance, we discuss the influence of the composition changes of two types of interface structures on HER activity. For the alloy–oxide interfaces, the Ni4Mo/MoOx (mixed oxide with the Mo ion valence from +4 to +6) composites produced by electrodeposition or hydrothermal combined with thermal reduction exhibit activities close to that of platinum. For only the alloy or oxide, their activities are significantly lower than that of composite structures, indicating the synergistic catalytic effect of binary components. Interestingly, the HER activity of MoO2 in acidic and alkaline media is very close, indicating that MoO2 can eliminate the influence of additional water dissociation under alkaline conditions. For the alloy–hydroxide interfaces, the activity of the NixMoy alloy with different Ni/Mo ratios is greatly improved by constructing heterostructures with hydroxides such as Ni(OH)2 or Co(OH)2. In particular, pure alloys obtained by metallurgy must be activated to produce a layer of mixed Ni(OH)2 and MoOx on the surface to achieve high activity. Theoretical and experimental studies show that metallic NixMoy alloys optimize the Gibbs free energy for hydrogen adsorption and MoOx or Ni(OH)2 can weaken the HO–H bond of absorbed water to facilitate water dissociation in the hetero-interfaces. Therefore, it can be seen that the activity of Ni–Mo catalysts probably originates from the interfaces of alloy–oxide or alloy–hydroxide.| Electrocatalyst | Synthesis method | Composition and structure | Onset potential (mV) | Overpotential (mV) | TOF (s−1) | Tafel slope (mV per decade) | Stability | Ref. |
|---|---|---|---|---|---|---|---|---|
| Ni4Mo/MoOx/Cu | Electrodeposition | Ni4Mo, MoOx, nanosheets | 0 | η 10 = 16, η250 = 105 (70 °C, 30% KOH) | — | 64 | 10 mA cm−2, 24 h, 50 mA cm−2, 24 h, 100 mA cm−2, 24 h | 51 |
| MoNi4/MoO3−x | Hydrothermal and reduction @ 350 °C | MoNi4, MoO3−x, NiMoO4, nanorods | 5 | η 10 = 17, η100 = 52, η500 = 114 | 1.13 @ η100 | 36 | 20 and 30 mA cm−2 for total 20 h | 52 |
| MoNi4/MoO2@NF | Hydrothermal and reduction @ 500 °C | MoNi4, MoO2, cuboids | 0 | η 10 = 15, η200 = 44 | 0.4 @ η50 | 30 | 2000 CV cycles; 10, 100, and 200 mA cm−2 for total 30 h | 23 |
| MoNi4/SSW | Precipitation and decomposition | MoO2, MoNi4 | — | η 100 = 63, η200 = 77, η500 = 115 (5 M KOH, 353 K), η1000 = 161 (5 M KOH, 353 K) | — | 40 | 100 mA cm−2, 18 h, 150 mA cm−2, 150 h (5 M KOH, 353 K) | 57 |
| MoNi-HS | Hydrothermal and reduction @ 500 °C | Ni4Mo, MoOx, nanosheets | — | η 10 = 38 | — | 31.4 | 10 mA cm−2, 10 h | 53 |
| NiMo/MoO2 | Hydrothermal and reduction @ 450 °C | MoO2, NiMo, nanosheets | 12 | η 10 = 52 | 1.06 @ η150 | 43.6 | 100 mA cm−2, 30 h | 56 |
| NC/NiMo/NiMoOx/NF | Hydrothermal and reduction @ 400 °C | Ni4Mo, MoO3−x, NiMoO4, nanowires | 5 | η 10 = 29, η200 = 160 | — | 46 | 179 mA cm−2, 50 h | 54 |
| MoNi4/MoO3−x/NiCo@NF | Hydrothermal and reduction @ 350 °C | MoNi4, MoO3−x, NiCo, nanowires | — | η 10 = 33, η100 = 149 | — | 34 | 3000 CV cycles; 20 mA cm−2, 24 h | 55 |
| Ni–Mo–O/Ni4Mo@NC | Electrodeposition, calcination, and electrodeposition | Ni4Mo, nanosheets | — | η 10 = 61 | — | 99 | 10 mA cm−2, 15 h | 24 |
| NiMoFe@MoO2 | Hydrothermal and reduction @ 500 °C | NiMoFe, MoO2, nano-pillars | — | η 10 = 24, η100 = 63, η200 = 83, η500 = 130 | — | 33 | 10, 100, 200, 100, and 10 mA cm−2 for total 140 h | 25 |
| MoNi4@MoO3−x | Hydrothermal and reduction @ 550 °C | MoNi4, MoO3−x, nanorods | 5.4 | η 10 = 58.6 | — | 44.8 | 10 mA cm−2, 10 h | 37 |
| NiMo M/O | Hydrothermal and reduction @ 500 °C | MoNi4, MoO2, nanosheets | — | η 10 = 16, η50 = 50 | — | 31.9 | 10 mA cm−2, 11 h | 28 |
| Electrocatalyst | Synthesis method | Composition and structure | Overpotential (mV) | TOF (s−1) | Tafel slope (mV per decade) | Stability | Ref. |
|---|---|---|---|---|---|---|---|
| Mo0.84Ni0.16@Ni(OH)2 | Hydrothermal, reduction @ 500 °C and electrodeposition | NiMoO4, Mo0.84Ni0.16, Ni(OH)2, nanowires | η 10 = 10, η100 = 91 | 0.93 @ η100 | 71 | 3000 CV cycles; 20 mA cm−2, 100 h | 59 |
| P–Mo–Ni(OH)2 | Hydrothermal and low-temperature H2/N2 plasma activation | MoNi4, Ni(OH)2, Ni3N, MoNiN, nanosheet | η 10 = 22, η100 = 98 | 1.325 @ η50 | 80 | 10 mA cm−2, 100 h, 50 mA cm−2, 50 h | 60 |
| Co(OH)2/NiMo CA@CC | Electrodeposition | NixMoy, Co(OH)2, nanosheet | η 10 = 30 | — | 41 | 10 mA cm−2, 24 h, 50 mA cm−2, 24 h, 100 mA cm−2, 24 h | 61 |
| h-NiMoFe | Hydrothermal and reduction @ 500 °C | MoO2, Ni4Mo, Fe–(OH)4–Ni4, nanosheet | η 10 = 14, η500 = 74, η1000 = 97 | 2 @ η50 | 30.6 | 200, 600, 1000, and 1500 mA cm−2 for total 40 h | 50 |
| Ni0.33Mo0.67-900 | High-temperature sintering | Ni0.33Mo0.67, MoOx, Ni(OH)2, nanosponge | η 10 = 37, η1000 = 316 | — | 39.2 | 2 A cm−2, 300 h | 62 |
| RANEY®-type NiMo | Atmospheric plasma spraying and activation | MoNi, Mo1.08Ni2.93, Ni(OH)2, nanosponge | η 200 = 82 (30 wt% KOH) | — | 36 | 2 A, 47 days (30 wt% KOH) | 63 |
| NiMo/Ni(OH)2/CC | Hydrothermal and electrodeposition | NiMo, Ni(OH)2, nanosheet | η 10 = 132 | — | 134.1 | 10 mA cm−2, 24 h | 41 |
| NiMo@Ni(OH)2MoOx | Electrodeposition | Ni(OH)2, MoO3, MoO2, nanoparticles | η 100 = 160 | — | 115 | 10 mA cm−2, 24 h, 100 mA cm−2, 24 h | 42 |
Although NiMo-based catalysts exhibit outstanding HER activity, the dissolvable nature of Mo in alkaline solution results in the poor stability of the NixMoy alloy due to the lower oxidation potential of Mo than that of H2. Therefore, controlling the dissolution of Mo species is crucial to improve the stability of NiMo-based catalysts. At present, there are three strategies that have proved effective and can be tried to develop: (1) preparation of the pure phase NiMo alloy with high specific surface area by a metallurgical method; the most stable catalysts reported are almost all treated by high-temperature alloying. Compared with nanoalloys prepared by a low-temperature chemical method, high-temperature alloying is beneficial to improve the compactness and continuity of the catalyst. After electrochemical activation, a layer of Ni(OH)2 or MoOx on the surface is formed, which can not only facilitate the dissociation of water but also provide a protective layer to prevent the dissolution of the Mo element. (2) The formed interface structure is coated with carbon or other conductive oxides or hydroxides; by adsorbing or depositing a layer of carbon precursor molecules on the surface and then carbonizing, an alloy/oxide or alloy/hydroxide interface structure uniformly coated with carbon layer can be obtained. An additional protective layer will partially inhibit the dissolution of Mo. (3) Establishment of dynamic dissolution and re-adsorption equilibrium of Mo ions in electrolytes; the literature results reveal that MoO42− can be easily dissolved in KOH electrolyte and re-adsorbed on the surface of the catalyst during the oxygen evolution reaction (OER), which delivers a promoting effect on OER performance.65 Theoretical calculations show that the adsorption of the dimer Mo2O72− can promote the HER activity of metallic Ni.58 Therefore, the dissolution of Mo will be effectively inhibited and the stability of NiMo-based catalysts will be greatly improved through reasonable control of the above three aspects.
Data availability
All data in this perspective were cited from other references.Author contributions
Z.-L. W. and Y. Y. conceived the topic and structure of the paper. All authors reviewed and contributed to this paper.Conflicts of interest
There are no conflicts to declare.Acknowledgements
This work was supported by the National Natural Science Foundation of China (NSFC) [Grant number 22075201] and the JST-ERATO Yamauchi Materials SpaceTectonics Project (JPMJER2003). This work was performed in part at the Queensland node of the Australian National Fabrication Facility, a company established under the National Collaborative Research Infrastructure Strategy to provide nano and microfabrication facilities for Australia's researchers.References
- Q. Wang, M. Nakabayashi, T. Hisatomi, S. Sun, S. Akiyama, Z. Wang, Z. Pan, X. Xiao, T. Watanabe, T. Yamada, N. Shibata, T. Takata and K. Domen, Nat. Mater., 2019, 18, 827 CrossRef CAS PubMed.
- J. H. Kim, D. Hansora, P. Sharma, J. W. Jang and J. S. Lee, Chem. Soc. Rev., 2019, 48, 1908–1971 RSC.
- J. D. Blakemore, R. H. Crabtree and G. W. Brudvig, Chem. Rev., 2015, 115, 12974–13005 CrossRef CAS PubMed.
- H. Lyu, T. Hisatomi, Y. Goto, M. Yoshida, T. Higashi, M. Katayama, T. Takata, T. Minegishi, H. Nishiyama, T. Yamada, Y. Sakata, K. Asakura and K. Domen, Chem. Sci., 2019, 10, 3196 RSC.
- R. Subbaraman, D. Tripkovic, D. Strmcnik, K. C. Chang, M. Uchimura, A. P. Paulikas, V. Stamenkovic and N. M. Markovic, Science, 2011, 334, 1256–1260 CrossRef CAS PubMed.
- Y. Zhao, C. Chang, F. Teng, Y. Zhao, G. Chen, R. Shi, G. I. N. Waterhouse, W. Huang and T. Zhang, Adv. Energy Mater., 2017, 7, 1700005 CrossRef.
- T. Ling, T. Zhang, B. Ge, L. Han, L. Zheng, F. Lin, Z. Xu, W. Hu, X. Du, K. Davey and S. Qiao, Adv. Mater., 2019, 31, 1807771 CrossRef PubMed.
- H. Zhou, F. Yu, Q. Zhu, J. Sun, F. Qin, L. Yu, J. Bao, Y. Yu, S. Chen and Z. Ren, Energy Environ. Sci., 2018, 11, 2858–2864 RSC.
- Y. Chen, Y. Zhang, X. Zhang, T. Tang, H. Luo, S. Niu, Z. Dai, L. Wan and J. Hu, Adv. Mater., 2017, 29, 1703311 CrossRef PubMed.
- J. Zhang, T. Wang, P. Liu, Z. Liao, S. Liu, X. Zhuang, M. Chen, E. Zschech and X. Feng, Nat. Commun., 2017, 8, 15437 CrossRef CAS PubMed.
- Z. Cao, Q. Chen, J. Zhang, H. Li, Y. Jiang, S. Shen, G. Fu, B. Lu, Z. Xie and L. Zheng, Nat. Commun., 2017, 8, 15131 CrossRef PubMed.
- C. Wei, Y. Sun, G. G. Scherer, A. C. Fisher, M. Sherburne, J. W. Ager and Z. J. Xu, J. Am. Chem. Soc., 2020, 142, 7765–7775 CrossRef CAS PubMed.
- B. You, Y. Zhang, Y. Jiao, K. Davey and S. Z. Qiao, Angew. Chem., Int. Ed., 2019, 58, 11796–11800 CrossRef CAS PubMed.
- T. Zhang, K. Yang, C. Wang, S. Li, Q. Zhang, X. Chang, J. Li, S. Li, S. Jia, J. Wang and L. Fu, Adv. Energy Mater., 2018, 8, 1801690 CrossRef.
- I. K. Mishra, H. Zhou, J. Sun, F. Qin, K. Dahal, J. Bao, S. Chen and Z. Ren, Energy Environ. Sci., 2018, 11, 2246–2252 RSC.
- F. Yu, H. Zhou, Y. Huang, J. Sun, F. Qin, J. Bao and Z. Ren, Nat. Commun., 2018, 9, 1–9 CrossRef PubMed.
- Z. Wang, J. Chen, E. Song, N. Wang, J. Dong, X. Zhang, P. M. Ajayan, W. Yao, C. Wang, J. Liu, J. Shen and M. Ye, Nat. Commun., 2021, 12, 5960 CrossRef CAS PubMed.
- C. Lu, D. Tranca, J. Zhang, F. R. Hernandez, Y. Su, X. Zhuang, F. Zhang, G. Seifert and X. Feng, ACS Nano, 2017, 11, 3933–3942 CrossRef CAS PubMed.
- N. Han, K. R. Yang, Z. Lu, Y. Li, W. Xu, T. Gao, Z. Cai, Y. Zhang, V. S. Batista, W. Liu and X. Sun, Nat. Commun., 2018, 9, 924 CrossRef PubMed.
- Y. Luo, X. Li, X. Cai, X. Zou, F. Kang, H. M. Cheng and B. Liu, ACS Nano, 2018, 12, 4565–4573 CrossRef CAS PubMed.
- Y. Zang, S. Niu, Y. Wu, X. Zheng, J. Cai, J. Ye, Y. Xie, Y. Liu, J. Zhou, J. Zhu, X. Liu, G. Wang and Y. Qian, Nat. Commun., 2019, 10, 1217 CrossRef PubMed.
- Q. Wang, Z. L. Zhao, S. Dong, D. He, M. J. Lawrence, S. Han, C. Cai, S. Xiang, P. Rodriguez, B. Xiang, Z. Wang, Y. Liang and M. Gu, Nano Energy, 2018, 53, 458–467 CrossRef CAS.
- J. Zhang, T. Wang, P. Liu, Z. Liao, S. Liu, X. Zhuang, M. Chen, E. Zschech and X. Feng, Nat. Commun., 2017, 8, 15437 CrossRef CAS PubMed.
- Z. Jin, L. Wang, T. Chen, J. Liang, Q. Zhang, W. Peng, Y. Li, F. Zhang and X. Fan, Ind. Eng. Chem. Res., 2021, 60, 5145–5150 CrossRef CAS.
- P. Liu, W. Pan, R. Yao, L. Zhang, Q. Wu, F. Kang, H. Fan and C. Yang, J. Mater. Chem. A, 2022, 10, 3760–3770 RSC.
- R. B. Patil, S. D. House, A. Mantri, J. C. Yang and J. R. McKone, ACS Catal., 2020, 10, 10390–10398 CrossRef CAS.
- J. Park, H. Kim, G. H. Han, J. Kim, S. J. Yoo, H. J. Kim and S. H. Ahn, J. Mater. Chem. A, 2021, 9, 3677–3684 RSC.
- M. Zhou, Y. Zeng, Y. Liu, Y. Sun, F. Lu, X. Zhang, R. Cao, Y. Xue, X. Zeng and Y. Wu, Appl. Surf. Sci., 2022, 597, 153597 CrossRef CAS.
- M. Wang, H. Yang, J. Shi, Y. Chen, Y. Zhou, L. Wang, S. Di, X. Zhao, J. Zhong, T. Cheng, W. Zhou and Y. Li, Angew. Chem., 2021, 133, 5835–5841 CrossRef.
- Z. Xie, Y. Zou, L. Deng and J. Jiang, Adv. Mater. Interfaces, 2020, 7, 1901949 CrossRef CAS.
- J. Song, Y. Q. Jin, L. Zhang, P. Dong, J. Li, F. Xie, H. Zhang, J. Chen, Y. Jin, H. Meng and X. Sun, Adv. Energy Mater., 2021, 11, 2003511 CrossRef CAS.
- J. Cao, H. Li, R. Zhu, L. Ma, K. Zhou, Q. Wei and F. J. Luo, J. Alloys Compd., 2020, 844, 155382 CrossRef CAS.
- K. Kim, A. P. Tiwari, G. Hyun, Y. Yoon, H. Kim, J. Y. Park, K. An and S. J. Jeon, J. Mater. Chem. A, 2021, 9, 7767–7773 RSC.
- A. Nairan, P. Zou, C. Liang, J. Liu, D. Wu, P. Liu and C. Yang, Adv. Funct. Mater., 2019, 29, 1903747 CrossRef CAS.
- D. D. Rodene, E. H. Eladgham, R. B. Gupta, I. U. Arachchige and V. Tallapally, ACS Appl. Energy Mater., 2019, 2, 7112–7120 CrossRef CAS.
- L. Rößner, H. Schwarz, I. Veremchuk, R. Zerdoumi, T. Seyller and M. Armbrüster, ACS Appl. Mater. Interfaces, 2021, 13, 23616–23626 CrossRef PubMed.
- J. Wei, Q. Jia, B. Chen, H. Wang, X. Ke, Y. Dong, G. Liu and Y. Peng, J. Alloys Compd., 2021, 876, 160152 CrossRef CAS.
- M. Fang, W. Gao, G. Dong, Z. Xia, S. Yip, Y. Qin, Y. Qu and J. C. Ho, Nano Energy, 2016, 27, 247–254 CrossRef CAS.
- X. Lu, M. Cai, J. Huang and C. Xu, J. Colloid Interface Sci., 2020, 562, 307–312 CrossRef CAS PubMed.
- M. Gong, D. Y. Wang, C. C. Chen, B. J. Hwang and H. Dai, Nano Res., 2016, 9, 28–46 CrossRef CAS.
- C. Li, J. Wang, Y. Wang, J. Li, Z. Yao and Z. Jiang, ChemistrySelect, 2020, 5, 6774–6779 CrossRef CAS.
- M. Zhao, E. Li, N. Deng, Y. Hu, C. Li, B. Li, F. Li, Z. Guo and J. He, Renewable Energy, 2022, 191, 370–379 CrossRef CAS.
- Y. Zhou, T. Lin, X. Luo, Z. Yan, J. Wu, J. Wang and Y. Shen, J. Catal., 2020, 388, 122–129 CrossRef CAS.
- J. M. Jaksič, M. V. Vojnovic and N. V. Krstajic, Electrochim. Acta, 2000, 45, 4151–4158 CrossRef.
- J. G. Highfield, E. Claude and K. Oguro, Electrochim. Acta, 1999, 44, 2805–2814 CrossRef CAS.
- A. Kawashima, E. Akiyama, H. Habazaki and K. Hashimoto, Mater. Sci. Eng., A, 1997, 226, 905–909 CrossRef.
- J. Bau, S. Kozlov, L. Azofra, S. Ould-Chikh, A. Emwas, H. Idriss, L. Cavallo and K. Takanabe, ACS Catal., 2020, 10, 12858–12866 CrossRef CAS.
- N. Dubouis and A. Grimaud, Chem. Sci., 2019, 10, 9165–9181 RSC.
- L. Peng, M. Liao, X. Zheng, Y. Nie, L. Zhang, M. Wang, R. Xiang, J. Wang, L. Li and Z. Wei, Chem. Sci., 2020, 11, 2487–2493 RSC.
- Y. Luo, Z. Zhang, F. Yang, J. Li, Z. Liu, W. Ren, S. Zhang and B. Liu, Energy Environ. Sci., 2021, 14, 4610–4619 RSC.
- Y. An, X. Long, M. Ma, J. Hu, H. Lin, D. Zhou, Z. Xing, B. Huang and S. Yang, Adv. Energy Mater., 2019, 9, 1901454 CrossRef CAS.
- Y. Y. Chen, Y. Zhang, X. Zhang, T. Tang, H. Luo, S. Niu, Z. H. Dai, L. J. Wan and J. S. Hu, Adv. Mater., 2017, 29, 1703311 CrossRef PubMed.
- Y. Zhou, M. Luo, W. Zhang, Z. Zhang, X. Meng, X. Shen, H. Liu, M. Zhou and X. Zeng, ACS Appl. Mater. Interfaces, 2019, 11, 21998–22004 CrossRef CAS PubMed.
- J. Hou, Y. Wu, S. Cao, Y. Sun and L. Sun, Small, 2017, 13, 1702018 CrossRef PubMed.
- Y. Zhang, G. Yan, Y. Shi, H. Tan and Y. Li, New J. Chem., 2021, 45, 10890–10896 RSC.
- L. Yang, H. Liu, Z. Zhou, Y. Chen, G. Xiong, L. Zeng, Y. Deng, X. Zhang, H. Liu and W. Zho, ACS Appl. Mater. Interfaces, 2020, 12, 33785–33794 CrossRef CAS PubMed.
- V. Jothi, K. Karuppasamy, T. Maiyalagan, H. Rajan, C. Jung and S. Yi, Adv. Energy Mater., 2020, 10, 1904020 CrossRef CAS.
- W. Du, Y. Shi, W. Zhou, Y. Yu and B. Zhang, Angew. Chem., Int. Ed., 2021, 60, 7051–7055 CrossRef CAS PubMed.
- X. Lu, M. Cai, Z. Zou, J. Huang and C. Xu, Chem. Commun., 2020, 56, 1729–1732 RSC.
- W. Zhang, Y. Tang, L. Yu and X. Y. Yu, Appl. Catal., B, 2020, 260, 118154 CrossRef CAS.
- Q. Zhang, W. Xiao, W. H. Guo, Y. X. Yang, J. L. Lei, H. Q. Luo and N. B. Li, Adv. Funct. Mater., 2021, 31, 2102117 CrossRef CAS.
- P. Shang, Z. Ye, Y. Ding, Z. Zhu, X. Peng, G. Ma and D. Li, ACS Sustainable Chem. Eng., 2020, 8, 10664–10672 CAS.
- F. Razmjooei, T. Liu, D. A. Azevedo, E. Hadjixenophontos, R. Reissner, G. Schiller, S. A. Ansar and K. A. Friedrich, Sci. Rep., 2020, 10, 10948 CrossRef CAS PubMed.
- R. Subbaraman, D. Tripkovic, K. Chang, D. Strmcnik, A. Paulikas, P. Hirunsit, M. Chan, J. Greeley, V. Stamenkovic and N. Markovic, Nat. Mater., 2012, 11, 550–557 CrossRef CAS PubMed.
- H. Liao, X. Zhang, S. Niu, P. Tan, K. Chen, Y. Liu, G. Wang, M. Liu and J. Pan, Appl. Catal., B, 2022, 307, 121150 CrossRef CAS.
| This journal is © The Royal Society of Chemistry 2023 |