
 Open Access Article
 This Open Access Article is licensed under a Creative Commons Attribution-Non Commercial 3.0 Unported Licence
Connecting the dots for fundamental understanding of structure–photophysics–property relationships of COFs, MOFs, and perovskites using a Multiparticle Holstein Formalism
Raja
Ghosh
 *a and
Francesco
Paesani
*abc
*a and
Francesco
Paesani
*abc
aDepartment of Chemistry and Biochemistry, University of California, La Jolla, San Diego, California 92093, USA. E-mail: raghosh@ucsd.edu
bSan Diego Supercomputer Center, University of California, La Jolla, San Diego, California 92093, USA
cMaterials Science and Engineering, University of California, La Jolla, San Diego, California 92093, USA. E-mail: fpaesani@ucsd.edu
First published on 16th November 2022
Abstract
Photoactive organic and hybrid organic–inorganic materials such as conjugated polymers, covalent organic frameworks (COFs), metal–organic frameworks (MOFs), and layered perovskites, display intriguing photophysical signatures upon interaction with light. Elucidating structure–photophysics–property relationships across a broad range of functional materials is nontrivial and requires our fundamental understanding of the intricate interplay among excitons (electron–hole pair), polarons (charges), bipolarons, phonons (vibrations), inter-layer stacking interactions, and different forms of structural and conformational defects. In parallel with electronic structure modeling and data-driven science that are actively pursued to successfully accelerate materials discovery, an accurate, computationally inexpensive, and physically-motivated theoretical model, which consistently makes quantitative connections with conceptually complicated experimental observations, is equally important. Within this context, the first part of this perspective highlights a unified theoretical framework in which the electronic coupling as well as the local coupling between the electronic and nuclear degrees of freedom can be efficiently described for a broad range of quasiparticles with similarly structured Holstein-style vibronic Hamiltonians. The second part of this perspective discusses excitonic and polaronic photophysical signatures in polymers, COFs, MOFs, and perovskites, and attempts to bridge the gap between different research fields using a common theoretical construct – the Multiparticle Holstein Formalism. We envision that the synergistic integration of state-of-the-art computational approaches with the Multiparticle Holstein Formalism will help identify and establish new, transformative design strategies that will guide the synthesis and characterization of next-generation energy materials optimized for a broad range of optoelectronic, spintronic, and photonic applications.
1 Introduction
A fundamental understanding of excited-state phenomena and the elementary mechanisms that govern photophysical and charge transport processes of multifunctional materials is crucial for new scientific breakthroughs and future technological innovations. Fueled by the discovery of polymer-based light emitting diodes (OLEDs),1,2 organic materials continue to find increasing commercial value, with a broad range of applications in photovoltaics,3–8 organic spintronics,9–12 field effect transistors,13–16 wearable technology,16–19 flexible displays,20–23 photolithography,24,25 and chemosensors and bioprobes.4,26,27In addition to traditional one-dimensional semiconducting polymers, the discovery of 2D covalent organic frameworks (COFs) in 2005 (ref. 28) has sparked renewed interest in organic electronics. COFs represent an emerging class of porous organic materials that offer a range of unique advantages compared to traditional polymeric materials, such as morphological precision and positional control of diverse functional building blocks.28–45 Tremendous efforts are currently focused on taking advantage of the structural diversity, crystallinity, and porosity of various COF structures for potential cutting-edge applications in biomedicine and bioimaging,46–50 drug and gene delivery,51–54 gas and energy storage,55–58 photocatalysis,59,60 and ion conduction.61,62 Despite the presence of intrinsic porosity, which hinders the efficient movement of charges, COFs have also found applications as semiconducting materials.63–72 Energy and charge migration in COFs happen through the efficient transport of excitons and polarons, respectively, either along the framework backbone (i.e., through bond) or between the π-stacked layers (i.e., through space).
While the facile synthesis of organic materials makes optoelectronic devices inexpensive compared to their inorganic counterparts, structural and conformational disorder often leads to poor conductivity and low mobility.73–77 Despite being environmental friendly, organic thermoelectric materials also suffer from low conductivity, Seebeck coefficient, and power factor.78 The flexibility of self-assembling organic and inorganic building units to form hybrid organic–inorganic frameworks offers the possibility to combine unique photophysical and electronic properties that are absent in either of the individual building blocks.78–80 The combination of high conductivity in the inorganic components with stronger light–matter interactions and higher quantum efficiency of the organic components has proved to be an effective approach which have resulted in much improved electrical, optical, and transport properties.80–84 Over the last decade, hybrid organic–inorganic materials, such as metal–organic frameworks (MOFs) and layered perovskites, have received widespread interest for potential applications in various fields of chemistry and materials science.85–93 Although MOFs are generally considered as insulating materials, recent studies have reported promising results on the synthesis of intrinsically conducting MOFs.94–97 The field of layered perovskites has exploded in the last decade, and two-dimensional (2D) perovskites have emerged as promising candidates for next generation solar cells owing to record power conversion efficiencies which vastly outperform the efficiencies achieved by organic based materials.98–102
The design and synthesis of new materials presents a formidable challenge since chemical manipulation and framework diversity, in principle, allow for myriads of possible structural combinations that enable the fine tuning of optical, electronic, and transport properties. From an experimental viewpoint, establishing efficient synthetic routes for synthesizing novel electronic materials tailored for specific applications remains the main obstacle.
To overcome some of the challenges, computational predictions of new multifunctional materials has been bolstered primarily due to the development of new algorithms and the availability of supercomputers which readily enable the treatment of large number of molecules within a reasonable time frame. Various computational and theoretical approaches, ranging from quantum Monte Carlo (QMC) to molecular dynamics (MD) simulations and density functional theory (DFT) have been utilized to gain new insights into the complicated electronic structure of organic and hybrid materials.103 For example, DFT in combination with tight-binding modeling has been extensively employed to investigate the nature of flat bands,104 electronic structure,105,106 structural defects,107 effects of doping,108 and interlayer stacking interactions109 in 2D COFs.
Skillful exploration of data through data-mining and big data approaches as well as electronic structure modeling have greatly benefited the fields of MOFs and perovskites.103,110–119 Machine learning and high throughput techniques have been routinely employed to screen the chemical space of hybrid materials with the goal of proposing new MOF and perovskite structures that are suitable for industrial applications, including but not limited to catalysis,120–123 gas storage and separation,124 and optoelectronics.125–128 While materials modeling based on data-driven approaches has achieved some remarkable success in predicting electronic properties (e.g., band gaps, charge densities, electronic couplings, oscillator strengths, etc.), the development of a rigorous theoretical framework that utilizes the calculated properties to make quantitative connections with state-of-the-art ultrafast spectroscopy measurements will further help accelerate materials discovery.
Within this context, the majority of optoelectronic, charge transport and storage, and photonics applications involve the fundamental photophysical process of absorption and emission of light. Excited state processes of technologically relevant organic and hybrid materials such as polymers, COFs, MOFs, and perovskites are mainly governed by the quantum mechanical behavior of mobile quasiparticles, such as Frenkel, charge-transfer, and Wannier–Mott excitons, polarons and bipolarons, trions, and the interaction of mobile quasiparticles with intra- and inter-molecular vibrational modes.129–144 These vibronic effects, which arise from the coupling of the electronic transitions with the nuclear vibrational motion, play a central role in determining the photophysical response of organic145–147 and hybrid materials148–154 as well as influence the excited state dynamics in chemical and biological systems.155–163 It is therefore not surprising that any progress in the design of novel materials warrants a robust theoretical methodology that can provide an in-depth understanding of how the complicated interplay between photons, excitons, polarons, bipolarons, phonons, and spins influences the photoinduced excited state processes of a broad range of semiconducting materials.
Despite significant recent progress, two main challenges still persist which involve a quantitative understanding of how electron–phonon coupling and defects influence the electronic, optical, and transport properties of functional electronic materials. Although, excited state properties of materials can be modeled using linear-response time-dependent density functional theory (LR-TDDFT) or the Bethe–Salpeter equation (BSE),164 the presence of a large number of atoms in 2D materials makes the application of LR-TDDFT and BSE computationally very demanding (however, recent advances do look very promising165,166). Moreover, electron–phonon coupling and different forms of electronic and conformational defects play fundamental roles in determining the photophysical response and, consequently, the transport properties of most organic and hybrid materials. Although, LR-TDDFT/BSE approaches have been successfully employed to investigate the photophysical response of MOFs,167–171 COFs,141,172–174 and perovskites,130,142,175–182 to the best of our knowledge, none of the existing methodologies simultaneously take into account aggregation, electronic coupling, strong electron–phonon coupling, and crystalline disorder on equal footing.
An exact treatment of electron–phonon coupling is a pressing challenge since the Hilbert space for most quantum systems grows exponentially with increasing system size and number of molecules. Overcoming this computational complexity involves the inevitable approximation of sacrificing the quantum description of the nuclei, which reduces to treating the nuclear motion adiabatically by employing the Born–Oppenheimer approximation (BOA). First-principles calculations based on the BOA such as finite differences and density functional perturbation theory have been used to interpret optical properties, charge transport, and defects in semiconductors.183 However, this perspective highlights photophysical processes in which the nuclear vibrational kinetic energies are not negligible and undergo rapid nuclear reorganization, which therefore necessitates the explicit inclusion of nuclear quantum effects and, consequently, invalidates the BOA. In this regard, it should be noted that excellent non-adiabatic approaches, including mixed quantum-classical descriptions, have been successfully employed to investigate the photophysical processes and excited state dynamics of various systems.184–189
Coarse-graining is another efficient strategy to quantitatively describe electron–phonon coupling in large, non-rigid “vibronic” systems. Since the pioneering work by Drude,190,191 Sommerfield,192 Hubbard,193 Heisenberg,194 Holstein195,196 among others, coarse-grained tight-binding model Hamiltonians have been successfully employed to investigate the electronic, optical, and transport properties of semiconducting materials.104–106,197–201 The major approximation typically employed in tight-binding modeling involves simplifying the complicated many-body electronic system to an one-electron or single orbital model. In Holstein-based approaches, another major simplification is the harmonic oscillator approximation which considers the nuclear displacements as coupled quantum harmonic oscillators. Such simplifications are however not sufficient for practical applications, since the exact diagonalization becomes computationally intractable for large “vibronic” systems, which is the focus of this perspective. For example, the Holstein model can be exactly solved only for a few sites. Besides various approaches proposed in the literature to address this problem, including hierarchial equations of motion,202–205 one potential solution is to specifically choose an accurate basis set for the diagonalization of the Holstein Hamiltonian. In this context, the multiparticle basis set, pioneered by Philpott,206 developed and glorified by Spano,146,147,207–209 and employed by others210–215 has proved to be an excellent choice for diagonalizing the Holstein Hamiltonian. Multiparticle modeling of the Holstein Hamiltonian quickly becomes computationally expensive with increasing dimensions of the material unit cell, which is particularly relevant in the case of porous frameworks such as COFs and MOFs. In this context, taking advantage of sparse matrix techniques and MPI parallelization on multinode clusters, we have shown that it is possible to extend the application of multiparticle modeling to large “vibronic” 3D systems, with negligible loss of accuracy.216,217
The article is organized as follows: in Section 2 we briefly discuss the MHF. Section 3 highlights the photophysical signatures of Frenkel, charge-transfer, and Wannier–Mott excitons in organic (polymers and COFs) and hybrid (MOFs and perovskites) materials. The role of “excitonic polarons”, i.e., excitons dressed with intramolecular vibrations is also discussed. Special emphasis is placed on understanding how several factors, such as the nature of aggregation, packing arrangement, particle size, relative humidity, and defects determine the UV-vis to near-IR spectral response of donor–acceptor (D–A) COFs. The exciton fine structure observed in layered perovskites, which is a topic of considerable speculation,152,218–220 is also discussed. Section 4 focuses on the importance of mid-IR photophysical response of polarons and the correlations between mid-IR signatures and polaron coherence lengths. The similarity in the spectral response of polarons in polymers, COFs, MOFs, and perovksites is highlighted, and relevant factors affecting charge transport are reviewed. It is a daunting task to provide a comprehensive review that includes all relevant references on photophysical processes observed in organic and hybrid materials and this perspective only focuses on select photophysical signatures that are intriguing from the point of view of the MHF. Although previous reviews and perspectives have separately focused on optoelectronic processes in organic and hybrid materials,144,221–226 to the best of our knowledge, no prior studies have attempted to provide an interpretation of the photophysical signatures of both organic and hybrid organic–inorganic materials using a common theoretical platform – the Multiparticle Holstein Formalism.
2 Theoretical framework
The Multiparticle Holstein Formalism (MHF) is based on coarse-grained Holstein-style Hamiltonians in which electronic coupling, electron–phonon coupling, electrostatic interactions, and different forms of long- and short-range defects are treated on “equal footing” without invoking the BOA. The key advantage of the MHF is the nonadiabatic treatment of the electron–phonon coupling which allows for a fully quantum-mechanical treatment of both the kinetic and potential energies of the nuclei, thus bypassing the conventional BOA. The creation of neutral excitations (e.g., excitons) or charged excitations (e.g., polarons) in conjugated organic molecules, which are active components in MOFs, COFs, and oligothiophene based perovskites, is accompanied by significant nuclear relaxation, the bulk of which occurs along the aromatic to quinoidal stretching vibrational mode having a frequency that lies in the range between 0.15 eV and 0.18 eV.147,207,227 This local nuclear relaxation energy plays a central role in the photophysical and transport properties, examples of which will be discussed in the context of COFs, MOFs, and 2D perovskites later in the perspective. What truly distinguishes our approach is an essentially exact (albeit numerical) treatment of the Holstein Hamiltonian using a multiparticle basis set206 to obtain accurate eigenstates and energies important for the construction of absorption (and PL) lineshapes. The Hamiltonian can be modified to include different forms of electronic and structural defects which are ubiquitous in light absorbing semiconducting materials. The MHF has been very successful in accounting for the spectral properties of molecular aggregates and crystals,145,147,207,210,211,227,228 conjugated polymers,229–241 COFs,216,217 and layered perovskites242 in the mid-infrared (mid-IR) and UV-vis spectral regions.2.1 Frenkel exciton
In the subspace containing a local Frenkel excitation (see Fig. 1a), where the nth repeat unit in the lattice denoted by |n〉 hosts an electron–hole pair (i.e., a Frenkel exciton), the Hamiltonian (with ℏ = 1) can be divided into electronic and vibronic contributions,| HFE = HFE-el + HFE-vib | (1) |
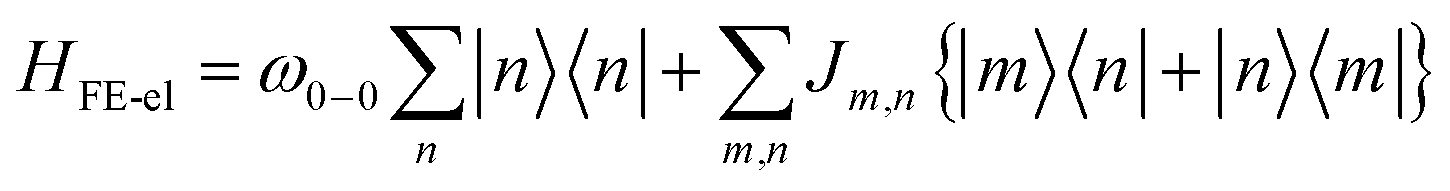 | (2) |
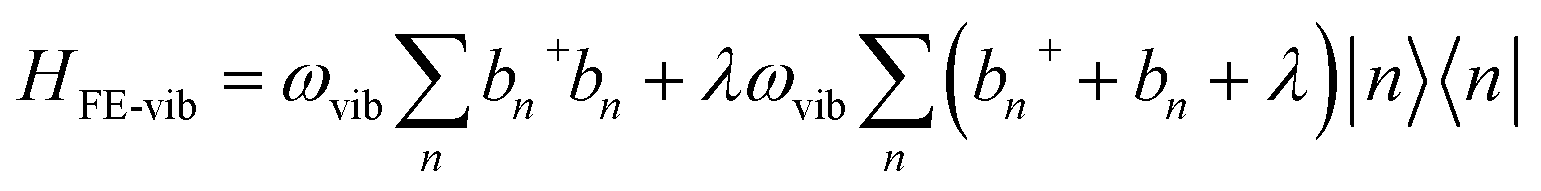 | (3) |
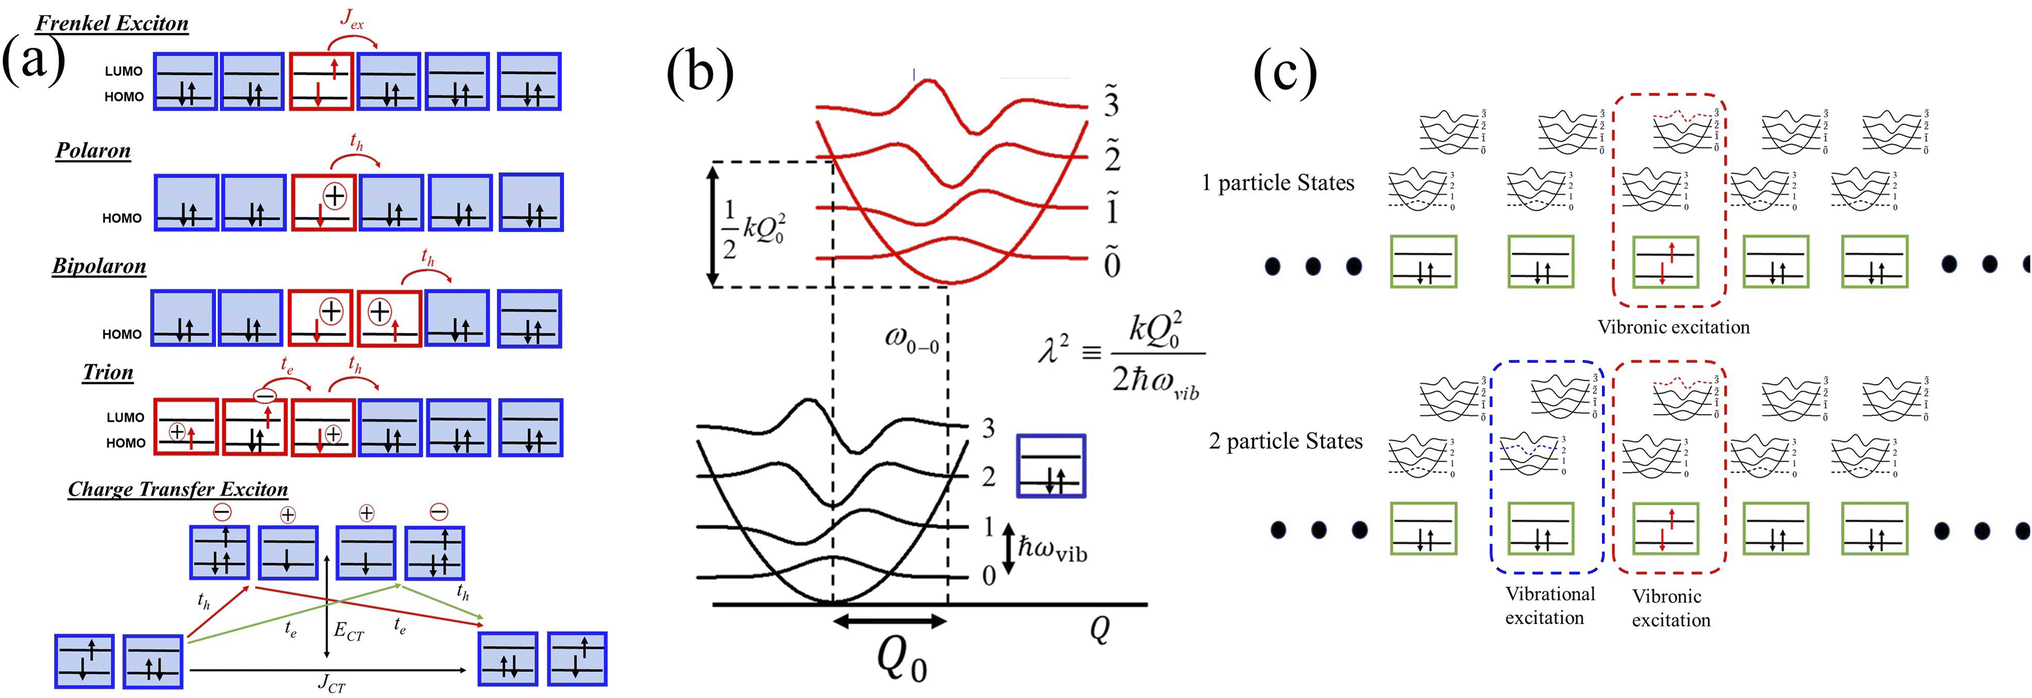 | ||
| Fig. 1 (a) Simplified view of various forms of neutral and charged excitations. (b) Nuclear potential well corresponding to the aromatic to quinoidal stretching mode, Q, in the ground and excited electronic states for each isolated molecular unit. ωvib refers to the vibrational energy and the nuclear relaxation energy is denoted by λ2ωvib. (c) Schematic showing one-particle states, i.e., vibronic excitations (top panel) and two particle states, i.e., vibronic/vibrational exciton pair. | ||
In eqn (2), the first term represents the energy of the Frenkel exciton. Exciton transport between neighboring sites |n〉 and |m〉 is governed by long-range intermolecular Coulomb coupling as well as a short-range superexchange contribution which mainly arises due to wavefunction overlap between the adjacent chromophores. The coupling values are generally derived from atomic transition charge densities and can be calculated using TDDFT methods.243–246 Upon electronic excitation, Frenkel excitons in π-conjugated organic molecules couple very strongly to the aromatic to quinoidal vibrational mode, ωvib, with frequency in the range between 1200 and 1500 cm−1. The two terms in eqn (3) account for the vibronic coupling where the operators create (annihilate) a vibrational quantum of energy on the nth unit in the ground state (S0) of the corresponding potential energy well. The strength of the electron–phonon coupling is governed by the Huang–Rhys (HR) factor, λ2, and the nuclear relaxation energy upon vertical Franck–Condon excitation is given by λ2ωvib. λ2 is a dimensionless quantity that determines the relative displacement of the minima of the ground and excited potential well along the intramolecular vibrational coordinate (Fig. 1b). In the case of excitons in conjugated polymers, the value of λ2 generally lies between 1 and 2.240
2.2 Charge-transfer exciton
In closely packed structures, such as polymers, COFs, and MOFs, where the inter-chain/inter-framework π-stacking distances lie in the range between 0.30 nm and 0.40 nm, there exists significant π-orbital overlap between the HOMO and LUMO of neighboring π-conjugated units. In such circumstances, local Frenkel excitations dissociate into charge-transfer states, with the electrons and the holes residing on neighboring units, as shown schematically in Fig. 1a. As a consequence, considering only long-range intermolecular Coulomb coupling is not sufficient to accurately describe the underlying physics of the system, and short-range superexchange contributions arising from wavefunction overlap need to be considered. To account for the role of intermolecular charge-transfer, the Frenkel–Holstein Hamiltonian described in eqn (1) can be extended and the total Hamiltonian is given by| Htotal = HFE + HCT | (4) |
| HCT = HCT-el + HCT-vib | (5) |
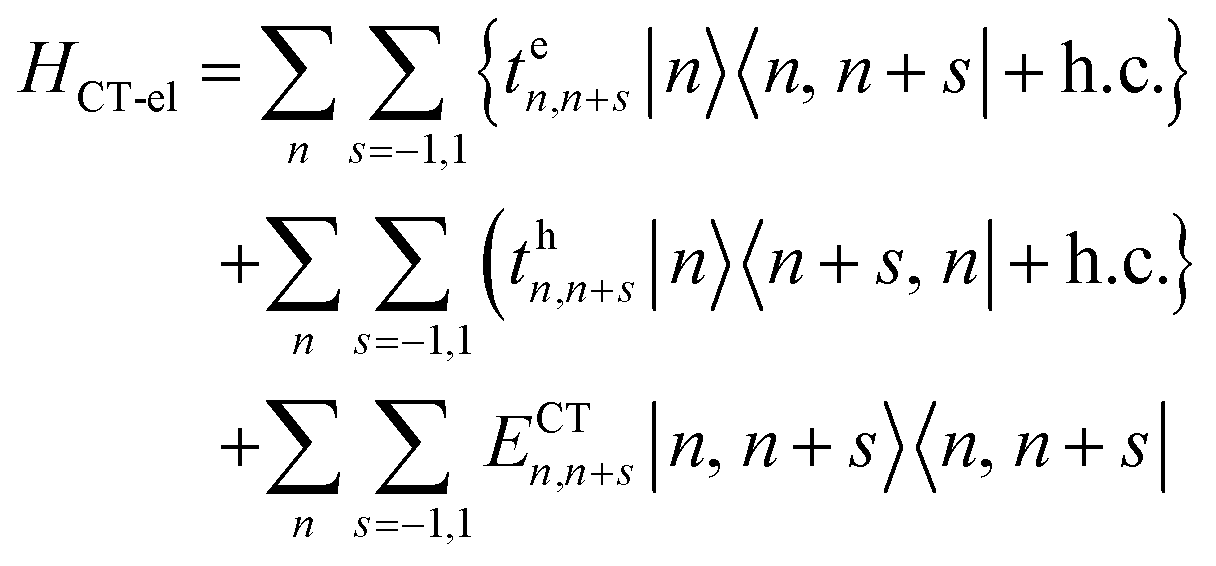 | (6) |
 | (7) |
2.3 Polaron
Analogous to the case in Frenkel excitons, eqn (1) can also be efficiently used to describe polarons. Unlike in the case of excitons, where the nth unit in eqn (2) denotes an electron–hole pair, the nth unit for polarons in eqn (2) indicates a charge as shown in Fig. 1a. In addition, differently from excitons, in the case of polarons, charge transport between sites |n〉 and |m〉 is primarily governed by the charge resonance integral, tm,n, which can be evaluated by electronic structure methods.247,248 Finally, while the exciton model retains the local HOMO and LUMO for each site |n〉, only the local HOMO for each repeat unit, |n〉, is retained in the case of polarons, as shown in Fig. 1a. For both excitons and polarons, the first term in eqn (2) determines the energy of the excited state of the isolated unit which hosts the exciton/polaron relative to the ground state which contains no excitons or polarons. In the case of excitons, ω0–0 in eqn (2) refers to the adiabatic energy required to create an electron–hole pair, while in the case of polarons, ω0–0 refers to the ionization energy required to create the hole. However, just like in the exciton model, creation of polarons is also accompanied by significant nuclear relaxation along the dominant aromatic-quinoidal stretching coordinate. The value of λ2 in the case of polarons is approximately half of the exciton value.2492.4 Multiparticle basis set
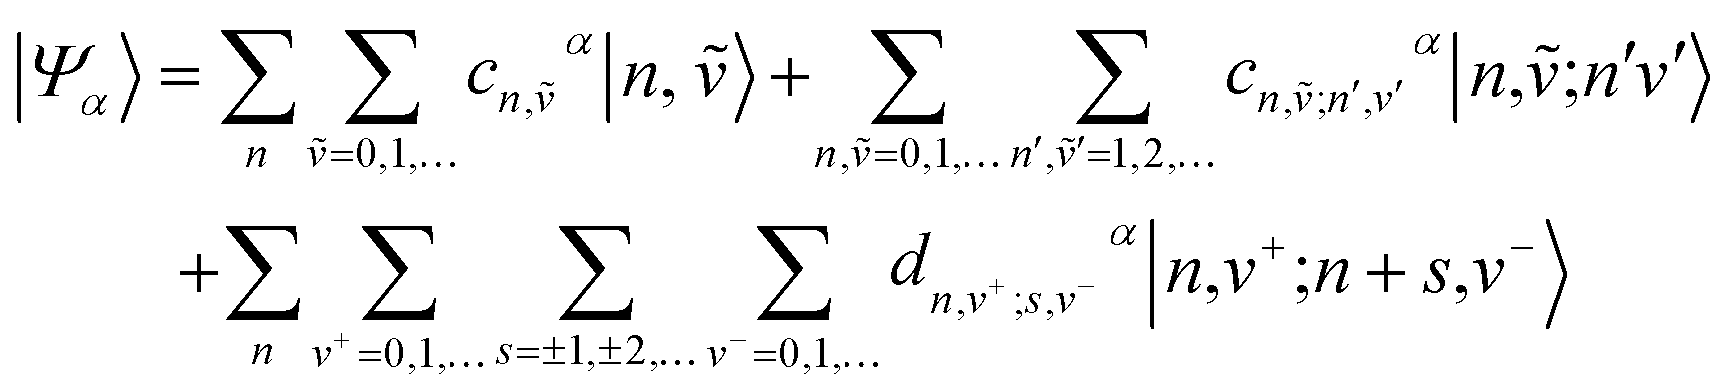
The main computational challenge is to obtain accurate eigenstates of the Holstein-based Hamiltonians in light of an essentially infinite basis set arising from an unlimited number of allowed vibrations. The “trick” is to zero in on the sub-basis which accurately represents the optically allowed states and build in additional basis functions in a systematic manner. To this end, we can employ a multiparticle basis set, in which the basis set can be truncated to include all one-, two-, …, s-particle states.206 In the multiparticle approach, each basis function contains information about the location of the vibronically excited chromophore as well as additional purely vibrationally excited molecules.A single-particle basis state which can either be a single hole or a single exciton (Fig. 1a), is denoted as |n, ṽ〉 to indicate that the hole or the exciton resides on the nth unit with a ṽ vibrational quanta in the shifted (S+) potential well (Fig. 1c). All the remaining units are in their vibrationless ground states, which implies that the units have filled HOMOs with no vibrations in the S0 well. In a two-particle basis state, denoted as |n, ṽ; n′v′〉, the nth unit is ionized with ṽ vibrational quanta in the S+ potential well, while the unit at n′ is electronically neutral, with v′ > 0 vibrational quanta in the unshifted S0 potential well. All the remaining units are in their vibrationless ground states. Three, four, and higher particle states with three or more monomer excitations (electronic plus vibrational) can also be included. As expected, the basis set grows exponentially with increasing number of units. Fortunately, for most practical applications, accurate solutions of the Holstein-style Hamiltonians can be obtained by truncating the multiparticle basis set to contain only one and two particle states. The total number of vibrations, vmax, is capped to a maximum of 4 which is sufficient to obtain converged absorption and emission spectra.227,250
Within the two particle approximation, the eigenstates of the Hamiltonian in eqn (4) can be expanded in the local multiparticle basis set composed of both Frenkel and CT multiparticle states basis as
 | (8) |
The multiparticle basis set can be similarly extended to describe correlated multiple excitations such as bipolarons,251 biexcitons, trions, tripolarons, which are currently under investigation. It should be noted that the multiparticle basis set is not a convenient basis set in the regime of strong electronic coupling since it requires the inclusion of higher particle states. In such scenarios, the exciton–phonon basis set, which has been successfully employed in earlier studies,213,252–254 is a more appropriate basis set.
2.5 Defects
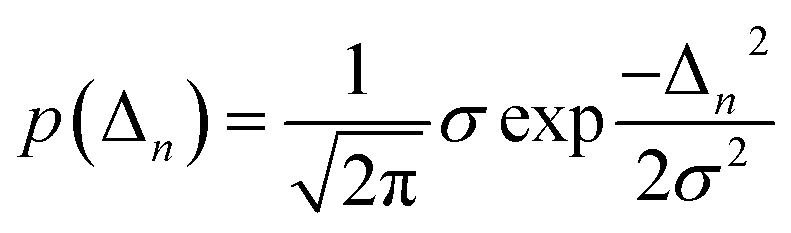
Inhomogeneous polarizing environments such as structural and lattice imperfections, that is ubiquitous in most organic and hybrid materials, can localize quasiparticles (i.e., electrons and holes) in deep traps. Different forms of common inhomogenities in materials can arise from variations in nearest-neighbor π-stacking distances and torsional angles within the functional groups of the molecular building blocks. Static defects in materials can be efficiently described by considering random distribution of Gaussian site energy fluctuations having a standard deviation σ.255 The presence of defects in most materials have a profound effect on the spectral signatures and charge transport properties of organic and hybrid materials, and can be accounted phenomenologically by incorporating diagonal and off-diagonal disorder in the model. The effective Hamiltonian describing defects can be written as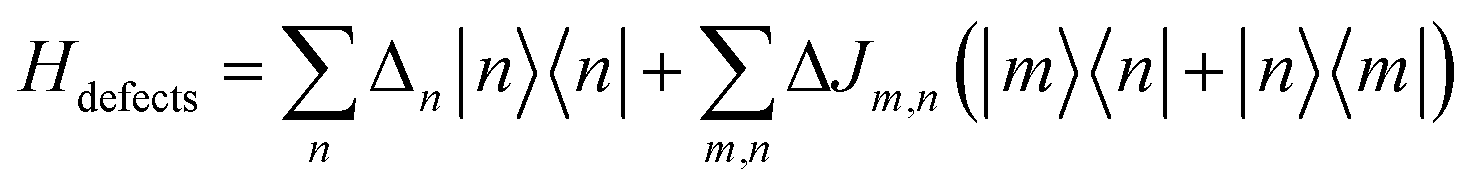 | (9) |
 | (10) |
Similarly, ΔJm,n refers to random deviations in the electronic couplings which arise due to random changes in the separation between neighboring units. As detailed in ref. 229 and 250, the degree of disorder can be spatially correlated with the two extreme limits being long-range (i.e., infinite spatial correlation) and short-range (i.e., no spatial correlation). In the limit of short-range disorder, for every disorder configuration, every unit in the lattice is assigned a random energy from a Gaussian distribution having standard deviation σ (eqn (10)). In the opposite extreme of long-range disorder, within each disorder configuration, all the units in the lattice are assigned identical energy detunings. Knapp have further shown that the long- and short-range disorder can be distinguished by tuning the spatial correlation length.256
2.6 Absorption
Since the discussion in Sections 3 and 4 is focused on excitonic and polaronic photophysical signatures in organic and hybrid materials, we briefly discuss the absorption in the far to mid-IR and UV-vis spectral region. For both Frenkel excitons (FE), and polarons (p), the absorption spectrum corresponding to an ensemble of disordered lattice sites is generally expressed as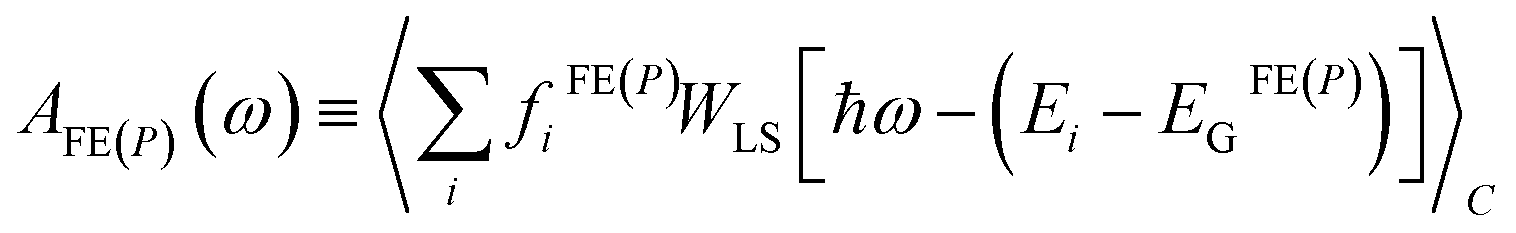 | (11) |
fiFE(P) = (Ei − EGFE(P))|〈ψi|![[M with combining circumflex]](https://www.rsc.org/images/entities/i_char_004d_0302.gif) FE(P)|GFE(P)〉|2 FE(P)|GFE(P)〉|2 | (12) |
3 Photophysics of excitons
3.1 Excitons in COFs
Several research groups have successfully employed the strategy of aligning donor (D) and acceptor (A) building blocks in order to modulate the optical, electronic, and transport properties of various COF structures. Since providing a comprehensive review of the optical properties of D–A COFs is not the goal of this section, we only focus on selected photophysical signatures in the UV-vis energy region and emphasize direct correlations between the spectral features and potential applications including photothermal activity, electrochromism, light harvesting, framework stability, nature of aggregation, and energy and charge transport. Within this context, an important research question can be raised: is it possible to unravel the complex interplay among electronic coupling, vibronic coupling, electrostatic interactions, and different forms of defects through the interpretation of well defined spectral signatures? More specifically, can distinct spectral signatures be identified that can be used as efficient screening protocols for synthesizing new COF-based structures for desired applications?While 2D COFs are usually described as eclipsed layered structures, experimental and computational studies have provided convincing evidence that the layers are slightly offset from one another.266–273 Moreover, relatively broad peaks in the powder X-ray diffraction patterns do not rule out the possibility of small offsets in the inter-layer stacking arrangement.274 Within this context, highly crystalline solid-state J-aggregate imine-linked COFs, which not only enable prolonged lifetime of singlet excitons but also facilitate exciton delocalization and stabilization of the excited species, have been synthesized by the Bein group.275 The incorporation of porphyrin and thienothiophene units as molecular building blocks result in the formation of J-aggregate stacks having unprecedented COF domain sizes (up to 100 nm). H-aggregate COFs exhibiting high charge mobility have also been reported.257
Apart from the usual Kasha signatures predicting aggregation-induced spectral shifts between coulombically coupled chromophores, additional vibronic signatures to differentiate between H- and J-aggregates were introduced by Spano.146 More specifically, it was shown that the ratio of the first two vibronic peaks referred to as A1 (0–0) and A2 (0–1) decreases with increasing exciton bandwidth for H-aggregates but increases for J-aggregates.146 While long-range intermolecular Coulomb coupling predicts aggregation-induced blue and red shifts for H- and J-aggregates, respectively, such a scheme breaks down in closely π-stacked systems, due to significant wavefunction overlap and the emergence of short-range intermolecular charge transfer (ICT) between the neighboring chromophores.145,227 In such scenarios, assigning the type of aggregation based on spectral shifts may be misleading, and the nature of aggregation can be reliably predicted from the evolution of the vibronic signatures in the UV-vis absorption and emission lineshapes. Theoretical simulations based on the Hamiltonian shown in eqn (4) that explicitly includes short-range ICT have showed that the interference between long-range Coulomb coupling and short-range superexchange contributions result in a rich array of possible aggregate types (HH, HJ, JH, and JJ type aggregates) with contrasting photophysical signatures and transport properties.145 HJ type aggregates in particular has been extensively investigated in the case of conjugated polymer films and molecular aggregates.276–284
The experimental realization of H- and J-type aggregation have been observed in COF-5 that exhibits large exciton diffusion lengths.140 While a red shift was observed in the absorption spectrum of COF-5, which indicates J-type aggregation, the change in vibronic ratios in the emission spectrum suggested a H-type coupling.140 H and J aggregation have also been reported in TAT COF, which was described as non-fluorescent J-type class of aggregates.141
Coexistence of H and J aggregation in COFs have been previously observed in literature, but have not been discussed in detail to date. For example, perfectly stacked COF structures were synthesized by the Jiang group by combining phthalocyanine units with benzene diboronic acid.257 Owing to the well-ordered arrangement of the π-stacked phthalocyanine units, NiPc COF exhibits enhanced light-harvesting capability in the visible and near-IR spectral regions, which facilitates efficient charge carrier transport. Although referred to as H-aggregate, the UV-vis absorption spectrum of NiPc COF displays J-type vibronic signatures. In particular, the absorption band (“B” band) of NiPc COF (Fig. 2a) at 380 nm is blue-shifted by 32 nm compared to the monomer precursor [(MeO)8PcNi]. Although this blue shift indicates the formation of phthalocyanine H-aggregates within the stacked COF structure, the Q bands of the NiPc COF, which are observed at 635 and 686 nm, are red-shifted by 12 nm from those of the [(MeO)8PcNi] monomer. More importantly, the ratio of the intensities of the 0–0 and 0–1 vibronic peaks is larger in the case of the NiPc COF compared to the monomer (Fig. 2a), which is a well defined signature of J-type aggregation.285
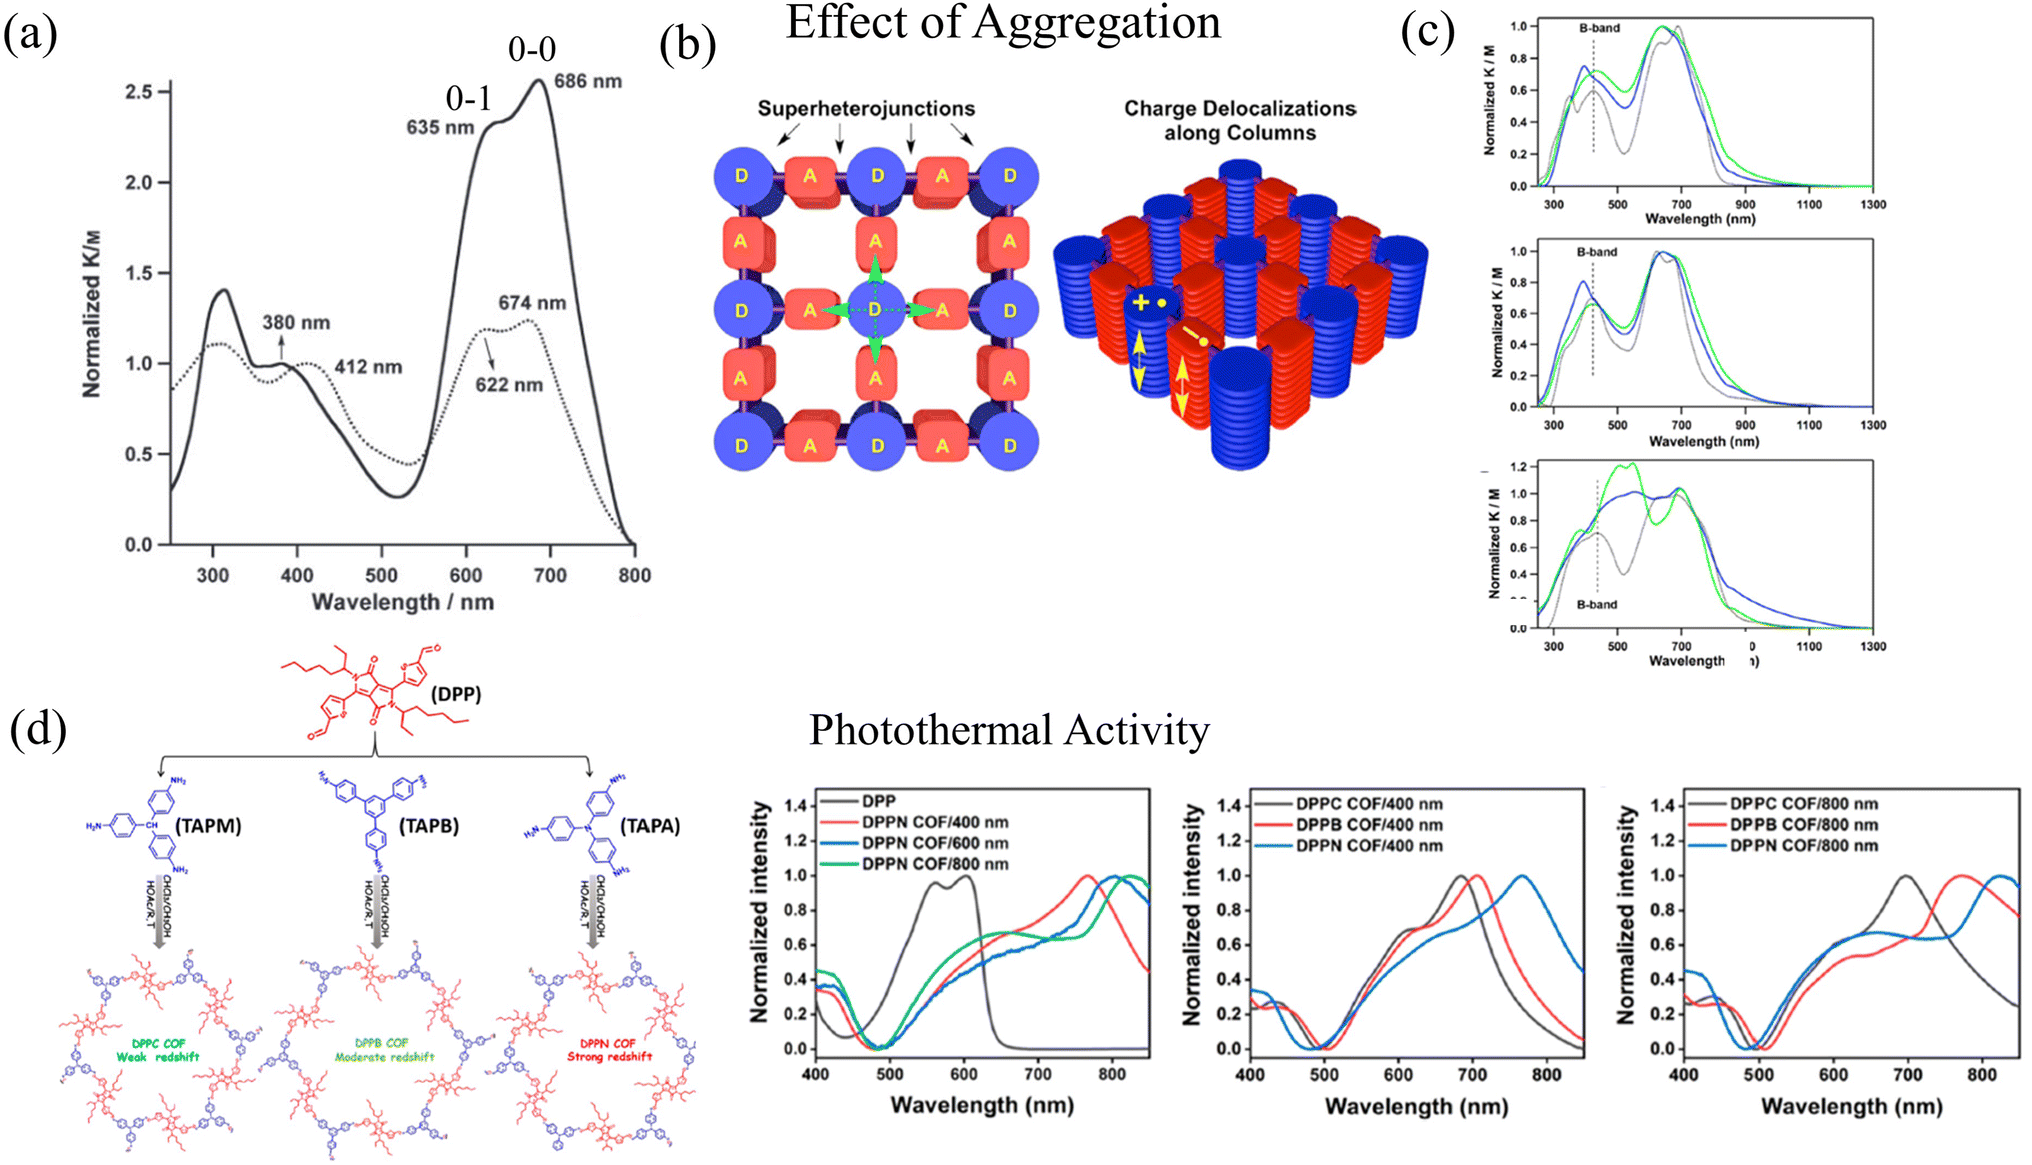 | ||
| Fig. 2 (a) H- and J-type bands observed in UV-vis absorption of NiPc COF (solid black). Although referred to as H-aggregates, the ratio of the intensities of the vibronic peaks I0–0/I0–1 is greater in NiPc COF compared to the (MeO)8PcNi monomer (dotted black) suggesting J-type aggregation.257 Copyright 2011 John Wiley & Sons, Inc. (b) Schematic of segregated bicontinuous π-columnar arrays observed in COFs.258 (c) UV-vis observation observed in DMPc–ADI COFs also display H- and J-type signatures in the UV-vis.258 (d) UV-vis absorption of DPP-based donor–acceptor COFs directly correlates with the COF particle size.47 (b) and (c) Reprinted with permission from ref. 258. Copyright 2015 American Chemical Society. (d) Reprinted with permission from ref. 47. Copyright 2021 American Chemical Society. | ||
In ref. 258, the Jiang group used electron-donating metallophthalocyanines and electron-accepting diimide derivatives as building blocks for the synthesis of D–A COFs (Fig. 2b), resulting in the formation of “super-heterojunctions” that display long-lived charge separation and exhibit remarkable photochemical properties. Compared to the phthalocyanine monomeric units, the UV-vis absorption measurements of the COF structures (DCuPc–APyrDI) displayed blue-shifted B bands, indicating H-aggregation. On the other hand, a red shift was observed in the low energy absorption bands of the COF structures compared to the imide building blocks, indicating J-aggregation (Fig. 2c). From the experimental observations, it was concluded that the COF structure is able to merge the absorption of the separate building blocks, which results in a broader absorption profile. However, in-depth theoretical investigations may provide deeper insights since perylene diimide (PDI) aggregates alone display two asymmetrically broadened absorption bands on transformation from one aggregate form to the other, with one band being red shifted and the other being blue shifted relative to the absorption of the monomeric unit.228,286–291
In this context, the steady state absorption and emission spectra of two PDI derivatives were theoretically investigated using the Frenkel–CT/Holstein Hamiltonian in ref. 243. The Frenkel–CT/Holstein Hamiltonian shown in eqn (4) was able to reproduce the salient spectroscopic signatures of both the PDI derivatives. The authors concluded that the band splitting observed in PDI aggregates primarily arises due to the coupling between Frenkel and charge-transfer excitons in the resonant regime, which is driven by intermolecular electron and hole transfer. Theoretical investigations based on the MHF in ref. 243 also shed light on how the vibronic spectral features of the two main bands in the UV-vis absorption of PDI aggregates are governed by the interplay between long-range Coulomb coupling and short-range superexchange CT-mediated couplings. Hence, to obtain a detailed understanding of the factors that govern the photophysical response of COFs, it is important to simplify the problem by reducing the frameworks into their isolated monomeric components, which would allow for a systematic analysis of the evolution of the UV-vis spectral signatures from the isolated monomeric units to the aggregated monomers and 3D frameworks.
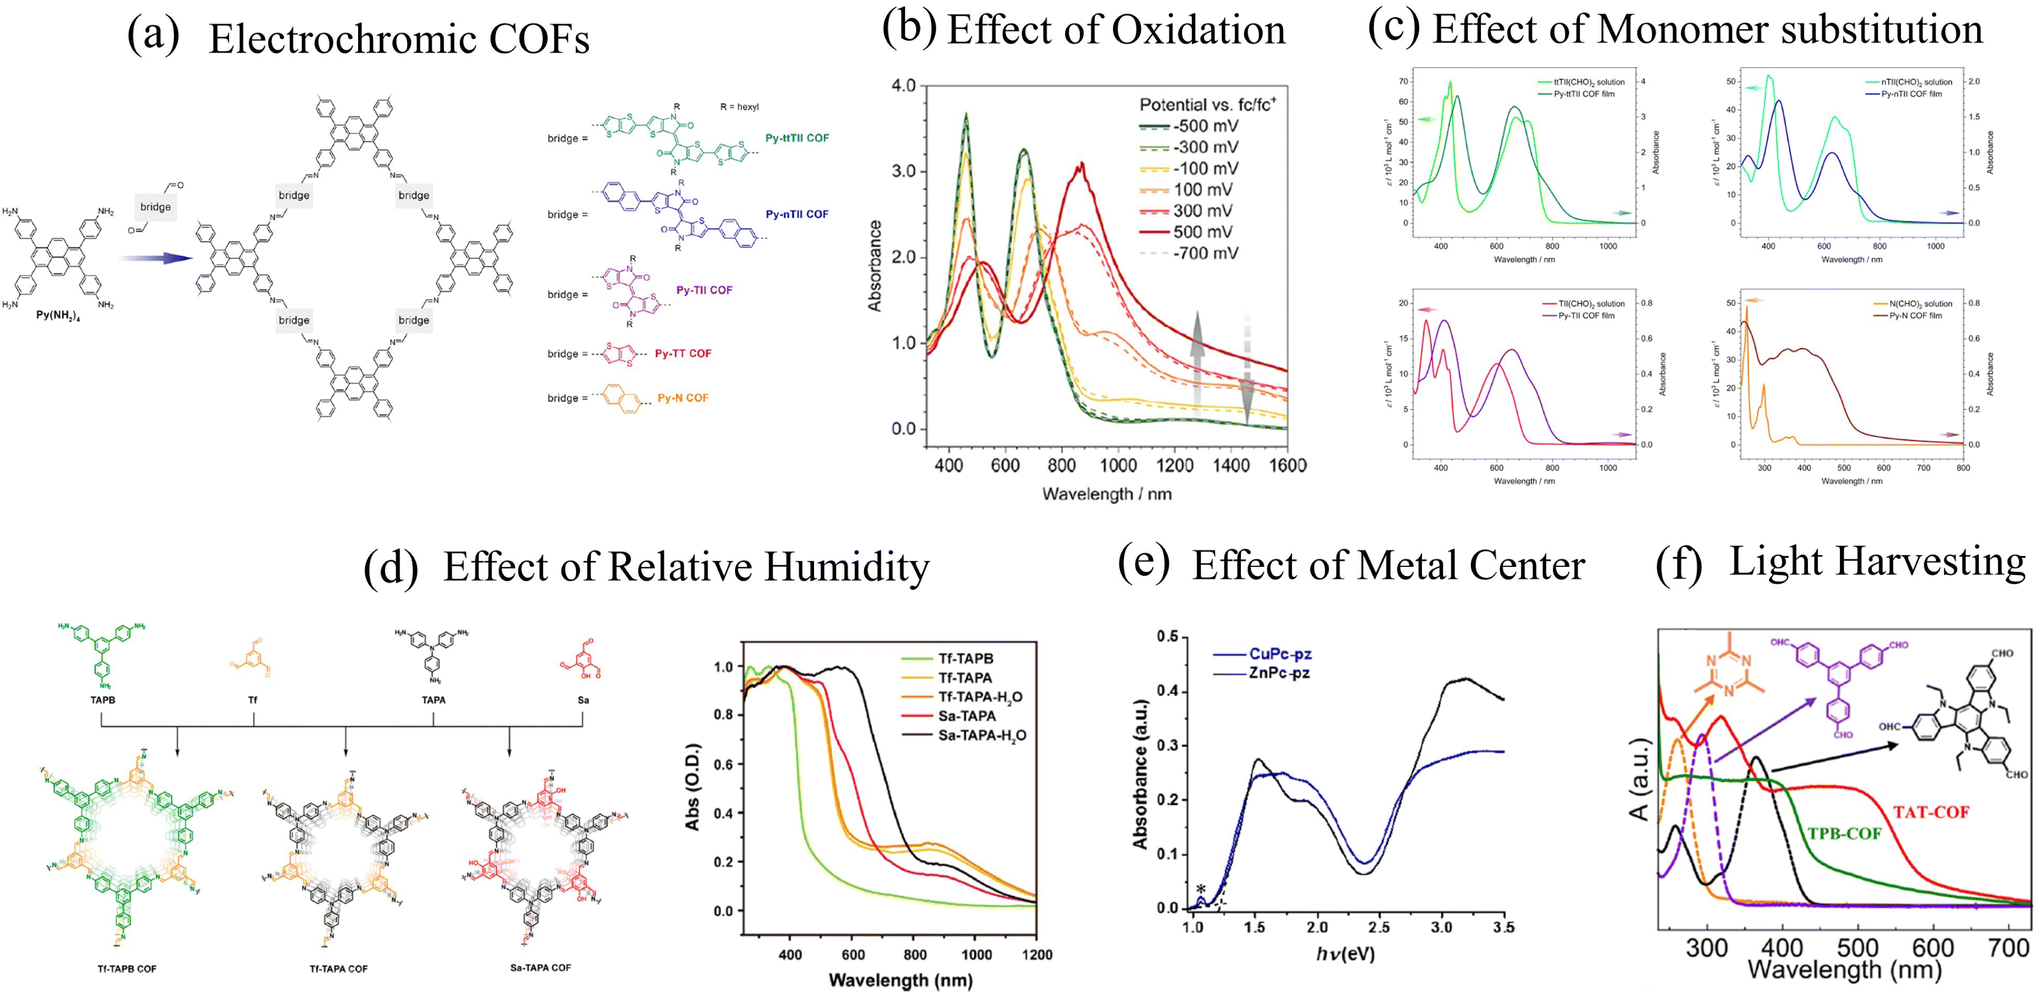 | ||
| Fig. 3 (a) Example of electrochromic COFs synthesized by the Bein group.292 UV-vis spectral features of D–A COFs as a function of (b) oxidation,292 (c) monomer building blocks,293 (d) relative humidity,294 and (e) metal centers.295 (f) UV-vis absorption spectrum of highly emissive D–A COFs.141 (a) and (b) Reprinted with permission from ref. 292. Copyright 2021 American Chemical Society. (c) Reprinted with permission from ref. 293. Copyright 2017 American Chemical Society. (d) Reprinted with permission from ref. 294. Copyright 2018 American Chemical Society. (e) Reprinted with permission from ref. 295. Copyright 2019 American Chemical Society. (f) Reprinted with permission from ref. 141. Copyright 2021 American Chemical Society. | ||
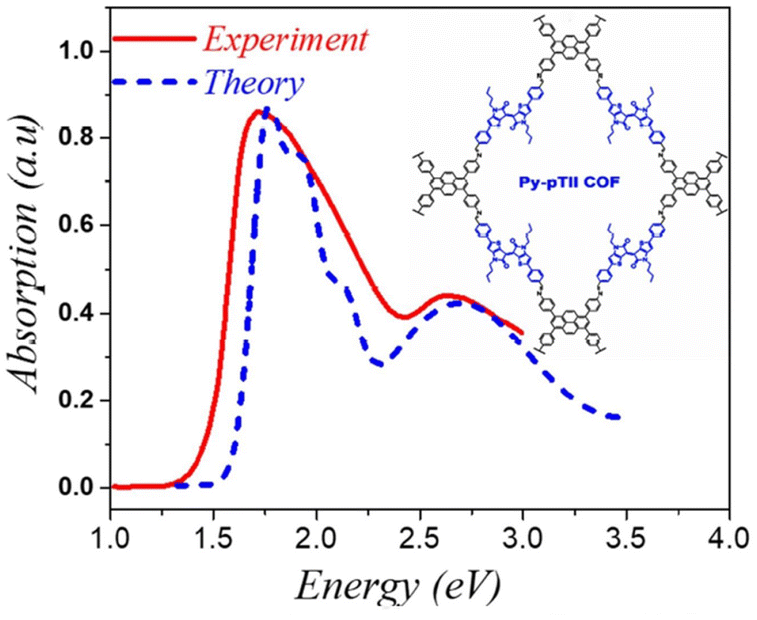 | ||
| Fig. 4 Comparison of the simulated spectrum using the MHF with the measured absorption spectrum of py-ptII COF replotted from ref. 293. | ||
Analogous to the case in 1D copolymers,285 good agreement between the measured and simulated absorption spectrum of py-ptII COF was obtained using a single chain having a donor–acceptor–donor (DAD) alternate sequence of coupled chromophores. A comparison between the experimental absorption spectra of py-ptII COF and PffBT4T copolymer285 reveals that the spectral features in both py-ptII COF and PffBT4T copolymer are quite similar. However, unlike in the case of PffBT4T, the absorption spectrum of the py-ptII COF does not display the pronounced vibronic structure in the low-energy Q band. The vibronic features in py-ptII COF are most likely obscured due to the presence of inherent electronic and structural defects.
The close similarity between the absorption spectra of py-ptII COF and PffBT4T copolymer also suggests that inter-framework interactions may be of secondary importance in the case of py-ptII COF. However, some caution should be used before generalizing this conclusion to all D–A COFs since other factors might determine the optical properties of COFs. For example, the physical mechanisms responsible for the emergence of a featureless peak centered at ∼630 nm (Fig. 2d), which broadens with increasing COF particle size or increasing electron donating ability of the monomer units in DPP-based COFs,47 are not well understood. In addition, while most D–A COFs usually display two absorption bands, such spectral signatures disappear in the case of Py-N COF (Fig. 3c),292 TAT-COF (Fig. 3f), and TPB-COF141 where the usual two-band spectrum is replaced by a much broader featureless peak. Finally, unlike the usual assumption that the low (high) energy band can be readily attributed to intermolecular charge transfer (π–π* transition), our theoretical analysis indicates that both the bands have partial CT character and arise from the efficient mixing between Frenkel- and CT-type excitations.285
As emphasized throughout this section, COFs display exotic photophysical signatures that are extremely sensitive to various factors, including the nature of the building blocks, relative humidity, inter-layer packing arrangement/type of aggregation, particle size, and defect density. UV-vis spectroscopic features significantly vary depending on the type of COF structure (see Fig. 2 and 3). Unlike most COFs that do not display vibronic structure in either of the two bands, NiPc COF exhibits a pronounced vibronic structure in the Q band as shown in Fig. 2a. The spacing between the two vibronic peaks in Fig. 2a is approximately around 1200 cm−1 which can be attributed to strong electron–phonon coupling involving the aromatic to quinoidal stretching mode. In order to elucidate structure–photophysics relationships in COFs, it is necessary to develop an in-depth understanding of the factors that govern the relative intensities of the B and Q bands, the separation between the maximum of the two absorption bands, the broadening of the bands, and the vibronic structure. It is equally important to investigate the role of Frenkel and charge transfer excitons as well as electron–phonon coupling on the photophysical signatures of various COF structures.Building upon the 3D Holstein polaron model that was recently developed to investigate the effect of defects, domain size, chemical doping, and topology on the mid-IR photophysical signatures and charge transport properties of COFs,216,217 future studies will go beyond a simple single chain analysis and focus on developing 3D vibronic exciton models for various COF topologies. Explicit inclusion of intra- and inter-framework electronic interactions, Frenkel and charge separated exciton states, and strong electron–phonon coupling on equal footing is necessary to investigate the spectral changes in both the UV-vis absorption and emission lineshapes of COFs. Furthermore, due to poor crystallinity and high defect density in COFs, it is necessary to incorporate the effects of different forms of structural and conformational defects in future studies.
3.2 Excitons in 2D perovskites
Unlike organic materials where Frenkel and CT excitons are the predominant form of excitations, photoexcitation of hybrid organic–inorganic materials such as 2D perovskites often result in the formation of Frenkel and Wannier–Mott excitons which are associated with the organic and inorganic components, respectively.299 While Frenkel excitons are bound electron–hole pairs localized on a single unit cell, Wannier–Mott excitons are characterized by a much larger Bohr radius and consist of an electron and a hole that can be tens of unit cells or molecules apart.300 Wannier–Mott excitons therefore experience a much smaller Coulomb binding energy (<100 meV) compared to Frenkel excitons (≈>500 meV).301 Since 2D perovskites consist of organic and inorganic building blocks, both Frenkel and Wannier–Mott excitons (may) co-exist upon photoexcitation.298,302The origin of the excitonic fine structure that is observed in the absorption and emission spectra of 2D perovskites152,153,218–220,296,297,303 is currently a topic of ongoing debate. Multiple equally spaced peaks are observed in the absorption and emission spectra of (PEA)2PbI4 as shown in Fig. 5a and b. Kagan and coworkers attributed the origin of the exciton fine structure, which has a spacing between 40 and 46 meV, to a vibronic progression arising from the coupling of the electronic transition to a distinct vibrational mode located in the organic cation (Fig. 5a).152,153,218,297 Similar spacings of 35 meV to 40 meV were observed at low temperature in the measured spectrum for (PEA)2PbI4 (Fig. 5c), and were attributed to distinct excitonic peaks by Silva, Srimath, and coworkers.219,220 The peak at approximately 40 meV in (PEA)2PbI4 have been attributed to Rashba splitting.304 A recent study has attributed the exciton fine structure observed in the photoluminescence spectrum of (PEA)2PbI4 to exciton-polaron emission.305
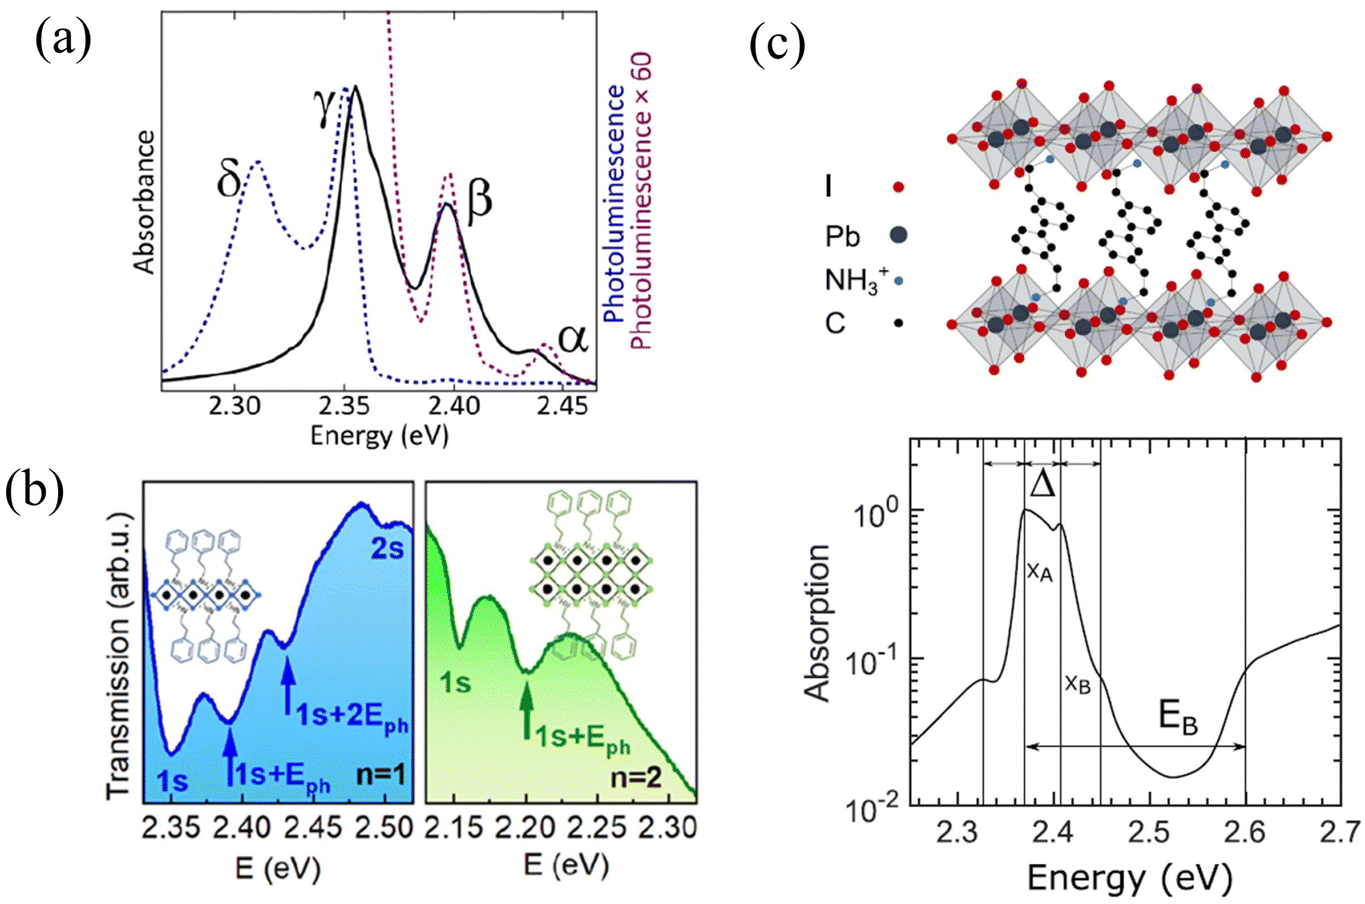 | ||
| Fig. 5 (a) Exciton fine structure observed in the absorption (solid black) and emission spectrum (dotted black) of phenethylammonium lead iodide.152 (b) Transmission spectra of n = 1 and n = 2 thin films of (PEA)2(CH3NH3)n−1PbnI3n+1 at 4 K.296 (c) Linear absorption spectrum of (PEA)2PbI4 at 5 K.219 (a) Reprinted with permission from ref. 152. Copyright 2016 American Chemical Society. (b) Reprinted with permission from ref. 296. Copyright 2020 American Chemical Society. (c) Reprinted with permission from ref. 219. Copyright 2020 American Chemical Society. | ||
Most perovskites synthesized to date incorporate small organic cations such as methyl-, phenethyl-, or butylammonium as organic spacers. Strauss, Kagan, and coworkers have extensively investigated the role of small organic cations in tailoring the electronic and optical properties of 2D lead halide perovskites.153,218,297 The authors demonstrated that single atom substitution on the organic cation dramatically alters the steady-state absorption and emission spectra as shown in Fig. 6a.153 It was also shown that longer organic cations are associated with greater energetic disorder which obscured the presence of the vibronic fine structure in the absorption and emission spectra (Fig. 6b), and resulted in a blue-shifted excitonic absorption.297 Mitzi and coworkers have synthesized perovskites that incorporate oligothiophene cations of various lengths to investigate the role of long and bulky organic components on the photophysical properties of lead halide perovskites.298,306 These perovskites incorporating longer organic cations have been referred to as “complex organic perovksites”.298
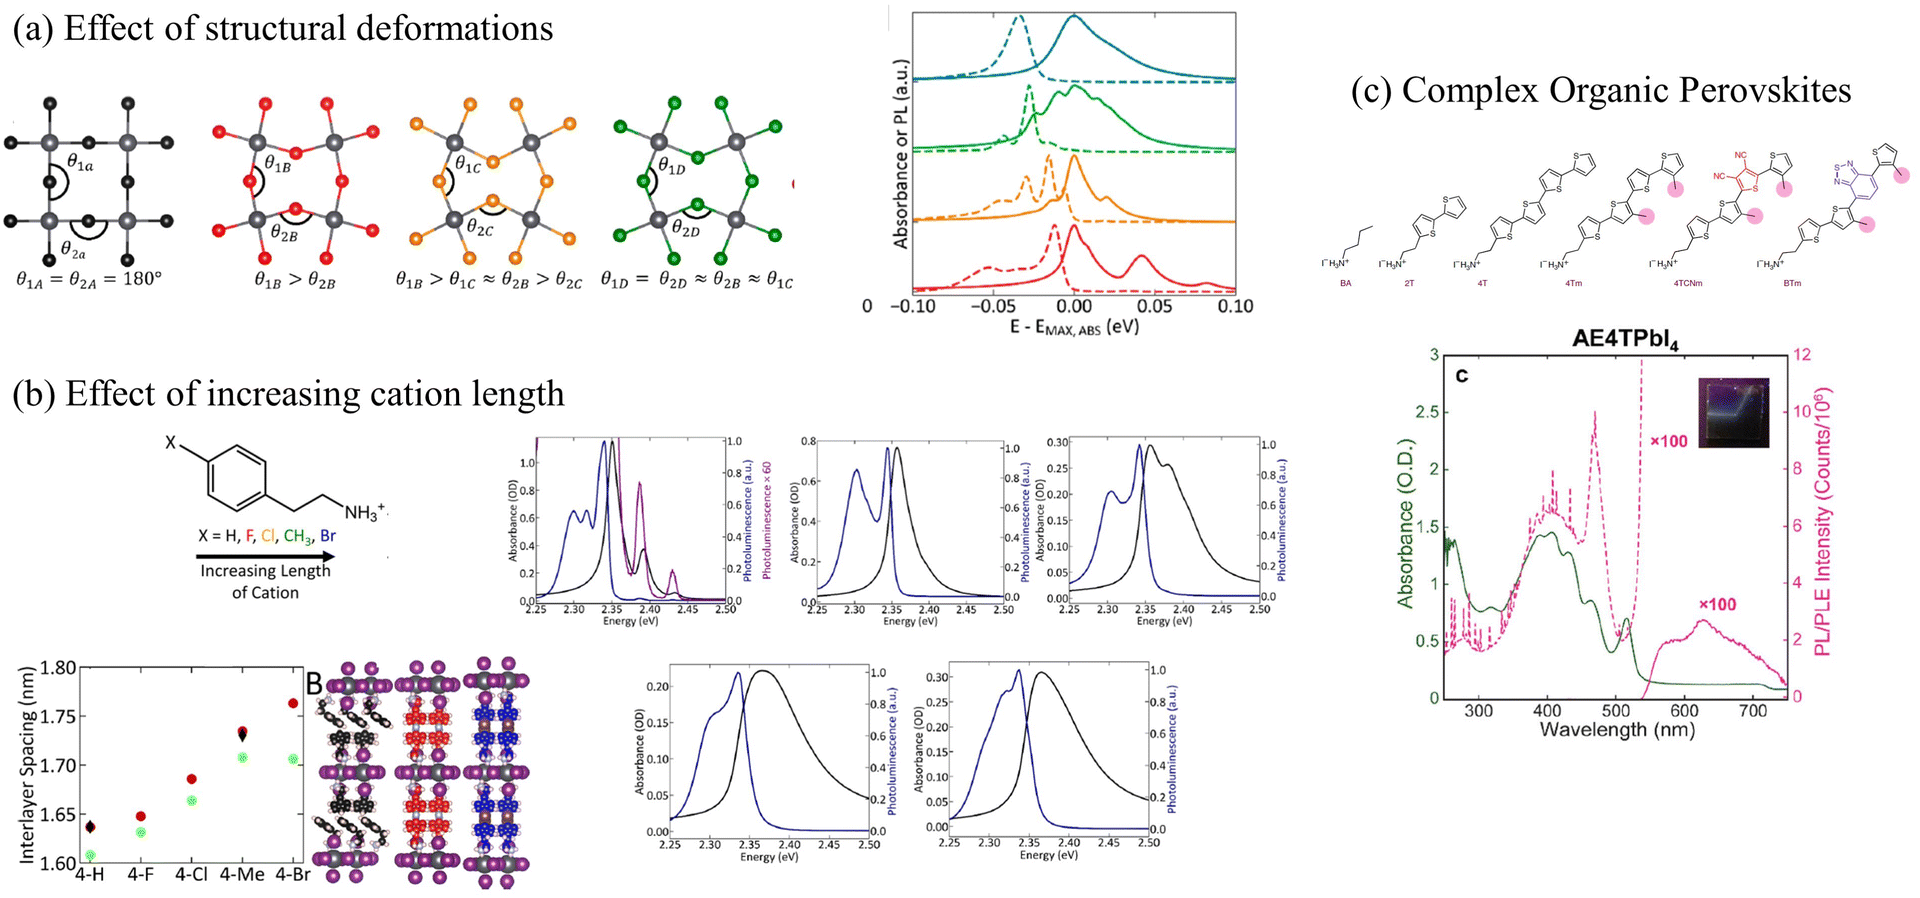 | ||
| Fig. 6 (a) The exciton fine structure in the UV-vis absorption and emission spectrum in perovskites changes as a function of structural deformation153 or (b) increasing length of the organic cations.297 (c) Vibronic progression observed in the UV-vis absorption spectrum of (AE4T)PbI4.298 (a) Reprinted with permission from ref. 153. Copyright 2020 American Chemical Society. (b) Reprinted with permission from ref. 297. Copyright 2019 American Chemical Society. | ||
In order to investigate the UV-vis photophysical signatures associated with the organic layers in (AE4T)PbX4 perovskites, eqn (1) was expressed for a 2D-herringbone lattice in ref. 242. The eigenstates of the Hamiltonian in eqn (1) was described by a multiparticle basis set by omitting the last term in eqn (8) (since CT excitations are not considered in this study). The unpolarized UV-vis absorption spectrum was obtained using eqn (11). Fig. 7 demonstrates that simulations using the MHF described in ref. 242 accurately reproduce the vibronic progression arising from the organic component in (AE4T)PbX4 (X = Cl, Br, and I).242 It was also found that the choice of the halide ion in the inorganic component plays a central role in determining the shape of the vibronic structure observed in oligothiophene based perovskites.242 The observed trends in the experimental absorption spectra are a direct consequence of the confining environment provided by the inorganic framework as well as the variation of excitonic coupling that decrease from (AE4T)PbCl to (AE4T)PbI. The theoretical insights gained from ref. 242 are quite relevant in the context of the ongoing debate surrounding the origin of the exciton fine structure. The transition spacings in the excitonic spectra seem to directly correlate with the choice of the organic spacer. While transition spacings of 14 meV and 40 meV were observed in the presence of aliphatic chains307,308 and phenyl groups,152,219,220,309 respectively, the presence of oligothiophene cations in (AE4T)PbX4 results in a distinct progression having a transition spacing equal to the aromatic-to-quinoidal vibrational energy of ≈0.17 eV.
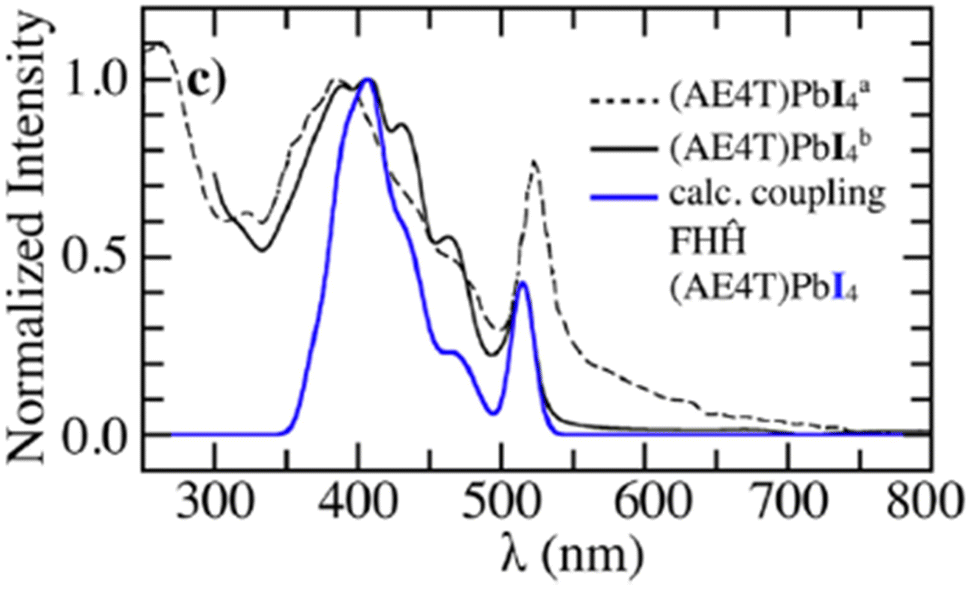 | ||
| Fig. 7 Comparison of the simulated spectrum using the MHF242 with the measured UV-vis absorption spectrum of (AE4T)PbX4 from ref. 298. Reproduced from ref. 242, with the permission of AIP Publishing. | ||
Despite rapid progress, several fundamental questions about the optical properties of 2D perovskites still remain unanswered: (a) how do structural changes (i.e., composition, length, and cross-sectional area) induced by the organic cation influence the photophysical properties? (b) What is the physical origin of the excitonic photophysics observed in 2D perovskites at low temperature? (c) How do energetic disorder (in both organic and inorganic layers) and electron–phonon coupling affect the photophysical and transport properties of 2D perovskites? (d) Can spectral signatures be used to distinguish between Frenkel and Wannier Mott excitons in 2D perovskites? While the theoretical model based on the MHF presented in ref. 242 is a promising first attempt to investigate the absorption spectra and gain insights into structure–photophysics relationships in perovskites, future studies need to explicitly include the coupling between Frenkel and Wannier–Mott excitons to further disentangle the role of exciton–exciton coupling in the experimentally measured absorption and emission spectra. We hypothesize that strong organic–inorganic exciton coupling can impact the absorption spectra of perovskites and lead to changes in both the positions and linewidths of the spectral features, as well as changes in the vibronic progression associated with the organic components.
3.3 Excitons in MOFs
UV-vis absorption and emission processes in MOFs are also governed by delocalized excitations.129–133,310 Distinct UV-vis spectral signatures similar to what has been discussed for COFs including the coexistence of H- and J-dimer bands311 have also been observed in MOFs.312,313 Extensive research has focused on understanding energy transport pathways and the factors impacting anisotropic exciton migration in MOFs.133,134,314–317 Computational and experimental studies have showed that the subtle interplay of several factors like short and long-range excitonic couplings, modular framework structures, and aggregation-induced conformational changes determine the optical properties of MOFs.134,226,318–321As demonstrated in previous sections, the Frenkel–Holstein model described in eqn (1) and (4) is ideally suited to investigate how the interference between long-range Coulomb coupling and short-range superexchange contributions influence the absorption and emission signatures in MOFs.215 More importantly, earlier applications of the Frenkel–Holstein Hamiltonian to homopolymers like P3HT, polyacetylene (PDA), and MEH-PPV showed that the UV-vis PL spectral line shape provides direct information about the exciton coherence number,278,322Ncoh, i.e., the number of repeat units over which the exciton retains wave-like behavior in J-aggregates. In its simplest manifestation, the ratio of 0–0 and 0–1 PL line strengths is given by323
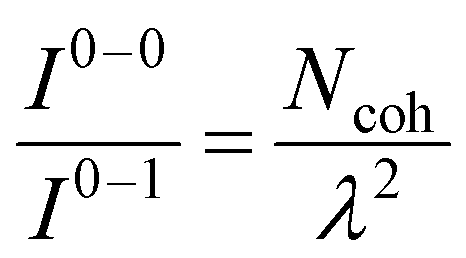 | (13) |
4 Photophysics of polarons
4.1 Polarons in COFs
“Hole” polarons in COFs can be generated by chemical doping with electron withdrawing groups such as iodine or F4TCNQ. Formation of “hole” polarons in COFs results in the appearance of new peaks in the mid-IR energy region. The characteristic mid-IR polaron signatures include a low-energy peak dressed with infrared active vibrational (IRAV) modes between 0.05 and 0.2 eV, and a broader high-energy peak between 0.25 and 0.9 eV. Such spectroscopic signatures have been observed in iodine-doped imine-linked TANG COF.64 Oxidation of COFs also result in near-IR transitions between 1.2 and 2.0 eV. Near-IR signatures have been observed in iodine and F4TCNQ doped WBDT COF,65 iodine doped TTF COFs,63,329 and electrochemical doping of Py-ttTII COF.292Unlike COFs, infrared signatures in conjugated polymers have been extensively investigated as a function of molecular weight, crystallinity of the sample, type of dopant, and preferential location of the dopant molecule. Similar to COFs, creation of polarons in semiconducting homo-polymers and donor–acceptor copolymers, either by photoexcitation (i.e., photoinduced absorption spectroscopy, see Fig. 8b) or by doping (electrochemical or chemical), results in the appearance of new mid-IR peaks. The low-energy peak (see Fig. 8a) has been referred to as peak A,229–231,250 DP1 (delocalized polaron),330,331 or CT (charge transfer)332–335 by different groups. The broader high-energy peak has been referred to as peak B (Fig. 8a),229–231,250 P1,330,331 or C1.332–335
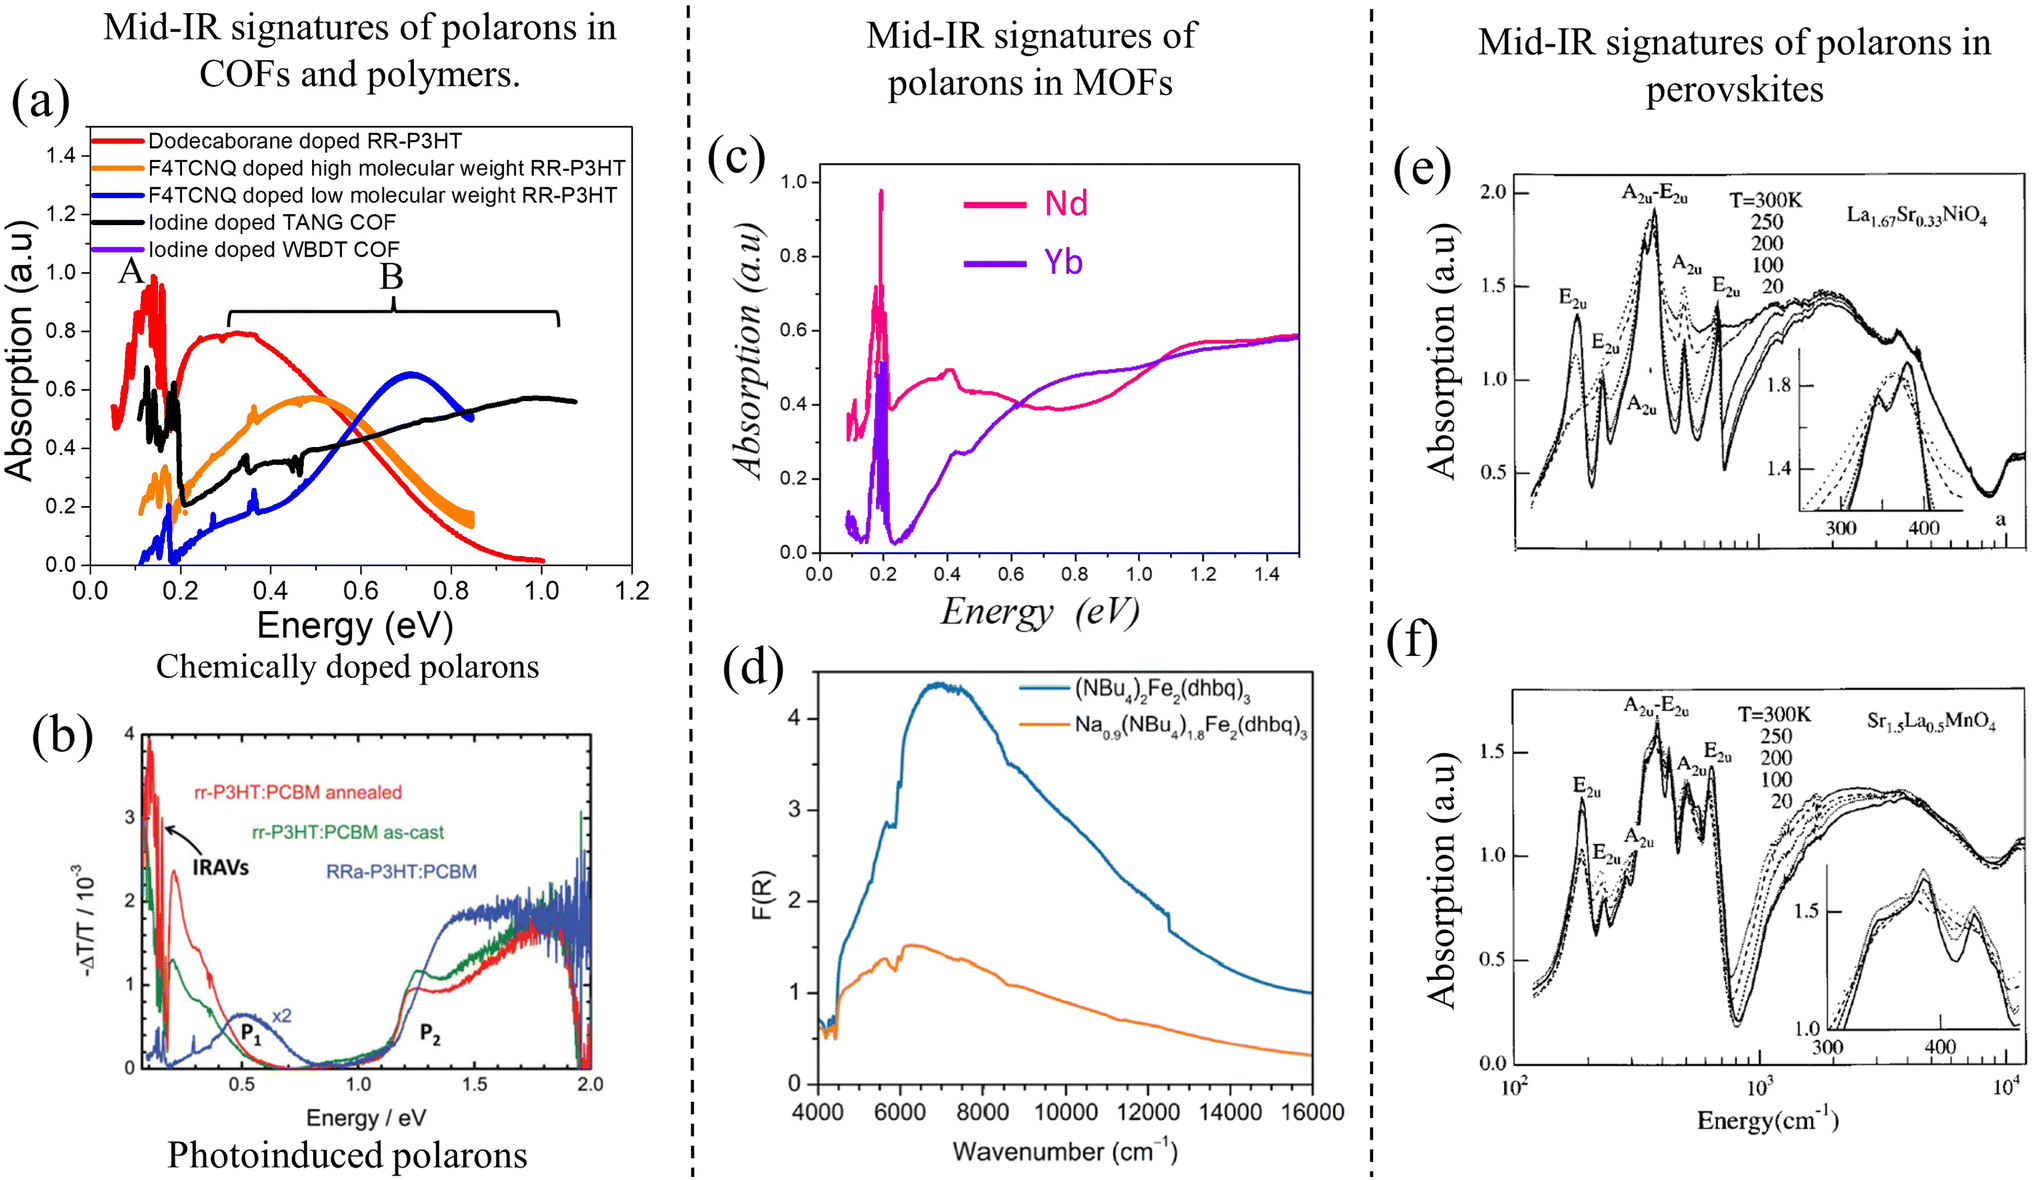 | ||
| Fig. 8 (a) Mid-IR signatures of “bound” polarons in chemically doped polymers230,231 and COFs64,216 using data from ref. 216, 230 and 231. A red shift of the high energy peak B signifies enhanced polaron delocalization. (b) Mid-IR signatures of photoinduced polarons in conjugated polymers.324,325 (c) and (d) Mid-IR signatures of polarons in MOFs.326,327 (c) Replotted from ref. 326. (d) Reprinted with permission from ref. 327. Copyright 2015 American Chemical Society. (e) and (f) Mid-IR signatures of polarons in perovskites.328 Copyright 1996 by American Physical Society. All rights reserved. | ||
We begin the discussion with F4TCNQ-doped low molecular weight (MW) P3HT films, where the polarons are localized on the polymer backbones with negligible interchain delocalization.230 This is due to strong Coulomb binding with the F4TCNQ counteranions that reside in the amorphous domains in close proximity to the polymer backbone (within ∼0.5–0.6 nm). Localized polarons in low-MW F4TCNQ-doped P3HT films correspond to a blue-shifted peak B maximum (∼0.7 eV) and a small A/B peak intensity ratio (∼0.25 in Fig. 8a). In marked contrast, F4TCNQ-doped high-MW P3HT films display enhanced intra- and inter-chain polaron delocalization which is accompanied by a red shift of the B peak to ∼0.5 eV and an increase in the A/B peak ratio to ∼0.5 (orange curve in Fig. 8a). The enhanced polaron delocalization in F4TCNQ-doped high-MW regioregular-P3HT is mainly attributed to weak Coulomb binding since the dopant counteranions in crystalline high-MW RR-P3HT films preferentially reside in the lamellar regions or in the amorphous domains of the polymer matrix and do not intercalate between the crystalline π-stacks.338
Interestingly, replacing F4TCNQ dopant with a bulky dodecaborane-based dopant, DDBF72, yielded significantly higher charge mobility in P3HT films, which was accompanied by an additional red shift of the B peak to ∼0.3 eV and a further increase in the A/B peak intensity ratio to 1.25 (red curve in Fig. 8a). The increased mobility in DDBF72-doped P3HT films339 compared to F4TCNQ-doped P3HT films230 is a direct consequence of increased polaron delocalization due to reduced electrostatic interactions between the dopant counteranion and the hole. Unlike F4TCNQ dopants, the reduced Coulomb binding in dodecaborane based dopants was due to a specific design which sterically protected the core electron density.339
For iodine-doped TANG-COF, the black curve in Fig. 8a display a significantly blue-shifted B peak with the maximum at ∼1 eV. As expected, this large blue shift correlates to the iodine-doped TANG-COF exhibiting lower conductivity compared to semiconducting polymers and is a direct consequence of localized polarons due to “very” strong Coulomb binding. In the case of polymers, the counteranions preferentially reside at a distance greater than 0.5 nm from the backbone depending on the size of the dopant counteranion and the MW of the polymer films. However, the presence of large pores in TANG-COF (and other COF structures) readily incorporates the counteranions, which results in shorter counteranion-framework distances (0.35–0.4 nm).216 In turn, this leads to polaron trapping and, consequently yields lower conductivity.
These studies imply that the preferential location, type, and size of the dopant counteranion play an important role in determining conductivity of 2D COFs and 1D polymers. For example, the Brinkmann group investigated the effects of different dopants on the charge transport properties of P3HT films.340 It was found that the preferential doping of the amorphous regions of the polymer films reduces polaron localization and improves charge transport as well as thermoelectric factors. Similar conclusions were reached from a systematic analysis of the effects associated with the counteranion size on polaron delocalization and mid-IR spectral signatures.341
The theoretical analysis identifies specific spectral signatures from which the polaron coherence lengths along the intra- and inter-chain/framework directions in conjugated polymers and COFs can be quantitatively determined. More specifically, direct signatures of extended polaron coherence in conjugated polymers229–231,250 and COFs216,217 can be attributed to a red shift of the high energy peak B and an increase in the A/B peak intensity ratio. Knowing the coherence distribution is critical since it allows for determining whether charge transport in organic materials is limited by a nanoscale property, such as polaron delocalization, or a mesoscale property, such as crystallite connectivity.233
The quantitative theoretical treatment of the infrared signatures in chemically doped organic materials (Fig. 10) provides additional information about how the size, type, and preferential location of the dopant counteranions within the polymer matrix impacts conductivity. As discussed previously, simulations based on the MHF have predicted the approximate location of the counteranion in F4TCNQ-doped and DDBF72-doped P3HT films to be within ∼0.8–1 nm (ref. 230) and ∼1.8–2.0 nm (ref. 231 and 339) of the polymer backbone, respectively. For iodine doped TANG-COF, it was shown that the counteranions reside inside the pore at an approximate distance of ∼0.35–0.50 nm from the COF framework.216
The MHF in eqn (1) was used to theoretically demonstrate that the extent of polaron migration along the intra- and interframework directions follows the order trigonal/kagome > tetragonal > hexagonal.217 It was theoretically demonstrated that polaronic transport in COF structures not only depends on the extent of π-conjugation and the strength of electronic coupling between the nearest neighbors but is also governed by the interplay between topological connectivity and presence of electronic defects in the framework. Ref. 217 further emphasized that the presence of additional connecting pathways in trigonal COFs compared to hexagonal COFs helps circumvent deep trap sites and significantly enhances polaron delocalization by approximately three orders of magnitude (Fig. 9).217 However, this conclusion does not hold in the case of doped COF structures. Upon chemical doping, the effect of topology is virtually nullified and the extent polaron delocalization is primarily determined by the location of the counteranion relative to the COF backbone and the strength of Coulomb binding. In the likely scenario of the dopant counteranions residing inside the COF pores and in close proximity to the framework backbone, the extent of polaron delocalization, and conductivity will be low, independently of the framework topology.217
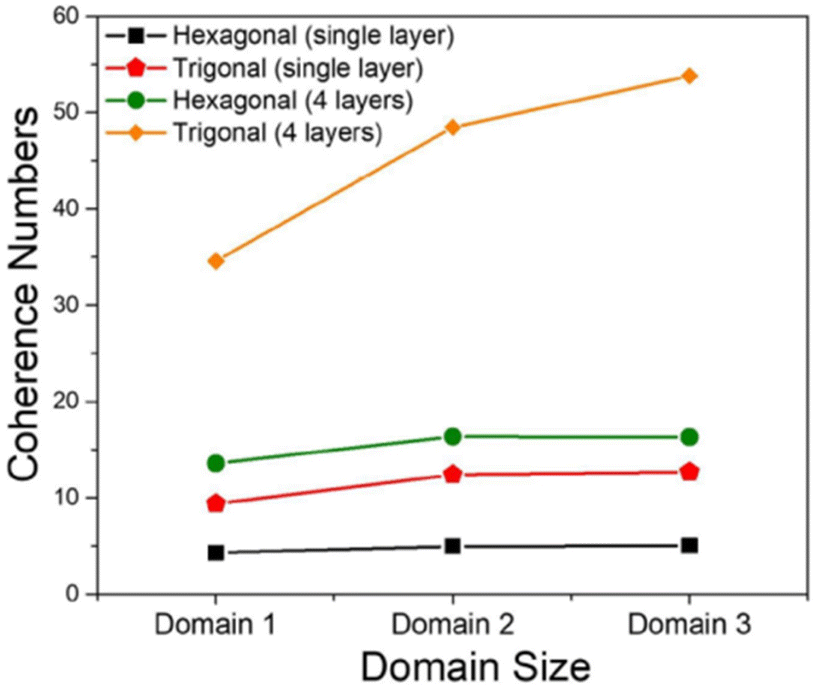 | ||
| Fig. 9 Intra- and inter-framework polaron coherence numbers as a function of topology of the COF structure. Trigonal COFs facilitate greater polaron delocalization compared to hexagonal COFs due to additional connecting pathways that help circumvent deep trap states and enhance hole mobility. Data is used from ref. 217. | ||
 | ||
| Fig. 10 Measured (solid) and simulated (dashed) spectrum of iodine doped (a) TANG COF and (b) TTF-COFs.63,216,217,329 (c) Left: measured (solid) and simulated (dashed) mid-IR polaron spectra of dodecaborane339 (brown) and F4TCNQ230 (orange) doped P3HT films. Right: measured (solid) and simulated (dashed) exciton UV-vis spectra for undoped P3HT films.235,236,250 (d) Measured (solid) and simulated (dashed) charge modulation spectrum of P3HT as a function of molecular weight.229 (e) Measured (solid) and simulated (dashed) charge modulation spectrum for a doped D–A copolymer342 and P3HT films.230,231 (f) Polaron coherence function of 100% regioregular P3HT on a surface assembled monolayer with a molecular weight of 30 kg mol−1. Intra- and inter-chain coherence numbers are shown in the inset.233 (g) Preliminary simulations using the MHF qualitatively captures the spectral trends of the mid-IR spectral signatures observed in lanthanide based MOFs replotted from ref. 326. Data in (a)–(f) are from ref. 216, 217, 229–231, 233 and 250. | ||
4.2 Polarons in MOFs
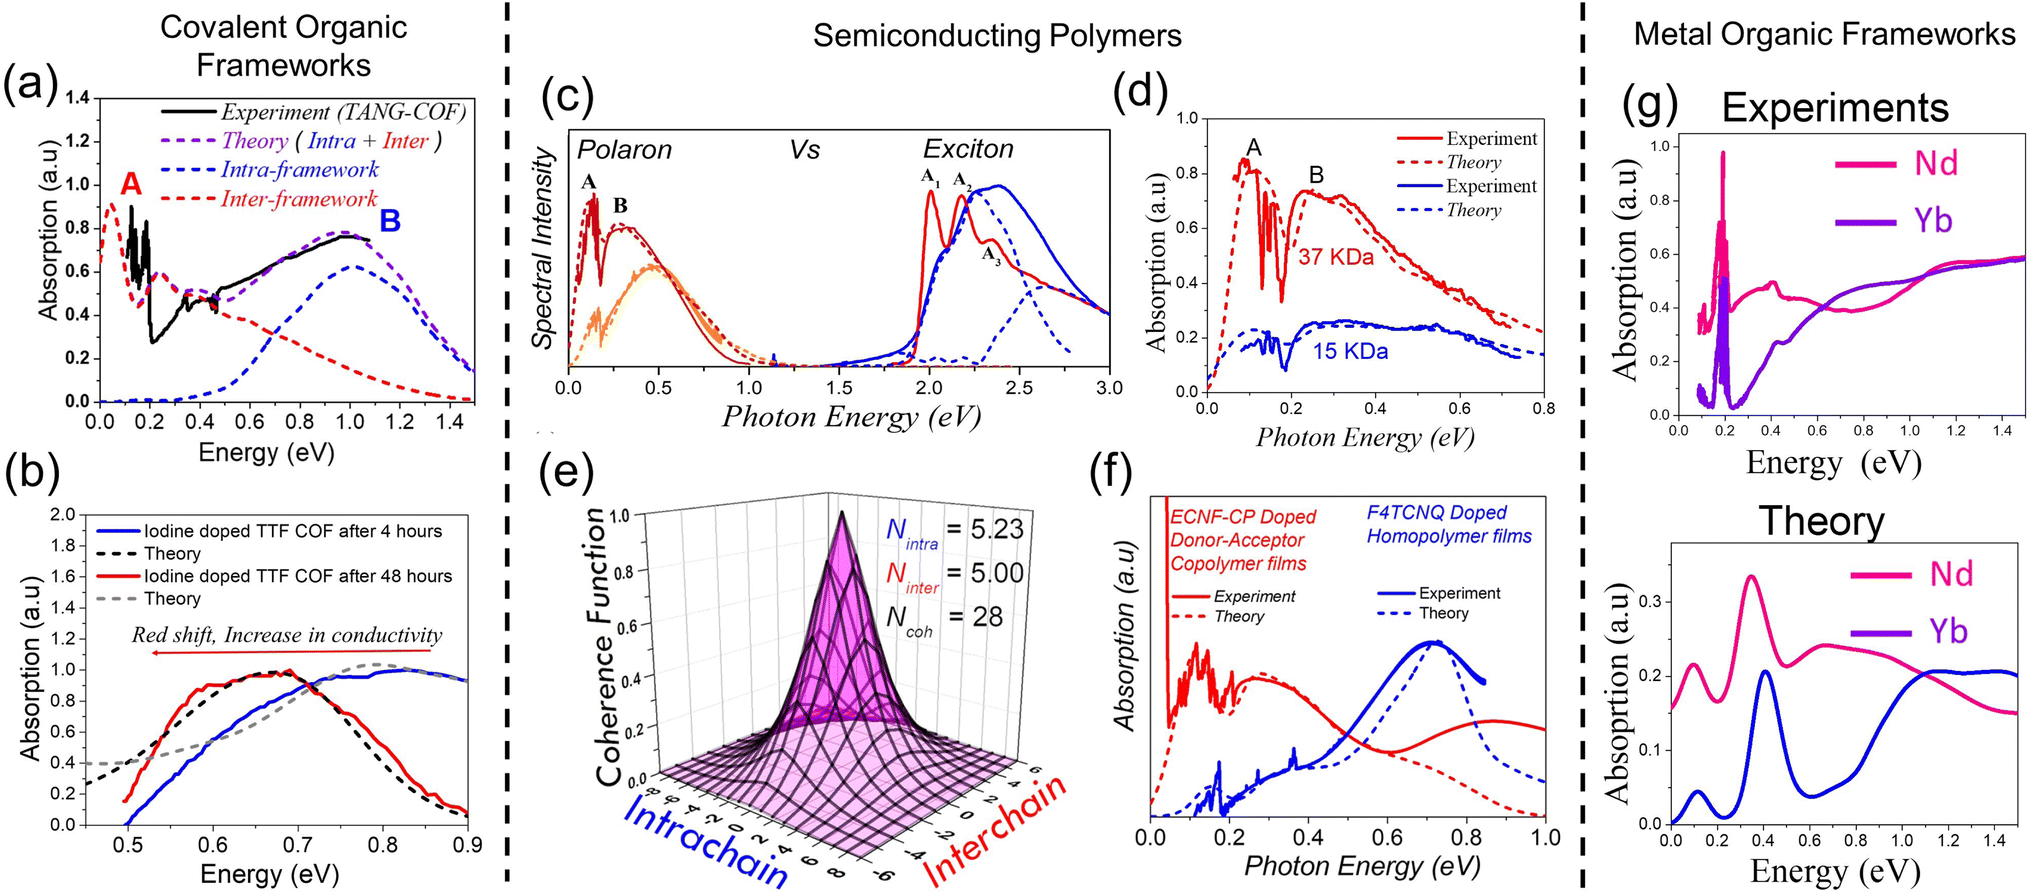
Direct correlations between mid-IR signatures and conductivity is not limited to organic materials, such as polymers and COFs, but have also been reported in hybrid organic–inorganic frameworks, such as MOFs.326,327,343–346 A recent study demonstrated that π–π stacking interactions between the organic ligands alone can produce efficient charge transport pathways in MOFs, indicating that a metal–ligand bond with high covalent character is not a necessary requirement for achieving high conductivity.326 By fine-tuning the inter-layer π-stacking distances between the organic 2D sheets in a series of lanthanide-based MOFs, the measured conductivity was found to be on par with the highest conductivity values reported for MOFs to date. The high conductivity was achieved despite negligible in-plane electronic communication and was solely attributed to out-of-plane charge transport. Although electronic structure calculations were used to determine the band structure and density of states of lanthanide-based MOFs, it would be important to further explore, at the fundamental level, the relationships between framework properties (e.g., flexibility and chemical nature of the organic ligands), measured conductivities, and mid-IR spectral signatures. Firstly, it is quite intriguing that a small decrease (0.005 nm) in the inter-layer stacking distance results in a significant increase (103) in the measured conductivity. Secondly, determining the origin of the mid-IR spectral features was deemed beyond the scope of the work and the origin of the mid-IR signatures was ambiguously assigned either to the presence of defects or metal/ligand vacancies and intra-ligand charge transfer (Fig. 8c). Interestingly, similar to the case in organic materials, spectral changes in the mid-IR energy range measured in ref. 326 directly correlate with changes in the inter-layer stacking distances, choice of the metal centers, and measured conductivity. In particular, it was found that frameworks containing metals such as holmium (Ho3+) and ytterbium (Yb3+), which exhibit shorter π-stacking distances and higher conductivities, display a blue-shifted absorption (at ≈0.7 eV) compared to frameworks containing lanthanum (La3+) and neodymium (Nd3+), which exhibit longer π-stacking distances and lower conductivities (see Fig. 8c and ref. 326).Direct correlations between measured conductivity and mid-IR signatures were also reported in KxFe2(BDP)2 (BDP2− = 1,4-benzenedipyrazolate) by Long and coworkers.345 It was shown that the fractional reduction of KxFe2(BDP)3 results in a remarkable 104 fold increase in conductivity along a single crystallographic axis. It was also found that the greatest degree of electronic delocalization occurred at half reduction, resulting in a charge mobility of 0.29 cm2 V−1 s−1. With increasing reduction and charge mobility, the spectral features in the mid-IR energy range between 0.50 eV and 1 eV were found to grow in intensity until half reduction and then starts to diminish. The origin of the mid-IR absorption band was attributed to the formation of mid-gap polaron states.
Direct correlations between mixed valency, conductivity, and mid-IR spectral signatures were also reported in a 3D MOF composed of FeIII centers and paramagnetic semiquinoid linkers synthesized by the Long group.327 The intense blue curve in Fig. 8d was associated with significantly higher conductivity (0.16 S cm−1) compared to the orange curve (0.0062 S cm−1). However, the underlying physical mechanism behind the difference in spectral intensities was not directly investigated and the observed correlation between spectral intensity and conductivity was not elucidated. Similar low-energy spectral features have been observed in several redox-active MOFs and were either attributed to intra-valence charge transfer or mid-gap polaron states.343,344,346
Important future directions will be aimed at understanding, at a fundamental level, the origin of the low-energy spectral features in MOFs, which can be tentatively assigned to intra-ligand charge transfer or the formation of delocalized polarons, most probably in the organic ligands. The decrease in spectral intensity observed for 3D MOFs in ref. 327, which is accompanied by a decrease in conductivity, is in good agreement with our earlier observations for COFs216,217 and semiconducting polymers,229,230,250 suggesting that the observed drop in mid-IR oscillator strength is directly proportional to the decrease in the polaron delocalization lengths in the MOF structures. However, detailed theoretical investigations are necessary for developing a consistent picture of the correlations between mid-IR signatures and polaron delocalization in different MOF structures.
4.3 Polarons in perovskites
Studies of mid-IR absorption spectra on chemically doped perovskites date back to the 90s.328,347 The correlations between the polaronic features in the mid-IR energy range and the transport properties and superconductivity were established in layered perovskites in ref. 328 and 347. The spectral intensity and lineshapes of the mid-IR signatures were shown to be sensitive to polaron size, doping, and temperature. The similarity between the mid-IR signatures observed in chemically doped layered perovskites having general formula La2−xSrxMO4 (M = Ni, Mn, and Cu) and those observed in COFs, MOFs, and conjugated polymers is particularly striking.The mid-IR band of perovskites also display two main bands – a high-energy broad peak (peak B) and a low-energy peak (peak A) riddled with IRAV modes. Although not discussed by the authors, the position of peak B appears to correlate with the transport property of the perovskite structure. For example, La2−xSrxNiO4+y (LSNO) either turns into a high temperature superconductor or displays metallic behavior, while Sr2−xLaxMnO4 (SLMO) remains insulating at any value of x. The metallic behavior in LSNO was associated with a red shift of peak B and the band maximum occurred at 2000 cm−1 (Fig. 8e). On the other hand, the band maximum of SLMO is approximately around ∼4000 cm−1 (Fig. 8f). In addition, peak A also appears to grow in intensity for LSNO compared to SLMO. These observations suggest that it would be important to connect specific spectral signatures of polarons, bipolarons, and polaron pairs with the nature of transport in perovskites (i.e., superconducting vs. insulating).
5 Conclusion
To summarize, this perspective highlights a successful theory based on the Holstein Hamiltonian, coined Multiparticle Holstein Formalism, that accounts for the steady-state UV-vis absorption (and PL) spectrum for excitons and the mid-IR spectrum for polarons in a broad range of organic and organic–inorganic hybrid materials. More importantly, the theory identifies specific spectral signatures in the UV-vis and mid-IR that directly correlates with the extent of exciton and polaron coherence in semiconducting materials.With regards to excitons in organic materials such as COFs and polymers, we show that the incorporation of Frenkel and CT electronic states as well as vibronic coupling are necessary to accurately reproduce the UV-vis absorption spectral line shape of neutral (i.e. undoped) D–A polymers such as PffBT4-2DT285 and D–A COFs such as py-ptII293 (see Fig. 4). The close agreement between theory and experimentally measured UV-vis spectra led to the important conclusion that the origin of the Q and B bands in D–A polymers and D–A COFs arise due to efficient mixing between Frenkel and CT states.
The striking similarity in the low energy vibronic signature of PffBT4-2DT copolymer and NiPc COF have been highlighted. More specifically, both PffBT4-2DT copolymer and NiPc COF display a red-shifted low-energy absorption band which is accompanied by an increase in the A1/A2 peak ratio (see Fig. 2a), where A1 and A2 are the oscillator strengths of the first two vibronic peaks in the progression sourced by the symmetric aromatic to quinoidal vibrational mode. Although referred to as pure H-aggregates, the vibronic signatures indicate that NiPc COF exhibit J-type aggregation. Examples of H- and J-type bands in COFs have been discussed in Section 3.1 and the importance of short-range (or superexchange) coupling, which arises from wave function overlap between neighboring chromophores in understanding aggregate photophysics for polymers and COFs have been emphasized.
Section 3.1 demonstrates that the UV-vis spectral signatures of D–A COFs are quite sensitive to molecular packing, nature of aggregation, defect density, relative humidity, and oxidation. From a theoretical viewpoint, future studies based on the MHF will explore whether the interplay between short- and long-range couplings and defects can be exploited in designing superior electrochromic, light-harvesting, and conductive COFs.
With regards to excitons in layered perovskites, the MHF adopted in ref. 242 has successfully reproduced the spectral trends in the vibronic progression observed in the UV-vis absorption spectra of AE4TPbX4. In ref. 242, the interaction between the organic and inorganic excitons in AE4TPbX4 was assumed to be negligible. In order to provide an unambiguous interpretation of the excitonic photophysics in layered perovskites, future studies will explicitly include the coupling between Frenkel and Wannier–Mott excitons. To realize this goal, the behavior of the inorganic excitons can be described with a Wannier–Mott type Hamiltonian that accounts for electron and hole hopping, as well as Coulomb binding. Analogous to the studies that have been previously performed on organic materials,227 we believe that a generic theoretical framework that treats the coupling between Frenkel and Wannier–Mott excitons, electron–phonon coupling associated with both the organic and inorganic components, respectively, and different forms of electronic and structural defects on equal footing will potentially enable direct comparisons with excitonic signatures in hybrid materials.152,153,218,219,297
In the context of polarons, we emphasize that the mid-IR signatures that arise due to the formation of polarons, contain key information about structure–property relationships and the extent of polaron delocalization for both organic and hybrid materials. In our earlier studies216,217,229–231,250 (see Fig. 10) we have successfully employed the MHF for polarons (see Section 2.3) to obtain converged and accurate reproductions of the mid-IR absorption spectra of chemically-induced holes as well as electrically and optically-generated holes in homopolymers, D–A copolymers, and COFs. More importantly, the theory provides direct correlations between infrared spectral changes and experimentally measured trends in conductivity and hole mobility. Building upon quantitative fits with available experimental data for both polymers and COFs, we attempt to bridge the gap between the polymer and COF communities by addressing two key questions. (1) What is the fundamental reason for doped COFs to show lower bulk conductivity compared to doped conjugated polymers? (2) Is it possible to identify experimental protocols that can lead to superior conductivity in COFs? In Section 4 and in ref. 216 we demonstrate that strong Coulomb binding between the hole and the counter-anion that resides within the COF pores results in poor conductivity in COFs. As discussed in Section 4 and in ref. 216 and 217, potential design strategies to improve electrical conductivity in COFs involve: (i) the exploration of bulky dopants and synthesis techniques that preferentially keeps the counteranions away from the COF pores thus reducing Coulomb binding and facilitating enhanced polaron delocalization, and (ii) improving topological connectivity that helps circumvent disorder induced deep trap sites and greatly enhance polaron delocalization.
While the Holstein Hamiltonian for polarons described in eqn (1) quantitatively reproduces the infrared signatures in organic materials (Fig. 10a–f), the model only qualitatively captures the spectral trends in MOFs (Fig. 10g) highlighting the limitation of the Hamiltonian described in eqn (1). The main reason for the discrepancy between experiments and theory in Fig. 10g is because the basis set expressing the Hamiltonian in eqn (1) does not include the contribution from the inorganic component. As previously discussed in Section 4, the Hamiltonian in eqn (1) can be extended to include the coupling between the Frenkel and Wannier–Mott excitons in order to provide realistic simulations of the optical properties of excitons and polarons in hybrid materials.
Finally, we believe that the future of materials modeling hinges on the synergistic integration of Holstein-style vibronic Hamiltonians with electronic structure methods and data-driven techniques. This integrated approach will not only advance our fundamental understanding of the excited state processes but also provide unambiguous interpretations of well-defined spectral signatures that remains unexplored to date. Building upon the unparalleled accuracy of the MHF in reproducing conceptually complicated experimental data (see Fig. 4, 7, 10 and ref. 227, 230, 231, 242, 243, 250, 285, 348) it is possible to advance the community's fundamental understanding of quantum phenomena of many-body quantum systems at the nanoscale. Furthermore, the uniqueness of the MHF can be exploited to establish transformative design rules for next generation device architectures for applications including but not limited to charge storage devices, photodetectors, supercapacitors, and electrochromic sensors.
Author contributions
FP and RG designed and wrote the manuscript.Conflicts of interest
There are no conflicts to declare.Acknowledgements
This research was supported by the National Science Foundation through grant no. CHE-1704063 and used resources of the Extreme Science and Engineering Discovery Environment (XSEDE), which is supported by the National Science Foundation through grant no. ACI-1053575, and the Triton Shared Computing Cluster (TSCC) at the San Diego Supercomputer Center (https://doi.org/10.57873/T34W2R). The software PETSc and SLEPc was used to diagonalize the Hamiltonian.349–351Notes and references
- C. W. Tang and S. A. VanSlyke, Appl. Phys. Lett., 1987, 51, 913–915 CrossRef CAS.
- J. H. Burroughes, D. D. Bradley, A. Brown, R. Marks, K. Mackay, R. H. Friend, P. L. Burns and A. B. Holmes, Nature, 1990, 347, 539–541 CrossRef CAS.
- O. Inganäs, Adv. Mater., 2018, 30, 1800388 CrossRef PubMed.
- H. Lee, C. Park, D. H. Sin, J. H. Park and K. Cho, Adv. Mater., 2018, 30, 1800453 CrossRef PubMed.
- P. Cheng and Y. Yang, Acc. Chem. Res., 2020, 53, 1218–1228 CrossRef CAS PubMed.
- L. Zhan, S. Li, X. Xia, Y. Li, X. Lu, L. Zuo, M. Shi and H. Chen, Adv. Mater., 2021, 33, 2007231 CrossRef CAS PubMed.
- L. La Notte, L. Giordano, E. Calabrò, R. Bedini, G. Colla, G. Puglisi and A. Reale, Appl. Energy, 2020, 278, 115582 CrossRef.
- S. Park, T. Kim, S. Yoon, C. W. Koh, H. Y. Woo and H. J. Son, Adv. Mater., 2020, 32, 2002217 CrossRef CAS PubMed.
- D. Li and G. Yu, Adv. Funct. Mater., 2021, 31, 2100550 CrossRef CAS.
- L. Guo, X. Gu, X. Zhu and X. Sun, Adv. Mater., 2019, 31, 1805355 CrossRef CAS PubMed.
- M. Ding, X. Gu, L. Guo, R. Zhang, X. Zhu, R. Li, X. Zhang, W. Hu and X. Sun, J. Mater. Chem. C, 2022, 10(7), 2507–2515 RSC.
- A. Privitera, M. Righetto, F. Cacialli and M. K. Riede, Adv. Opt. Mater., 2021, 9, 2100215 CrossRef CAS.
- H. Chen, W. Zhang, M. Li, G. He and X. Guo, Chem. Rev., 2020, 120, 2879–2949 CrossRef CAS PubMed.
- S. Yuvaraja, A. Nawaz, Q. Liu, D. Dubal, S. G. Surya, K. N. Salama and P. Sonar, Chem. Soc. Rev., 2020, 49, 3423–3460 RSC.
- M. Kim, S. U. Ryu, S. A. Park, K. Choi, T. Kim, D. Chung and T. Park, Adv. Funct. Mater., 2020, 30, 1904545 CrossRef CAS.
- W. Shi, Y. Guo and Y. Liu, Adv. Mater., 2020, 32, 1901493 CrossRef CAS PubMed.
- P. C. Chow and T. Someya, Adv. Mater., 2020, 32, 1902045 CrossRef CAS PubMed.
- Z. Li, S. K. Sinha, G. M. Treich, Y. Wang, Q. Yang, A. A. Deshmukh, G. A. Sotzing and Y. Cao, J. Mater. Chem. C, 2020, 8, 5662–5667 RSC.
- J. Noh, G.-U. Kim, S. Han, S. J. Oh, Y. Jeon, D. Jeong, S. W. Kim, T.-S. Kim, B. J. Kim and J.-Y. Lee, ACS Energy Lett., 2021, 6, 2512–2518 CrossRef CAS.
- Y.-F. Liu, J. Feng, Y.-G. Bi, D. Yin and H.-B. Sun, Adv. Mater. Technol., 2019, 4, 1800371 CrossRef.
- H. Ling, S. Liu, Z. Zheng and F. Yan, Small Methods, 2018, 2, 1800070 CrossRef.
- R. Su, S. H. Park, X. Ouyang, S. I. Ahn and M. C. McAlpine, Sci. Adv., 2022, 8, eabl8798 CrossRef CAS PubMed.
- L. Zhou, A. Wanga, S.-C. Wu, J. Sun, S. Park and T. N. Jackson, Appl. Phys. Lett., 2006, 88, 083502 CrossRef.
- D. Ji, T. Li, W. Hu and H. Fuchs, Adv. Mater., 2019, 31, 1806070 CrossRef PubMed.
- J. Jang, Y. Song, D. Yoo, C. K. Ober, J.-K. Lee and T. Lee, Flexible Printed Electron., 2016, 1, 023001 CrossRef.
- L. Torsi, M. Magliulo, K. Manoli and G. Palazzo, Chem. Soc. Rev., 2013, 42, 8612–8628 RSC.
- A. H. Jalal, F. Alam, S. Roychoudhury, Y. Umasankar, N. Pala and S. Bhansali, ACS Sens., 2018, 3, 1246–1263 CrossRef CAS PubMed.
- A. P. Cote, A. I. Benin, N. W. Ockwig, M. O'Keeffe, A. J. Matzger and O. M. Yaghi, Science, 2005, 310, 1166–1170 CrossRef CAS PubMed.
- D. Rodríguez-San-Miguel and F. Zamora, Chem. Soc. Rev., 2019, 48, 4375–4386 RSC.
- X. Chen, K. Geng, R. Liu, K. T. Tan, Y. Gong, Z. Li, S. Tao, Q. Jiang and D. Jiang, Angew. Chem., Int. Ed., 2020, 59, 5050–5091 CrossRef CAS PubMed.
- K. Geng, T. He, R. Liu, S. Dalapati, K. T. Tan, Z. Li, S. Tao, Y. Gong, Q. Jiang and D. Jiang, Chem. Rev., 2020, 120, 8814–8933 CrossRef CAS PubMed.
- S. Kandambeth, K. Dey and R. Banerjee, J. Am. Chem. Soc., 2018, 141, 1807–1822 CrossRef PubMed.
- M. S. Lohse and T. Bein, Adv. Funct. Mater., 2018, 28, 1705553 CrossRef.
- S. Dalapati, M. Addicoat, S. Jin, T. Sakurai, J. Gao, H. Xu, S. Irle, S. Seki and D. Jiang, Nat. Commun., 2015, 6, 1–8 Search PubMed.
- N. Huang, P. Wang and D. Jiang, Nat. Rev. Mater., 2016, 1, 1–19 Search PubMed.
- F. J. Uribe-Romo, J. R. Hunt, H. Furukawa, C. Klock, M. O'Keeffe and O. M. Yaghi, J. Am. Chem. Soc., 2009, 131, 4570–4571 CrossRef CAS PubMed.
- F. J. Uribe-Romo, C. J. Doonan, H. Furukawa, K. Oisaki and O. M. Yaghi, J. Am. Chem. Soc., 2011, 133, 11478–11481 CrossRef CAS PubMed.
- J. L. Segura, M. J. Mancheño and F. Zamora, Chem. Soc. Rev., 2016, 45, 5635–5671 RSC.
- H. M. El-Kaderi, J. R. Hunt, J. L. Mendoza-Cortés, A. P. Côté, R. E. Taylor, M. O'Keeffe and O. M. Yaghi, Science, 2007, 316, 268–272 CrossRef CAS PubMed.
- X. Feng, X. Ding and D. Jiang, Chem. Soc. Rev., 2012, 41, 6010–6022 RSC.
- H. Furukawa and O. M. Yaghi, J. Am. Chem. Soc., 2009, 131, 8875–8883 CrossRef CAS PubMed.
- E. Jin, M. Asada, Q. Xu, S. Dalapati, M. A. Addicoat, M. A. Brady, H. Xu, T. Nakamura, T. Heine and Q. Chen, et al. , Science, 2017, 357, 673–676 CrossRef CAS PubMed.
- J. W. Colson and W. R. Dichtel, Nat. Chem., 2013, 5, 453–465 CrossRef CAS PubMed.
- R. P. Bisbey and W. R. Dichtel, ACS Cent. Sci., 2017, 3, 533–543 CrossRef CAS PubMed.
- P. J. Waller, F. Gándara and O. M. Yaghi, Acc. Chem. Res., 2015, 48, 3053–3063 CrossRef CAS PubMed.
- H. Yazdani, M.-A. Shahbazi and R. S. Varma, ACS Appl. Bio Mater., 2021, 5, 40–58 CrossRef PubMed.
- R. Xia, X. Zheng, C. Li, X. Yuan, J. Wang, Z. Xie and X. Jing, ACS Nano, 2021, 15, 7638–7648 CrossRef CAS PubMed.
- K. Wang, Z. Zhang, L. Lin, K. Hao, J. Chen, H. Tian and X. Chen, ACS Appl. Mater. Interfaces, 2019, 11, 39503–39512 CrossRef CAS PubMed.
- Z. Mi, P. Yang, R. Wang, J. Unruangsri, W. Yang, C. Wang and J. Guo, J. Am. Chem. Soc., 2019, 141, 14433–14442 CrossRef CAS PubMed.
- P. Gao, R. Wei, X. Liu, Y. Chen, T. Wu, M. Shi, M. Wang, N. Li and B. Tang, Chem. Commun., 2021, 57, 5646–5649 RSC.
- B. Wang, X. Liu, P. Gong, X. Ge, Z. Liu and J. You, Chem. Commun., 2020, 56, 519–522 RSC.
- M. C. Scicluna and L. Vella-Zarb, ACS Appl. Nano Mater., 2020, 3, 3097–3115 CrossRef CAS.
- N. Singh, S. Son, J. An, I. Kim, M. Choi, N. Kong, W. Tao and J. S. Kim, Chem. Soc. Rev., 2021, 50, 12883–12896 RSC.
- Q. Fang, J. Wang, S. Gu, R. B. Kaspar, Z. Zhuang, J. Zheng, H. Guo, S. Qiu and Y. Yan, J. Am. Chem. Soc., 2015, 137, 8352–8355 CrossRef CAS PubMed.
- X. Zhan, Z. Chen and Q. Zhang, J. Mater. Chem. A, 2017, 5, 14463–14479 RSC.
- S. B. Alahakoon, C. M. Thompson, G. Occhialini and R. A. Smaldone, ChemSusChem, 2017, 10, 2116–2129 CrossRef CAS PubMed.
- F. Chang, J. Zhou, P. Chen, Y. Chen, H. Jia, S. M. Saad, Y. Gao, X. Cao and T. Zheng, Asia-Pac. J. Chem. Eng., 2013, 8, 618–626 CrossRef CAS.
- Z. Li, X. Feng, Y. Zou, Y. Zhang, H. Xia, X. Liu and Y. Mu, Chem. Commun., 2014, 50, 13825–13828 RSC.
- Q. Yang, M. Luo, K. Liu, H. Cao and H. Yan, Appl. Catal., B, 2020, 276, 119174 CrossRef CAS.
- G.-B. Wang, S. Li, C.-X. Yan, F.-C. Zhu, Q.-Q. Lin, K.-H. Xie, Y. Geng and Y.-B. Dong, J. Mater. Chem. A, 2020, 8, 6957–6983 RSC.
- Y. Yang, P. Zhang, L. Hao, P. Cheng, Y. Chen and Z. Zhang, Angew. Chem., Int. Ed., 2021, 133, 22009–22016 CrossRef.
- Z.-C. Guo, M.-L. You, Z.-J. Wang, Z.-F. Li and G. Li, ACS Appl. Mater. Interfaces, 2022, 14, 15687–15696 CrossRef CAS PubMed.
- S.-L. Cai, Y.-B. Zhang, A. B. Pun, B. He, J. Yang, F. M. Toma, I. D. Sharp, O. M. Yaghi, J. Fan and S.-R. Zheng, et al. , Chem. Sci., 2014, 5, 4693–4700 RSC.
- V. Lakshmi, C.-H. Liu, M. Rajeswara Rao, Y. Chen, Y. Fang, A. Dadvand, E. Hamzehpoor, Y. Sakai-Otsuka, R. S. Stein and D. F. Perepichka, J. Am. Chem. Soc., 2020, 142, 2155–2160 CrossRef CAS PubMed.
- J. M. Rotter, R. Guntermann, M. Auth, A. Mähringer, A. Sperlich, V. Dyakonov, D. D. Medina and T. Bein, Chem. Sci., 2020, 11, 12843–12853 RSC.
- H. Li, J. Chang, S. Li, X. Guan, D. Li, C. Li, L. Tang, M. Xue, Y. Yan and V. Valtchev, et al. , J. Am. Chem. Soc., 2019, 141, 13324–13329 CrossRef CAS PubMed.
- M. Souto and D. F. Perepichka, J. Mater. Chem. C, 2021, 9, 10668–10676 RSC.
- M. Wang, M. Wang, H.-H. Lin, M. Ballabio, H. Zhong, M. Bonn, S. Zhou, T. Heine, E. Canovas and R. Dong, et al. , J. Am. Chem. Soc., 2020, 142, 21622–21627 CrossRef CAS PubMed.
- Y. Yue, H. Li, H. Chen and N. Huang, J. Am. Chem. Soc., 2022, 144, 2873–2878 CrossRef CAS PubMed.
- X. Xu, S. Wang, Y. Yue and N. Huang, ACS Appl. Mater. Interfaces, 2020, 12, 37427–37434 CrossRef CAS PubMed.
- G. Bian, J. Yin and J. Zhu, Small, 2021, 17, 2006043 CrossRef CAS PubMed.
- P. Friederich, A. Fediai, S. Kaiser, M. Konrad, N. Jung and W. Wenzel, Adv. Mater., 2019, 31, 1808256 CrossRef PubMed.
- H. Chen, V. V. Ginzburg, J. Yang, Y. Yang, W. Liu, Y. Huang, L. Du and B. Chen, Prog. Polym. Sci., 2016, 59, 41–85 CrossRef CAS.
- C. Huang, X. Qian and R. Yang, Mater. Sci. Eng., 2018, 132, 1–22 CrossRef.
- X. Xu, J. Chen, J. Zhou and B. Li, Adv. Mater., 2018, 30, 1705544 CrossRef PubMed.
- B. D. Paulsen, K. Tybrandt, E. Stavrinidou and J. Rivnay, Nat. Mater., 2020, 19, 13–26 CrossRef CAS PubMed.
- Y. Lu, Z.-D. Yu, H.-I. Un, Z.-F. Yao, H.-Y. You, W. Jin, L. Li, Z.-Y. Wang, B.-W. Dong and S. Barlow, et al. , Adv. Mater., 2021, 33, 2005946 CrossRef CAS PubMed.
- H. Jin, J. Li, J. Iocozzia, X. Zeng, P.-C. Wei, C. Yang, N. Li, Z. Liu, J. H. He and T. Zhu, et al. , Angew. Chem., Int. Ed., 2019, 58, 15206–15226 CrossRef CAS PubMed.
- S. A. Kulkarni, N. Yantara, K. S. Tan, N. Mathews and S. G. Mhaisalkar, Mater. Today, 2020, 33, 122–140 CrossRef CAS.
- Y. Gao, C. Huang, C. Hao, S. Sun, L. Zhang, C. Zhang, Z. Duan, K. Wang, Z. Jin and N. Zhang, et al. , ACS Nano, 2018, 12, 8847–8854 CrossRef CAS PubMed.
- Y. Liu, J. Cui, K. Du, H. Tian, Z. He, Q. Zhou, Z. Yang, Y. Deng, D. Chen and X. Zuo, et al. , Nat. Photonics, 2019, 13, 760–764 CrossRef CAS.
- A. Kojima, K. Teshima, Y. Shirai and T. Miyasaka, J. Am. Chem. Soc., 2009, 131, 6050–6051 CrossRef CAS PubMed.
- M. Yuan, L. N. Quan, R. Comin, G. Walters, R. Sabatini, O. Voznyy, S. Hoogland, Y. Zhao, E. M. Beauregard and P. Kanjanaboos, et al. , Nat. Nanotechnol., 2016, 11, 872–877 CrossRef CAS PubMed.
- T. M. Brenner, D. A. Egger, L. Kronik, G. Hodes and D. Cahen, Nat. Rev. Mater., 2016, 1, 1–16 Search PubMed.
- H.-Q. Yin and X.-B. Yin, Acc. Chem. Res., 2020, 53, 485–495 CrossRef CAS PubMed.
- J. Yang and Y.-W. Yang, Small, 2020, 16, 1906846 CrossRef CAS PubMed.
- X. Xiao, L. Zou, H. Pang and Q. Xu, Chem. Soc. Rev., 2020, 49, 301–331 RSC.
- K. Asha, K. Bhattacharyya and S. Mandal, J. Mater. Chem. C, 2014, 2, 10073–10081 RSC.
- P. Chandra Rao and S. Mandal, Inorg. Chem., 2018, 57, 11855–11858 CrossRef CAS PubMed.
- S. Mandal, S. Natarajan, P. Mani and A. Pankajakshan, Adv. Funct. Mater., 2021, 31, 2006291 CrossRef CAS.
- M. Lu, Y. Zhang, S. Wang, J. Guo, W. W. Yu and A. L. Rogach, Adv. Funct. Mater., 2019, 29, 1902008 CrossRef.
- Z. Li, T. R. Klein, D. H. Kim, M. Yang, J. J. Berry, M. F. Van Hest and K. Zhu, Nat. Rev. Mater., 2018, 3, 1–20 CrossRef CAS.
- A. Mahapatra, D. Prochowicz, M. M. Tavakoli, S. Trivedi, P. Kumar and P. Yadav, J. Mater. Chem. A, 2020, 8, 27–54 RSC.
- D. Rambabu, A. E. Lakraychi, J. Wang, L. Sieuw, D. Gupta, P. Apostol, G. Chanteux, T. Goossens, K. Robeyns and A. Vlad, J. Am. Chem. Soc., 2021, 143, 11641–11650 CrossRef CAS PubMed.
- X. Wu, Y. Qiu, Z. Chen, B. Guan, X. Hao, A. I. Rykov, Y. Sun, L. Liu, Y. Zou and J. Sun, et al. , Angew. Chem., Int. Ed., 2020, 59, 20873–20878 CrossRef CAS PubMed.
- L. Sun, M. G. Campbell and M. Dincă, Angew. Chem., Int. Ed., 2016, 55, 3566–3579 CrossRef CAS PubMed.
- L. S. Xie, G. Skorupskii and M. Dincă, Chem. Rev., 2020, 120, 8536–8580 CrossRef CAS PubMed.
- M. A. Green, A. Ho-Baillie and H. J. Snaith, Nat. Photonics, 2014, 8, 506–514 CrossRef CAS.
- Y. Rong, Y. Hu, A. Mei, H. Tan, M. I. Saidaminov, S. I. Seok, M. D. McGehee, E. H. Sargent and H. Han, Science, 2018, 361, eaat8235 CrossRef PubMed.
- B. R. Sutherland and E. H. Sargent, Nat. Photonics, 2016, 10, 295–302 CrossRef CAS.
- C. Katan, N. Mercier and J. Even, Chem. Rev., 2019, 119, 3140–3192 CrossRef CAS PubMed.
- L. Mao, C. C. Stoumpos and M. G. Kanatzidis, J. Am. Chem. Soc., 2018, 141, 1171–1190 CrossRef PubMed.
- J. L. Mancuso, A. M. Mroz, K. N. Le and C. H. Hendon, Chem. Rev., 2020, 120, 8641–8715 CrossRef CAS PubMed.
- X. Ni, H. Li, F. Liu and J.-L. Brédas, Mater. Horiz., 2022, 9, 88–98 RSC.
- S. Thomas, H. Li, C. Zhong, M. Matsumoto, W. R. Dichtel and J.-L. Bredas, Chem. Mater., 2019, 31, 3051–3065 CrossRef CAS.
- T. Joshi, C. Chen, H. Li, C. S. Diercks, G. Wang, P. J. Waller, H. Li, J.-L. Brédas, O. M. Yaghi and M. F. Crommie, Adv. Mater., 2019, 31, 1805941 CrossRef PubMed.
- H. Li and J.-L. Brédas, Chem. Mater., 2021, 33, 4529–4540 CrossRef CAS.
- H. Li, H. Li, S. Xun and J.-L. Brédas, Chem. Mater., 2020, 32, 9228–9237 CrossRef CAS.
- S. Wang, A. D. Chavez, S. Thomas, H. Li, N. C. Flanders, C. Sun, M. J. Strauss, L. X. Chen, A. J. Markvoort and J.-L. Brédas, et al. , Chem. Mater., 2019, 31, 7104–7111 CrossRef CAS.
- G. Borboudakis, T. Stergiannakos, M. Frysali, E. Klontzas, I. Tsamardinos and G. E. Froudakis, npj Comput. Mater., 2017, 3, 1–7 CrossRef CAS.
- R. Anderson, J. Rodgers, E. Argueta, A. Biong and D. A. Gómez-Gualdrón, Chem. Mater., 2018, 30, 6325–6337 CrossRef CAS.
- K. Fabrizio, K. N. Le, A. B. Andreeva, C. H. Hendon and C. K. Brozek, ACS Mater. Lett., 2022, 4, 457–463 CrossRef CAS.
- S. Chong, S. Lee, B. Kim and J. Kim, Coord. Chem. Rev., 2020, 423, 213487 CrossRef CAS.
- Z. Shi, W. Yang, X. Deng, C. Cai, Y. Yan, H. Liang, Z. Liu and Z. Qiao, Mol. Syst. Des. Eng., 2020, 5, 725–742 RSC.
- A. Nandy, C. Duan and H. J. Kulik, J. Am. Chem. Soc., 2021, 143, 17535–17547 CrossRef CAS PubMed.
- Q. Tao, P. Xu, M. Li and W. Lu, npj Comput. Mater., 2021, 7, 1–18 CrossRef.
- R. Lyu, C. E. Moore, T. Liu, Y. Yu and Y. Wu, J. Am. Chem. Soc., 2021, 143, 12766–12776 CrossRef CAS PubMed.
- A. Talapatra, B. P. Uberuaga, C. R. Stanek and G. Pilania, Chem. Mater., 2021, 33, 845–858 CrossRef CAS.
- J. Kim, D. Kang, S. Kim and H. W. Jang, ACS Mater. Lett., 2021, 3, 1151–1171 CrossRef CAS.
- A. S. Rosen, J. M. Notestein and R. Q. Snurr, Curr. Opin. Chem. Eng., 2022, 35, 100760 CrossRef.
- G. A. McCarver, T. Rajeshkumar and K. D. Vogiatzis, Coord. Chem. Rev., 2021, 436, 213777 CrossRef CAS.
- J. R. Kitchin, Nat. Catal., 2018, 1, 230–232 CrossRef.
- J. Hwang, R. R. Rao, L. Giordano, Y. Katayama, Y. Yu and Y. Shao-Horn, Science, 2017, 358, 751–756 CrossRef CAS PubMed.
- C. Altintas, O. F. Altundal, S. Keskin and R. Yildirim, J. Chem. Inf. Model., 2021, 61, 2131–2146 CrossRef CAS PubMed.
- V. Gladkikh, D. Y. Kim, A. Hajibabaei, A. Jana, C. W. Myung and K. S. Kim, J. Phys. Chem. C, 2020, 124, 8905–8918 CrossRef CAS.
- F. Mayr, M. Harth, I. Kouroudis, M. Rinderle and A. Gagliardi, J. Phys. Chem. Lett., 2022, 13, 1940–1951 CrossRef CAS PubMed.
- C. Chen, Y. Zuo, W. Ye, X. Li, Z. Deng and S. P. Ong, Adv. Energy Mater., 2020, 10, 1903242 CrossRef CAS.
- J. Li, B. Pradhan, S. Gaur and J. Thomas, Adv. Energy Mater., 2019, 9, 1901891 CrossRef CAS.
- M. Baranowski and P. Plochocka, Adv. Energy Mater., 2020, 10, 1903659 CrossRef CAS.
- J.-C. Blancon, A. V. Stier, H. Tsai, W. Nie, C. C. Stoumpos, B. Traore, L. Pedesseau, M. Kepenekian, F. Katsutani and G. Noe, et al. , Nat. Commun., 2018, 9, 1–10 CrossRef CAS PubMed.
- M. Dyksik, H. Duim, D. K. Maude, M. Baranowski, M. A. Loi and P. Plochocka, Sci. Adv., 2021, 7, eabk0904 CrossRef CAS PubMed.
- A. H. Proppe, M. H. Elkins, O. Voznyy, R. D. Pensack, F. Zapata, L. V. Besteiro, L. N. Quan, R. Quintero-Bermudez, P. Todorovic and S. O. Kelley, et al. , J. Phys. Chem. Lett., 2019, 10, 419–426 CrossRef CAS PubMed.
- S. S. Rajasree, J. Yu, S. M. Pratik, X. Li, R. Wang, A. S. Kumbhar, S. Goswami, C. J. Cramer and P. Deria, J. Am. Chem. Soc., 2022, 144, 1396–1406 CrossRef CAS PubMed.
- L. Cao, Z. Lin, W. Shi, Z. Wang, C. Zhang, X. Hu, C. Wang and W. Lin, J. Am. Chem. Soc., 2017, 139, 7020–7029 CrossRef CAS PubMed.
- J. Yu, R. Anderson, X. Li, W. Xu, S. Goswami, S. S. Rajasree, K. Maindan, D. A. Gómez-Gualdrón and P. Deria, J. Am. Chem. Soc., 2020, 142, 11192–11202 CrossRef CAS PubMed.
- P. Mahato, A. Monguzzi, N. Yanai, T. Yamada and N. Kimizuka, Nat. Mater., 2015, 14, 924–930 CrossRef CAS PubMed.
- A. D. Sample, J. Guan, J. Hu, T. Reese, C. R. Cherqui, J.-E. Park, F. Freire-Fernández, R. D. Schaller, G. C. Schatz and T. W. Odom, Nano Lett., 2021, 21, 7775–7780 CrossRef CAS PubMed.
- H.-J. Son, S. Jin, S. Patwardhan, S. J. Wezenberg, N. C. Jeong, M. So, C. E. Wilmer, A. A. Sarjeant, G. C. Schatz and R. Q. Snurr, et al. , J. Am. Chem. Soc., 2013, 135, 862–869 CrossRef CAS PubMed.
- Q. Zhang, C. Zhang, L. Cao, Z. Wang, B. An, Z. Lin, R. Huang, Z. Zhang, C. Wang and W. Lin, J. Am. Chem. Soc., 2016, 138, 5308–5315 CrossRef CAS PubMed.
- N. C. Flanders, M. S. Kirschner, P. Kim, T. J. Fauvell, A. M. Evans, W. Helweh, A. P. Spencer, R. D. Schaller, W. R. Dichtel and L. X. Chen, J. Am. Chem. Soc., 2020, 142, 14957–14965 CrossRef CAS PubMed.
- S. Yang, D. Streater, C. Fiankor, J. Zhang and J. Huang, J. Am. Chem. Soc., 2021, 143, 1061–1068 CrossRef CAS PubMed.
- J. Yin, H. Li, D. Cortecchia, C. Soci and J.-L. Brédas, ACS Energy Lett., 2017, 2, 417–423 CrossRef CAS.
- L. Zhao, Y. L. Lin, H. Kim, N. C. Giebink and B. P. Rand, ACS Energy Lett., 2018, 3, 2708–2712 CrossRef CAS.
- N. Keller and T. Bein, Chem. Soc. Rev., 2021, 50, 1813–1845 RSC.
- N. J. Hestand and F. C. Spano, Acc. Chem. Res., 2017, 50, 341–350 CrossRef CAS PubMed.
- F. C. Spano, Acc. Chem. Res., 2010, 43, 429–439 CrossRef CAS PubMed.
- F. C. Spano, Annu. Rev. Phys. Chem., 2006, 57, 217–243 CrossRef CAS PubMed.
- A. D. Wright, C. Verdi, R. L. Milot, G. E. Eperon, M. A. Pérez-Osorio, H. J. Snaith, F. Giustino, M. B. Johnston and L. M. Herz, Nat. Commun., 2016, 7, 1–9 Search PubMed.
- X. Song, C. Peng, X. Xu, J. Yin and H. Fei, Chem. Commun., 2020, 56, 10078–10081 RSC.
- G. Zhang, J. Yin, X. Song and H. Fei, Chem. Commun., 2020, 56, 1325–1328 RSC.
- C. Peng, X. Song, J. Yin, G. Zhang and H. Fei, Angew. Chem., Int. Ed., 2019, 131, 7900–7904 CrossRef.
- D. B. Straus, S. Hurtado Parra, N. Iotov, J. Gebhardt, A. M. Rappe, J. E. Subotnik, J. M. Kikkawa and C. R. Kagan, J. Am. Chem. Soc., 2016, 138, 13798–13801 CrossRef CAS PubMed.
- D. B. Straus, S. Hurtado Parra, N. Iotov, Q. Zhao, M. R. Gau, P. J. Carroll, J. M. Kikkawa and C. R. Kagan, ACS Nano, 2020, 14, 3621–3629 CrossRef CAS PubMed.
- K. M. McCall, C. C. Stoumpos, S. S. Kostina, M. G. Kanatzidis and B. W. Wessels, Chem. Mater., 2017, 29, 4129–4145 CrossRef CAS.
- J. D. Schultz, J. Y. Shin, M. Chen, J. P. O'Connor, R. M. Young, M. A. Ratner and M. R. Wasielewski, J. Am. Chem. Soc., 2021, 143, 2049–2058 CrossRef CAS PubMed.
- C. Lin, T. Kim, J. D. Schultz, R. M. Young and M. R. Wasielewski, Nat. Chem., 2022, 1–8 Search PubMed.
- R. Tempelaar and D. R. Reichman, J. Chem. Phys., 2017, 146, 174703 CrossRef PubMed.
- R. Tempelaar and D. R. Reichman, J. Chem. Phys., 2017, 146, 174704 CrossRef PubMed.
- R. Tempelaar and D. R. Reichman, J. Chem. Phys., 2018, 148, 244701 CrossRef PubMed.
- K. Miyata, F. S. Conrad-Burton, F. L. Geyer and X.-Y. Zhu, Chem. Rev., 2019, 119, 4261–4292 CrossRef CAS PubMed.
- E. A. Arsenault, A. J. Schile, D. T. Limmer and G. R. Fleming, J. Chem. Phys., 2021, 155, 054201 CrossRef CAS PubMed.
- E. A. Arsenault, P. Bhattacharyya, Y. Yoneda and G. R. Fleming, J. Chem. Phys., 2021, 155, 020901 CrossRef CAS PubMed.
- G. D. Scholes and G. R. Fleming, J. Phys. Chem. B, 2000, 104, 1854–1868 CrossRef CAS.
- X. Blase, I. Duchemin and D. Jacquemin, Chem. Soc. Rev., 2018, 47, 1022–1043 RSC.
- X. Blase, I. Duchemin, D. Jacquemin and P.-F. Loos, J. Phys. Chem. Lett., 2020, 11, 7371–7382 CrossRef CAS PubMed.
- N. Bradbury, M. Nguyen, J. R. Caram and D. Neuhauser, arXiv preprint arXiv:2205.06690, 2022.
- A. Ortega-Guerrero, M. Fumanal, G. Capano and B. Smit, J. Phys. Chem. B, 2020, 124, 21751–21760 CAS.
- M. Ji, X. Lan, Z. Han, C. Hao and J. Qiu, Inorg. Chem., 2012, 51, 12389–12394 CrossRef CAS PubMed.
- L. Wilbraham, F.-X. Coudert and I. Ciofini, Phys. Chem. Chem. Phys., 2016, 18, 25176–25182 RSC.
- A. R. Kshirsagar, C. Attaccalite, X. Blase, J. Li and R. Poloni, J. Phys. Chem. C, 2021, 125, 7401–7412 CrossRef CAS.
- A. R. Kshirsagar, X. Blase, C. Attaccalite and R. Poloni, J. Phys. Chem. Lett., 2021, 12, 4045–4051 CrossRef CAS PubMed.
- M. Hussain, X. Song, J. Zhao, Y. Luo and C. Hao, Mol. Phys., 2019, 117, 823–830 CrossRef CAS.
- T. Feng, D. Streater, B. Sun, K. Duisenova, D. Wang, Y. Liu, J. Huang and J. Zhang, J. Phys. Chem. Lett., 2022, 13, 1398–1405 CrossRef CAS PubMed.
- S. Sun, H.-z. Ma, X. Zhang and Y.-c. Ma, Chin. J. Chem. Phys., 2020, 33, 569–577 CrossRef CAS.
- A. Molina-Sánchez, ACS Appl. Energy Mater., 2018, 1, 6361–6367 CrossRef.
- J. Leveillee, C. Katan, L. Zhou, A. D. Mohite, J. Even, S. Tretiak, A. Schleife and A. J. Neukirch, Phys. Rev. Mater., 2018, 2, 105406 CrossRef CAS.
- X. Zhu, H. Su, R. A. Marcus and M. E. Michel-Beyerle, J. Phys. Chem. Lett., 2014, 5, 3061–3065 CrossRef CAS PubMed.
- G. Giorgi, K. Yamashita and M. Palummo, J. Phys. Chem. Lett., 2018, 9, 5891–5896 CrossRef CAS PubMed.
- C. Quarti, N. Marchal and D. Beljonne, J. Phys. Chem. Lett., 2018, 9, 3416–3424 CrossRef CAS PubMed.
- Y. Cho and T. C. Berkelbach, J. Phys. Chem. Lett., 2019, 10, 6189–6196 CrossRef CAS PubMed.
- Z. Zhang, W.-H. Fang, M. V. Tokina, R. Long and O. V. Prezhdo, Nano Lett., 2018, 18, 2459–2466 CrossRef CAS PubMed.
- M. D. Smith, L. Pedesseau, M. Kepenekian, I. C. Smith, C. Katan, J. Even and H. I. Karunadasa, Chem. Sci., 2017, 8, 1960–1968 RSC.
- B. Monserrat, J. Condens. Matter Phys., 2018, 30, 083001 CrossRef PubMed.
- T. Nelson, S. Fernandez-Alberti, A. E. Roitberg and S. Tretiak, Acc. Chem. Res., 2014, 47, 1155–1164 CrossRef CAS PubMed.
- T. R. Nelson, A. J. White, J. A. Bjorgaard, A. E. Sifain, Y. Zhang, B. Nebgen, S. Fernandez-Alberti, D. Mozyrsky, A. E. Roitberg and S. Tretiak, Chem. Rev., 2020, 120, 2215–2287 CrossRef CAS PubMed.
- W. Li, Y. She, A. S. Vasenko and O. V. Prezhdo, Nanoscale, 2021, 13, 10239–10265 RSC.
- P. J. Ollitrault, G. Mazzola and I. Tavernelli, Phys. Rev. Lett., 2020, 125, 260511 CrossRef CAS PubMed.
- D. Mac Kernan, G. Ciccotti and R. Kapral, J. Phys. Chem. B, 2008, 112, 424–432 CrossRef CAS PubMed.
- M. Barbatti, Wiley Interdiscip. Rev.: Comput. Mol. Sci., 2011, 1, 620–633 CAS.
- P. Drude, Ann. Phys., 1900, 306, 566–613 CrossRef.
- P. Drude, Ann. Phys., 1900, 308, 369–402 CrossRef.
- A. Sommerfeld, Z. Phys., 1928, 47, 1–32 CrossRef CAS.
- J. Hubbard, Proc. R. Soc. London, Ser. A, 1963, 276, 238–257 Search PubMed.
- W. Heisenberg, Original Scientific Papers Wissenschaftliche Originalarbeiten, Springer, 1985, pp. 580–597 Search PubMed.
- T. Holstein, Ann. Phys., 1959, 8, 325–342 CAS.
- T. Holstein, Ann. Phys., 1959, 8, 343–389 CAS.
- R. Kováčik, S. S. Murthy, C. E. Quiroga, C. Ederer and C. Franchini, Phys. Rev. B, 2016, 93, 075139 CrossRef.
- W. Jiang, X. Ni and F. Liu, Acc. Chem. Res., 2021, 54, 416–426 CrossRef CAS PubMed.
- B. Cui, X. Zheng, J. Wang, D. Liu, S. Xie and B. Huang, Nat. Commun., 2020, 11, 1–8 CrossRef PubMed.
- W. Jiang, S. Zhang, Z. Wang, F. Liu and T. Low, Nano Lett., 2020, 20, 1959–1966 CrossRef CAS PubMed.
- H. Chen, S. Zhang, W. Jiang, C. Zhang, H. Guo, Z. Liu, Z. Wang, F. Liu and X. Niu, J. Mater. Chem. A, 2018, 6, 11252–11259 RSC.
- Y. Tanimura, J. Phys. Soc. Jpn., 2006, 75, 082001 CrossRef.
- A. Ishizaki and G. R. Fleming, J. Chem. Phys., 2009, 130, 234110 CrossRef PubMed.
- B. Kloss, D. R. Reichman and R. Tempelaar, Phys. Rev. Lett., 2019, 123, 126601 CrossRef CAS PubMed.
- I. S. Dunn, R. Tempelaar and D. R. Reichman, J. Chem. Phys., 2019, 150, 184109 CrossRef PubMed.
- M. R. Philpott, J. Chem. Phys., 1971, 55, 2039–2054 CrossRef.
- F. C. Spano, J. Chem. Phys., 2005, 122, 234701 CrossRef PubMed.
- F. C. Spano, J. Chem. Phys., 2002, 116, 5877–5891 CrossRef CAS.
- F. C. Spano, J. Chem. Phys., 2003, 118, 981–994 CrossRef CAS.
- A. Stradomska and P. Petelenz, J. Chem. Phys., 2009, 130, 094705 CrossRef PubMed.
- A. Stradomska and P. Petelenz, J. Chem. Phys., 2009, 131, 044507 CrossRef PubMed.
- M. Hoffmann and Z. Soos, Phys. Rev. B: Condens. Matter Mater. Phys., 2002, 66, 024305 CrossRef.
- P. Scherer and S. F. Fischer, Chem. Phys., 1984, 86, 269–283 CrossRef CAS.
- J. Roden, A. Eisfeld and J. S. Briggs, Chem. Phys., 2008, 352, 258–266 CrossRef CAS.
- D. Dell'Angelo, M. R. Momeni, S. Pearson and F. A. Shakib, J. Chem. Phys., 2022, 156, 044109 CrossRef PubMed.
- R. Ghosh and F. Paesani, Chem. Sci., 2021, 12, 8373–8384 RSC.
- R. Ghosh and F. Paesani, J. Phys. Chem. Lett., 2021, 12, 9442–9448 CrossRef CAS PubMed.
- D. B. Straus and C. R. Kagan, J. Phys. Chem. Lett., 2018, 9, 1434–1447 CrossRef CAS PubMed.
- A. R. Srimath Kandada and C. Silva, J. Phys. Chem. Lett., 2020, 11, 3173–3184 CrossRef CAS PubMed.
- S. Neutzner, F. Thouin, D. Cortecchia, A. Petrozza, C. Silva and A. R. S. Kandada, Phys. Rev. Mater., 2018, 2, 064605 CrossRef CAS.
- W. K. Haug, E. M. Moscarello, E. R. Wolfson and P. L. McGrier, Chem. Soc. Rev., 2020, 49, 839–864 RSC.
- A. M. Rice, C. R. Martin, V. A. Galitskiy, A. A. Berseneva, G. A. Leith and N. B. Shustova, Chem. Rev., 2019, 120, 8790–8813 CrossRef PubMed.
- S. Xu and Q. Zhang, Mater. Today Energy, 2021, 20, 100635 CrossRef CAS.
- T. Banerjee, F. Podjaski, J. Kröger, B. P. Biswal and B. V. Lotsch, Nat. Rev. Mater., 2021, 6, 168–190 CrossRef CAS.
- E. A. Dolgopolova, A. M. Rice, C. R. Martin and N. B. Shustova, Chem. Soc. Rev., 2018, 47, 4710–4728 RSC.
- S. S. Rajasree, X. Li and P. Deria, Commun. Chem., 2021, 4, 1–14 CrossRef.
- N. J. Hestand and F. C. Spano, Chem. Rev., 2018, 118, 7069–7163 CrossRef CAS PubMed.
- L. Gisslén and R. Scholz, Phys. Rev. B: Condens. Matter Mater. Phys., 2009, 80, 115309 CrossRef.
- R. Ghosh, C. M. Pochas and F. C. Spano, J. Phys. Chem. C, 2016, 120, 11394–11406 CrossRef CAS.
- R. Ghosh, A. R. Chew, J. Onorato, V. Pakhnyuk, C. K. Luscombe, A. Salleo and F. C. Spano, J. Phys. Chem. C, 2018, 122, 18048–18060 CrossRef CAS.
- R. Ghosh, C. K. Luscombe, M. Hambsch, S. C. Mannsfeld, A. Salleo and F. C. Spano, Chem. Mater., 2019, 31, 7033–7045 CrossRef CAS.
- A. R. Chew, R. Ghosh, Z. Shang, F. C. Spano and A. Salleo, J. Phys. Chem. Lett., 2017, 8, 4974–4980 CrossRef CAS PubMed.
- A. R. Chew, R. Ghosh, V. Pakhnyuk, J. Onorato, E. C. Davidson, R. A. Segalman, C. K. Luscombe, F. C. Spano and A. Salleo, Adv. Funct. Mater., 2018, 28, 1804142 CrossRef.
- C. M. Pochas and F. C. Spano, J. Chem. Phys., 2014, 140, 244902 CrossRef PubMed.
- J. Clark, C. Silva, R. H. Friend and F. C. Spano, Phys. Rev. Lett., 2007, 98, 206406 CrossRef PubMed.
- E. T. Niles, J. D. Roehling, H. Yamagata, A. J. Wise, F. C. Spano, A. J. Moulé and J. K. Grey, J. Phys. Chem. Lett., 2012, 3, 259–263 CrossRef CAS.
- A. De Sio, F. Troiani, M. Maiuri, J. Réhault, E. Sommer, J. Lim, S. F. Huelga, M. B. Plenio, C. A. Rozzi and G. Cerullo, et al. , Nat. Commun., 2016, 7, 1–8 Search PubMed.
- W. Barford and M. Marcus, J. Chem. Phys., 2017, 146, 130902 CrossRef PubMed.
- M. Marcus, J. D. Milward, A. Köhler and W. Barford, J. Phys. Chem. A, 2018, 122, 3621–3625 CrossRef CAS PubMed.
- F. Paquin, H. Yamagata, N. J. Hestand, M. Sakowicz, N. Bérubé, M. Côté, L. X. Reynolds, S. A. Haque, N. Stingelin and F. C. Spano, et al. , Phys. Rev. B: Condens. Matter Mater. Phys., 2013, 88, 155202 CrossRef.
- J. D. Milward, M. Marcus, A. Köhler and W. Barford, J. Chem. Phys., 2018, 149, 044903 CrossRef PubMed.
- S. M. Janke, M. B. Qarai, V. Blum and F. C. Spano, J. Chem. Phys., 2020, 152, 144702 CrossRef CAS PubMed.
- A. Oleson, T. Zhu, I. S. Dunn, D. Bialas, Y. Bai, W. Zhang, M. Dai, D. R. Reichman, R. Tempelaar and L. Huang, et al. , J. Phys. Chem. C, 2019, 123, 20567–20578 CrossRef CAS.
- C. Kaufmann, D. Bialas, M. Stolte and F. Würthner, J. Am. Chem. Soc., 2018, 140, 9986–9995 CrossRef CAS PubMed.
- D. Beljonne, G. Pourtois, C. Silva, E. Hennebicq, L. Herz, R. Friend, G. Scholes, S. Setayesh, K. Müllen and J. Brédas, Proc. Natl. Acad. Sci. U. S. A., 2002, 99, 10982–10987 CrossRef CAS PubMed.
- J. C. Chang, J. Chem. Phys., 1977, 67, 3901–3909 CrossRef CAS.
- A. A. Mostofi, J. R. Yates, Y.-S. Lee, I. Souza, D. Vanderbilt and N. Marzari, Comput. Phys. Commun., 2008, 178, 685–699 CrossRef CAS.
- V. Coropceanu, M. Malagoli, J.-M. André and J.-L. Brédas, J. Am. Chem. Soc., 2002, 124, 10519–10530 CrossRef CAS PubMed.
- M. Andrzejak and P. Petelenz, Phys. Chem. Chem. Phys., 2018, 20, 14061–14071 RSC.
- R. Ghosh and F. C. Spano, Acc. Chem. Res., 2020, 53, 2201–2211 CrossRef CAS PubMed.
- M. B. Qarai, R. Ghosh and F. C. Spano, J. Phys. Chem. C, 2021, 125, 24487–24497 CrossRef CAS.
- R. Merrifield, J. Chem. Phys., 1964, 40, 445–450 CrossRef CAS.
- S. C. Meskers, R. A. Janssen, J. E. Haverkort and J. H. Wolter, Chem. Phys., 2000, 260, 415–439 CrossRef CAS.
- E. McRae, Aust. J. Chem., 1963, 16, 295–314 CAS.
- H. Bässler, Phys. Status Solidi B, 1981, 107, 9–54 CrossRef.
- E. Knapp, Chem. Phys., 1984, 85, 73–82 CrossRef CAS.
- X. Ding, J. Guo, X. Feng, Y. Honsho, J. Guo, S. Seki, P. Maitarad, A. Saeki, S. Nagase and D. Jiang, Angew. Chem., Int. Ed., 2011, 50, 1289–1293 CrossRef CAS PubMed.
- S. Jin, M. Supur, M. Addicoat, K. Furukawa, L. Chen, T. Nakamura, S. Fukuzumi, S. Irle and D. Jiang, J. Am. Chem. Soc., 2015, 137, 7817–7827 CrossRef CAS PubMed.
- J. Frenkel, Phys. Rev., 1931, 37, 17 CrossRef CAS.
- J. Frenkel, Phys. Rev., 1931, 37, 1276 CrossRef.
- M. Kasha, Rev. Mod. Phys., 1959, 31, 162 CrossRef CAS.
- M. Kasha, Radiat. Res., 1963, 20, 55–70 CrossRef CAS PubMed.
- M. Kasha, H. R. Rawls and M. A. El-Bayoumi, Pure Appl. Chem., 1965, 11, 371–392 CAS.
- E. G. McRae and M. Kasha, J. Chem. Phys., 1958, 28, 721–722 CrossRef CAS.
- R. M. Hochstrasser and M. Kasha, Photochem. Photobiol., 1964, 3, 317–331 CrossRef CAS.
- H.-Q. Yin, F. Yin and X.-B. Yin, Chem. Sci., 2019, 10, 11103–11109 RSC.
- X. Wu, X. Han, Y. Liu, Y. Liu and Y. Cui, J. Am. Chem. Soc., 2018, 140, 16124–16133 CrossRef CAS PubMed.
- P. Albacete, J. I. Martinez, X. Li, A. Lopez-Moreno, S. Mena-Hernando, A. E. Platero-Prats, C. Montoro, K. P. Loh, E. M. Perez and F. Zamora, J. Am. Chem. Soc., 2018, 140, 12922–12929 CrossRef CAS PubMed.
- Y. Fan, Q. Wen, T.-G. Zhan, Q.-Y. Qi, J.-Q. Xu and X. Zhao, Chem.–Eur. J., 2017, 23, 5668–5672 CrossRef CAS PubMed.
- C. Kang, Z. Zhang, V. Wee, A. K. Usadi, D. C. Calabro, L. S. Baugh, S. Wang, Y. Wang and D. Zhao, J. Am. Chem. Soc., 2020, 142, 12995–13002 CrossRef CAS PubMed.
- L. Ascherl, T. Sick, J. T. Margraf, S. H. Lapidus, M. Calik, C. Hettstedt, K. Karaghiosoff, M. Döblinger, T. Clark and K. W. Chapman, et al. , Nat. Chem., 2016, 8, 310–316 CrossRef CAS.
- E. L. Spitler, B. T. Koo, J. L. Novotney, J. W. Colson, F. J. Uribe-Romo, G. D. Gutierrez, P. Clancy and W. R. Dichtel, J. Am. Chem. Soc., 2011, 133, 19416–19421 CrossRef CAS PubMed.
- W. Zhou, H. Wu and T. Yildirim, Chem. Phys. Lett., 2010, 499, 103–107 CrossRef CAS.
- B. Lukose, A. Kuc and T. Heine, Chem.–Eur. J., 2011, 17, 2388–2392 CrossRef CAS PubMed.
- N. Keller, M. Calik, D. Sharapa, H. R. Soni, P. M. Zehetmaier, S. Rager, F. Auras, A. C. Jakowetz, A. Görling and T. Clark, et al. , J. Am. Chem. Soc., 2018, 140, 16544–16552 CrossRef CAS PubMed.
- H. Yamagata and F. C. Spano, J. Chem. Phys., 2012, 136, 184901 CrossRef CAS PubMed.
- H. Yamagata, D. Maxwell, J. Fan, K. Kittilstved, A. Briseno, M. Barnes and F. Spano, J. Phys. Chem. C, 2014, 118, 28842–28854 CrossRef CAS.
- F. C. Spano and C. Silva, Annu. Rev. Phys. Chem., 2014, 65, 477–500 CrossRef CAS PubMed.
- E. Gutiérrez-Meza, R. Malatesta, H. Li, I. Bargigia, A. R. Srimath Kandada, D. A. Valverde-Chávez, S.-M. Kim, H. Li, N. Stingelin and S. Tretiak, et al. , Sci. Adv., 2021, 7, eabi5197 CrossRef PubMed.
- A. P. Deshmukh, D. Koppel, C. Chuang, D. M. Cadena, J. Cao and J. R. Caram, J. Phys. Chem. C, 2019, 123, 18702–18710 CrossRef CAS.
- X.-H. Jin, M. B. Price, J. R. Finnegan, C. E. Boott, J. M. Richter, A. Rao, S. M. Menke, R. H. Friend, G. R. Whittell and I. Manners, Science, 2018, 360, 897–900 CrossRef CAS PubMed.
- M. Baghgar, J. A. Labastide, F. Bokel, R. C. Hayward and M. D. Barnes, J. Phys. Chem. C, 2014, 118, 2229–2235 CrossRef CAS.
- T. Eder, J. Vogelsang, S. Bange, K. Remmerssen, D. Schmitz, S.-S. Jester, T. J. Keller, S. Höger and J. M. Lupton, Angew. Chem., Int. Ed., 2019, 58, 18898–18902 CrossRef CAS PubMed.
- T. Eder, D. Kraus, S. Höger, J. Vogelsang and J. M. Lupton, ACS Nano, 2022, 16, 6382–6393 CrossRef CAS PubMed.
- M. Balooch Qarai, X. Chang and F. Spano, J. Chem. Phys., 2020, 153, 244901 CrossRef CAS PubMed.
- J. Mizuguchi and K. Tojo, J. Phys. Chem. B, 2002, 106, 767–772 CrossRef CAS.
- P. E. Hartnett, A. Timalsina, H. R. Matte, N. Zhou, X. Guo, W. Zhao, A. Facchetti, R. P. Chang, M. C. Hersam and M. R. Wasielewski, et al. , J. Am. Chem. Soc., 2014, 136, 16345–16356 CrossRef CAS PubMed.
- S. W. Eaton, L. E. Shoer, S. D. Karlen, S. M. Dyar, E. A. Margulies, B. S. Veldkamp, C. Ramanan, D. A. Hartzler, S. Savikhin and T. J. Marks, et al. , J. Am. Chem. Soc., 2013, 135, 14701–14712 CrossRef CAS PubMed.
- S. Yagai, T. Seki, T. Karatsu, A. Kitamura and F. Würthner, Angew. Chem., Int. Ed., 2008, 47, 3367–3371 CrossRef CAS PubMed.
- S. Ghosh, X.-Q. Li, V. Stepanenko and F. Würthner, Chem.–Eur. J., 2008, 14, 11343–11357 CrossRef CAS PubMed.
- A. Sarbu, L. Biniek, J.-M. Guenet, P. J. Mésini and M. Brinkmann, J. Mater. Chem. C, 2015, 3, 1235–1242 RSC.
- D. Bessinger, K. Muggli, M. Beetz, F. Auras and T. Bein, J. Am. Chem. Soc., 2021, 143, 7351–7357 CrossRef CAS PubMed.
- D. Bessinger, L. Ascherl, F. Auras and T. Bein, J. Am. Chem. Soc., 2017, 139, 12035–12042 CrossRef CAS PubMed.
- X. Li, Q. Gao, J. Aneesh, H.-S. Xu, Z. Chen, W. Tang, C. Liu, X. Shi, K. Adarsh and Y. Lu, et al. , Chem. Mater., 2018, 30, 5743–5749 CrossRef CAS.
- M. Wang, M. Ballabio, M. Wang, H.-H. Lin, B. P. Biswal, X. Han, S. Paasch, E. Brunner, P. Liu and M. Chen, et al. , J. Am. Chem. Soc., 2019, 141, 16810–16816 CrossRef CAS PubMed.
- J. M. Urban, G. Chehade, M. Dyksik, M. Menahem, A. Surrente, G. Trippé-Allard, D. K. Maude, D. Garrot, O. Yaffe and E. Deleporte, et al. , J. Phys. Chem. Lett., 2020, 11, 5830–5835 CrossRef CAS PubMed.
- D. B. Straus, N. Iotov, M. R. Gau, Q. Zhao, P. J. Carroll and C. R. Kagan, J. Phys. Chem. Lett., 2019, 10, 1198–1205 CrossRef CAS PubMed.
- W. A. Dunlap-Shohl, E. T. Barraza, A. Barrette, S. Dovletgeldi, G. Findik, D. J. Dirkes, C. Liu, M. K. Jana, V. Blum and W. You, et al. , Mater. Horiz., 2019, 6, 1707–1716 RSC.
- D. Marongiu, M. Saba, F. Quochi, A. Mura and G. Bongiovanni, J. Mater. Chem. C, 2019, 7, 12006–12018 RSC.
- H. P. Hjalmarson, H. Büttner and J. D. Dow, Phys. Rev. B: Condens. Matter Mater. Phys., 1981, 24, 6010 CrossRef CAS.
- S. Brazovskii and N. Kirova, Chem. Soc. Rev., 2010, 39, 2453–2465 RSC.
- C. M. Mauck and W. A. Tisdale, Trends Chem., 2019, 1, 380–393 CrossRef CAS.
- F. Thouin, D. A. Valverde-Chávez, C. Quarti, D. Cortecchia, I. Bargigia, D. Beljonne, A. Petrozza, C. Silva and A. R. Srimath Kandada, Nat. Mater., 2019, 18, 349–356 CrossRef CAS PubMed.
- Y. Zhai, S. Baniya, C. Zhang, J. Li, P. Haney, C.-X. Sheng, E. Ehrenfreund and Z. V. Vardeny, Sci. Adv., 2017, 3, e1700704 CrossRef PubMed.
- K. Posmyk, N. Zawadzka, M. Dyksik, A. Surrente, D. K. Maude, T. Kazimierczuk, A. Babiński, M. R. Molas, W. Paritmongkol and M. Maçzka, et al. , J. Phys. Chem. Lett., 2022, 13, 4463–4469 CrossRef CAS PubMed.
- D. B. Mitzi, K. Chondroudis and C. R. Kagan, Inorg. Chem., 1999, 38, 6246–6256 CrossRef CAS PubMed.
- T. Kataoka, T. Kondo, R. Ito, S. Sasaki, K. Uchida and N. Miura, Phys. Rev. B: Condens. Matter Mater. Phys., 1993, 47, 2010 CrossRef CAS PubMed.
- M. Baranowski, S. J. Zelewski, M. Kepenekian, B. Traoré, J. M. Urban, A. Surrente, K. Galkowski, D. K. Maude, A. Kuc and E. P. Booker, et al. , ACS Energy Lett., 2019, 4, 2386–2392 CrossRef CAS.
- K. Gauthron, J. Lauret, L. Doyennette, G. Lanty, A. Al Choueiry, S. Zhang, A. Brehier, L. Largeau, O. Mauguin and J. Bloch, et al. , Opt. Express, 2010, 18, 5912–5919 CrossRef CAS PubMed.
- W. Tao, Y. Zhang and H. Zhu, Acc. Chem. Res., 2022, 55, 345–353 CrossRef CAS PubMed.
- W. J. Newsome, A. Chakraborty, R. T. Ly, G. S. Pour, D. C. Fairchild, A. J. Morris and F. J. Uribe-Romo, Chem. Sci., 2020, 11, 4391–4396 RSC.
- A. M. Rice, W. B. Fellows, E. A. Dolgopolova, A. B. Greytak, A. K. Vannucci, M. D. Smith, S. G. Karakalos, J. A. Krause, S. M. Avdoshenko and A. A. Popov, et al. , Angew. Chem., Int. Ed., 2017, 56, 4525–4529 CrossRef CAS PubMed.
- D. Sheberla, L. Sun, M. A. Blood-Forsythe, S. Er, C. R. Wade, C. K. Brozek, A. Aspuru-Guzik and M. Dincă, J. Am. Chem. Soc., 2014, 136, 8859–8862 CrossRef CAS PubMed.
- R. Haldar, M. Jakoby, A. Mazel, Q. Zhang, A. Welle, T. Mohamed, P. Krolla, W. Wenzel, S. Diring and F. Odobel, et al. , Nat. Commun., 2018, 9, 1–8 CrossRef CAS PubMed.
- L. Gutiérrez-Arzaluz, J. Jia, C. Gu, J. Czaban-Jozwiak, J. Yin, O. Shekhah, O. M. Bakr, M. Eddaoudi and O. F. Mohammed, J. Phys. Chem. Lett., 2021, 12, 4917–4927 CrossRef PubMed.
- Y. A. Mezenov, A. A. Krasilin, V. P. Dzyuba, A. Nominé and V. A. Milichko, Adv. Sci., 2019, 6, 1900506 CrossRef PubMed.
- M. Oldenburg, A. Turshatov, D. Busko, S. Wollgarten, M. Adams, N. Baroni, A. Welle, E. Redel, C. Wöll and B. S. Richards, et al. , Adv. Mater., 2016, 28, 8477–8482 CrossRef CAS PubMed.
- A. Windischbacher, L. Steiner, R. Haldar, C. Wöll, E. Zojer and A.-M. Kelterer, Molecules, 2020, 25, 4230 CrossRef CAS PubMed.
- W.-M. Liao, J.-H. Zhang, S.-Y. Yin, H. Lin, X. Zhang, J. Wang, H.-P. Wang, K. Wu, Z. Wang and Y.-N. Fan, et al. , Nat. Commun., 2018, 9, 1–9 CrossRef PubMed.
- R. Haldar, A. Mazel, M. Krstić, Q. Zhang, M. Jakoby, I. A. Howard, B. S. Richards, N. Jung, D. Jacquemin and S. Diring, et al. , Nat. Commun., 2019, 10, 1–7 CrossRef CAS PubMed.
- J. Nyakuchena, S. Ostresh, D. Streater, B. Pattengale, J. Neu, C. Fiankor, W. Hu, E. D. Kinigstein, J. Zhang and X. Zhang, et al. , J. Am. Chem. Soc., 2020, 142, 21050–21058 CrossRef CAS PubMed.
- J. Clark, J.-F. Chang, F. C. Spano, R. H. Friend and C. Silva, Appl. Phys. Lett., 2009, 94, 117 Search PubMed.
- F. C. Spano and H. Yamagata, J. Phys. Chem. B, 2011, 115, 5133–5143 CrossRef CAS PubMed.
- S. Kahmann, D. Fazzi, G. J. Matt, W. Thiel, M. A. Loi and C. J. Brabec, J. Phys. Chem. Lett., 2016, 7, 4438–4444 CrossRef CAS PubMed.
- S. Kahmann, M. A. Loi and C. J. Brabec, J. Mater. Chem. C, 2018, 6, 6008–6013 RSC.
- G. Skorupskii, B. A. Trump, T. W. Kasel, C. M. Brown, C. H. Hendon and M. Dincă, Nat. Chem., 2020, 12, 131–136 CrossRef CAS PubMed.
- L. E. Darago, M. L. Aubrey, C. J. Yu, M. I. Gonzalez and J. R. Long, J. Am. Chem. Soc., 2015, 137, 15703–15711 CrossRef CAS PubMed.
- P. Calvani, A. Paolone, P. Dore, S. Lupi, P. Maselli, P. Medaglia and S.-W. Cheong, Phys. Rev. B: Condens. Matter Mater. Phys., 1996, 54, R9592 CrossRef CAS PubMed.
- S. Jin, T. Sakurai, T. Kowalczyk, S. Dalapati, F. Xu, H. Wei, X. Chen, J. Gao, S. Seki and S. Irle, et al. , Chem.–Eur. J., 2014, 20, 14608–14613 CrossRef CAS PubMed.
- R. Österbacka, C. P. An, X. Jiang and Z. V. Vardeny, Science, 2000, 287, 839–842 CrossRef PubMed.
- X. M. Jiang, R. Österbacka, O. Korovyanko, C. P. An, B. Horovitz, R. A. Janssen and Z. V. Vardeny, Adv. Funct. Mater., 2002, 12, 587–597 CrossRef CAS.
- H. Sirringhaus, P. Brown, R. Friend, M. M. Nielsen, K. Bechgaard, B. Langeveld-Voss, A. Spiering, R. A. Janssen, E. Meijer and P. Herwig, et al. , Nature, 1999, 401, 685–688 CrossRef CAS.
- J.-F. Chang, J. Clark, N. Zhao, H. Sirringhaus, D. W. Breiby, J. W. Andreasen, M. M. Nielsen, M. Giles, M. Heeney and I. McCulloch, Phys. Rev. B: Condens. Matter Mater. Phys., 2006, 74, 115318 CrossRef.
- J.-F. Chang, H. Sirringhaus, M. Giles, M. Heeney and I. McCulloch, Phys. Rev. B: Condens. Matter Mater. Phys., 2007, 76, 205204 CrossRef.
- P. J. Brown, D. S. Thomas, A. Köhler, J. S. Wilson, J.-S. Kim, C. M. Ramsdale, H. Sirringhaus and R. H. Friend, Phys. Rev. B: Condens. Matter Mater. Phys., 2003, 67, 064203 CrossRef.
- N. Kim, S. Kee, S. H. Lee, B. H. Lee, Y. H. Kahng, Y.-R. Jo, B.-J. Kim and K. Lee, Adv. Mater., 2014, 26, 2268–2272 CrossRef CAS PubMed.
- H. Shirakawa, Synth. Met., 1995, 69, 3–8 CrossRef CAS.
- D. T. Scholes, P. Y. Yee, J. R. Lindemuth, H. Kang, J. Onorato, R. Ghosh, C. K. Luscombe, F. C. Spano, S. H. Tolbert and B. J. Schwartz, Adv. Funct. Mater., 2017, 27, 1702654 CrossRef.
- T. J. Aubry, J. C. Axtell, V. M. Basile, K. Winchell, J. R. Lindemuth, T. M. Porter, J.-Y. Liu, A. N. Alexandrova, C. P. Kubiak and S. H. Tolbert, et al. , Adv. Mater., 2019, 31, 1805647 CrossRef PubMed.
- Y. Zhong, V. Untilova, D. Muller, S. Guchait, C. Kiefer, L. Herrmann, N. Zimmermann, M. Brosset, T. Heiser and M. Brinkmann, Adv. Funct. Mater., 2022, 2202075 CrossRef CAS.
- E. M. Thomas, K. A. Peterson, A. H. Balzer, D. Rawlings, N. Stingelin, R. A. Segalman and M. L. Chabinyc, Adv. Electron. Mater., 2020, 6, 2000595 CrossRef CAS.
- A. J. Moulé, G. Gonel, T. L. Murrey, R. Ghosh, J. Saska, N. E. Shevchenko, I. Denti, A. S. Fergerson, R. M. Talbot and N. L. Yacoub, et al. , Adv. Electron. Mater., 2022, 8, 2100888 CrossRef.
- P. W. Doheny, J. K. Clegg, F. Tuna, D. Collison, C. J. Kepert and D. M. D'Alessandro, Chem. Sci., 2020, 11, 5213–5220 RSC.
- B. Ding, C. Hua, C. J. Kepert and D. M. D'Alessandro, Chem. Sci., 2019, 10, 1392–1400 RSC.
- M. L. Aubrey, B. M. Wiers, S. C. Andrews, T. Sakurai, S. E. Reyes-Lillo, S. M. Hamed, C.-J. Yu, L. E. Darago, J. A. Mason and J.-O. Baeg, et al. , Nat. Mater., 2018, 17, 625–632 CrossRef CAS PubMed.
- M. Yoshizawa, K. Kumazawa and M. Fujita, J. Am. Chem. Soc., 2005, 127, 13456–13457 CrossRef CAS PubMed.
- M. Capizzi, P. Calvani, P. Dore, S. Lupi, P. Maselli, A. Paolone, B. Ruzicka, W. Sadowski and S.-W. Cheong, Phys. Scr., 1996, 1996, 215 CrossRef.
- A. L. Bialas and F. C. Spano, J. Phys. Chem. C, 2022, 126, 4067–4081 CrossRef CAS.
- V. Hernandez, J. E. Roman and V. Vidal, ACM Trans. Math. Software, 2005, 31, 351–362 CrossRef.
- J. E. Roman, C. Campos, E. Romero and A. Tomas, SLEPc Users Manual, D. Sistemes Informàtics i Computació, Universitat Politècnica de València Technical Report DSIC-II/24/02 – Revision 3.14, 2020.
- S. Balay, S. Abhyankar, M. F. Adams, J. Brown, P. Brune, K. Buschelman, L. Dalcin, A. Dener, V. Eijkhout, W. D. Gropp, D. Karpeyev, D. Kaushik, M. G. Knepley, D. A. May, L. C. McInnes, R. T. Mills, T. Munson, K. Rupp, P. Sanan, B. F. Smith, S. Zampini, H. Zhang and H. Zhang, PETSc Web page, 2019, https://www.mcs.anl.gov/petsc.
| This journal is © The Royal Society of Chemistry 2023 |