
Impact of thermal annealing and laser treatment on the morphology and optical responses of mono- and bi-metallic plasmonic honeycomb lattice†
Yi-Ju
Chen
 a,
Gabriele
Schmidl
a,
Andrea
Dellith
a,
Annett
Gawlik
a,
Guobin
Jia
a,
Thomas
Bocklitz
abc,
Xiaofei
Wu
a,
Jonathan
Plentz
a and
Jer-Shing
Huang
*abde
a,
Gabriele
Schmidl
a,
Andrea
Dellith
a,
Annett
Gawlik
a,
Guobin
Jia
a,
Thomas
Bocklitz
abc,
Xiaofei
Wu
a,
Jonathan
Plentz
a and
Jer-Shing
Huang
*abde
aLeibniz Institute of Photonic Technology, Member of Leibniz Health Technologies, Member of the Leibniz Centre for Photonics in Infection Research (LPI), Albert-Einstein Straße 9, 07745 Jena, Germany. E-mail: jer-shing.huang@leibniz-ipht.de
bInstitute of Physical Chemistry and Abbe Center of Photonics, Friedrich Schiller University Jena, Member of the Leibniz Centre for Photonics in Infection Research (LPI), Helmholtzweg 4, 07743 Jena, Germany
cInstitute of Computer Science, Faculty of Mathematics, Physics & Computer Science, University Bayreuth, Universitätsstraße 30, 95447 Bayreuth, Germany
dResearch Center for Applied Sciences, Academia Sinica, 128 Sec. 2, Academia Road, Nankang District, Taipei 11529, Taiwan
eDepartment of Electrophysics, National Yang Ming Chiao Tung University, No. 1001, Daxue Road, East District, Hsinchu 30010, Taiwan
First published on 22nd September 2023
Abstract
Plasmonic nanoparticle arrays with a specific lattice arrangement can support surface lattice resonances (SLRs). SLR exhibits a sharp spectral peak and finds many applications including optical sensing and plasmonic lasers. To optimize SLR for application, a robust method that allows the mass production of plasmonic nanoparticle arrays with refined particle morphology and well-defined lattice arrangement is required. In this work, we combine nanosphere lithography (NSL) with thermal annealing or nanosecond-pulsed laser treatment to refine plasmonic nanoparticles in a honeycomb lattice. We comparatively study the effects of the two treatment methods on the particle morphology and lattice arrangement of mono (Ag and Pd) and bi-metallic (Ag–Pd) nanoparticle lattices. In general, thermal annealing preserves the lattice arrangement but fairly changes the particle roundness, while laser treatment produces particles with varying morphologies and spatial distribution. We also theoretically and experimentally investigate the optical responses of Ag nanoparticle lattices produced by different treatment methods. The observed difference in spectra can be attributed to the varying particle morphology, which shifts the localized surface plasmon resonance differently, resulting in a significant change in SLR. These findings provide valuable insights for optimizing plasmonic nanoparticle arrays for various applications.
Introduction
Localized surface plasmon resonance (LSPR) of metal nanoparticles enhances light scattering and absorption, and finds applications in biosensing,1–6 catalysis,7–12 chemical sensing,13–16 bio-imaging,17–20 and biotherapy,21–24 adaptable via size, morphology, and material.To improve the performance of LSPR-based techniques, metal nanoparticles can be arranged into a periodic lattice that supports surface lattice resonances (SLRs), featuring minimal radiative loss and thus sharp spectral peaks. For SLRs, the inter-particle distance should be designed carefully such that the scattered light from one resonator reaches the adjacent resonators in phase to form a collective resonance of all individual resonators in the lattice.25–27 Therefore, SLRs rely on two physical phenomena, namely the material and morphology-dependent LSPR of individual nanoparticles and the photonic diffraction associated with the lattice. By controlling the particle morphology and the lattice arrangement (periodicity and symmetry), SLR can be designed. Plasmonic nanoparticle arrays optimized for SLR can exhibit remarkably high Q factors due to minimal scattering loss.28,29 Due to the hybrid plasmonic-photonic character of the SLR mode, the coupling between the optical mode and emitters can be effectively enhanced, allowing the efficient beaming of the emission along narrow angular and spectral ranges. Therefore, it has been used for solid-state lighting,30–32 and lasing.29,33,34 Other applications such as sensing35–37 and spectroscopy38 have also been demonstrated.
Since SLR relies on well-controlled LSPR and well-defined lattice arrangement, a feasible method to produce nanoparticle arrays with homogeneous particle morphology and pre-designed lattice would be of great interest for applications based on SLRs. Wet-chemical synthesis is well-established to massively produce plasmonic nanoparticles with homogeneous size and shape.39,40 However, it is challenging to arrange the synthesized nanoparticles into a pre-designed lattice on the surface of a substrate, limiting the application of chemically synthesized nanoparticles in SLR devices. Top-down methods based on lithography are more effective for the preparation of pre-designed plasmonic nanoparticle lattices. The two most commonly employed top-down methods are nanosphere lithography (NSL)41–43 and electron-beam lithography or photolithography.33,44 While the latter provides superior resolution and great flexibility in the lattice patterns, the former features rapid, cost-effective, and scalable production without using complex and expensive instruments. Although top-down lithography methods are capable of creating well-defined nanoparticle arrays, they suffer from the imperfection of the nanostructures and particle-to-particle variation, which degrade their optical performance. This problem can be solved by combining top-down lithography-based patterning methods with post-treatment methods to refine the particle morphology.29,45
Thermal annealing and laser treatment are two commonly used metallic nanoparticle refinement methods. However, they refine the particle morphology according to totally different mechanisms. Thermal annealing is a slower and gentler process compared to laser treatment, in which the plasmonic nanoparticles are produced under thermal equilibrium.42,46,47 Therefore, the original spatial arrangement remains after thermal annealing. Laser treatment, on the other hand, is a relatively fast and drastic method.48 Short laser pulses are used to rapidly heat or melt, or even vaporize and ionize the materials.49–52 Such fast and localized deposition of energy can result in local plasma generation. Followed by a fast-cooling process, this method produces plasmonic nanoparticles without thermal equilibrium. Rapid cooling is a kinetic process that allows the production of high entropy plasmonic nanoparticles of immiscible materials.11 Due to the rapid deposition of optical energy, laser treatment can lead to the detachment of the material from the surface of the substrate48 and thereby alter the spatial arrangement defined by the lithography method. Therefore, careful optimization of the treatment conditions is crucial for the refinement of the particle morphology and the lattice arrangement. In view of SLR, which relates to the spatial arrangement and the morphology of the particles, different treatment methods may lead to different optical properties of plasmonic nanoparticle arrays. In this work, we comparatively studied the impact of thermal annealing and pulsed-laser treatment on the particle morphology and lattice arrangement of pure Ag, Pd, and bi-metallic Ag–Pd plasmonic nanoparticles in honeycomb lattice prepared by NSL (Fig. 1a). Specifically, the change in the morphology and lattice due to thermal annealing and laser treatment was investigated with respect to the experimentally accessible parameters.
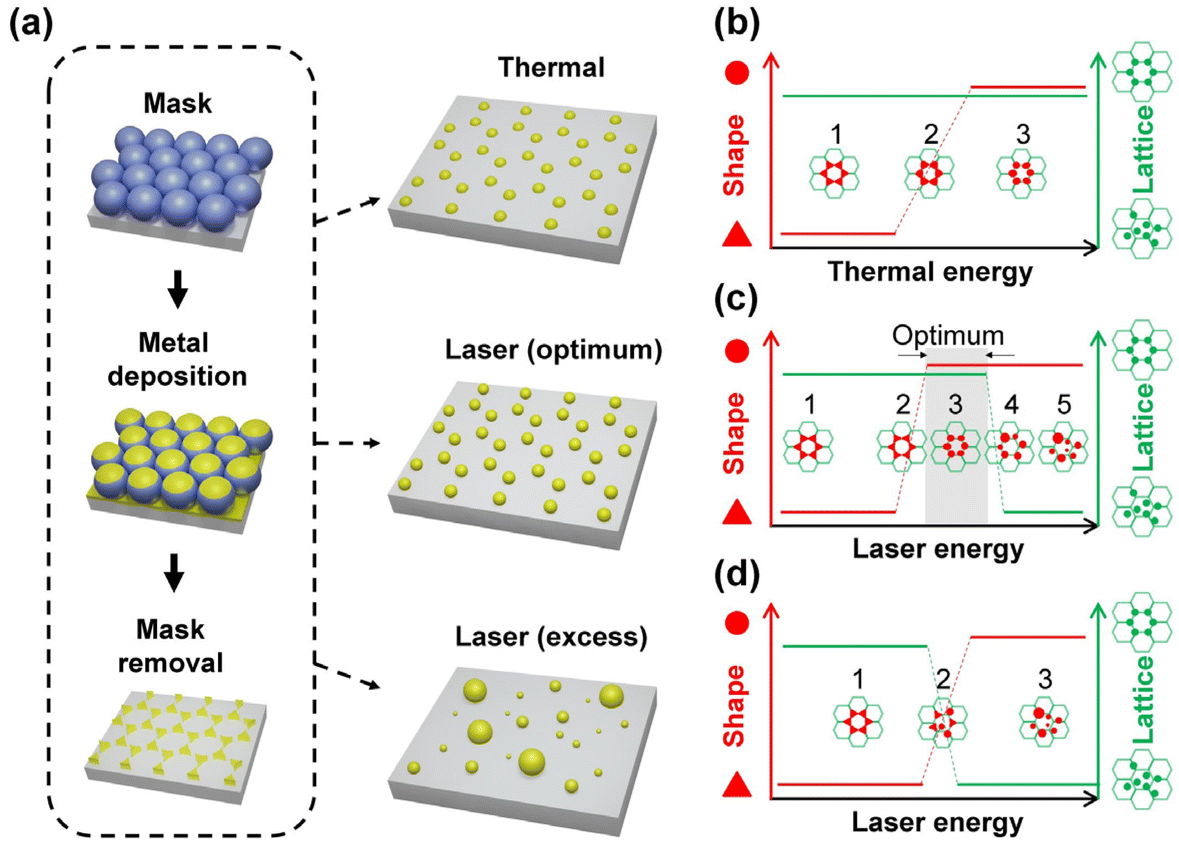 | ||
| Fig. 1 (a) Schematic diagram illustrating the methods for creating the metallic particles based on NSL followed by laser treatment and thermal annealing process. Polystyrene (PS) spheres are coated on the glass substrate with honeycomb-packed vacancy. Pd or Ag films are deposited on the PS sphere mask in sequence by e-beam evaporation. After removing the mask, the honeycomb-packed triangle islands remain. Thermal annealing and laser treatment are used to generate rounded nanoparticles from the triangular islands. While thermal annealing results are rounded but not perfectly spherical particles in a honeycomb lattice, laser treatment leads to spheres. Excess laser energy results in broad size distribution and moves the particles away from the honeycomb lattice positions. (b)–(d) The schematics illustrate the transition of the particle shape (red trace, left axis) and lattice arrangement (green trace, right axis) under thermal annealing (top), laser treatment with (middle) and without (bottom) the possibility to find an optimum window, where the particles are perfectly spherical, and the lattice arrangement is kept. | ||
Basic aspect of the particle formation process
Changing the particle morphology and lattice arrangement requires energy. However, their dependence on thermal annealing and laser treatment parameter can be quite different. In order to turn all triangular islands prepared by NSL into spherical particles without destroying the honeycomb lattice, the optimal windows for thermal and laser energy should be identified. The factors involved in the morphology and lattice change are very complex. Based on the difference in the energy deposition rate, we expect and propose different stages of the transitions of morphology and lattice for thermal annealing (Fig. 1b) and laser treatment (Fig. 1c and d). At a moderate annealing temperature (∼500 °C), the honeycomb lattice is expected to remain unchanged once the system reaches thermal equilibrium, regardless of the annealing time. Therefore, it should be possible to find a suitable annealing time, at which the deposited thermal energy is sufficient to transform the concave triangular islands from NSL into fairly rounded nanoparticles but not enough to move the particle away from their original positions in the honeycomb lattice. Temperatures that cause evaporation of the metal are not suitable. Fig. 1b illustrates three hypothetical transition stages of the particle morphology in thermal annealing with the lattice arrangement kept unchanged. On the other hand, using pulsed-laser treatment, a large amount of energy can be deposited onto the sample within a very short duration, giving the triangular islands both thermal and kinetic energy in a short time. The former can alter the particle morphology and the latter can change the particle position, leading to the destruction of the honeycomb lattice and the increase of particle size inhomogeneity due to particle merging. In fact, it has been shown that drastic pulsed-laser treatment can lead to the detachment (or “jumping”) of the nanoparticles from the substrate surface.48 The results of laser treatment depend on the material of the particle and substrate as well as their interaction, i.e., the wetting effect. Since all the particles are in contact with the substrate, the wettability of the metal on the substrate plays an important role in the results.53–55 In case of low wettability, e.g., Ag on a glass substrate, the particle morphology can be refined at a rather low laser energy while the lattice remains. Therefore, an optimum window of the laser treatment condition to obtain the best-refined particle morphology without destroying the lattice can be expected (Fig. 1c, stage 3). In the case of high wettability, like Pd on a glass substrate, the affinity of the material to the substrate surface is strong. Thus, particle morphology transition has a high energy threshold, beyond which the lattice arrangement can no longer sustain. This leads to randomly distributed nanospheres with almost perfectly spherical morphology but very large size inhomogeneity. In this case, the laser treatment condition for well-arranged spheres is not possible since the morphology transition is stepwise, i.e., no gradual change in the morphology (Fig. 1d). In addition, since there are always small morphological variations between particles, the threshold energy of each particle varies according to its size and shape, resulting in a narrow transition window of laser energy (Fig. 1d, stage 2). Therefore, the coexistence of extremely distinct morphologies, such as perfect spheres and sharp triangles, is possible. By observing the particle morphology and the lattice arrangement at different laser conditions, conclusions on the impact of the thermal and laser treatment can be drawn.Results and discussion
First, we investigated the effect of thermal annealing and laser treatment on pure metals by observing their morphology and lattice arrangement. Honeycomb-packed triangular islands were observed in both Ag and Pd pristine samples (see Fig. 2a and b). After thermal annealing, triangular Ag islands were turned into rounded particles (Fig. 2c). However, the triangular Pd islands remained intact, showing a sharp triangular shape after annealing (Fig. 2d). The evolution of morphology is influenced by several crucial factors, such as the mobility of atoms on the surface, which is often affected by the local atomic arrangement, atomic potential energy, and the affinity of metal and substrate.56 In some cases, the melting temperature of the metal can also play a role.57 Hence, the preservation of triangular Pd islands after thermal annealing can be attributed to either the higher melting point of Pd or its superior wettability when compared to Ag.58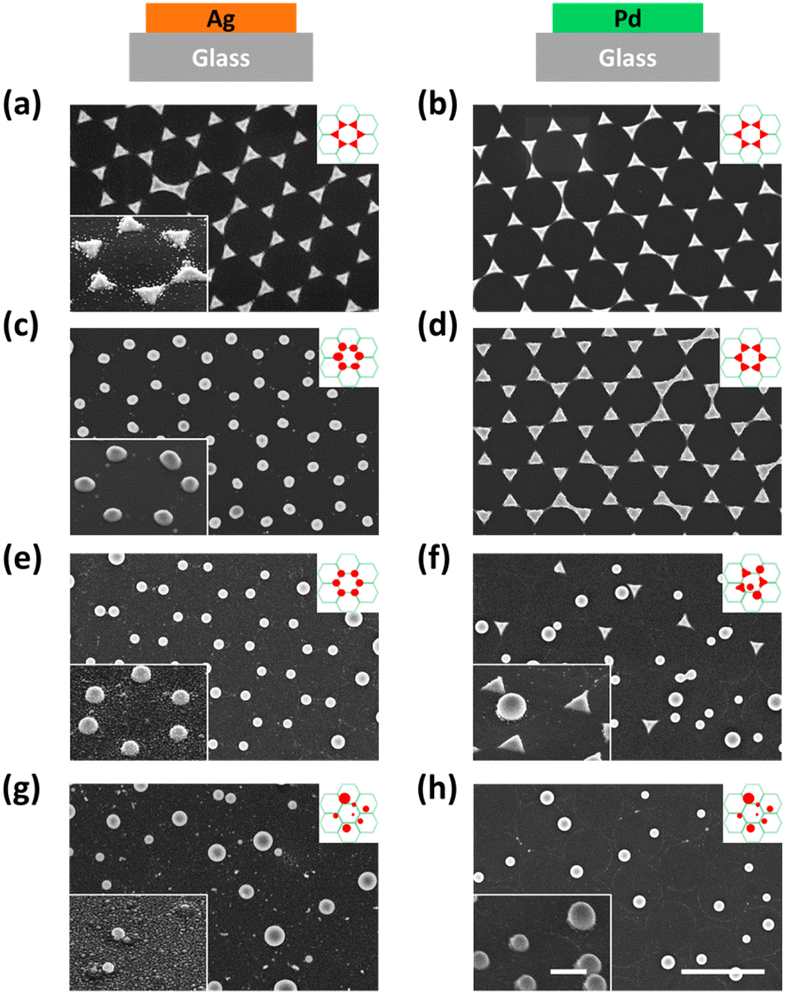 | ||
| Fig. 2 The SEM images of (a) Ag and (b) Pd pristine samples, (c) Ag and (d) Pd particles after thermal annealing, (e) Ag and (f) Pd particles after laser treatment with a single 100 mJ cm−2 pulse, and (g) Ag particles treated with a single 200 mJ cm−2 pulse, and (h) Pd particles treated with five 100 mJ cm−2 pulses. The scale bar is 1 μm and applies to all images. The insets with white frames are SEM images taken with a 45-degree tilt angle, showing the 3D morphology of the particles. The scale bar is 250 nm and applies to all insets. | ||
Next, we investigated the morphological differences between the Ag and Pd laser-treated samples. When a single 100 mJ cm−2 laser pulse was applied to the Ag pristine sample, all the triangular Ag islands turned into spheres and stayed at their original lattice positions, as shown in Fig. 2e. However, for Pd, the triangular Pd islands which were turned into perfect spheres all left their original lattice positions, while those that did not change their shape stayed in the same lattice position (see Fig. 2f). This happened because the contraction leads to the upward movement of the particle mass center. If the kinetic energy of the mass center perpendicular to the substrate surface is higher than the adhesion energy, the particle will detach from the substrate.48
Further increasing the laser pulse energy led to the further production of spheres of various sizes and the complete destruction of the lattice structure for both Ag and Pd, as shown in Fig. 2g and h. More detailed morphological information about all the samples can be found in the zoom-in images provided in Fig. S1.†
All the observations were in good agreement with the model shown in Fig. 1. In the case of Ag for example, when applying a single 100 mJ cm−2 laser pulse which is in the optimum window of laser energy (Fig. 1c, stage 3), a honeycomb-packed sphere array was produced. On the other hand, for Pd, this laser energy fell into its transition window (Fig. 1d, stage 2), resulting in a mixture of triangles staying on the lattice and randomly distributed spheres. Applying the excess laser energy showed the predicted results, i.e., spheres with different sizes and random distribution in both cases, as shown in Fig. 1c, stage 5 for Ag, and Fig. 1d, stage 3 for Pd.
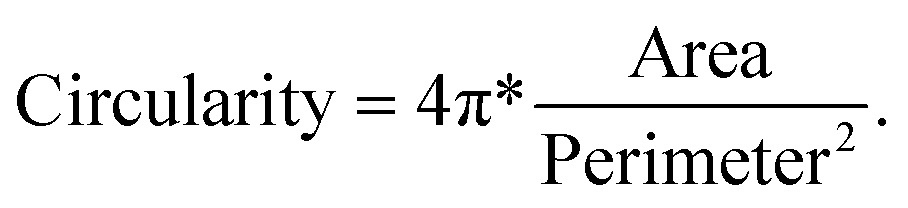
Next, we further investigated the effect of thermal annealing and laser treatment on the morphology of the particles by evaluating the circularity and particle size distribution. The image was analyzed using the ‘Analyzed particle’ plugin in ImageJ, which defines circularity as the degree of roundness of a circular particle, using the formula59
 | (1) |
A circularity value of 1.0 indicates a perfect circle. Fig. 3a shows the circularity and size distribution of the Ag particles from the test samples shown in Fig. 2. The pristine sample had the largest cross-section area with a small size distribution because the triangles are determined by the template and each triangle has the same dimensions. Its average circularity was between 0.2 to 0.6, where 0.2 is the circularity of a perfect concave triangle and 0.6 is the circularity of a perfect equilateral triangle.
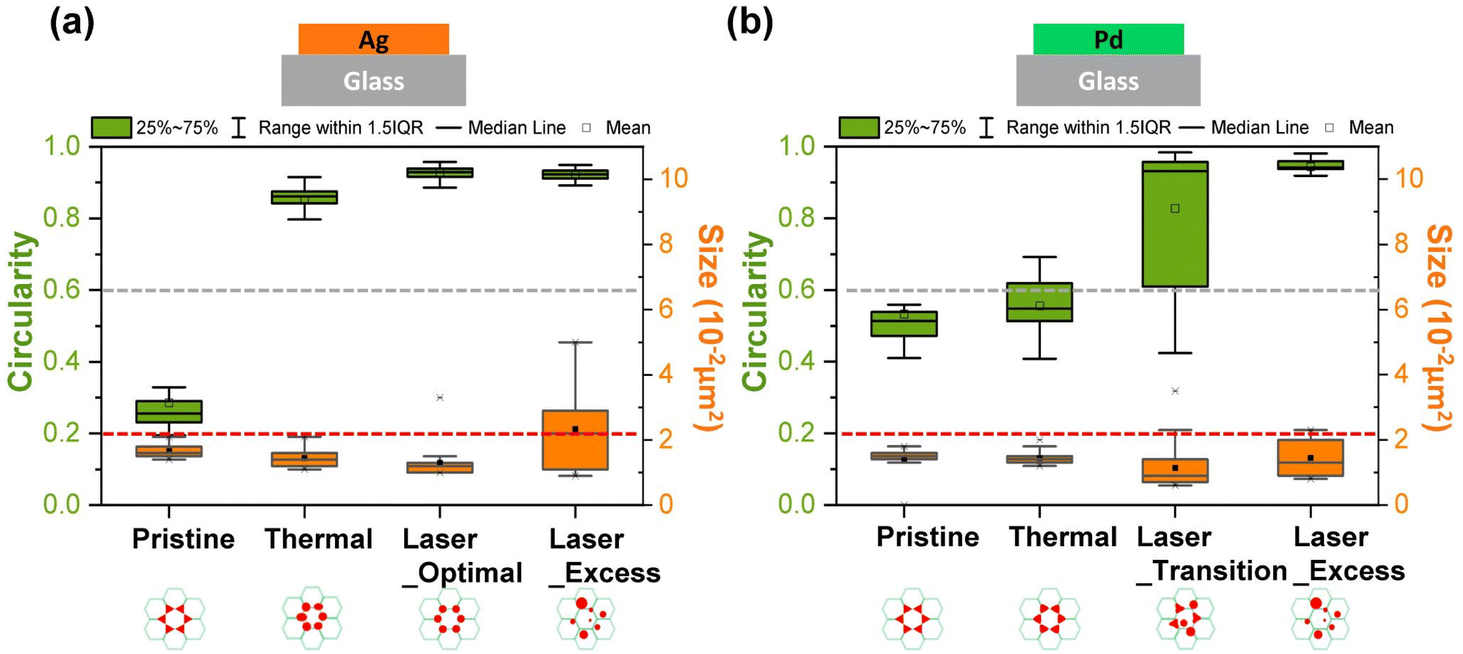 | ||
| Fig. 3 Size and circularity distribution of (a) Ag and (b) Pd particles. The pristine, thermally annealed, and laser-treated samples were statistically analyzed. The red dashed line is the circularity of the perfect concave triangle, and the gray dashed line is the circularity of the perfect equilateral triangle. The scheme below the x-axis indicates the morphology and spatial arrangement of the correlated sample. | ||
To investigate the influence of the laser energy, we applied different pulse numbers and fluences on pure Ag and Pd pristine samples and examined their morphology after laser treatment. First, we fixed the fluence at 70 mJ cm−2 and applied 1, 5, and 10 pulses to the pure Ag pristine sample (Fig. 4a, left column). For the pure Ag sample illuminated by a single laser pulse, the morphology and spatial arrangement of the particles remained unchanged. When increasing the pulse number to 5, triangular particles started to become spherical particles, but the honeycomb arrangement of the particles stayed the same (Fig. 4a, left column). With 10 pulses, almost all the triangular islands from NSL were turned into a spherical shape and the lattice arrangement was well-kept. When increasing the laser fluence to 100 mJ cm−2, even a single pulse led to particle morphology transformation from triangular to an almost perfect sphere without changing the lattice. Further increasing the pulse number to 5 and 10 did not result in a significant improvement in lattice arrangement change at 100 mJ cm−2. However, when the laser fluence was increased to 200 mJ cm−2, this high energy ablated the original Ag particles. Even a single pulse destroyed the lattice and increased the inhomogeneity of the particle size. This is attributed to the high kinetic energy of the particles due to the excessively high laser fluence. This kinetic energy allows the particles to move away from their original lattice positions and merge with other particles to form bigger ones. At this excess fluence, the metal was violently ablated by the laser pulse. Increasing the pulse number to 5 and 10 resulted in the formation of dust-like small Ag nanoparticles all over the illuminated area. This is a result of repeated laser ablation of the Ag particles. Therefore, no large but small dust-like particles were observed.
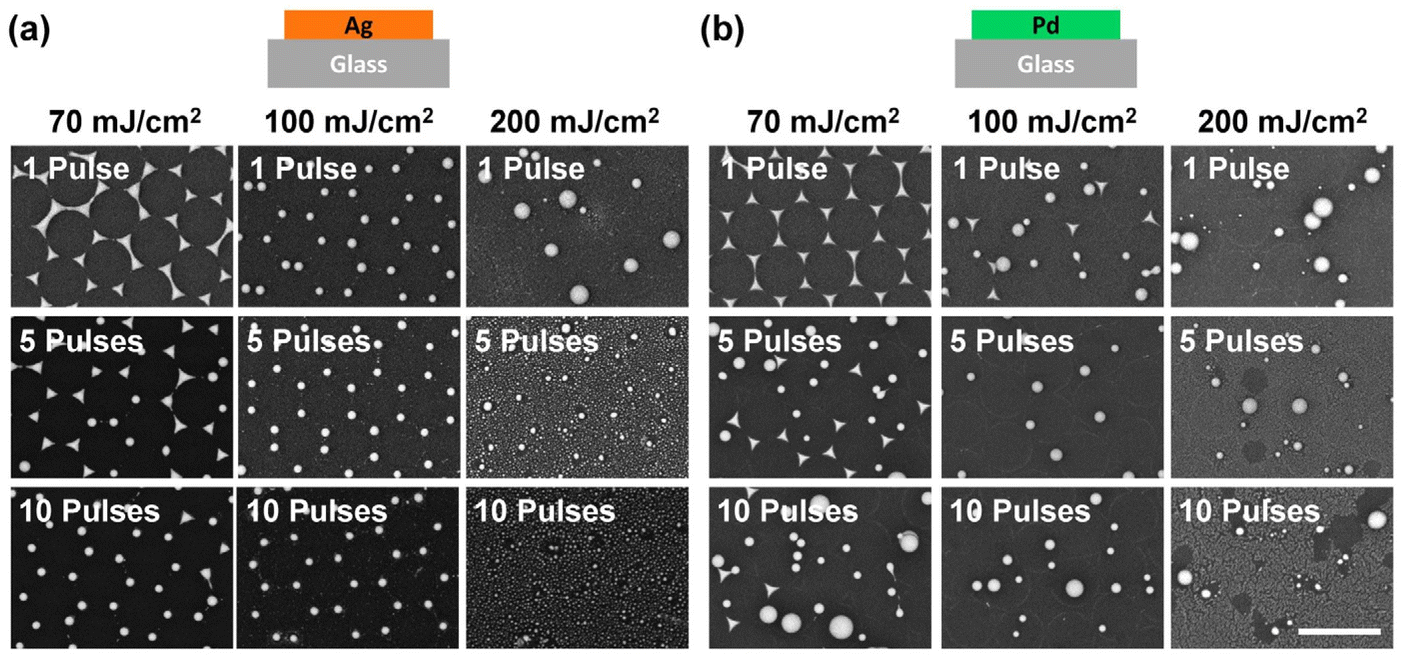 | ||
| Fig. 4 (a) SEM images of Ag honeycomb-packed array treated by 1, 5, and 10 pulses with 70 mJ cm−2, 100 mJ cm−2, and 200 mJ cm−2. (b) SEM images Pd honeycomb-packed array treated by 1, 5, and 10 pulses with 70 mJ cm−2, 100 mJ cm−2, and 200 mJ cm−2. Applying higher laser energy, i.e., using more pulses or higher laser fluence, on either Ag or Pd samples led to more triangular islands turned into spheres. In addition, Ag spheres arranged in a honeycomb lattice were prepared by applying 1, 5, or 10 laser pulses with 100 mJ cm−2 fluence. This indicates that these laser energies are in the optimum windows. The scale bar is 1 μm and applies to all images. | ||
Now we focus on the case of Pd, which we expected to have better wettability on the glass substrate, i.e., stickier to the surface compared to Ag. With a single laser pulse at a fluence of 70 mJ cm−2, the Pd triangular islands remained in their lattice position (Fig. 4b, left column). However, morphological changes from a triangular to a spherical shape were observed among some particles when five laser pulses of 70 mJ cm−2 were applied. As for the lattice arrangement, while the concave triangles remained in the lattice positions, most of the newly transformed spherical particles moved away from their original positions. Also, under this condition, we observed either only almost perfect spherical particles or concave triangular islands but nothing in between. No rounded triangular particles were observed. This suggests that, with laser treatment, the morphology of the Pd islands underwent an abrupt transition rather than a continuous transformation. This is different from the case of Ag on glass and might be attributed to a combined effect of the high wettability of Pd on glass and the kinetic process of laser treatment. The laser pulse provides the kinetic energy to the island to stretch out from the sticky surface due to its wettability. Once the kinetic energy is large enough for the particle to overcome the sticky surface, the Pd material bounds upwards into the air, and the surface tension results in an almost perfect spherical shape. The bounding of the particle is also indirectly supported by the observation that only spherical particles moved away from their original lattice positions.48 With sufficient pulse energy, i.e., higher laser fluence or increased pulse number, multiple particles did also merge into bigger spheres, as shown in the SEM image taken with 10 pulse treatments at 70 mJ cm−2 fluence (Fig. 4b, bottom image of the left column). However, when excessive high fluence, specifically 200 mJ cm−2, was applied, we observed an increasing number of dust-like small particles at high pulse numbers (5 and 10 pulses).
By comparing the results of laser-treated Ag and Pd particles under a fluence of 70 and 100 mJ cm−2, it is clear that the wettability of the metal on the substrate determines the morphology and spatial arrangement of the resulting nanoparticles. With a low wettability material such as Ag, an optimum window of laser condition (including fluence and pulse number) becomes accessible. Within this range, Ag islands transform into spherical nanoparticles without leaving their lattice positions, as illustrated in Fig. 1c. However, with a high wettability, the substrate surface is sticky for Pd triangular islands. Therefore, it is not possible to optimize the laser condition to create spherical Pd nanoparticles without destroying the lattice arrangement, as shown in Fig. 1d.
With a high laser fluence of 200 mJ cm−2, the lattice arrangement of both Ag and Pd particles was destroyed, and many small particles were generated, suggesting a complete breakdown of metallic material into small dust particles. It's worth noting that employing finer steps for the parameter scan may be beneficial and necessary to observe a more gradual morphology transition.
As illustrated in Fig. 5, in general, the difference in the morphology transition between thermal annealing and laser treatment can be explained as follows. Thermal annealing is a slow process under thermal equilibrium. It gently provides thermal energy to increase the lattice vibration until the particle melts into liquid form. Since the melting point of nanoscale objects decreases as the size shrinks, the melting point of the nanoparticle is always smaller than the bulk metal.60 Thermal annealing transforms the particle morphology by melting the sharp corners of the triangles, leading to rounded triangles. In contrast, in laser treatment, a huge amount of energy can be deposited onto the sample in a short time, leading to the melting of the particles. Since the triangular islands are sitting on the interface of a glass substrate and open space, the material melts and shrinks more to the open space side, i.e., the out-of-plane direction, to maintain the overall volume of a particle, while the bottom part of the particle still sticks on the substrate when treating at low laser energies. When the applied energy is high enough, the contraction of the material leads to the mass center of the particle moving upwards, resulting in a jumping particle.
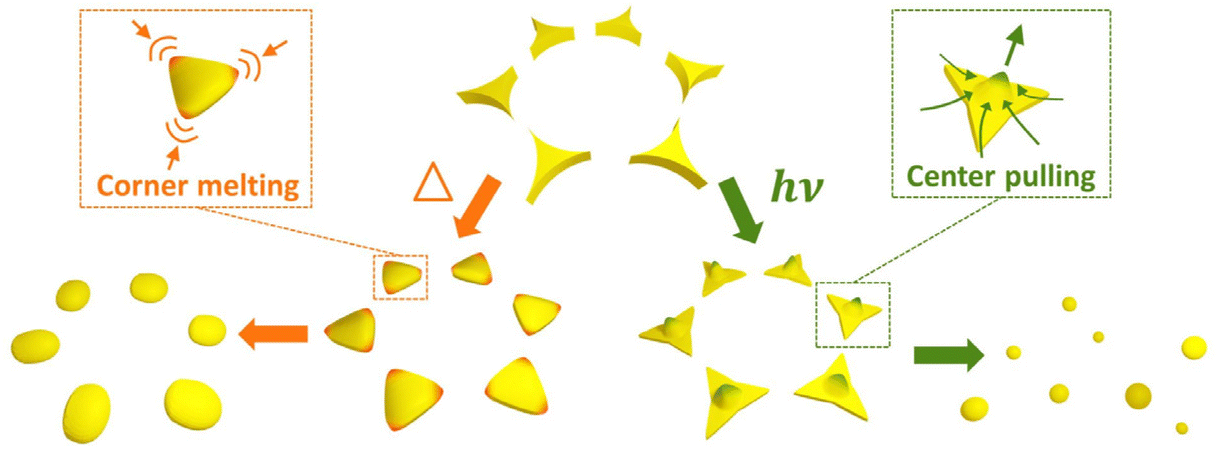 | ||
| Fig. 5 Schematic illustration of the morphology transformation induced by thermal annealing (left orange branch, indicated by “Δ”) and laser treatment (right green branch, indicated by “hν”). Thermal annealing starts the morphology transformation from the melting of the sharp corners (orange dashed box) and refines the particle morphology from triangles with sharp edges to potatoes-like rounded particles with slight imperfections in the roundedness. Pulsed laser treatment induces inhomogeneous expansion that pulls the material to the center, leading to out-of-plane stretching into the open upper half-space. With excess laser energy, the stretching provides sufficient kinetic energy for the particles to jump away from their original lattice positions and merge with other particles, resulting in perfectly spherical particles at large size distributions and random positions. | ||
Having understood the effect of the materials and treatment methods on the morphology and the spatial position of the particles, we further investigated the cases of binary metallic samples with different stacking orders, i.e., different metals in contact with the substrate. The purpose is to understand how one can create bi-metallic nanoparticles using laser treatment and thermal annealing. Thus, two different samples in Ag–Pd bi-metallic system were prepared from the NSL method, namely Pd/Ag/Glass and Ag/Pd/Glass, as indicated in Fig. 6. After thermal annealing, both samples showed similar shapes with rounded edges, and the spatial arrangement of the honeycomb lattice was kept, indicating that the stacking order of the Pd and Ag film is not important for the particle morphology after thermal annealing. In contrast, for the laser-treated samples in Fig. 6c, almost all the particles turned into spheres with larger size distribution and lost their original lattice arrangement when Ag was used as the interlayer, while more triangles remained for the Ag/Pd/Glass sample (in Fig. 6d). This clearly shows that the morphology of the particle is significantly influenced by the interfacing material. We attribute this phenomenon to the slight wetting effect of Ag on the substrate.58 Furthermore, the observed difference may also be attributed to variations in the absorption of the excitation wavelength by the material. Given that Pd exhibits higher absorption at 248 nm compared to Ag, it is more likely for the Pd/Ag/Glass configuration to result in spherical particles than the Ag/Pd/Glass configuration. Further discussion regarding the impact of pulse number and pulse fluence on both Ag/Pd/Glass and Pd/Ag/Glass samples can be found in Fig. S2.†
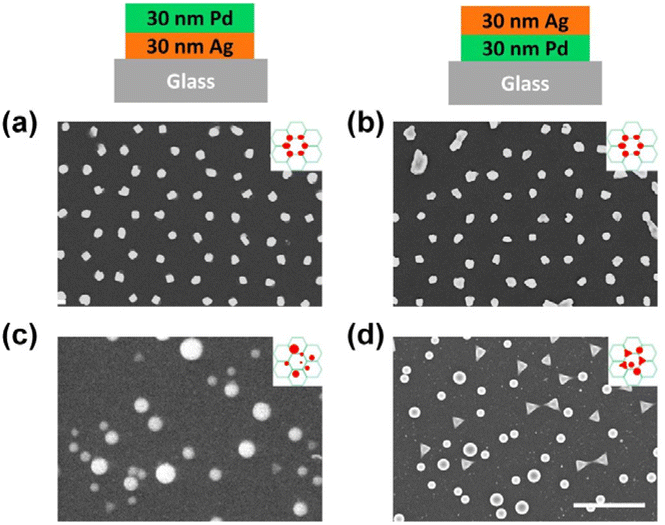 | ||
| Fig. 6 SEM images of Pd/Ag/Glass honeycomb array after (a) thermal annealing and (c) applying five 100 mJ cm−2 pulses. Ag/Pd/Glass honeycomb array after (b) thermal annealing and (d) applying five 100 mJ cm−2 pulses. The scale bar is 1 μm and applies to all images. | ||
Finally, we examined the optical response of the pristine sample and the thermally and laser-treated samples. In particular, we show that the coupling between the LSPR of individual particles through the lattice, i.e., the SLR, determines the optical response of the sample. The spatial arrangement of nanoparticles in an array is a crucial factor for its optical property. When the period of an array matches the SLR coupling condition, the individual LSPR mode hybridizes with the Rayleigh anomaly (RA) associating with light diffracted parallel to the grating surface, resulting in a strong SLR. The diffraction property of RA is governed by61
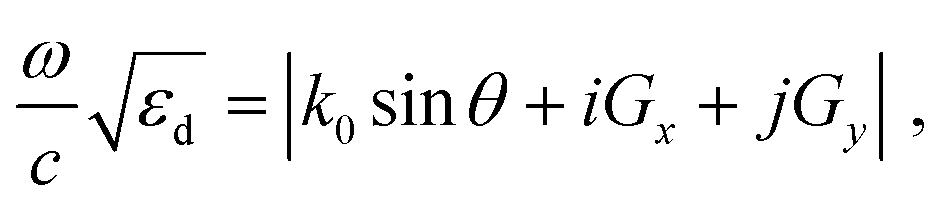 | (2) |
![[thin space (1/6-em)]](https://www.rsc.org/images/entities/char_2009.gif) sinθ are the angular frequency, speed of light, and in-plane momentum of the light propagating in free space, respectively.25,61 The closer the LSPR of individual nanoparticles is to the RA in the spectrum, the stronger the coupling is, resulting in a sharper SLR peak.
sinθ are the angular frequency, speed of light, and in-plane momentum of the light propagating in free space, respectively.25,61 The closer the LSPR of individual nanoparticles is to the RA in the spectrum, the stronger the coupling is, resulting in a sharper SLR peak.
To investigate the optical properties of the nanoparticle array produced by different methods, we measured the transmission spectrum of the pristine, annealed, and laser-treated Ag samples. The nanoparticles in the above-mentioned samples were all in a honeycomb lattice arrangement but with different particle shapes. The corresponding SEM images are shown in Fig. 2a, c, and e. For the pristine sample with triangular islands from the NSL, a clear dip due to the SLR exhibited at around 800 nm (Fig. 7a, black spectrum). After thermal annealing (Fig. 7a, red spectrum) and laser treatment (Fig. 7a, blue spectrum), the SLR at 800 nm vanished in the transmittance spectrum. This change in the spectra was well reproduced in numerical simulations based on the finite-difference time-domain (FDTD) method. The simulated transmission spectra of the same honeycomb arrays with different individual particle morphologies are shown in Fig. 7b. All the particle sizes were obtained from the corresponding SEM images. The vanishing of the SLR dip at around 800 nm was due to the change in the morphology of individual particles after thermal and laser treatment. As the morphology of the particles became more and more spherical, the LSPR of a single particle blue-shifted from 850 nm for the triangles in the pristine to 620 nm for the laser-treated particles (Fig. 7c). Therefore, as the particle morphology became more spherical, the coupling strength between the LSPR and the RA of the honeycomb lattice calculated from eqn (2) to be around 791 nm (green dashed line in Fig. 7c) decreased. As a result, the dip due to SLR vanished in the thermal and laser-treated particles. Similarly, the same coupling features were also observed in Pd systems (Fig. S3, ESI†). The simulations fairly well reproduced the experimental results, and the trend of the spectral change in the normalized spectra is in good agreement. The discrepancy between the simulation and experimental results may arise from imperfections on the sample surface due to defects during NSL template preparation, which has led to the inhomogeneous lattice arrangement. The simulated results offer a tentative and qualitative explanation for the change in the optical response of the sample due to the change in the particle morphology and lattice arrangement.
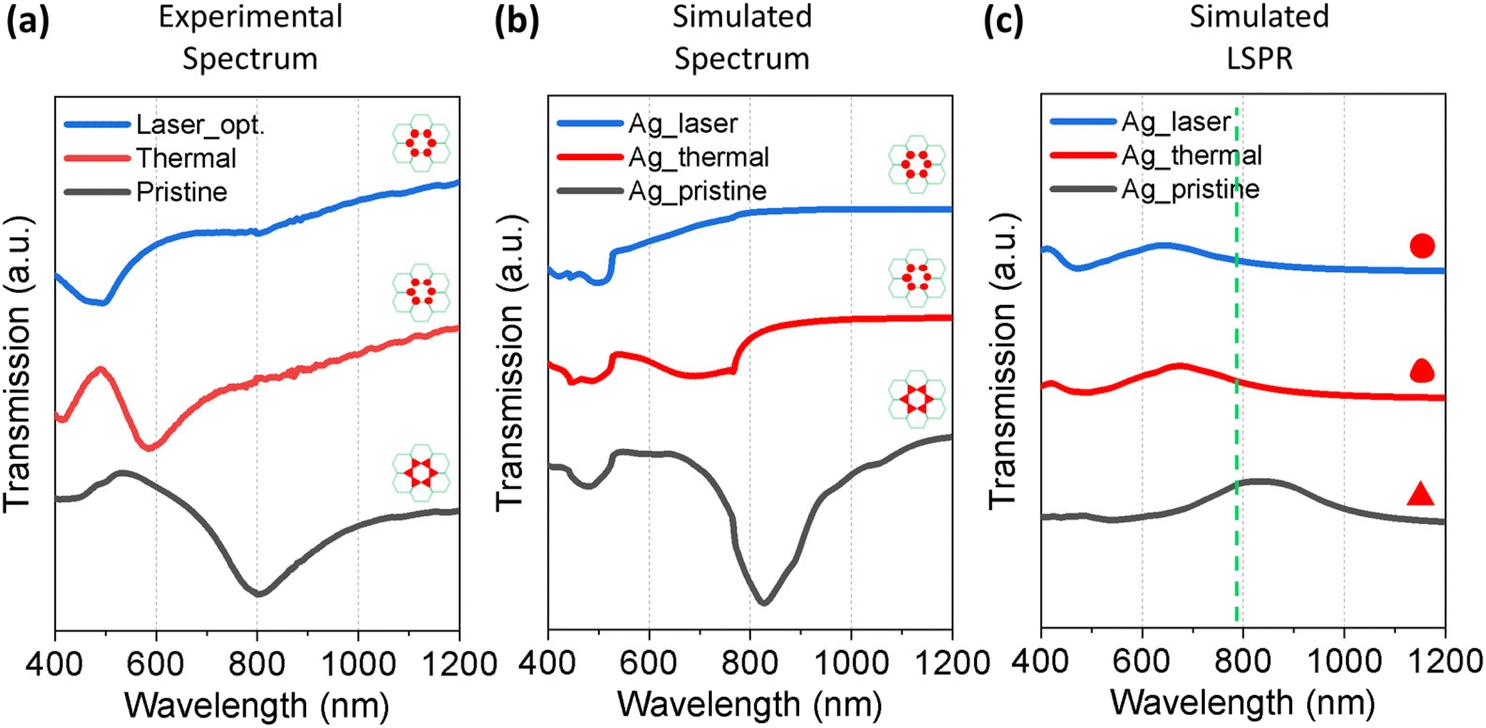 | ||
| Fig. 7 (a) Experimental and (b) simulated transmittance spectrum of the pristine (black), thermal-annealed (red), and laser-treated (blue) honeycomb-packed Ag array. The schematics on the right side of each spectrum indicate the morphology and spatial arrangement of the corresponding sample. (c) Simulated scattering spectrum of an individual Ag particle from the same samples using a triangular, a triangular with rounded corners, and a spherical form, respectively. The green dashed line indicates the theoretical RA resonance. All spectra are normalized to [0,1]. | ||
Conclusions
In this study, we found that thermal annealing induces changes in particle morphology while maintaining the spatial arrangement from the NSL pattern. However, the metal in contact with the substrate plays a crucial role due to the varying wettability of different metals on the substrate. As for laser treatment, it offers faster processing and yields nearly perfect spherical particles. Specifically, applying laser energy within an optimum window enables the generation of spheres in a honeycomb lattice. Exceeding this energy range disrupts the spatial arrangement and leads to a broader particle size distribution. In addition, we observed that the pristine sample exhibits a distinct resonance compared to the annealed and laser-treated samples. Through simulations and theoretical calculations, we attribute this distinct resonance to the collective interaction of localized surface plasmons and the Rayleigh anomaly, known as the surface lattice resonance. Our findings provide valuable insights for generating mono- and bi-metallic plasmonic nanoparticles with well-defined spatial arrangements using thermal annealing and pulsed-laser treatment.Methods
Nanosphere lithography
NSL was used to produce a large-area pristine metallic nanoparticle array.62 Polystyrene nanospheres (PS-NSs) (Microparticles GmbH, Berlin) with nominal diameters of 608 nm were used for all the structures. Borofloat glass (thermal conductivity: 1.2 W m−1 K−1, coefficient of thermal expansion: 3.25 × 10⁻⁶ K−1) was the substrate material.A suspension of PS-NSs was first prepared by mixing 100 μl water dispersion of PS-NSs (weight ratio 10%), 100 μl ethanol, and 5 ml hexylamine with 30 minutes of sonication. After placing a glass substrate on the bottom of a specially designed dish filled with deionized water, drops of the PS-NSs suspension were carefully added to the water surface using a syringe. To obtain a closely packed monolayer of PS-NSs on the water surface, several drops of anionic surfactant (sodium dodecyl sulfate, 10 wt% in water) were added to the outer area of the PS-NS layer. As a result, the PS-NSs were pushed together such that a densely packed hexagonal lattice was formed. To settle the PS-NS monolayer on the substrate, the water in the dish was drained by opening the valve on the dish.
With the monolayer PS-NS mask, 60 nm Ag and 60 nm Pd, as well as 60 nm Ag/Pd (1:1) or 60 nm Pd/Ag (1:1) were deposited by electron beam evaporation without substrate heating, and the chamber was evacuated to less than 6 × 10⁻⁶ mbar. The deposition rate was close to 1.5 nm s−1 for Ag and 0.5 nm s−1 for Pd. As the last step, the PS-NSs were removed using Scotch tape, such that the honeycomb-packed triangular metal islands were left behind on the substrate.
Post-processing of the pre-patterned nanoparticles
The annealing process was performed in a high-temperature oven (LM312, Linn High Therm GmbH) at 500 °C for 1 hour (the ramp rate is 600 °C hour−1).42 The laser setup consists of a 248 nm KrF excimer laser (LPX305, Lambda Physik) with a pulse duration of 25 ns and using a repetition rate of 1 Hz, focusing optics, an intensity attenuator, and a beam profile homogenizer. The fluences, which were set to be 70 mJ cm−2, 100 mJ cm−2, and 200 mJ cm−2, were controlled by the intensity attenuator. The laser spot size on the samples was about 4 × 4 mm2.Morphology characterization
A field-emission scanning electron microscope (FEI Helios NanoLab) with a through-the-lens detector (TLD) and a concentric back-scattered detector (CBS) was used to take images for characterizing the morphology of the resulting metal nanoparticles. All the samples were covered by a 5 nm carbon layer to avoid charging effects during electron irradiation.Spectral measurement and simulation
Transmittance spectra were measured at normal incidence using a spectrometer (PerkinElmer Lambda 950 UV-Vis) with deuterium and tungsten halogen sources operating in 400–1200 nm wavelength with a resolution of 1 nm.Finite-difference-time domain method (Ansys Lumerical FDTD) was used to simulate the transmittance spectra of the Ag arrays and the single particle scattering spectra of Ag particles with different morphologies. The structure dimensions in the simulations were extracted from the SEM images. To simulate the far-field transmission spectrum of the Ag lattice, we conducted three-dimensional simulations of the array on a glass substrate. The dielectric functions for the Ag models were fitted to the optical data collected by Palik,63 and the refractive index of glass used was 1.46. We configured the simulation parameters as follows: the xy plane of the simulation volume contains one unit cell of the honeycomb lattice. 5 nm mesh size was used in all directions. Periodic boundary conditions were applied to the x and y directions and perfectly matched layers (PMLs) were used in the z direction. The excitation source is a broadband p-polarized plane wave source (wavelength range: 400–1200 nm) injected from the vacuum side of the array with a surface normal incidence along the z-direction. The transmission spectrum was derived by integrating the Poynting vector over a two-dimensional monitor placed in the glass, situated 900 nm below the bottom of the metallic array.
To obtain the single-particle scattering spectra, we simulated a silver equilateral triangle (220 nm on each side and 60 nm in height), as measured in the SEM images. A series of triangles with varying edge curvatures to mimic particle morphology transformations was simulated. These structures were situated on a glass substrate. The refractive indices for Ag and Pd were determined by fitting the optical data provided by Palik,63 and the refractive index of the glass we used was 1.46. A total-field-scattered-field source was directed towards them from the air side, with an incidence distance of 255 nm. The scattering spectra were computed by placing the respective monitors within the simulation regions. PML boundaries enclosed the simulation area. We utilized a simulation mesh with a size of 1.5 nm, covering the nanoparticles and their immediate surroundings.
Image analysis and quantification
The statistical analysis of the circularity and size was performed using the “Analyzed Particles” plugin in ImageJ. First, we segmented the secondary electron images with sharp particle edges into objects of interest and the background via the “Image/Adjust/Threshold” command, then we counted the size and circularity of the particles by the “Analyze/Analyzed Particles” command, for which the incomplete particles on the boundary and the connected particles in each image were omitted. The particle area was calculated by determining the number of pixels that formed the 8 adjacent connected particles. The perimeter of the particles was calculated using an algorithm that assigned a value of 1 to the edge pixels and a square root of 2 to the corner pixels. The perimeter of the region of interest (ROI) is calculated by subtracting 2 − √2 for each non-adjacent corner from the total length of its boundary.The contours of the analyzed particles are shown in Fig. S4 (ESI†).
Author contributions
Y.-J. C. and J.-S. H. conceived and planned the study. G. S., A. G., and G. J. fabricated the samples. G. S. performed the laser treatment. Y.-J. C. performed thermal annealing, optical characterization, and numerical simulations. A. D. and X. W. completed the SEM imaging. Y.-J. C. and T. B. analyzed the particle morphology. J. P. and J.-S. H. supervised the research. Y.-J. C., X. W., and J.-S. H. prepared the manuscript. All authors contributed to the discussion and revision of the manuscript.Conflicts of interest
There are no conflicts to declare.Acknowledgements
The authors thank Dr Ankit Kumar Singh for engaging in fruitful discussions on SLR theory and simulations. We sincerely acknowledge the financial support received from DFG (CRC 1375 NOA-C1, HU 2626/3-1, and HU 2626/7-1). Furthermore, we are grateful for the support provided by the BMBF through the funding program Photonics Research Germany (FKZ: 13N15710), as well as its integration into the Leibniz Center for Photonics in Infection Research (LPI). The LPI, initiated by Leibniz-IPHT, Leibniz-HKI, UKJ, and FSU Jena, is an integral part of the BMBF national roadmap for research infrastructures.References
- A. G. Brolo, Nat. Photonics, 2012, 6, 709–713 CrossRef CAS.
- L. Dykman and N. Khlebtsov, Chem. Soc. Rev., 2012, 41, 2256–2282 RSC.
- V. Russo, N. Michieli, T. Cesca, C. Scian, D. Silvestri, M. Morpurgo and G. Mattei, Nanoscale, 2017, 9, 10117–10125 RSC.
- M. Kang, M.-S. Ahn, Y. Lee and K.-H. Jeong, ACS Appl. Mater. Interfaces, 2017, 9, 37154–37159 CrossRef CAS PubMed.
- A. Loiseau, V. Asila, G. Boitel-Aullen, M. Lam, M. Salmain and S. Boujday, Biosensors, 2019, 9, 78 CrossRef CAS PubMed.
- F. Narita, Z. Wang, H. Kurita, Z. Li, Y. Shi, Y. Jia and C. Soutis, Adv. Mater., 2021, 33, 2005448 CrossRef CAS PubMed.
- K. Awazu, M. Fujimaki, C. Rockstuhl, J. Tominaga, H. Murakami, Y. Ohki, N. Yoshida and T. Watanabe, J. Am. Chem. Soc., 2008, 130, 1676–1680 CrossRef CAS PubMed.
- S. Linic, P. Christopher and D. B. Ingram, Nat. Mater., 2011, 10, 911–921 CrossRef CAS PubMed.
- P. Christopher, H. Xin, A. Marimuthu and S. Linic, Nat. Mater., 2012, 11, 1044–1050 CrossRef CAS PubMed.
- X. Zhang, Y. L. Chen, R.-S. Liu and D. P. Tsai, Rep. Prog. Phys., 2013, 76, 046401 CrossRef PubMed.
- Y. Yao, Z. Huang, P. Xie, S. D. Lacey, R. J. Jacob, H. Xie, F. Chen, A. Nie, T. Pu, M. Rehwoldt, D. Yu, M. R. Zachariah, C. Wang, R. Shahbazian-Yassar, J. Li and L. Hu, Science, 2018, 359, 1489–1494 CrossRef CAS PubMed.
- S. Reichenberger, G. Marzun, M. Muhler and S. Barcikowski, ChemCatChem, 2019, 11, 4489–4518 CrossRef CAS.
- N. Liu, M. Hentschel, T. Weiss, A. P. Alivisatos and H. Giessen, Science, 2011, 332, 1407–1410 CrossRef CAS PubMed.
- K. Saha, S. S. Agasti, C. Kim, X. Li and V. M. Rotello, Chem. Rev., 2012, 112, 2739–2779 CrossRef CAS PubMed.
- S. Rej, C.-F. Hsia, T.-Y. Chen, F.-C. Lin, J.-S. Huang and M. H. Huang, Angew. Chem., Int. Ed., 2016, 55, 7222–7226 CrossRef CAS PubMed.
- K. C. Ng, F.-C. Lin, P.-W. Yang, Y.-C. Chuang, C.-K. Chang, A.-H. Yeh, C.-S. Kuo, C.-R. Kao, C.-C. Liu, U. S. Jeng, J.-S. Huang and C.-H. Kuo, Chem. Mater., 2018, 30, 204–213 CrossRef CAS.
- V. Amendola, S. Scaramuzza, L. Litti, M. Meneghetti, G. Zuccolotto, A. Rosato, E. Nicolato, P. Marzola, G. Fracasso, C. Anselmi, M. Pinto and M. Colombatti, Small, 2014, 10, 2476–2486 CrossRef CAS PubMed.
- J. Reguera, D. Jiménez de Aberasturi, M. Henriksen-Lacey, J. Langer, A. Espinosa, B. Szczupak, C. Wilhelm and L. M. Liz-Marzán, Nanoscale, 2017, 9, 9467–9480 RSC.
- N. Ohannesian, I. Misbah, S. H. Lin and W.-C. Shih, Nat. Commun., 2020, 11, 5805 CrossRef CAS PubMed.
- C. de la Encarnación, E. Lenzi, M. Henriksen-Lacey, B. Molina, K. Jenkinson, A. Herrero, L. Colás, P. Ramos-Cabrer, J. Toro-Mendoza, I. Orue, J. Langer, S. Bals, D. Jimenez de Aberasturi and L. M. Liz-Marzán, J. Phys. Chem. C, 2022, 126, 19519–19531 CrossRef.
- B. Mehdaoui, J. Carrey, M. Stadler, A. Cornejo, C. Nayral, F. Delpech, B. Chaudret and M. Respaud, Appl. Phys. Lett., 2012, 100, 052403 CrossRef.
- T. Fuchigami, R. Kawamura, Y. Kitamoto, M. Nakagawa and Y. Namiki, Biomaterials, 2012, 33, 1682–1687 CrossRef CAS PubMed.
- J. Stergar, G. Ferk, I. Ban, M. Drofenik, A. Hamler, M. Jagodič and D. Makovec, J. Alloys Compd., 2013, 576, 220–226 CrossRef CAS.
- P. Amrollahi, A. Ataie, A. Nozari, E. Seyedjafari and A. Shafiee, J. Mater. Eng. Perform., 2015, 24, 1220–1225 CrossRef CAS.
- R. Guo, T. K. Hakala and P. Törmä, Phys. Rev. B, 2017, 95, 155423 CrossRef.
- R. Guo, M. Nečada, T. K. Hakala, A. I. Väkeväinen and P. Törmä, Phys. Rev. Lett., 2019, 122, 013901 CrossRef CAS PubMed.
- C. Cherqui, M. R. Bourgeois, D. Wang and G. C. Schatz, Acc. Chem. Res., 2019, 52, 2548–2558 CrossRef CAS PubMed.
- D. Wang, M. R. Bourgeois, J. Guan, A. K. Fumani, G. C. Schatz and T. W. Odom, ACS Photonics, 2020, 7, 630–636 CrossRef CAS.
- S. Deng, R. Li, J.-E. Park, J. Guan, P. Choo, J. Hu, P. J. M. Smeets and T. W. Odom, Proc. Natl. Acad. Sci. U. S. A., 2020, 117, 23380–23384 CrossRef CAS PubMed.
- S. R. K. Rodriguez, S. Murai, M. A. Verschuuren and J. G. Rivas, Phys. Rev. Lett., 2012, 109, 166803 CrossRef CAS PubMed.
- G. Lozano, G. Grzela, M. A. Verschuuren, M. Ramezani and J. G. Rivas, Nanoscale, 2014, 6, 9223–9229 RSC.
- M. Ramezani, G. Lozano, M. A. Verschuuren and J. Gómez-Rivas, Phys. Rev. B, 2016, 94, 125406 CrossRef.
- W. Zhou, M. Dridi, J. Y. Suh, C. H. Kim, D. T. Co, M. R. Wasielewski, G. C. Schatz and T. W. Odom, Nat. Nanotechnol., 2013, 8, 506–511 CrossRef CAS PubMed.
- P. M. Oppeneer and V. Kapaklis, Nat. Photonics, 2022, 16, 11–13 CrossRef CAS.
- V. G. Kravets, F. Schedin, A. V. Kabashin and A. N. Grigorenko, Opt. Lett., 2010, 35, 956–958 CrossRef CAS PubMed.
- P. Offermans, M. C. Schaafsma, S. R. K. Rodriguez, Y. Zhang, M. Crego-Calama, S. H. Brongersma and J. G. Rivas, ACS Nano, 2011, 5, 5151–5157 CrossRef CAS PubMed.
- A. I. Kuznetsov, A. B. Evlyukhin, M. R. Gonçalves, C. Reinhardt, A. Koroleva, M. L. Arnedillo, R. Kiyan, O. Marti and B. N. Chichkov, ACS Nano, 2011, 5, 4843–4849 CrossRef CAS PubMed.
- R. Adato, A. A. Yanik, J. J. Amsden, D. L. Kaplan, F. G. Omenetto, M. K. Hong, S. Erramilli and H. Altug, Proc. Natl. Acad. Sci. U. S. A., 2009, 106, 19227–19232 CrossRef CAS PubMed.
- S. Link and M. A. El-Sayed, J. Phys. Chem. B, 1999, 103, 4212–4217 CrossRef CAS.
- N. Pazos-Perez, F. J. Garcia de Abajo, A. Fery and R. A. Alvarez-Puebla, Langmuir, 2012, 28, 8909–8914 CrossRef CAS PubMed.
- T. R. Jensen, M. D. Malinsky, C. L. Haynes and R. P. Van Duyne, J. Phys. Chem. B, 2000, 104, 10549–10556 CrossRef CAS.
- F. A. A. Nugroho, B. Iandolo, J. B. Wagner and C. Langhammer, ACS Nano, 2016, 10, 2871–2879 CrossRef CAS PubMed.
- X. Li, T. Zhang, Z. Chen, J. Yu, A. Cao, D. Liu, W. Cai and Y. Li, Small, 2022, 18, 2105045 CrossRef CAS PubMed.
- A. Yang, T. B. Hoang, M. Dridi, C. Deeb, M. H. Mikkelsen, G. C. Schatz and T. W. Odom, Nat. Commun., 2015, 6, 6939 CrossRef CAS PubMed.
- F. Zhang, J. Proust, D. Gérard, J. Plain and J. Martin, J. Phys. Chem. C, 2017, 121, 7429–7434 CrossRef CAS.
- M. Chi, C. Wang, Y. Lei, G. Wang, D. Li, K. L. More, A. Lupini, L. F. Allard, N. M. Markovic and V. R. Stamenkovic, Nat. Commun., 2015, 6, 8925 CrossRef CAS PubMed.
- D. Ray, H.-C. Wang, J. Kim, C. Santschi and O. J. F. Martin, Adv. Mater., 2022, 34, 2108225 CrossRef CAS PubMed.
- A. Habenicht, M. Olapinski, F. Burmeister, P. Leiderer and J. Boneberg, Science, 2005, 309, 2043–2045 CrossRef CAS PubMed.
- G. Schmidl, G. Jia, A. Gawlik, J. Kreusch, F. Schmidl, J. Dellith, A. Dathe, Z. H. Lin, J. S. Huang and J. Plentz, Sci. Rep., 2018, 8, 11283 CrossRef CAS PubMed.
- G. Schmidl, M. Raugust, J. Dellith, A. Dellith, F. Schmidl, A. Bochmann and J. Plentz, Mater. Today Commun., 2020, 25, 101141 CrossRef CAS.
- G. Schmidl, M. Raugust, J. Dellith, A. Bochmann, F. Schmidl and J. Plentz, Opt. Mater., 2020, 99, 109592 CrossRef CAS.
- G. Schmidl, M. Raugust, G. Jia, A. Dellith, J. Dellith, F. Schmidl and J. Plentz, Nanoscale Adv., 2022, 4, 4122–4130 RSC.
- J. Lv, Appl. Surf. Sci., 2013, 273, 215–219 CrossRef CAS.
- R. K. Kramer, J. W. Boley, H. A. Stone, J. C. Weaver and R. J. Wood, Langmuir, 2014, 30, 533–539 CrossRef CAS PubMed.
- D. Tian, Y. Song and L. Jiang, Chem. Soc. Rev., 2013, 42, 5184–5209 RSC.
- Z. Song, W. Luo, X. Fan and Y. Zhu, Appl. Surf. Sci., 2022, 606, 154901 CrossRef CAS.
- T. Karabacak, J. S. DeLuca, P.-I. Wang, G. A. Ten Eyck, D. Ye, G.-C. Wang and T.-M. Lu, J. Appl. Phys., 2006, 99, 064304 CrossRef.
- V. F. Zackay, D. W. Mitchell, S. P. Mitoff and J. A. Pask, J. Am. Ceram. Soc., 1953, 36, 84–89 CrossRef CAS.
- E. P. Cox, J. Paleontol., 1927, 1, 179–183 Search PubMed.
- A. Al Rsheed, S. Aldawood and O. M. Aldossary, Nanomaterials, 2021, 11, 2916 CrossRef CAS PubMed.
- H. Gao, J. M. McMahon, M. H. Lee, J. Henzie, S. K. Gray, G. C. Schatz and T. W. Odom, Opt. Express, 2009, 17, 2334–2340 CrossRef CAS PubMed.
- G. Jia, J. Westphalen, J. Drexler, J. Plentz, J. Dellith, A. Dellith, G. Andrä and F. Falk, Photonics Nanostruct., 2016, 19, 64–70 CrossRef.
- E. D. Palik, Handbook of optical constants of solids, Academic press, 1998 Search PubMed.
Footnote |
| † Electronic supplementary information (ESI) available: Zoom-in images of Ag and Pd samples prepared by thermal annealing and laser treatment. Investigating the effect of the pulse number and laser fluence on Ag–Pd. The coupling feature of SLR in Pd system. Particle analysis. See DOI: https://doi.org/10.1039/d3nr03522k |
| This journal is © The Royal Society of Chemistry 2023 |