
 Open Access Article
 This Open Access Article is licensed under a Creative Commons Attribution-Non Commercial 3.0 Unported Licence
Effects of graphene oxide and reduced graphene oxide nanomaterials on porcine endothelial progenitor cells†
Alberto
Polo-Montalvo
a,
Mónica
Cicuéndez
a,
Laura
Casarrubios
b,
Nathalie
Barroca
cd,
Daniela
da Silva
cd,
María José
Feito
b,
Rosalía
Diez-Orejas
e,
María Concepción
Serrano
 f,
Paula A. A. P.
Marques
*cd and
María Teresa
Portolés
*bg
f,
Paula A. A. P.
Marques
*cd and
María Teresa
Portolés
*bg
aDepartamento de Química en Ciencias Farmacéuticas, Facultad de Farmacia, Universidad Complutense de Madrid, Instituto de Investigación Sanitaria del Hospital Clínico San Carlos (IdISSC), 28040-Madrid, Spain
bDepartamento de Bioquímica y Biología Molecular, Facultad de Ciencias Químicas, Universidad Complutense de Madrid, Instituto de Investigación Sanitaria del Hospital Clínico San Carlos (IdISSC), 28040-Madrid, Spain. E-mail: portoles@quim.ucm.es
cCentre for Mechanical Technology & Automation (TEMA), Department of Mechanical Engineering, University of Aveiro, 3810-193 Aveiro, Portugal. E-mail: paulam@ua.pt
dLASI—Intelligent Systems Associate Laboratory, 4804-533 Guimaräes, Portugal
eDepartamento de Microbiología y Parasitología, Facultad de Farmacia, Universidad Complutense de Madrid, Instituto de Investigación Sanitaria del Hospital Clínico San Carlos (IdISSC), 28040-Madrid, Spain
fInstituto de Ciencia de Materiales de Madrid, Consejo Superior de Investigaciones Científicas, Madrid 28049, Spain
gCIBER de Bioingeniería, Biomateriales y Nanomedicina, CIBER-BBN, ISCIII, 28040-Madrid, Spain
First published on 19th October 2023
Abstract
Graphene oxide (GO) and reduced graphene oxide (rGO) have been widely used in the field of tissue regeneration and various biomedical applications. In order to use these nanomaterials in organisms, it is imperative to possess an understanding of their impact on different cell types. Due to the potential of these nanomaterials to enter the bloodstream, interact with the endothelium and accumulate within diverse tissues, it is highly relevant to probe them when in contact with the cellular components of the vascular system. Endothelial progenitor cells (EPCs), involved in blood vessel formation, have great potential for tissue engineering and offer great advantages to study the possible angiogenic effects of biomaterials. Vascular endothelial growth factor (VEGF) induces angiogenesis and regulates vascular permeability, mainly activating VEGFR2 on endothelial cells. The effects of GO and two types of reduced GO, obtained after vacuum-assisted thermal treatment for 15 min (rGO15) and 30 min (rGO30), on porcine endothelial progenitor cells (EPCs) functionality were assessed by analyzing the nanomaterial intracellular uptake, reactive oxygen species (ROS) production and VEGFR2 expression by EPCs. The results evidence that short annealing (15 and 30 minutes) at 200 °C of GO resulted in the mitigation of both the increased ROS production and decline in VEGFR2 expression of EPCs upon GO exposure. Interestingly, after 72 hours of exposure to rGO30, VEGFR2 was higher than in the control culture, suggesting an early angiogenic potential of rGO30. The present work reveals that discrete variations in the reduction of GO may significantly affect the response of porcine endothelial progenitor cells.
Introduction
Graphene and its derivatives, which are classified as graphene-based materials (GBM),1 have been extensively used to add functional properties to 3D scaffolds for regeneration of diverse tissues.2–4 Among the GBM, graphene oxide (GO), due to its unique physical, chemical, and mechanical properties, has been widely explored to prepare composites, in the form of powders, coatings and scaffolds, capable of stimulating bone repair by inducing the differentiation of bone marrow stem cells (BMSCs).5,6 Some studies indicated that GO promotes angiogenic differentiation, an essential process for tissue regeneration.1,7 However, the employment of GO and its derivatives in the preparation of scaffolds requires considering the possible release of these nanomaterials when the constructs are degraded after implantation in vivo. These degradation products could be transported by the bloodstream, interact with the vascular endothelium, and reach different tissues.8 The possible local accumulation of GO in vivo has limited the application of this nanomaterial, and a thorough understanding of all its effects on the different cell types of organisms is needed.9It is important to highlight that several proposed biomedical applications of GBM require intravenous administration,10 resulting in direct exposure to vascular endothelial cells whose disruption could alter the integrity of blood vessels and essential homeostatic functions in the human body.11,12 In this context, some studies have focused on the effects of GBM on vascular endothelial cells by analysing different key aspects of their function.13–15
Endothelial progenitor cells (EPCs) are directly involved in the formation of blood vessels,16,17 have great potential for tissue engineering (TE),18–20 and offer great advantages as an experimental model to study the possible angiogenic effects of biomaterials.21–24 EPCs are primitive bone marrow cells with properties similar to those of embryonal angioblasts25 and were identified by Isner and Asahara in 1997.26
Vascular endothelial growth factor (VEGF) is essential for endothelial cell functions, inducing angiogenesis26 and regulating vascular permeability27 by activating the VEGFR1 and VEGFR2 receptors, VEGFR2 being the main signal transducer for angiogenesis.28,29
An essential issue in the studies of cellular responses to GO is to analyse the effect of slight modifications of the nanomaterial to allow it to interact with cells in an appropriate manner without triggering cytotoxic events. The synthesis methodology plays a crucial role in influencing the extent of oxidation, resulting in a variety of surface chemistry changes in GO. The presence of oxygen functionalities holds significance, not only in the fabrication of biomaterials, but also as a crucial factor in the interaction with the biological milieu and, notably, with cellular entities. Therefore, a slight reduction was targeted here to maintain rGO amenable for interacting with other materials in regenerative strategies. We have previously demonstrated that the moderate reduction imparted by short annealing at low temperature (200 °C) allows extensive integration of this GO-based nanomaterial (up to 50 wt%) in protein-based scaffolds for the repair of the central nervous system.30 Also, while GO nanomaterials can result in detrimental cellular uptake, extensive reduction induces their agglomeration that drastically increases the ratio of surface area to volume, thereby diminishing the extracellular matrix (ECM)–cell interaction. Thus, our focus lies in slight reduction degrees so that ECM–cell interactions are still favoured. In this context, we previously evaluated the benefits of these GO reduction levels to mitigate its possible adverse effects on various cell types, including macrophages, liver cells and lymphocytes. Our observations indicate that the reduction of GO effectively decreases the oxidative stress induced by this nanomaterial in these specific cell types.31–33 Following the mentioned studies, this work examines the impacts of GO and two types of reduced GO (rGO15 and rGO30) which were obtained through vacuum-assisted thermal treatment for 15 and 30 minutes, respectively, on EPCs derived from porcine blood. After EPC isolation and characterization by specific methods, different cell parameters were examined to evaluate the nanomaterial intracellular uptake, the possible induction of oxidative stress and the expression of VEGFR2 by EPCs as a measure of their functionality.
Results and discussion
Analysis of GO, rGO15, and rGO30 nanomaterials
While full deoxygenation of GO solely by heating is difficult even at temperatures as high as 1200 °C, experimental work has demonstrated that a fair number of oxygen functionalities are eliminated by thermally annealing at around 200 °C and above with enough time.34 In the present work, a tenuous reduction was intended to evaluate how discrete variations in reduction may significantly affect the response of porcine endothelial progenitor cells. Table 1 compiles a comprehensive structural characterization of the GO nanomaterial and their reduced forms for 15 and 30 minutes at 200 °C. As per the XPS analysis (Table 1 and Fig. S1 in the ESI†), 30 minutes of thermal reduction at 200 °C leads to a modest elimination of oxygen, translated by a C/O ratio increase from 1.75 to 2.85. The contribution of oxygen functionalities decreased from 57.3 to 35.1% while generating new C–H and C![[double bond, length as m-dash]](https://www.rsc.org/images/entities/char_e001.gif) C bonds (from 41.3 to 62.5%) and increasing the contribution of the π–π* transitions (1.4 to 2.4%). Specifically, some carboxyl groups are gently reduced at 100–150 °C,34 followed by the elimination of unstable in-plane hydroxyl groups.34,35 This partial reduction was purposely performed in this study so that an appreciable number of oxygen moieties is still available making rGO15 and rGO30 susceptible to coupling with biomaterials towards regenerative approaches. For instance, rGO30 was previously interfaced with a decellularized extracellular matrix with promising results for neural TE.30
C bonds (from 41.3 to 62.5%) and increasing the contribution of the π–π* transitions (1.4 to 2.4%). Specifically, some carboxyl groups are gently reduced at 100–150 °C,34 followed by the elimination of unstable in-plane hydroxyl groups.34,35 This partial reduction was purposely performed in this study so that an appreciable number of oxygen moieties is still available making rGO15 and rGO30 susceptible to coupling with biomaterials towards regenerative approaches. For instance, rGO30 was previously interfaced with a decellularized extracellular matrix with promising results for neural TE.30
| GO | rGO15 | rGO30 | ||
|---|---|---|---|---|
| XPS | C–C/CC |
41.3% | 52.7% | 62.5% |
| C–O | 46% | 38.1% | 29.4% | |
| O–CO |
11.3% | 7.6% | 5.7% | |
| π–π* | 1.4% | 1.6% | 2.4% | |
| C/O ratio | 1.75 | 2.18 | 2.85 | |
| XRD interlayer spacing (nm) | (001) peak | 2Θ = 11.08°, d = 0.11 | 2Θ = 12.98°, d = 0.37 | 2Θ = 14.3°, d = 0.10 |
| (002) peak | 2Θ = 22.18°, d = 0.08 | 2Θ = 21.42°, d = 0.08 | 2Θ = 22.26°, d = 0.08 | |
| RAMAN | (ID/IG) | 1.6 | 1.79 | 1.72 |
Slight removal of oxygen moieties was confirmed by the lower zeta potential measured for the reduced GO nanomaterials indicating a decrease in surface charge density that becomes significant at 30 minutes of thermal annealing (Table 2). XRD also corroborates the slight reduction by the gradual shifting of the (001) diffraction peak towards higher 2Θ (from 11.08° to 12.98° and further to 14.3°) along the maintenance of the second peak characteristic of the (002) plane (Table 1). As illustrated in a previous report,31 partial breakdown of the long-range order of GO was also shown by a broadening of the (001) peak.36,37 Furthermore, the variation in the interlayer spacing was measured. Although reduction inherently results in smaller interlayer spacing due to the elimination of the oxygen functional groups, here an increased spacing was observed for rGO annealed for 15 minutes while an expectedly discrete decrease was quantified for 30 minutes. Thermal annealing-induced reduction involves the expansion of CO and CO2 gases into the spaces between GO sheets due to the oxygen-containing functional groups attached to the carbon plane decomposing into these gases and creating pressure between the GO stacked layers.34,38 Therefore, as 15 minutes of thermal annealing is very short, reduction is stopped at an incipient stage leading to the observed effect in the interlayer spacing increase. This is further confirmed in the Raman and AFM analyses. In Raman spectroscopy, the dominant vibrational modes identified in graphitic structures are the D band, linked with the order/disorder of the system and the G Band, indicative of the stacking structure (Fig. S2 in the ESI†). The ratio of the intensities of the two bands (ID/IG ratio) is commonly used to determine the number of layers in a graphene sample and its overall stacking behaviour with high D/G ratios indicating a high degree of disorder.39,40 In relation to GO (ID/IG ratio of 1.6), both reduced forms after 15 and 30 minutes of thermal reduction present higher ID/IG ratios, 1.79 and 1.72, respectively (Table 1). Although the opposite is commonly observed and the formation of sp2 domains accounted for, an increase has also been reported and attributed to the small spatial dimensions of the new sp2 regions along the higher number of structural defects that arise within the carbon lattice.37 The measured higher disorder in the lattice structure after 15 minutes is evocative of the re-arrangement of carbon atoms to release the stress caused by new defects during the initial stage of thermal annealing.34 Compared to rGO15, the less pronounced increase in rGO30 samples suggests that after 30 minutes, the stacking structure is evolving towards a more ordered one. Along with the increase in interlayer spacing for rGO15, another evidence of the significant structural stress and expansion caused by the CO and CO2 gases is the measured sheet thickness via AFM (Table 2). The reduced forms of GO present a larger sheet thickness (1.02 and 0.87 nm for rGO15 and rGO30, respectively) than the pristine GO sheets (0.82 nm), which in turn influences the roughness of the agglomerated reduced sheets, specifically significant for rGO15. The larger sheet thickness in the rGO15 nanomaterial is attributed to the higher disorder in the carbon lattice due to the potential presence of CO and CO2 adsorbed on the sheets after annealing.41 Surface topography was analysed by AFM in areas around 4 μm2 and the following parameters were evaluated: RMS roughness, maximum value, roughness average as well as the statistical parameters such as surface skewness (SSk) and kurtosis (SKu). Roughness evaluation by AFM is based on the elimination of oxygen moieties in the presence of structural defects leading to a higher roughness for GO sheets that underwent thermal annealing, solely significant for 15 minutes. Indeed, rGO15 is characterized by an augmented RMS surface roughness with an increase in the height maximum value and the average roughness. This is in accordance with the increased sheet thickness, increased interlayer spacing calculated from XRD, and higher disorder measured by Raman spectroscopy. Distinct stacking orientation of the sheets may lead to differences in the surface topography of the agglomerated sheets that are relevant for protein adsorption and cell behaviour. Thus, the statistical parameters surface Skewness (SSk) and kurtosis (SKu) are indicative of the surface structure in terms of asymmetry and flatness, respectively, were also calculated. Skewness characterizes the profile symmetry around the mean line, wherein values above zero illustrate an asymmetrical surface with more peaks than valleys. All measured SSk values were positive, therefore indicating that GO and both reduced forms rGO15 and rGO30 display similar topographies resembling an overall flat plane with wide valleys and narrow sharp peaks. Furthermore, surface kurtosis (SKu) indicates how peaked or sharp a surface is wherein values higher than 3 are distinctive of surfaces with more peaked structures compared to the valley-like ones. Consequently, pristine GO sheets and those annealed for 15- and 30-minutes endow proteins and cells with similar plane-like surfaces with wide valleys and predominant sharp peaked features.
| GO | rGO15 | rGO30 | ||
|---|---|---|---|---|
| Zeta potential (mV) | −35.2 ± 2.7 | −32.3 ± 2.5 | −26.6 ± 2.1 | |
| AFM | Sheet thickness (nm) | 0.82 | 1.02 | 0.87 |
| RMS (nm) | 0.94 ± 0.51 | 3.95 ± 1.17 | 1.79 ± 0.62 | |
| Max value (nm) | 7.73 ± 2.40 | 30.93 ± 7.17 | 26.64 ± 15.61 | |
| Average roughness (nm) | 0.60 ± 0.44 | 2.91 ± 0.84 | 1.44 ± 0.72 | |
| S Sk (nm) | 2.98 ± 1.24 | 1.04 ± 0.47 | 1.86 ± 0.89 | |
| S Ku (nm) | 15.55 ± 8.72 | 6.07 ± 2.41 | 11.85 ± 6.06 | |
| Electrical conductivity (S m−1) | 13 × 10−5 | 63 × 10−5 | 10.1 | |
Higher toxicity of hydrophobic GBM has been linked to their agglomeration in aqueous media resulting in aggregated particles covering the cell surface and inducing physical damage to the cell membrane with oxidative stress.42,43 As agglomeration is more pronounced with increased reduction degrees, rGO is inherently more prone to agglomeration and the morphology of aggregates was assessed through AFM. Fig. 1 illustrates the effect of the slight reduction in the graphene oxide sheets. When a significant number of GO-based nanomaterials are allowed to deposit onto the substrate for AFM observation (Fig. 1, top row), GO flakes display a multilayered flat sheet-like morphology. Conversely, GO reduced for 15 and 30 minutes exhibit the stacking of multiple crumpled and folded sheets, resulting from H2O, CO and CO2 desorption and oxygen moiety decomposition. Furthermore, AFM analysis was performed on diluted solutions of GO-based nanomaterials to better evaluate the morphology of individual flakes of GO and its reduced counterparts (Fig. 1, bottom row). Whereas the majority of pristine GO sheets are small (<1 μm in lateral dimensions), rGO15 and rGO30 shape into agglomerates with lateral dimensions greater than 6 μm.
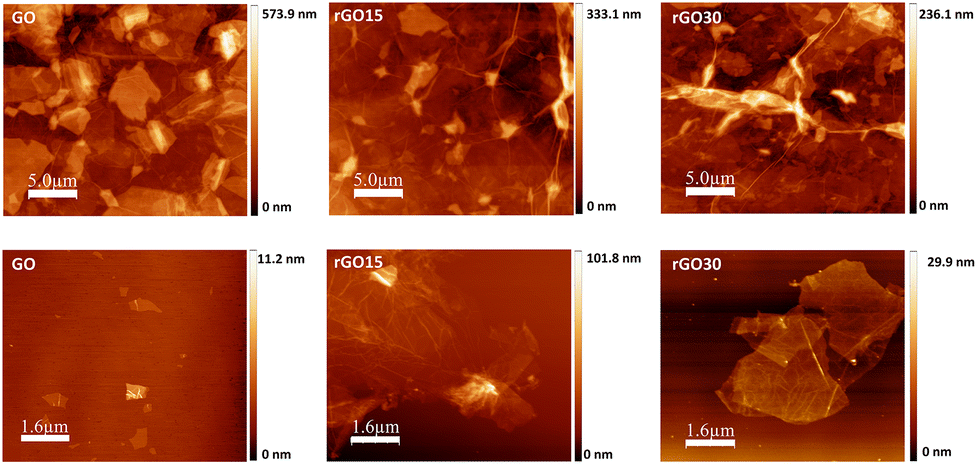 | ||
| Fig. 1 AFM topography images of GO, rGO15, and rGO30 nanomaterials. | ||
Concerning electrical conductivity (EC), while native tissue such as muscle, nerve, lung, and cardiac tissues present low EC (between 0.03 and 0.6 S m−1),44 growing efforts are dedicated to the design of electrically conductive biomaterials to electrically stimulate tissue repair.45 rGO30 presents an electrical conductivity 10![[thin space (1/6-em)]](https://www.rsc.org/images/entities/char_2009.gif) 000 higher than GO and rGO15, i.e. about 10 S m−1. Although this value is far from the rGO electrical conductivity that can be achieved through thermal annealing at much higher temperatures, i.e. at 1000 °C, bulk electrical conductivity from approximately 200 to 1200 S m−1 can be achieved depending on the pressure applied to rGO powders,46 the value obtained here for our low temperature induced reduction is in the order of conductive hydrogels designed for electrically active tissue such as the cardiac tissue. These conductive hydrogels demonstrated to facilitate cardiomyocyte functions by upregulating Cx43 – a known modulator for cell–cell communication – even in the absence of exogenous electrical stimulation.47 In this context, the electroconductivity of rGO was pointed out as a regulating factor for enhanced cell–ECM interactions and cell–cell communication.48
000 higher than GO and rGO15, i.e. about 10 S m−1. Although this value is far from the rGO electrical conductivity that can be achieved through thermal annealing at much higher temperatures, i.e. at 1000 °C, bulk electrical conductivity from approximately 200 to 1200 S m−1 can be achieved depending on the pressure applied to rGO powders,46 the value obtained here for our low temperature induced reduction is in the order of conductive hydrogels designed for electrically active tissue such as the cardiac tissue. These conductive hydrogels demonstrated to facilitate cardiomyocyte functions by upregulating Cx43 – a known modulator for cell–cell communication – even in the absence of exogenous electrical stimulation.47 In this context, the electroconductivity of rGO was pointed out as a regulating factor for enhanced cell–ECM interactions and cell–cell communication.48
Isolation and phenotypic characterization of porcine endothelial progenitor cells
EPCs are a population of circulating bone marrow-derived cells directly involved in the formation of blood vessels.16,17 These cells have a high potential for TE applications, and they are considered as the main experimental model for the evaluation of angiogenic biomaterials.18–24 Early EPCs in the bone marrow are positive for CD133, CD34, and VEGFR-2, while circulating EPCs are positive for CD34, VEGFR-2, CD31 and vascular endothelial cadherin, but they lose CD133 and start expressing the von Willebrand factor (vWF).49 Moreover, EPCs also contain the endothelial isoform of the nitric oxide synthase (eNOS), which plays a key role in important physiological processes such as vasoregulation and angiogenesis.50In the present work, EPCs were isolated from porcine blood and characterized by the expression of plasma membrane markers (CD31, CD34 and VEGFR2) and intracellular markers (eNOS, and vWF) after 3 and 4 weeks of differentiation. CD31 is a transmembrane receptor, also termed platelet endothelial cell adhesion molecule-1 (PECAM-1).51 CD34 is a cell-surface transmembrane glycoprotein, selectively expressed in the haematopoietic system on stem and progenitor cells.52 VEGFR2 is the VEGF receptor 2 whose expression is restricted to endothelial cells, monocytes, and haematopoietic precursors.53 eNOS is the endothelial nitric oxide (NO) synthase, responsible for endothelial NO production.54 vWF is the von Willebrand factor, a glycoprotein produced by endothelial cells and megakaryocytes.55 The expression of these endothelial phenotype markers was evaluated by flow cytometry, as shown in Fig. 2. This figure shows the number of fold increase in the expression of each molecule at week 4 compared to its expression at week 3, in order to better screen the marker evolution during EPC maturation.
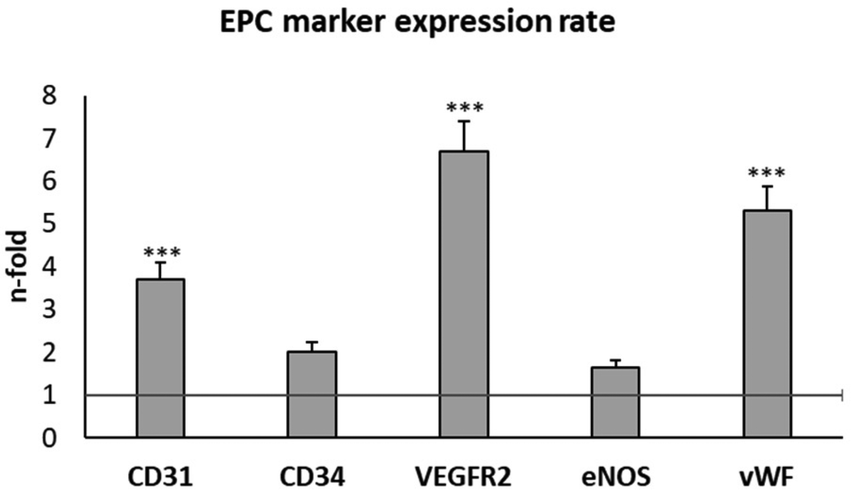 | ||
| Fig. 2 Phenotypic characterization of porcine endothelial progenitor cells (EPCs). The expression of CD31, CD34, VEGFR2, eNOS, and vWF, as endothelial phenotype markers, was evaluated by flow cytometry in EPCs after 3 and 4 weeks of differentiation. The figure shows the number of fold increase in the expression of each marker at week 4 compared to the same marker expression at week 3 (horizontal line). Statistical significance: ***p < 0.005. | ||
The expression of all these EPC markers significantly increased at week 4 compared to the values obtained at week 3, in agreement with previous studies and with the correct progress of endothelial differentiation of these cells.22–24 The most pronounced increases were observed in CD31, VEGFR2 and vWF. Considering these results and considering that VEGFR2 expression is directly related to the angiogenesis process, we selected VEGFR2 to evaluate the effects of GO, rGO15 and rGO30 nanomaterials on EPC functionality. We first analysed the effects of these nanomaterials on the viability and morphology of EPCs, as well as the intracellular uptake of GO, rGO15 and rGO30 by this cell type.
Effects of GO, rGO15 and rGO30 nanomaterials on the viability of porcine endothelial progenitor cells
In order to know the effects of GO, rGO15 and rGO30 nanomaterials on the EPC viability, these cells were cultured in the presence of each nanomaterial (5 μg mL−1) for 24 h. The chosen dosage was based on previous studies, where it was identified as the most effective concentration for integrating these nanostructures without causing alterations to the morphology or viability of other cell lines, such as macrophages.30–32Fig. 3 shows that rGO15 and rGO30 did not induce significant alterations on EPC viability compared to control cells (in the absence of the nanomaterial). However, a significant viability decrease (p < 0.01) was observed after the treatment of EPCs with GO. The interaction of GO with the cell surface likely disrupts plasma membrane integrity, thus allowing the entry of propidium iodide (PI) into the cells.
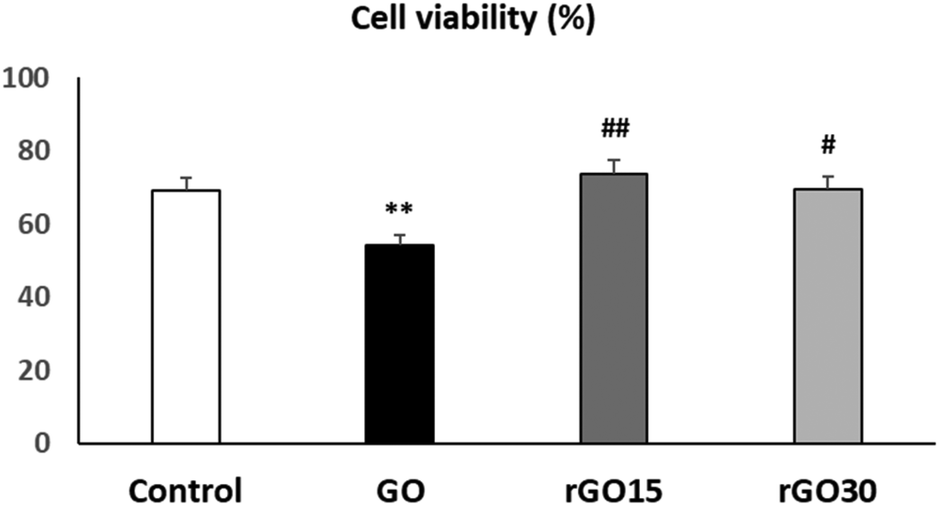 | ||
| Fig. 3 Effects of GO, rGO15 and rGO30 nanomaterials on the viability of porcine endothelial progenitor cells (EPCs). Cell viability was evaluated by flow cytometry after treatment of EPCs with 5 μg mL−1 GO, rGO15 and rGO30 for 24 h. Controls without nanomaterials were carried out in parallel. Statistical significance: **p < 0.01 (vs. control), ## p < 0.01 and # p < 0.05 (vs. GO). | ||
As can also be observed in Fig. 3, cell viability values obtained in the presence of rGO15 and rGO30 were significantly higher than the value in the presence of GO (p < 0.01 and p < 0.05, respectively). These facts are possibly due to the differences in the surface charge between GO and its reduced counterparts above, as well as to a GO-induced oxidative stress situation (also evaluated in the present work as indicated in the following).
These results indicate that the reduction of GO through a vacuum-assisted thermal treatment at 200 °C, regardless of the time used, produces a beneficial effect on cell viability, likely decreasing the damage that this nanomaterial produces in the plasma membrane of endothelial cells.
Intracellular uptake of GO, rGO15, and rGO30 by porcine EPCs observed by confocal and phase contrast microscopy
The incorporation of GO, rGO15, and rGO30 by EPCs was observed by confocal and phase contrast microscopy as in previous studies with other cell types treated with GO nanosheets.56Fig. 4 shows the characteristic morphology of EPCs exposed to these nanomaterials (5 μg mL−1). Intracellular GO, rGO15 and rGO30 appear as black deposits. The actin filaments of the cell cytoskeleton (in red) and the nuclei (in blue) can be observed without alterations. No fragmented nuclei or apoptotic bodies were detected under any of the conditions studied.
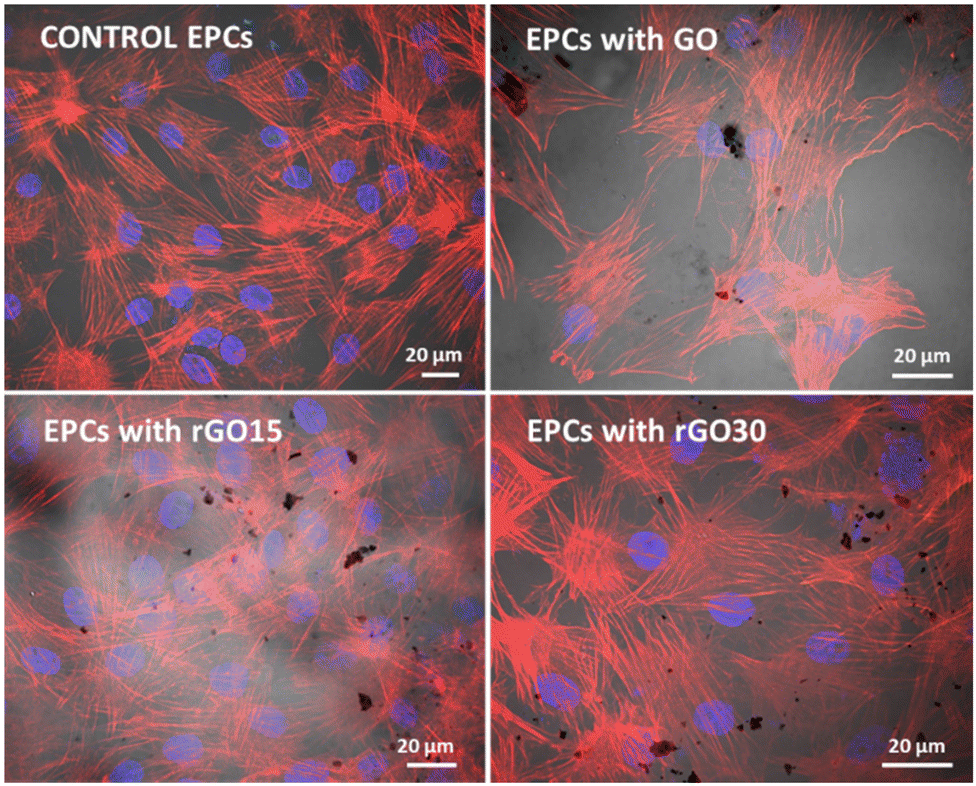 | ||
| Fig. 4 Intracellular uptake of GO, rGO15, and rGO30 (5 μg mL−1) by porcine EPCs after 24 h of treatment by confocal and phase contrast microscopy. The actin filaments of the cytoskeleton were stained with rhodamine–phalloidin (red) and cell nuclei with DAPI (blue). Intracellular GO, rGO15 and rGO30 appear as black deposits. | ||
Intracellular uptake of GO, rGO15, and rGO30 by porcine EPCs analysed by flow cytometry
As shown in Fig. 5 and concerning FSC, the reduced nanomaterials did not produce changes in cell size, meanwhile GO induced a significant decrease in the EPC size at shorter times (24 h), reflecting a possible cell retraction related to the observed decrease in viability at 24 h (Fig. 3).
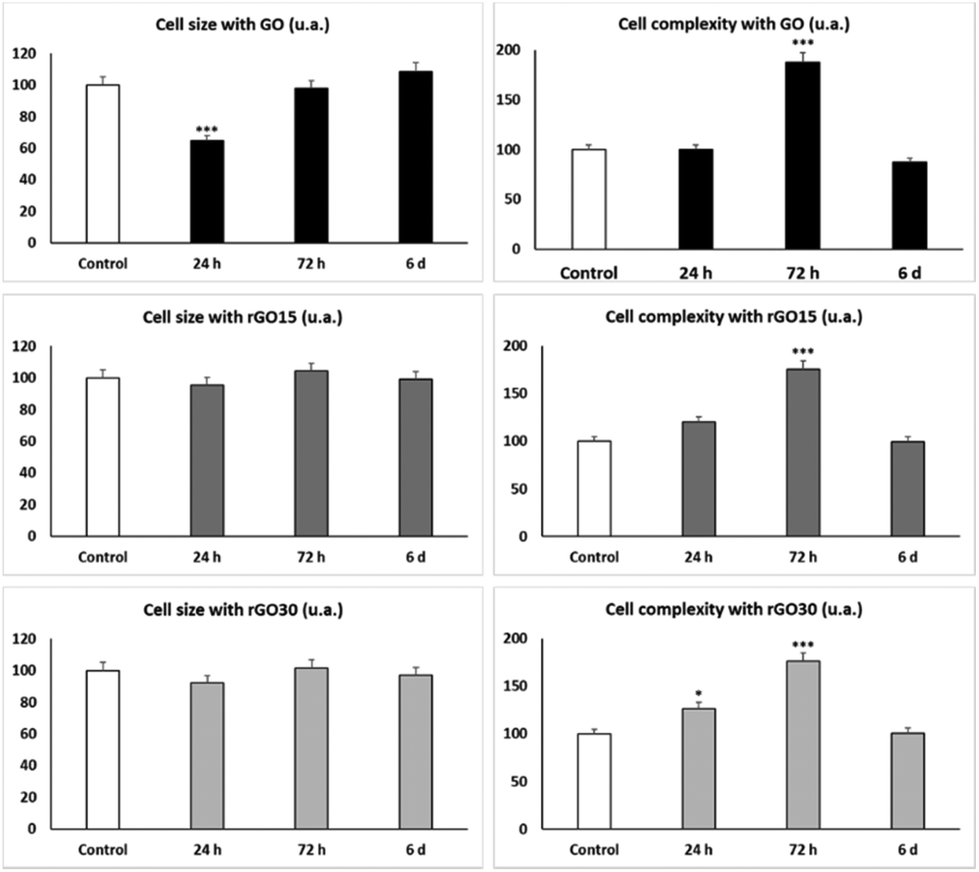 | ||
| Fig. 5 Effects of GO, rGO15 and rGO30 nanomaterials on cell size and complexity of porcine EPCs. Cell size and complexity were evaluated by flow cytometry after treatment of EPCs with 5 μg mL−1 GO, rGO15 and rGO30 for 24 h, 72 h and 6 days. Controls without nanomaterials were carried out in parallel. Statistical significance: ***p < 0.005 (vs. control). | ||
The SSC profiles showed a significant transient increase (p < 0.005) after 72 h of treatment with the three nanomaterials, which corresponds to a significant increment of the intracellular complexity of EPCs exposed to GO, rGO15 and rGO30 compared to control cells. Previous studies with murine peritoneal macrophages56 and RAW-264.7 macrophages60 also demonstrated an increase in SSC after ingestion of GBM by macrophages. Moreover, after treatment of macrophages with either GO61,62 or SiO2-CaO nanospheres63 and C. albicans infection, the intracellular content of these nanoparticles in macrophages diminished when Candida uptake increased, thus suggesting that the exocytosis of these nanomaterials is a dynamic mechanism which favours fungal phagocytosis. The SSC results shown in Fig. 5 reveal a transient intracellular incorporation of GO, rGO15 and rGO30 nanomaterials by EPCs. The behaviour was similar for all three nanomaterials, probably due to their similar topographies as described above. Although it has been indicated above that rGO is inherently more prone to agglomeration than GO and this aggregation could decrease the nanomaterial uptake by the cells, in our experimental conditions and with the culture medium employed, this fact has not been observed with either rGO15 or rGO30.
In this context, previous studies carried out with other types of nanomaterials demonstrated the intracellular incorporation of mesoporous nanospheres by EPCs through clathrin-dependent endocytosis, phagocytosis, and caveolae-mediated uptake.24 Concerning the nanomaterial exocytosis by endothelial cells, an efficient exocytosis of silica nanoparticles by HUVECs has been suggested by other authors.64 It is important to highlight that different mechanisms may take part in the uptake of GBM, depending on the characteristics of each particular cell type.65
In the present work, we evaluated the effects of GO, rGO15 and rGO30 on the intracellular ROS content by flow cytometry after treatment of EPCs with these nanomaterials (5 μg mL−1) for 24 h. As it can be observed in Fig. 6, the treatment with GO induced a significant ROS elevation, not observed after the treatment with rGO15 and rGO30. Intracellular ROS content and cell viability are closely related biological parameters. In fact, ROS overproduction leads to adverse biological effects such as membrane lipid peroxidation, protein denaturation, mitochondrial dysfunction, formation of apoptotic bodies, leakage of lactate dehydrogenase, DNA and RNA damage and finally, cell death. In this study, the lower intracellular ROS content obtained after treatment with rGO15 and rGO30 in comparison with GO (Fig. 6), is associated with the higher cell viability values obtained with rGO15 and rGO30 (Fig. 3). This fact is related to the lower number of oxygen functionalities remaining in these reduced nanomaterials after thermal treatment as demonstrated by XPS analysis. Therefore, the GO reduction process through a vacuum-assisted thermal treatment of GO at 200 °C, regardless of the time used, improved its biocompatibility by preventing the induction of oxidative stress in these endothelial cells. The protective role of the GO reduction against oxidative stress has also been observed with other cell types such as macrophages,31 HepG2 cells,32 and Th lymphocytes.33
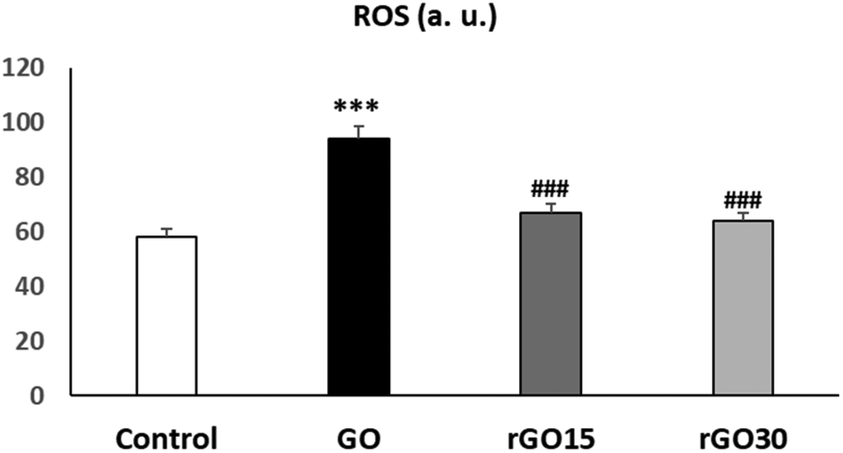 | ||
| Fig. 6 Effects of GO, rGO15 and rGO30 nanomaterials on intracellular reactive oxygen species (ROS) content in porcine EPCs. Intracellular ROS content was evaluated by flow cytometry after treatment of EPCs with GO, rGO15 and rGO30 (5 μg mL−1) for 24 h. Controls without nanomaterials were carried out in parallel. Statistical significance: ***p < 0.005 (vs. control) and ###p < 0.005 (vs. GO). | ||
The results presented in Fig. 7 evidence that GO induced a significant decrease in VEGFR2 expression by EPCs after 72 h of treatment (p < 0.05) which was more pronounced after 6 days (p < 0.005). However, this effect was not observed with rGO15 and rGO30. These results show that the reduction of GO avoids the possible alterations produced by this nanomaterial on the endothelial maturation process and angiogenesis capacity of these cells. In this context, Chakraborty et al. have evidenced the potential of rGO for enhancing angiogenesis in TE applications.68 Several studies suggest a proangiogenic effect of rGO, based on their effects on the proliferation of human umbilical vein endothelial cells (HUVEC) and the ECV-304 cell line.69 However, the focus of the present study has been on the effects of GO and rGO on molecular signals necessary to initiate angiogenesis, such as VEGFR2 expression. The VEGFR2 expression levels obtained after rGO treatment were always higher than those obtained with GO.
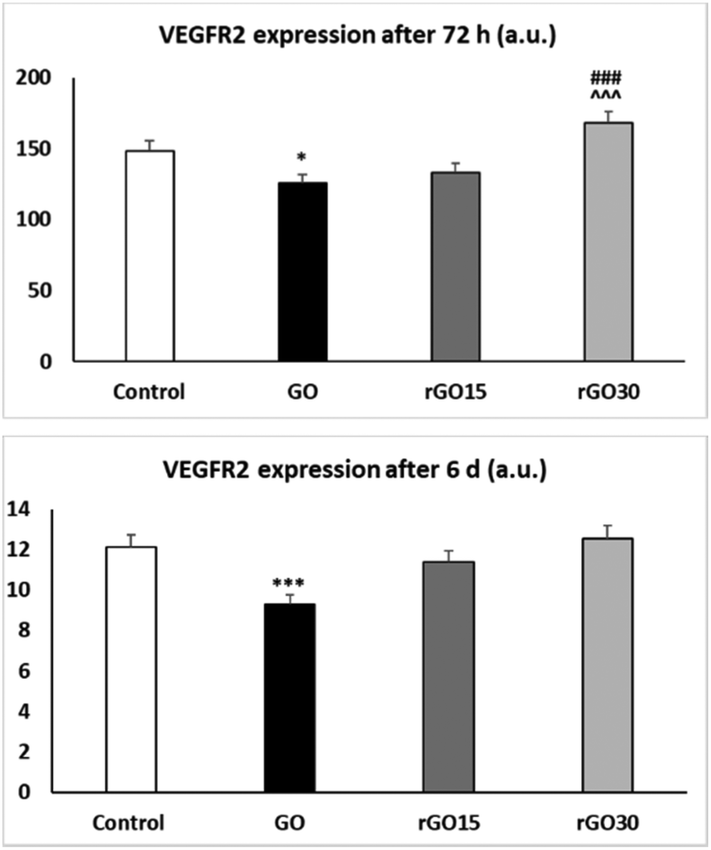 | ||
| Fig. 7 Effects of GO, rGO15 and rGO30 nanomaterials on VEGFR2 expression by porcine EPCs. VEGFR2 expression was evaluated by flow cytometry after treatment of EPCs with GO, rGO15 and rGO30 (5 μg mL−1) for 72 h and 6 days. Controls without nanomaterials were carried out in parallel. Statistical significance: *p < 0.05 and ***p < 0.005 (vs. control); ###p < 0.005 (vs. GO) and ^^^p < 0.005 (vs. rGO15). | ||
Thus, in this work, short annealing (15 and 30 minutes) at 200 °C of GO resulted in the mitigation of both the increased ROS production and decline in VEGFR2 expression of EPCs upon GO exposure. Although further studies will be needed to elucidate the molecular mechanisms underlying our findings, it is remarkable that the expression of VEGFR2 after treatment with rGO30 at 72 h is higher than that in the control, but not with rGO15, suggesting an early angiogenic potential of rGO30.
It is known that incomplete reduction of GO has shown higher adsorption of serum proteins in comparison to GO and fully reduced GO, wherein the partial existence of oxygenated functionalities and hexagonal carbon structures are associated with active sites for interacting with proteins.42 By taking advantage of the high affinity of rGO towards extracellular matrix proteins such as fibronectin, Park et al. added fibronectin-adsorbed rGO flakes to mesenchymal stem cells both in monolayers and spheroids to potentiate myocardial repair, wherein similar concentrations to this work (5 μg mL−1) greatly enhanced the secretion of growth factors such as VEGF. The electroconductivity of rGO was pointed out as the factor regulating these enhanced cell–ECM interactions and cell–cell communication.48 Similarly, the here-observed increased VEGFR2 expression may be related to the amplification of the cell–cell communication from rGO30 which presents a higher electroconductivity than rGO15 and non-reduced GO.
Conclusions
Discrete variations in the reduction of GO may significantly affect the response of porcine endothelial progenitor cells, as demonstrated by this study. The advantages of vacuum-assisted thermal treatment at 200 °C for 15 and 30 minutes to improve GO biocompatibility, as well as the potential angiogenesis-inducing effect of rGO30, were demonstrated. The observed modulation of ROS production and VEGFR2 expression provides useful information for the design and optimisation of biomaterials with enhanced angiogenic properties. This could result in new directions for research in tissue regeneration and biomedical applications.Experimental
Preparation and characterization of GO and thermally reduced GO for 15 and 30 minutes (rGO15 and rGO30)
GO was obtained from Graphenea® (San Sebastián, Spain) in the form of a 0.4 wt% aqueous solution with a monolayer content higher than 95% and particle lateral size lower than 10 μm. This commercial sourced GO dispersion was firstly dialyzed with distilled water replaced daily for a week, and finally freeze-dried in a Teslar lyoQuest HT-40 freeze-drier (Beijer Electronics Products AB, Sweden) to decrease the impurities that originated from chemical exfoliation. The GO powders were then thermally annealed in a vacuum oven for 15 (rGO15) and 30 (rGO30) minutes (Vacutherm, Thermo Scientific, Karlsruhe, Germany). Morphological and structural characterization of GO, rGO15, and rGO30 nanomaterials was performed via atomic force microscopy (AFM), X-ray diffraction (XRD), Raman spectroscopy, X-ray photoelectron spectroscopy (XPS) and zeta potential measurements. Also, bulk electrical conductivity was determined. Topography was evaluated using an AFM Bruker Multimode instrument (Bruker Nano Surfaces, Santa Barbara) with a Nanoscope (IV) MMAFM-2 unit and a conductive Si cantilever (Nanosensors, force constant 15 N m−1, Neuchatel, Switzerland). Further morphological analysis was performed using the WsXM software.70 XRD spectra were acquired from 5 to 60° at a scanning speed of 1° min−1 in a Rigaku SmartLab diffractometer (Rigaku Corporation, Japan) using a Cu Kα radiation (λ = 1.5406 Å). XPS with a hemispherical electron energy analyser SPECS Phoibos 150 (Berlin, Germany) and a monochromatic Al Kα (1486.74 eV) X-ray source was used in an ultra-high vacuum system (with a base pressure of 2 × 10⁻⁸ Pa) at a normal emission take-off angle and 20 eV pass-energy. Raman measurements were performed on a Raman WITec alpha300 RAS+ (WITec, Ulm, Germany) with an Nd:YAG laser operating at 532 nm and 1 mW. Calibration was done by acquiring the spectrum of a silicon wafer (532 nm laser source, 0.5 s, 33 mW laser power). The Gaussian function was fitted to the Raman band at 521 cm−1, and an error of 0.08 cm−1 was obtained. The background subtraction and normalization were performed using the WITec control 5.3+. The zeta potential measurements were carried out in a ZetaSizer Nano ZS (Zen3500, Malvern, Ltd, Malvern, UK) with aqueous dispersions of the various nanomaterials at pH 6.8.For the electrical conductivity measurements, 20 mg of GO, rGO15 and rGO30 powders were prepared as pellets by placing them in a cylinder mould of 10-mm diameter and applying a slight pressure of 2 ton. The bulk electrical conductivity was then measured by cyclic voltammetry using a PalmSens4 interface (PalmSens Compact Electrochemical Interfaces, The Netherlands) where electrical conductivity (σ) was calculated using the following equation: σ = L/AR, with L representing the distance between the two electrodes, R is the measured resistance and A is the cross-sectional area of the powder pellet.
Isolation and culture of porcine EPCs
EPCs were obtained from circulating peripheral blood from healthy pigs obtained from slaughterhouses, as described by Allen et al.49 These cells are classified as biosafety level I and our laboratories have the necessary equipment to work with them. Briefly, porcine whole blood was mixed with phosphate buffered saline (PBS, 1:1), 0.6% sodium citrate and 0.1% bovine serum albumin (BSA). Mononuclear cells (MNC) were separated from the mixture using Histopaque-1077 solution (Sigma Aldrich Corporation, St Louis, MO, USA) in AccuspinTM tubes (Sigma Aldrich Corporation, St Louis, MO, USA) through a density gradient created by centrifugation at 800g at room temperature for 30 minutes. Then, the MNC layer was collected and seeded in F75 polystyrene culture flasks (Corning Inc., Corning, NY, USA) using the endothelial growth medium (EGM-2, Sigma Aldrich Corporation, St Louis, MO, USA) at a density of 2–3 × 10⁵ cells per cm2 under a 5% CO2 atmosphere at 37 °C. The culture medium was refreshed after 96 hours and then every 48 hours until the cells reached confluence.
Phenotypic characterization of porcine EPCs
CD31, CD34, eNOS, vWF, and VEGFR2 were used as specific endothelial markers in order to characterize EPCs by flow cytometry after 3 and 4 weeks of culture in EGM-2. To carry out the analysis, the following antibodies were used: anti-CD31 (TLD-3A12, ab64543, Abcam, UK), anti-CD34 (EP373Y, ab81289, Abcam, UK), anti-eNOS (M221, ab76198, Abcam, UK), anti-vWF (ab6994, Abcam, UK), and anti-VEGFR2 (ab2349, Abcam, UK). Secondary antibodies were also used, conjugated with either DyLight 633 (IgG (H + L) goat anti-rabbit DyLight® 633, Invitrogen, CA, USA) or Alexa 488 (IgG (H + L) highly cross-adsorbed goat anti-mouse AlexaFluor® Plus 488, Invitrogen, CA, USA). The antibodies were prepared in 2% normal goat serum (NGS) reaching a final antibody concentration of 10 μg mL−1 using 106 cells per condition, unless specified by the supplier. For intracellular markers (eNOS and vWF), cells were permeabilized with 0.25% saponin for 10 min at 4 °C before the addition of antibodies. Non-specific binding was avoided by incubating the cells in 10% PBS/NGS for 10 min at room temperature. The EPC suspensions were then analysed on a FACScalibur Becton Dickinson flow cytometer. For Alexa Fluor 488 staining, cells were excited at 488 nm and fluorescence was measured at 519 nm. For DyLight 633 staining, the cells were excited at 638 nm and fluorescence was measured at 658 nm.Measurement of cell viability of porcine EPCs after treatment with GO, rGO15, and rGO30 nanomaterials
Cell viability of EPCs was evaluated by flow cytometry through the propidium iodide (PI) exclusion test. EPCs were cultured in the EGM-2 medium in the presence of 5 μg mL−1 GO, rGO15 and rGO30. Controls without nanomaterials were analysed in parallel. After treatment with these nanomaterials for different times, the cells were harvested using 0.25% trypsin–EDTA and PI was added to the cell suspensions (0.005 wt%/vol in PBS, Sigma Aldrich, St Louis, MO, USA) in order to stain the DNA of dead cells. The fluorescence of PI was measured with a 530/30 band pass filter after excitation at 488 nm in a FACScalibur Becton Dickinson flow cytometer. In each sample, at least 104 cells were analysed by flow cytometry to obtain statistically significant results.Intracellular uptake of GO, rGO15, and rGO30 by porcine EPCs observed by confocal and phase contrast microscopy
For confocal and phase contrast microscopy studies, EPCs were cultured on circular glass coverslips in the presence of 5 μg mL−1 GO, rGO15 and rGO30 respectively for different times. Afterwards, cells were washed three times with PBS to remove the material adhered to the cell surface. After thorough washing of the cultures, the cells were fixed with paraformaldehyde (3.7%) and permeated with 500 μL of Triton-X100 (0.1% in PBS). After 20 min of incubation with BSA (1% in PBS), the samples were stained with rhodamine–phalloidin 1:40 (100 μL), washed with PBS, and stained with 100 μL of 3 μM DAPI. Finally, the samples were observed by using an Olympus Confocal Laser Scanning microscope. Rhodamine fluorescence was excited at 546 nm and detected at 600–620 nm. DAPI fluorescence was excited at 405 nm and detected at 420–480 nm.
Intracellular uptake of GO, rGO15, and rGO30 by porcine EPCs analysed by flow cytometry
Measurement of intracellular reactive oxygen species of porcine EPCs after treatment with GO, rGO15, and rGO30 nanomaterials
Intracellular reactive oxygen species (ROS) content was measured by cell suspension incubation of 104 cells with 100 μM 2′-7′ dichlorofluorescein diacetate (DCFH/DA, Serva, Heidelberg, Germany) at 37 °C for 30 minutes. As DCFH/DA penetrates the cells, cytosolic esterases hydrolyze it producing DCFH, which is converted to DCF due to the intracellular ROS. DCF fluorescence was measured in a FACScalibur Becton Dickinson flow cytometer exciting the sample at 488 nm and measuring the emitted fluorescence with a 530/30 filter. In each sample, at least 104 cells were analysed by flow cytometry to obtain statistically significant results.Measurement of VEGFR2 expression by porcine EPCs after treatment with GO, rGO15, and rGO30 nanomaterials
EPCs were cultured in the presence of 5 μg mL−1 GO, rGO15 and rGO30 respectively for different times. The culture medium was replaced every 3 days. The cells were constantly in direct contact with the material-containing medium. Afterwards, the cells were washed with PBS and the expression of VEGFR2 (angiogenesis marker) was measured as explained in the previous section, using anti-VEGFR2 and anti-mouse conjugated with Alexa 488 in flow cytometry studies carried out using a FACScalibur Becton Dickinson flow cytometer. In each sample, at least 104 cells were analysed by flow cytometry to obtain statistically significant results.Statistics
The results of the study were analysed using the 22nd version of the Statistical Package for the Social Sciences (SPSS). The means and corresponding standard deviations of three identical experiments were expressed. Statistical comparisons between the study groups were carried out using one-way analysis of variance (ANOVA). Post-hoc analysis of differences between study groups was performed using Scheffé and Games-Howell tests. A p-value of less than 0.05 was considered statistically significant.Author contributions
Conceptualization, P. A. A. P. M., M. C. S. and M. T. P.; data curation, A. P. M., M. C., L. C., N. B., P. A. A. P. M. and M. T. P.; formal analysis, A. P. M., M. C., L. C., N. B. and D. S.; funding acquisition, P. A. A. P. M. and M. T. P.; investigation, A. P. M., M. C., L. C., N. B., D. S., M. J. F., R. D. O., M. C. S., P. A. A. P. M. and M. T. P.; methodology, A. P. M., M. C., L. C., N. B., D. S., M. C. S., P. A. A. P. M. and M. T. P.; project administration, P. A. A. P. M. and M. T. P.; resources, P. A. A. P. M. and M. T. P.; supervision, P. A. A. P. M., M. C. S. and M. T. P.; validation, P. A. A. P. M., M. C. S. and M. T. P.; visualization, P. A. A. P. M. and M. T. P.; writing—original draft, A. P. M., M. C., N. B., P. A. A. P. M. and M. T. P.; writing—review and editing, A. P. M., M. C., L. C., N. B., M. J. F., R. D. O., M. C. S., P. A. A. P. M. and M. T. P. All authors have read and agreed to the published version of the manuscript.Conflicts of interest
There are no conflicts to declare.Acknowledgements
This work was supported by the European Union's Horizon 2020 Research and Innovation Programme under grant agreement no. 829060 (NeuroStimSpinal project) and the following Portuguese funding: UIDB/00481/2020 and UIDP/00481/2020 - Fundação para a Ciência e a Tecnologia and CENTRO-01-0145-FEDER-022083 - Centro Portugal Regional Operational Programme (Centro2020) under the PORTUGAL 2020 Partnership Agreement, through the European Regional Development Fund. A. P.-M. and L. C. acknowledge the European Union's Horizon 2020 Research and Innovation Programme for their contract under the NeuroStimSpinal Project. The authors wish to thank the staff of the Centro de Citometría y Microscopía de Fluorescencia of the Universidad Complutense de Madrid (Spain) for assistance in flow cytometry and confocal microscopy studies.References
- P. Wick, A. E. Louw-Gaume, M. Kucki, H. F. Krug, K. Kostarelos, B. Fadeel, K. A. Dawson, A. Salvati, E. Vázquez, L. Ballerini, M. Tretiach, F. Benfenati, E. Flahaut, L. Gauthier, M. Prato and A. Bianco, Angew. Chem., Int. Ed., 2014, 53, 7714–7718 CrossRef CAS PubMed.
- Y. Wang, Y. Wu, Y. Zhang, X. Li, L. Min, Q. Cao, Y. Luo, X. Yang, M. Lu, Y. Zhou, X. Zhu, C. Tu and X. Zhang, J. Mater. Sci. Technol., 2023, 145, 25–39 CrossRef CAS.
- A. Sharma, S. Gupta, T. S. Sampathkumar and R. S. Verma, Biomater. Adv., 2022, 134, 112587 CrossRef PubMed.
- E. López-Dolado, A. González-Mayorga, M. C. Gutiérrez and M. C. Serrano, Biomaterials, 2016, 99, 72–81 CrossRef PubMed.
- M. Li, P. Xiong, F. Yan, S. Li, C. Ren, Z. Yin, A. Li, H. Li, X. Ji, Y. Zheng and Y. Cheng, Bioact. Mater., 2018, 3, 1–18 CrossRef PubMed.
- D. Jiao, A. Zheng, Y. Liu, X. Zhang, X. Wang, J. Wu, W. She, K. Lv, L. Cao and X. Jiang, Bioact. Mater., 2021, 6, 2011–2028 CrossRef CAS PubMed.
- W. Wang, Y. Liu, C. Yang, W. Jia, X. Qi, C. Liu and X. Li, ACS Biomater. Sci. Eng., 2020, 6, 3539–3549 CrossRef CAS PubMed.
- L. Ou, B. Song, H. Liang, J. Liu, X. Feng, B. Deng, T. Sun and L. Shao, Part. Fibre Toxicol., 2016, 13, 57 CrossRef PubMed.
- C. M. Girish, A. Sasidharan, G. S. Gowd, S. Nair and M. Koyakutty, Adv. Healthcare Mater., 2013, 2, 1489–1500 CrossRef CAS PubMed.
- A. Sasidharan, S. Swaroop, P. Chandran, S. Nair and M. Koyakutty, Nanomedicine, 2016, 12, 1347–1355 CrossRef CAS PubMed.
- M. I. Setyawati, C. Y. Tay and D. T. Leong, Nanomedicine, 2014, 9, 1591–1594 CrossRef CAS PubMed.
- M. I. Setyawati, C. Y. Tay, D. Docter, R. H. Stauber and D. T. Leong, Chem. Soc. Rev., 2015, 44, 8174–8199 RSC.
- I. Baldea, D. Olteanu, G. A. Filip, F. Pogacean, M. Coros, M. Suciu, S. C. Tripon, M. Cenariu, L. Magerusan, R.-I. Stefan-van Staden and S. Pruneanu, Carbon, 2020, 158, 267–281 CrossRef CAS.
- Y. Luo, X. Wang and Y. Cao, Chem.-Biol. Interact., 2021, 333, 109325 CrossRef CAS PubMed.
- M. H. Lim, I. C. Jeung, J. Jeong, S. J. Yoon, S. H. Lee, J. Park, Y. S. Kang, H. Lee, Y. J. Park, H. G. Lee, S. J. Lee, B. S. Han, N. W. Song, S. C. Lee, J. S. Kim, K. H. Bae and J. K. Min, Acta Biomater., 2016, 46, 191–203 CrossRef CAS PubMed.
- X. Wang, R. Wang, J. L. Q. Xu and X. Guo, J. Mol. Cell. Cardiol., 2022, 163, 133–146 CrossRef CAS PubMed.
- A. Papathanasopoulos and P. V. Giannoudis, Injury, 2008, 39S2, S21–S32 CrossRef PubMed.
- T. Shirota, H. He, H. Yasui and T. Matsuda, Tissue Eng., 2003, 9, 127–136 CrossRef CAS PubMed.
- L. Casarrubios, N. Gómez-Cerezo, S. Sánchez-Salcedo, M. J. Feito, M. C. Serrano, M. Saiz-Pardo, L. Ortega, D. de Pablo, I. Díaz-Güemes, B. Fernández-Tomé, S. Enciso, F. M. Sánchez-Margallo, M. T. Portolés, D. Arcos and M. Vallet-Regí, Acta Biomater., 2020, 101, 544–553 CrossRef CAS.
- M. C. Serrano, R. Pagani, J. Peña, M. Vallet-Regí, J. V. Comas and M. T. Portolés, J. Tissue Eng. Regener. Med., 2011, 5, 238–247 CrossRef CAS.
- K. Yamamoto, T. Takahashi, T. Asahara, N. Ohura, T. Sokabe, A. Kamiya and J. Ando, J. Appl. Physiol., 2003, 95, 2081–2088 CrossRef.
- M. C. Serrano, R. Pagani, M. Vallet-Regí, J. Peña, J. V. Comas and M. T. Portolés, Acta Biomater., 2009, 5, 2045–2053 CrossRef CAS.
- A. Polo-Montalvo, L. Casarrubios, M. C. Serrano, A. Sanvicente, M. J. Feito, D. Arcos and M. T. Portolés, Pharmaceutics, 2021, 13, 1152 CrossRef CAS PubMed.
- L. Casarrubios, A. Polo-Montalvo, M. C. Serrano, M. J. Feito, M. Vallet-Regí, D. Arcos and M. T. Portolés, Nanomaterials, 2021, 11, 1102 CrossRef CAS PubMed.
- M. Hristov, W. Erl and P. C. Weber, Arterioscler., Thromb., Vasc. Biol., 2003, 23, 1185–1189 CrossRef CAS PubMed.
- T. Asahara, T. Murohara, A. Sullivan, M. Silver, R. van der Zee, T. Li, B. Witzenbichler, G. Schatteman and J. M. Isner, Science, 1997, 275, 964–967 CrossRef CAS PubMed.
- N. Ferrara and T. Davis-Smyth, Endocr. Rev., 1997, 18, 4–25 CrossRef CAS PubMed.
- H. F. Dvorak, J. A. Nagy, D. Feng, L. F. Brown and A. M. Dvorak, Curr. Top. Microbiol. Immunol., 1999, 237, 97–132 CAS.
- M. Shibuya, Genes Cancer, 2011, 2, 1097–1105 CrossRef PubMed.
- N. Barroca, D. M. da Silva, S. C. Pinto, J. P. M. Sousa, K. Verstappen, A. Klymov, F. J. Fernández-San-Argimiro, I. Madarieta, O. Murua, B. Olalde, L. Papadimitriou, K. Karali, K. Mylonaki, E. Stratakis, A. Ranella and P. A. A. P. Marques, Biomater. Adv., 2023, 148, 213351 CrossRef CAS PubMed.
- M. Cicuéndez, L. Casarrubios, N. Barroca, D. Silva, M. J. Feito, R. Díez-Orejas, P. A. A. P. Marques and M. T. Portolés, Int. J. Mol. Sci., 2021, 22, 6701 CrossRef PubMed.
- M. Ahamed, M. J. Akhtar, M. A. M. Khan and H. A. Alhadlaq, Food Chem. Toxicol., 2020, 143, 111515 CrossRef CAS PubMed.
- M. J. Feito, M. Cicuéndez, L. Casarrubios, R. Díez-Orejas, S. Fateixa, D. Silva, N. Barroca, P. A. A. P. Marques and M. T. Portolés, Int. J. Mol. Sci., 2022, 23, 10652 CrossRef PubMed.
- S. Pei and H. M. Cheng, Carbon, 2012, 50, 3210–3228 CrossRef CAS.
- A. Lipatov, M. J. F. Guine, D. S. Muratov, V. O. Vanyushin, P. M. Wilson, A. Kolmakov and A. Sinitskii, Appl. Phys. Lett., 2018, 112, 053103 CrossRef.
- A. V. Dolbin, M. V. Khlistyuck, V. B. Esel'son, V. G. Gavrilko, N. A. Vinnikov, R. M. Basnukaeva, I. Maluenda, W. K. Maser and A. M. Benito, Appl. Surf. Sci., 2016, 361, 213–220 CrossRef CAS.
- H. H. Huang, K. K. H. De Silva, G. R. A. Kumara and M. Yoshimura, Sci. Rep., 2018, 8, 6849 CrossRef PubMed.
- M. J. McAllister, J. L. Li, D. H. Adamson, H. C. Schniepp, A. A. Abdala, J. Liu, M. Herrera-Alonso, D. L. Milius, R. Car, R. K. Prud'homme and I. A. Aksay, Chem. Mater., 2007, 19, 4396–4404 CrossRef CAS.
- W. Gao, Graphene oxide: reduction recipes, spectroscopy, and applications, 2015, 61–95 Search PubMed.
- A. Das, B. Chakraborty and A. Kumar, Bull. Mater. Sci., 2008, 31, 579–584 CrossRef CAS.
- L. Liu, R. Zhang, Y. Liu, H. Zhu, W. Tan, G. Zhu and Y. Wang, Trans. Tianjin Univ., 2018, 24, 555–562 CrossRef CAS.
- S. Kumar and S. H. Parekh, Commun. Chem., 2020, 3, 8 CrossRef CAS PubMed.
- Q. Mu, G. Su, L. Li, B. O. Gilbertson, L. H. Yu, Q. Zhang, Y. P. Sun and B. Yan, ACS Appl. Mater. Interfaces, 2012, 4, 2259–2266 CrossRef CAS PubMed.
- M. Potse, B. Dubé and A. Vinet, Med. Biol. Eng. Comput., 2009, 47, 719–729 CrossRef PubMed.
- Z. Liu, X. Wan, Z. L. Wang and L. Li, Adv. Mater., 2021, 33, 2007429 CrossRef CAS PubMed.
- H. Park, S. Lim, D. D. Nguyen and J. W. Suk, Nanomaterials, 2019, 9, 1387 CrossRef CAS PubMed.
- J. O. You, M. Rafat, G. J. C. Ye and D. T. Auguste, Nano Lett., 2011, 11, 3643–3648 CrossRef CAS PubMed.
- J. Park, Y. S. Kim, S. Ryu, W. S. Kang, S. Park, J. Han, H. C. Jeong, B. H. Hong, Y. Anh and B. S. Kim, Adv. Funct. Mater., 2015, 25, 2590–2600 CrossRef CAS.
- J. Allen, S. Khan, M. C. Serrano and G. Ameer, Tissue Eng., Part A, 2008, 14, 183–194 CAS.
- L. P. Solomonson, B. R. Flam, L. C. Pendleton, B. L. Goodwin and D. C. Eichler, J. Exp. Biol., 2003, 206, 2083–2087 CrossRef CAS PubMed.
- J. A. van Mourik, O. C. Leeksma, J. H. Reinders, P. G. de Groot and J. Zandbergen-Spaargaren, J. Biol. Chem., 1985, 260, 11300–11306 CrossRef CAS PubMed.
- H. B. Wood, G. May, L. Healy, T. Enver and G. M. Morriss-Kay, Blood, 1997, 90, 2300–2311 CrossRef CAS.
- P. J. Kuhlencordt, E. Rosel, R. E. Gerszten, M. Morales-Ruiz, D. Dombkowski, W. J. Atkinson, F. Han, F. Preffer, A. Rosenzweig, W. C. Sessa, M. A. Gimbrone Jr., G. Ertl and P. L. Huang, Am. J. Physiol.: Cell Physiol., 2004, 286, 1195–1202 CrossRef PubMed.
- L. Zanetta, S. G. Marcys, J. Vasile, M. Dobryansky, H. Cohen, K. Eng, P. Shamamian and P. Mignatti, Int. J. Cancer, 2000, 85, 281–288 CrossRef CAS PubMed.
- N. Ferrara, Am. J. Physiol.: Cell Physiol., 2001, 280, 1358–1366 CrossRef PubMed.
- M. J. Feito, R. Díez-Orejas, M. Cicuéndez, L. Casarrubios, J. M. Rojo and M. T. Portolés, Colloids Surf., B, 2019, 176, 96–105 CrossRef CAS PubMed.
- C. Greulich, J. Diendorf, T. Simon, G. Eggeler and M. Epple, Acta Biomater., 2011, 7, 347–354 CrossRef CAS PubMed.
- H. Suzuki, T. Toyooka and Y. Ibuki, Environ. Sci. Technol., 2007, 41, 3018–3024 CrossRef CAS PubMed.
- J. N. Udall, R. A. Moscicki, F. I. Preffer, P. D. Ariniello, E. A. Carter, A. K. Bhan and K. J. Bloch, Adv. Exp. Med. Biol., 1987, 216A, 821–827 CrossRef CAS PubMed.
- M. Cicuéndez, M. Fernandes, M. Ayán-Varela, H. Oliveira, M. J. Feito, R. Díez-Orejas, J. I. Paredes, S. Villar-Rodil, M. Vila, M. T. Portolés and I. Duarte, Colloids Surf., B, 2020, 186, 110709 CrossRef PubMed.
- R. Díez-Orejas, M. J. Feito, M. Cicuéndez, J. M. Rojo and M. T. Portolés, J. Colloid Interface Sci., 2018, 512, 665–673 CrossRef PubMed.
- R. Díez-Orejas, M. J. Feito, M. Cicuéndez, L. Casarrubios, J. M. Rojo and M. T. Portolés, Colloids Surf., B, 2018, 171, 250–259 CrossRef PubMed.
- R. Díez-Orejas, L. Casarrubios, M. J. Feito, J. M. Rojo, M. Vallet-Regí, D. Arcos and M. T. Portolés, Int. Immunopharmacol., 2021, 94, 107457 CrossRef PubMed.
- S. Veeranarayanan, A. C. Poulose, S. Mohamed, A. Aravind, Y. Nagaoka, Y. Yoshida, T. Maekawa and D. S. Kumar, J. Fluoresc., 2012, 22, 537–548 CrossRef CAS PubMed.
- J. Linares, M. C. Matesanz, M. Vila, M. J. Feito, G. Gonçalves, M. Vallet-Regí, P. A. A. P. Marques and M. T. Portolés, ACS Appl. Mater. Interfaces, 2014, 6, 13697–13706 CrossRef CAS PubMed.
- C. Liao, Y. Li and S. C. Tjong, Int. J. Mol. Sci., 2018, 19, 3564 CrossRef PubMed.
- B. Zhang, P. Wei, Z. Zhou and T. Wei, Adv. Drug Delivery Rev., 2016, 105, 145–162 CrossRef CAS PubMed.
- S. Chakraborty, T. Ponrasu, S. Chandel, M. Dixit and V. Muthuvijayan, R. Soc. Open Sci., 2018, 5, 172017 CrossRef CAS PubMed.
- S. Mukherjee, P. Sriram, A. K. Barui, S. K. Nethi, V. Veeriah, S. Chatterjee, K. I. Suresh and C. R. Patra, Adv. Healthcare Mater., 2015, 4, 1722–1732 CrossRef CAS PubMed.
- I. Horcas, R. Fernández, J. M. Gómez-Rodríguez, J. Colchero, J. Gómez-Herrero and A. M. Baro, Rev. Sci. Instrum., 2007, 1, 013705 CrossRef PubMed.
Footnote |
| † Electronic supplementary information (ESI) available. See DOI: https://doi.org/10.1039/d3nr03145d |
| This journal is © The Royal Society of Chemistry 2023 |