 Open Access Article
The development of neutron reflectometry as a probe of the nanoscale structure of polymer thin film systems – founded on the pioneering work of Professor Thomas P. Russell
C. F.
Majkrzak

Center for Neutron Research, National Institute of Standards and Technology, Gaithersburg, MD, USA. E-mail: charles.majkrzak@nist.gov
First published on 17th February 2023
Abstract
Among Professor Russell's numerous, original, and significant contributions to polymer science are those in which he helped pioneer the application of neutron reflectometry to the study of thin film systems. For this groundbreaking work, along with his support of neutron scattering methods in general, he was awarded the 2020 Clifford G. Shull Prize by the Neutron Scattering Society of America, named after and in honor of the Nobel Prize laureate. This article highlights some of the first applications of neutron reflectometry to probe the nanoscale structure of polymer thin film systems that Professor Russell and his colleagues pioneered. A concise account of the subsequent evolution of even more powerful phase-sensitive reflectometry techniques, following the success of their early work, is then presented. In addition to a general description of this current methodology, several particularly relevant and illustrative examples are given.
Introduction
From a wider perspective, neutron scattering methods to study the atomic scale structures and dynamics of condensed matter have become well-established since the advent of sources specifically designed for scientific research a half century ago. Much of what is known about the magnetic structures or the collective excitations such as phonons in material solids, for instance, has been obtained through neutron scattering studies. Neutron scattering is, in several ways, complementary to X-ray scattering as a probe, particularly because of the different means by which each interacts with matter. X-rays predominantly interact with atomic electrons whereas neutrons sense nuclear potentials and unpaired electrons associated with spin or atomic magnetic moments. Since the interaction strength of nuclear potentials can depend on a particular isotope of a given element, neutron scattering can differentiate between them. This is most notable in the case of hydrogen and deuterium where their scattering lengths differ significantly. Consequently, by substituting deuterium for hydrogen in a controlled manner in different parts of, say, an organic polymer, a greater sensitivity to the structure producing the scattering can be obtained. Moreover, due to the relatively weak interaction of neutrons with macroscopic volumes of various crystalline solids such as aluminum or silicon, containers housing samples to be studied – for example, as a function of pressure or temperature or in contact with liquid reservoirs – can be penetrated with relatively little loss.More specifically, since its broader emergence in the 1980s, a particular type of scattering technique known as neutron reflectometry (NR) has become an important probe of the nanoscale structure of materials whose properties are strongly dependent upon surfaces or interfaces. Such materials include a wide variety of thin film systems of both hard and soft condensed matter (a selection of review articles on neutron reflecometry applications in soft condensed matter are cited below1–9 – for a more comprehensive compilation of more than 80 review articles pertaining to NR studies of both soft and hard condensed matter, see, for example, the list by A. Rennie10). These film systems can be of interest in chemistry (particularly polymers), physics, biology, and materials science in general.
This article is not intended to be an exhaustive survey of all neutron reflectometry applications in soft condensed matter research, but, rather, a concise account which specifically reviews some of the work on di-block copolymers originally pioneered by Tom Russell and which helped provide the impetus for the subsequent development of more powerful phase-sensitive neutron reflectometry (PSNR) methods. We begin with a concise review of the fundamentals relevant to analyzing and interpreting neutron reflectivity data.
Neutron reflectometry fundamentals
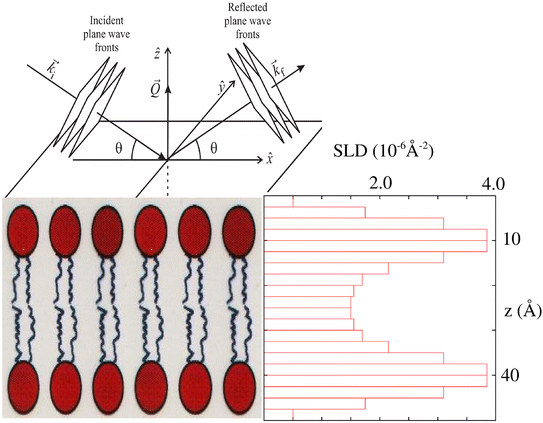
By measuring the ratio of reflected neutrons of a given wavelength to those incident as a function of angle relative to a film surface – defined as the reflectivity – information about the film structure on a nanometer scale can be obtained. The reflection process is taken to be elastic (i.e., without neutron energy gain or loss). More quantitatively, a material composition profile, as a function of depth along the surface normal, can be deduced if the reflectivity is measured over an appropriate angular range in the so-called “specular” condition, i.e., where the angles of incidence and reflection relative to the surface are constrained to be equal. In this specular instrumental configuration, the momentum transfer is normal to the nominal surface so that the effective scattering power of any plane parallel to the surface, at a given depth below it, is represented by the average scattering power of the material in that plane. Non-specular scattering may also occur simultaneously from materials in which the material composition across a plane parallel to the surface is inhomogeneous, but for a predominant fraction of the thin film systems studied this off-specular scattering is negligible. A description of the fundamentals of specular neutron reflectometry, including applications in the study of magnetic materials, can be found in, for example, Majkrzak et al.11 (which is the source of the abbreviated description that follows in this section).A neutron is a quantum particle whose behavior can be described by an associated wavefunction. For many applications, including in specular reflection, that wavefunction for a free neutron propagating through space can be often approximated by a plane wave with sufficient accuracy (for cases in which this approximation may not be valid, see, for example, Majkrzak et al.12 For neutron reflection from a material object possessing a well-defined flat surface, the specular reflectivity as a function of glancing angle of incidence θ relative to that surface can be described by a one-dimensional wave equation. This results from the conservation of momentum in the plane of the surface, as mentioned above. The angle θ is related to the wavevector transfer Q = kF − kI by the expression Q = 2k![[thin space (1/6-em)]](https://www.rsc.org/images/entities/char_2009.gif) sin
sin![[thin space (1/6-em)]](https://www.rsc.org/images/entities/char_2009.gif) θ where kF and kI are the reflected (final) and incident wavevectors, respectively, which are of equal magnitude k (the neutron wavelength λ = 2π/k). Neutrons with wavelengths between 1 and 10 Angstroms are typically employed and the reflection angles involved are relatively small, normally no more than several degrees. The scattering potential can be characterized by a density ρ since for the range of angles or wavevector transfers typically accessible in a specular reflection measurement, the material can be treated as a continuum where the sensitivity to density variations is on a scale of nanometers (and not of atomic or Angstrom dimension). This scattering potential density ρ is technically referred to as the scattering length density (SLD) and is related to the isotope-dependent neutron coherent scattering length b and the number of nuclear scattering centers per unit volume N. For a material composed of a number of different isotopic species,
θ where kF and kI are the reflected (final) and incident wavevectors, respectively, which are of equal magnitude k (the neutron wavelength λ = 2π/k). Neutrons with wavelengths between 1 and 10 Angstroms are typically employed and the reflection angles involved are relatively small, normally no more than several degrees. The scattering potential can be characterized by a density ρ since for the range of angles or wavevector transfers typically accessible in a specular reflection measurement, the material can be treated as a continuum where the sensitivity to density variations is on a scale of nanometers (and not of atomic or Angstrom dimension). This scattering potential density ρ is technically referred to as the scattering length density (SLD) and is related to the isotope-dependent neutron coherent scattering length b and the number of nuclear scattering centers per unit volume N. For a material composed of a number of different isotopic species,
 | (1) |
| [(∂2/∂z2) + k0z2 − 4πρ(z)]Ψ(z) = 0 | (2) |
| kz2 = k0z2 − 4πρ(z) | (3) |
A refractive index nz can then be defined by kz = nzk0z, analogous to that which is defined in classical light optics, so that
| nz = [1 − 4πρ(z)/k0z2]1/2 | (4) |
Consider now a flat slab of material of homogeneous SLD and finite thickness (region II) surrounded by vacuum (regions I and III) as depicted schematically in Fig. 1. A neutron represented by a plane wave of unit amplitude incident on such a slab may produce both a reflected plane wave with amplitude r and transmitted wave of amplitude t.
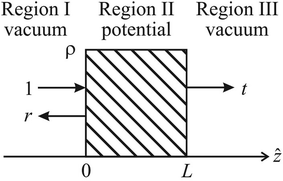 | ||
| Fig. 1 Schematic for specular reflection showing the incident or fronting region on the left, the scattering potential within the middle region, and the backing region on the right. The incident wave amplitude is taken to be unity whereas the reflected and transmitted amplitudes are designated to be r and t, respectively. (After Fig. 1.4 of Majkrzak et al.11). | ||
Taking the neutron wave functions incident, reflected, and transmitted all to have the form of a plane wave exp(ikzz) and imposing the conditions of conservation of momentum and particle number at both interfaces of the slab with vacuum results in a relationship among the amplitudes 1, r, and t.
 | (5) |
Note that the information about the scattering power of the potential is contained in the refractive index nz for the slab of thickness L that defines region II in Fig. 1. This solution method for a single slab can be extended to a SLD profile of arbitrary shape by rendering it into a series of consecutive slabs, analogous to a loaf of sliced bread, as illustrated in Fig. 2. The matrix that connects t, r, and 1 in eqn (5) is referred to as the transfer matrix. For an arbitrary potential as pictured in Fig. 2, the transfer matrix is a product of the individual slab matrices, each of the form of that for the single slab in eqn (5). Each of the individual component slabs may possess a unique refractive index corresponding to its particular SLD. The transfer matrix for an arbitrary SLD profile can be derived by applying the same boundary conditions as in the single-slab case but consecutively at each interface in a piece-wise continuous manner. In this multiple-slab case the transfer matrix is given by
 | (6) |
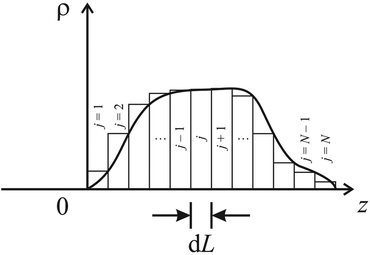 | ||
| Fig. 2 The solution method for a single slab, as described in the main body of text, can be extended to a SLD profile of arbitrary shape that is rendered into a series of consecutive slabs, each of thickness dL and characterized by its own particular value of SLD. (After Fig. 1.6 of Majkrzak et al.11). | ||
A solution of the pair of simultaneous equations for the reflection amplitude r of a layered film system in the general case can be expressed, using eqn (5) and (6), as
 | (7) |
It is important to realize that it is only a reflectivity |r|2 (a normalized intensity) which can be experimentally measured and not the reflection amplitude r (which is a complex quantity). Note that the reflection amplitude contains explicit phase information that the reflectivity does not – the consequences of which will be discussed in a subsequent section.
Nonetheless, the reflectivity |r|2 = r*r as a function of wavevector transfer Q (=2k0z for the specular condition) can be measured and a calculated reflectivity for a model SLD and corresponding material composition depth profile can be fit to the data. The reflectivity is related to the film SLD distribution via the following formula
| 2fb[(1 + |r|2)/(1 − |r|2)] = (f2b2B2 + f2D2) + (b2A2 + C2) | (8) |
A model SLD profile for a typical lipid bilayer, a mimic of a simple biological cell wall structure, is shown in Fig. 3 and its corresponding reflectivity curves are plotted in Fig. 4. Three reflectivity curves are included, one for the free-standing and two for the bilayer film on substrates of either silicon or Al2O3.
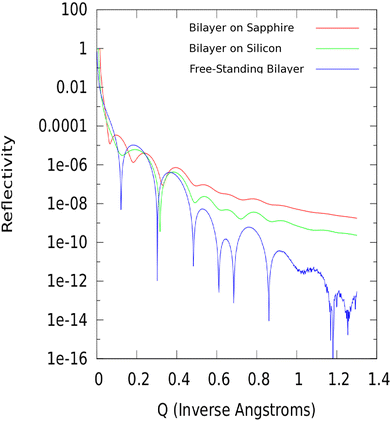 | ||
| Fig. 4 Calculated neutron reflectivity patterns corresponding to the lipid bilayer model SLD profile plotted in Fig. 3 as supported by sapphire (Al2O3), silicon, or free-standing. The higher the value of the wavevector transfer Q at which reflectivity can be measured, the finer the spatial resolution that can be obtained in the corresponding depth profile. | ||
NR as a probe of the nanoscale structure of diblock coploymer films
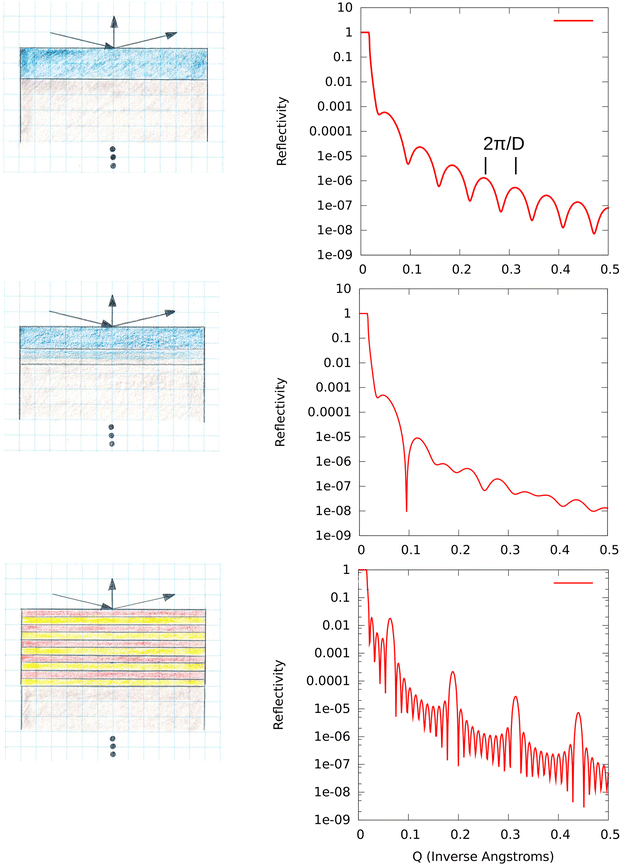
It can be asked why a beam of neutrons should be employed as a probe of polymer film structures. One reason is that neutrons probe well beneath the surface, as discussed in the preceding section, to allow investigation of the structure and composition of a layered system throughout its depth. Another is the nanoscale spatial resolution afforded. Electron or optical microscopy, for example, have either more restrictive penetration and/or spatial resolution limits. It is true that the reflection of X-rays can provide essentially the same information as neutron reflection in many cases, depending on the relative sensitivity to the particular chemical species involved. For instance, for X-rays the scattering length densities corresponding to two different polymers made up predominantly of hydrogen and carbon may be nearly identical. In this case, differentiating two types of polymer in a mixture, such as in a diblock copolymer system, can be difficult if not impossible in practice. However, by employing neutrons as the probe, if one of the components of the diblock system can be deuterated, i.e., by replacing the hydrogens with essentially chemically equivalent deuterium isotopes, the contrast between the two block poloymers can be enhanced immensely, as mentioned in the preceding section. This important substitution method is illustrated in Fig. 5 for a model layered film structure consisting of multiple bilayers of two alternating components. In the first example shown at the top of Fig. 5, the SLDs of the two bilayer components are taken to be identical so that the scattering resembles that of a single, homogeneous layer. In the second example at the bottom of Fig. 5, the SLD of one bilayer component is different from that of the other so that the resulting reflectivity pattern displays the characteristic correlations associated with the periodic multi-bilayer system.Russell and his colleagues were among the first to realize the potential power of applying NR to investigate the ordering of diblock copolymer film systems confined to a flat surface. A number of pioneering articles were published which clearly revealed the ordering behavior of diblock copolymer thin film systems of interest for both scientific reasons and potential technological applications. Some of the principal findings of three of those ground-breaking papers are summarized here.
The morphology of block copolymers neighboring interfaces can be significantly affected by the difference in the surface free energies of the two constituent blocks and their relative affinities for a given supporting substrate. In a 1989 Physical Review Letter,13 Russell and colleagues reported on a study of the surfaced-induced ordering of diblock copolymer films of P(S-b-D-MMA) [poly(styrene-b-deuterium-labeled methylmethacrylate)] employing the reflection of neutrons as a probe. Contrast between the two constituent components of the diblock molecule was enhanced by deuterating one and hydrogenating the other. They discovered that this annealed diblock copolymer system forms multiple lamella parallel to the surface. The multilayer structure forms such that the PS preferentially locates at the interface with the air whereas the D-PMMA is found adjacent to the substrate.
Fig. 6 is a reproduction of Fig. 1 of their original paper13 showing the specular neutron reflectivity curve obtained for a P(S-b-D-MMA) diblock copolymer film on a Si substrate after annealing for 24 h at 170 °C. The inset shows the SLD depth profile from which the fit (solid line) to the data was obtained. The higher value of the SLD in the periodic multilayer structure corresponds to the deuterated diblock component. As already noted, a PS layer preferentially forms at the interface with air. The primary reflection peak at k0 = 0.0195 Å−1 corresponds to a bilayer thickness of approximately 175 Å – as determined from fitting the reflectivity calculated for a model film structure to the data.
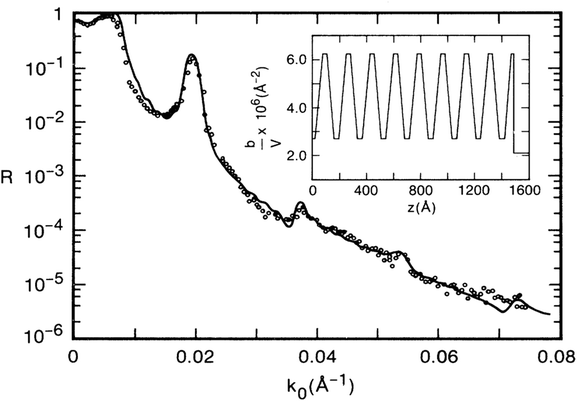 | ||
| Fig. 6 The specular neutron reflectivity as a function of neutron wavevector kZ0 (Q = QZ = 2kZ0) for a P(S-b-D-MMA) diblock copolymer film on a Si substrate after annealing for 24 h at 170 °C. The inset shows the SLD profile from which a reflectivity was calculated (solid line) and fit to the data (open circles). (After Fig. 1 of Anastasiadis et al.13). | ||
Oftentimes a given feature in a reflection or diffraction pattern is difficult to connect to a particular structure in the material object giving rise to the scattering in an intuitive way. This is because of the underlying mathematical relationship between descriptions of material objects in real space and associated patterns in scattering or so-called reciprocal space (when the scattering is sufficiently weak, this relationship is via a Fourier transform). However, in some cases, such as that for a periodic, multilayered structure, an identification between certain diffraction pattern features and corresponding structures in the material object can be made. Specifically, the primary reflection peak referred to above occurs at a position nearly equal to 2π/d where d is the thickness of a single bilayer of the film system. Higher-order principal peaks may occur at integer multiples of that value. Further, if there are, for instance, N repeat units of the bilayer, then N − 2 secondary peaks can, in principle, occur in between the primary ones. It also happens that if each of the two constituents of the bilayer are of equal thickness, then only the odd-numbered primary peaks should appear while the even-numbered ones do not. In general, how well a given model describes an observed reflectivity pattern is judged by the degree to which a reflectivity curve calculated according to the theory (outlined earlier) corresponds to or “fits” the measured reflectivity data.
As of August 2022, this seminal paper had received 446 citations on the Web of Science. Other highly-cited articles were soon to follow.
In a more comprehensive subsequent paper, Anastasiadis et al.,14 Russell and coworkers demonstrated that neutron reflectometry studies could quantitatively characterize the microphase separated morphology of diblock copolymers as a function of the total molecular weight of the copolymer. For example, it was shown that the concentration gradient at the interface between the lamellar copolymer microdomains could be distinguished and that the concentration gradient was found to be more accurately described by a hyperbolic tangent function. Moreover, it was found that the effective width of the interfacial region was approximately 50 Å, independent of the molecular weight of the copolymer blocks.
In yet another investigation of the prototypical symmetric diblock copolymer system consisting of PS and PMMA,15 Russell and collaborators applied neutron reflectometry to determine the ordering as a function of both temperature and film thickness. It was found that a thickness-dependent disorder-to-order transition occurs in thin films of symmetric diblock copolymers. Also, it was shown that the neutron reflectivity data for thin films of this diblock copolymer system was consistent with a model SLD profile exhibiting exponentially damped, oscillatory variations in concentration which propagate inwards from both surfaces with decay lengths that increase as the temperature decreases – as predicted by one particular theory. These NR data and fits to the model are reproduced in Fig. 7.
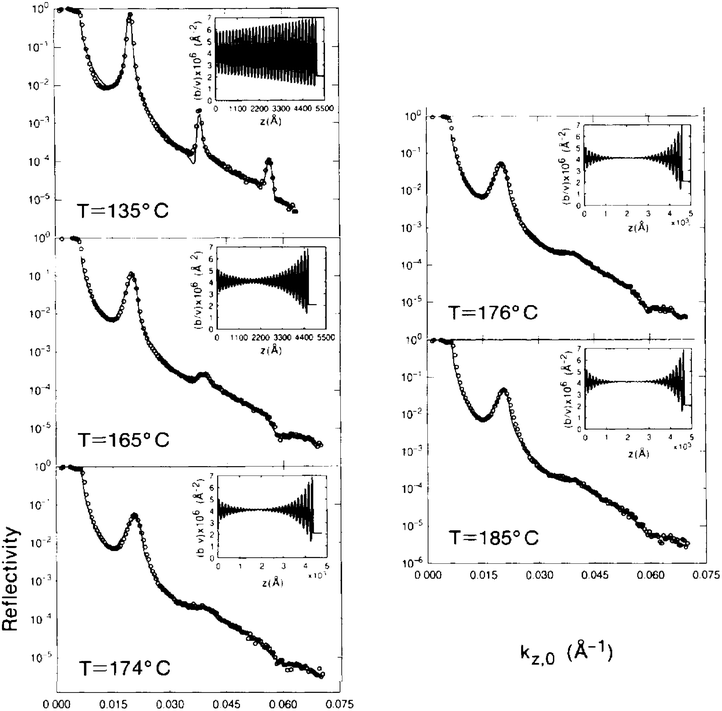 | ||
| Fig. 7 NR reflectivity patterns for a 5232 Å film of a P(D-S-b-MMA) symmetric diblock copolymer at various temperatures. The open circles represent the measured data and the solid lines are calculated fits to the model SLD profiles shown in the inset. (After Fig. 1 of Menelle et al.15). | ||
However, it was not possible to prove that this model of the SLD based on one particular theory was unique – other models for the SLD depth profile might be found to fit the NR data equally well. This is due to the inherent ambiguity in neutron reflectivity data as will be discussed in the following sections.
The phase problem
Consider now, as an illustrative example of the inherent ambiguity of NR – and all diffraction data, a NR study of the surface oxidation of titanium performed by Wiesler et al.16 In this work an electric potential was applied and the resultant thickness and density of the oxide film formed on the Ti, in contact with an aqueous reservoir containing an electrolyte, was determined by specular NR measurements. An example of the results obtained in these measurements is reproduced in Fig. 8.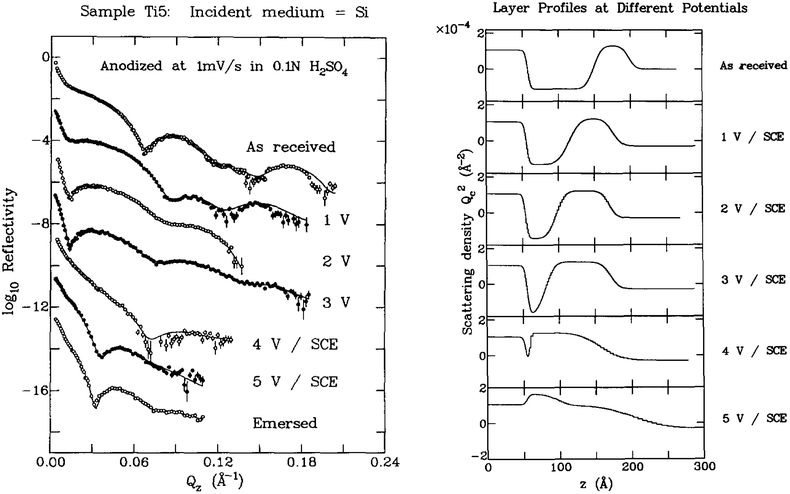 | ||
| Fig. 8 On the left are shown NR data for various states of oxidation of a titanium film in contact with an electrolyte in an aqueous reservoir as originally obtained by Wiesler et al.16 and shown in Fig. 1 of their paper. The open circles are data points whereas the solid lines represent fits of the data using the corresponding SLD profiles displayed on the right-hand side of the figure (after Fig. 2 of Wiesler et al.16). In the SLD plots, the silicon substrate is on the left and the aqueous reservoir on the right (note that the SLD is characterized in terms of the critical angle or QC for Si as opposed to the more conventional unit of Å−2 as is current practice). The data suggest a systematic growth of the TiO layer at the expense of the Ti with increasing applied voltage. (Note that the SLD for titanium metal is a negative quantity which is relatively uncommon for most isotopes.). | ||
Although the fits to the NR data in the titanium film oxidation experiment described above have excellent chi-square values characterizing “goodness of fit”, it was subsequently discovered that other SLD depth profiles could predict the data equally well. Berk et al.17 found that another type of fitting procedure involving so-called parametric B splines could yield comparably good fits but with completely different model SLD profiles as shown, for instance, in Fig. 9.
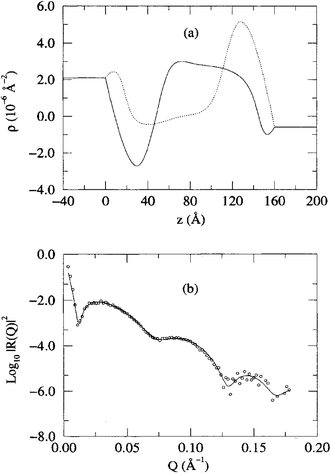 | ||
| Fig. 9 In the upper part of the figure (a), two noticeably different SLD profiles are plotted, each corresponding to essentially the same goodness of fit obtained by Berk et al.17via a parametric B spline fit to one of the sets of NR data (b) obtained in the oxidation study of titanium films by Wiesler et al.16 (shown in Fig. 8 above). These conflicting results are indicative of the ambiguity that can occur due to the loss of phase information inherent to NR and all diffraction measurements. The reflectivity data correspond to stepping the potential to 3 volts (as described in the caption of Fig. 4 in the original work by Wiesler et al.16). | ||
It is true that in many instances, including that of the Ti/TiO SLD profile presented above, the correct, physical SLD profile corresponding to the NR data can be identified by considering additional information – e.g., limits on allowable SLD values of the chemical constituents of the materials involved. However, this is not always possible. In other cases, either a symmetry-related pair of alternative SLD profiles or model SLD profiles which differ in other ways can correspond to nearly identical reflectivity patterns – which may be practically indistinguishable from one another within a given degree of experimental uncertainty in the data, arise.18
The underlying cause of the potential ambiguity in the analysis of reflectivity data stems from the fact that it is only possible to directly measure a reflected intensity in diffraction methods. As discussed in the Introduction, the neutron is characterized by a wavefunction which is often approximated by a plane wave, although it is sometimes necessary to adopt a more localized wavepacket. Either way, it is the reflectivity |r|2 (a normalized intensity) which can be experimentally measured and not the reflection amplitude r (which is a complex quantity). The reflection amplitude contains explicit phase information as is evident for the case of a simple plane wave Ψ of the form Ψ(z) = A![[thin space (1/6-em)]](https://www.rsc.org/images/entities/char_2009.gif) exp( + ikZz). However, the probability of finding (i.e., detecting) a neutron at a position z is then proportional to Ψ(z)*Ψ(z) = |Ψ(z)|2 = A*exp(−ikZz)A
exp( + ikZz). However, the probability of finding (i.e., detecting) a neutron at a position z is then proportional to Ψ(z)*Ψ(z) = |Ψ(z)|2 = A*exp(−ikZz)A![[thin space (1/6-em)]](https://www.rsc.org/images/entities/char_2009.gif) exp( + ikZz) = A*A = |A|2. The information about the relative location of scattering atoms within a material that is embedded in the argument of the exponential is lost when an intensity is measured.
exp( + ikZz) = A*A = |A|2. The information about the relative location of scattering atoms within a material that is embedded in the argument of the exponential is lost when an intensity is measured.
And so, despite the early success of employing neutron reflectometry as a probe of the nanostructure of polymer and other condensed matter thin film systems, both hard and soft, it became apparent that the loss of phase information could potentially impose a significant limitation on the usefulness of the method. Gian Felcher, Tom Russell, and others in the community recognized this problem and organized a workshop specifically to consider what could be done to address it – as stated in the Forward to the proceedings of the meeting.19 One of the outcomes of this workshop was an even better appreciation of the significance of the loss of phase information in neutron reflectometry. This in turn provided further incentive to search for a solution to the phase problem. As a result, a method for performing phase-sensitive neutron reflectivity measurements was subsequently developed a few years later, a description of which is given in the following section.
A solution to the phase problem in neutron reflectometry
It has been shown by rigorous mathematical proof20 that for a one-dimensional scattering problem, such as specular neutron reflection, there exists an exact relationship between the scattering potential and the reflection amplitude. There is, further, a unique one-to-one correspondence between the reflection amplitude and the potential to the extent allowed by the truncation of the reflection amplitude at some maximum value of Q beyond which it is possible to obtain it – as long as the potential does not possess any bound states or significant absorption.20 The connection between reflection amplitude and potential or SLD can be described by a Fourier transform if the scattering is sufficiently weak or, if stronger, then by either an integral equation20 or differential equation.21 As it turns out, the real part of the reflection amplitude, Re r(Q), alone suffices to perform an inversion. This special relationship between reflection amplitude and scattering potential in the case of specular reflection for neutrons is remarkable. It means that if the reflection amplitude can be obtained, the specular reflection process can be practically equivalent to real space imaging.So the challenge was to find an indirect – yet exact – way to determine the reflection amplitude. As it happened, it was subsequently discovered that the very nature of the piece-wise continuous solution method for the reflectivity from an arbitrary SLD profile, as described in the earlier section on refectometry fundamentals, presented a means for experimentally obtaining the reflection amplitude itself – by performing reflectivity measurements on a set of composite film systems, each consisting of a common “unknown” part of interest plus a different known component serving as a reference medium.22–26
Such reference techniques are now well-established in neutron reflectometry and a variety of reference structures ranging from a set of known layers, including tunable ferromagnetic reference layers used in conjunction with polarized beams, to variation of the media surrounding the film of interest, such as the substrate, have been employed. To illustrate explicitly how the use of references in neutron reflectometry, referred to as phase sensitive neutron reflectometry (PSNR), enables the retrieval of the reflection amplitude, we will examine one of the simplest means, namely by variation of the substrate on which the film system of interest is deposited.
Consider the expression for the reflectivity as given by eqn (8) but where the fronting medium characterized by the refractive index f is vacuum so that f = 1. The reflectivity in this case is related to the matrix elements for the film by
| 2b[(1 + |r|2)/(1 − |r|2)] = (b2B2 + D2) + (b2A2 + C2) | (9) |
or, by re-arranging terms,
| 2b[(1 + |r|2)/(1 − |r|2)] = b2(A2 + B2) + (C2 + D2) | (10) |
It turns out that the reflection amplitude for the reversed, free-standing film Re rREV UK (Q) (where “UK” denotes an “unknown” film system of interest) is given by
 | (11) |
Suppose that the reflectivities of two composite systems, one composed of the free-standing film system of interest deposited on a substrate with refractive index value b1 and the other consisting of the same film but on a different substrate of index b2, are measured as a function of Q. Then the corresponding eqn (10) for these two composite systems can be used to simultaneously solve for the two quantities (A2 + B2) and (C2 + D2) – which can be substituted into eqn (11) for Re rREV UK. This algebraic solution is exact and can be obtained at each independent value of Q. The real part of the reflection amplitude can then be uniquely related to the SLD profile through a Fourier transform or integral equation as described earlier in this section.
An actual example of the experimental implementation of the method just described can be found in a study of lipid membranes.27 The upper part of Fig. 10 shows the composite system refectivities for a bilayer and metal film system deposited on either silicon or Al2O3 substrates – as well as the real part of the complex reflection amplitude for the Cr, Au, and biomembrane layers as retrieved from the composite system reflectivity data sets by the PSNR method. Note that in this case, the reference that is varied is the substrate for the film which simultaneously serves as the fronting medium through which the neutron beam is incident – this requires slightly different, but closely related, equations for the composite system reflectivities and Re r for the film system than eqn (10) and (11). On the lower part of Fig. 10 is plotted the SLD profile for the biomembrane on the AuCr layer (solid red curve) as obtained by direct inversion of the data shown on the upper part of the figure using the PSNR method described earlier. For comparison, the prediction of a molecular dynamics simulation is given by the dashed blue curve. The relatively pronounced oscillations of the SLD obtained by direct inversion in the region of the Au layer is an artifact due to the truncation of the reflectivity data at the maximum value of Q at which it was possible to measure the reflectivity. The black solid curve that is also plotted is the predicted SLD profile when the truncation effects are accounted for.
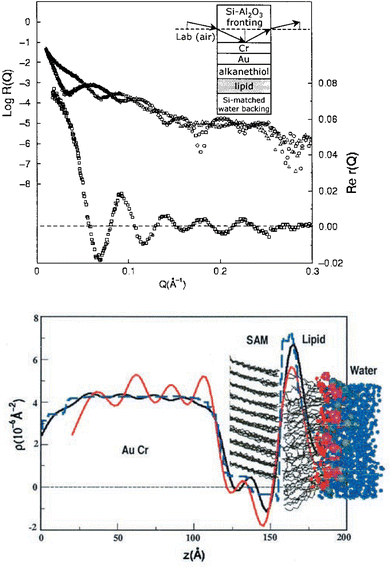 | ||
| Fig. 10 The inset on the upper part of the figure is a schematic of two composite systems. One composite consists of a substrate of single crystalline silicon (which is the medium through which the neutron beam is incident) on which are deposited, in sequence, a Cr, Au, alkane thiol, and lipid layer, the last of which is in contact with an aqueous reservoir filled with water matched to have the SLD of Si. The other composite system is exactly the same except that the substrate material is Al2O3 instead of Si. The reflectivities corresponding to the two composite systems are plotted in the main part of the figure where the triangular symbols correspond to the composite system with the Si substrate while the circles indicate the data for the system with the Al2O3 substrate. The plot immediately beneath the composite reflectivities represents the real part of the reflection amplitude for the film structure independent of the substrate and water reservoir as obtained by the PSNR method described above. In the lower part of Fig. 10 is plotted (solid red curve) the SLD profile for the biomembrane, Au and Cr layers as obtained by direct inversion of the real part of the reflection amplitude appearing in the upper part of the figure. Also plotted is the SLD profile predicted by a molecular dynamics simulation (blue dashed curve). The unphysical oscillations of the SLD profile obtained by direct inversion (solid red line) in the region of the Au layer is due to truncation of the reflectivity data at a finite maximum value of wavevector transfer Q, beyond which signal could not be distinguished from background. Correcting for this truncation effect predicts the SLD profile represented by the solid black curve. Further details can be found in the original article. (After Fig. 1 and 3 of Majkrzak et al.27). | ||
In another work employing PSNR, Le Brun et al.28 investigated the orientation of antibodies bound to engineered biosensor surfaces. In this study, a magnetic ferromagnetic reference layer buried beneath and chemically isolated from the biological layers was employed in conjunction with a polarized neutron beam. By selecting the polarization of the neutron beam to be in one or the other of the two possible spin states, the SLD of the magnetic film serving as reference could be, in effect, varied. As in many studies of organic film systems of interest in biology, the neutron reflectivity measurements are complemented by information obtained from other techniques such as circular dichroism spectroscopy and surface plasmon resonance (SPR) and knowledge of molecular structures determined by X-ray crystallography.
One of the principal objectives in the research by Le Brun et al.28 was to determine how antibodies assemble on transducer surfaces in the correct orientation to bind antigens and thereby function as a biosensor. Biosensors are used to identify and quantify a broad range of biomolecules. More specifically, the system studied by Le Brun et al. involved a membrane protein array that binds immunoglobulin G (IgG) (an antibody) at its constant regions so that the variable regions are free to bind antigen. The scaffold of the array is the transmembrane domain of the outer membrane protein A (tOmpA) from Escherichia coli – engineered to assemble as an oriented monolayer on gold surfaces. The circularly permuted ctOmpA fused to two Z domains of Staphylococcus aureus protein A (ZZctOmpA) was used to create the immunoglobulin G-binding array.
Employing both a magnetic layer reference (a saturated magnetic layer of μ-metal – an alloy of 75% iron, 15% nickel with traces of copper and molybdenum) and an isotopic variation (D2O and gold-matched water [GMW] in the aqueous reservoir), it was possible to retrieve phase information from multiple neutron reflectivity data sets. An additional benefit of recovering phase information, not mentioned in the preceding discussion of phase-sensitive methods, is that the spatial resolution in the SLD profile can be enhanced by up to a factor of two over that possible by conventional analysis of the reflectivity for a single data set collected over the same range of wavevector transfer.25
Information obtained from surface plasmon resonance (SPR) and neutron reflection methods was combined to more accurately determine the assembly of the protein array, antigen binding capacity and the structural orientation of the bound antibody/antigen layer. For example, whereas the SPR quantifies how much of a substance such as polyethylene glycol with a thiolalkane functional group (thio-PEG) is deposited, the neutron reflectivity measurements show how crucial the filling molecule is to the integrity of the protein array. The fitting of the neutron reflection data for a gold surface with only beta-mercaptoethanol (BME) and protein deposited shows that the orientation of the ZZctOmpA protein is not well-defined. Overall the protein is shorter and there is a high surface roughness (Fig. 11). After the thio-PEG is deposited onto the surface ZZctOmpA adopts a uniform orientation (Fig. 11).
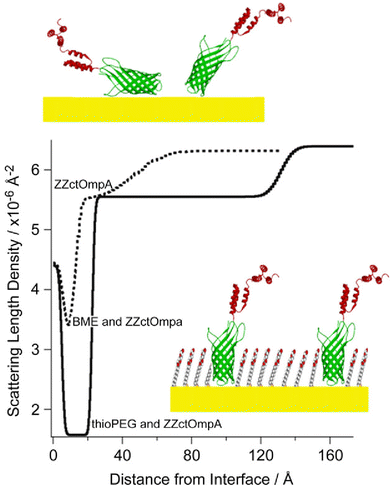 | ||
| Fig. 11 The SLD profile plotted as the dotted line corresponds to ZZctOmpA protein molecules immobilized to the gold surface prior to thio-PEG (thio-polyethylene glycol) deposition as depicted pictorially at the top of the figure. With only protein and beta-mercaptoehanol (BME) on the surface, the protein layer by itself is not uniformly oriented. In contrast, the SLD obtained after thio-PEG deposition is represented by the solid line and corresponds to the picture at the bottom. This demonstrates that once the filling molecule thio-PEG is added, the protein is able to adopt a uniform orientation and the expected thickness of ZZctOmpA is observed. (After Fig. 3 of Le Brun et al.28). | ||
The total height of the ZZctOmpA protein plus thioPEG (thio-polyethylene glycol) array is 120 Å. However, it is possible to deduce the structure of the ZZctOmpA molecule within the array through experiment.28 Multiple reflectivity data sets corresponding to different magnetic and isotopic contrasts were collected for an array of ctOmpA. The biofilm system was placed within an external magnetic field to align the magnetic domains in the μ-metal layer (between the gold surface and the silicon substrate) so that its effective SLD for an incident beam of spin-up polarized neutrons is different than that for a spin-down polarized beam. In addition to this variable magnetic reference mechanism, the reservoir SLD can be varied by substituting D2O for gold SLD matched water (GMW). All together four separate sets of reflectivity data were collected for the same biological film system of interest. By fitting these separate data sets simultaneously, the phase information intrinsic to the biological film system is effectively retrieved – which is essentially equivalent to performing a direct inversion of the reflection amplitude to obtain a unique SLD profile.26 The neutron reflectivity data sets and corresponding simultaneous fits are shown in Fig. 12 along with the SLD profiles deduced from which the height of ctOmpA was found to be 60 Å, which is in agreement with the published crystal structure of tOmpA (57 Å). The resultant SLD profile represents a remarkably accurate picture of an engineered biosensor surface.
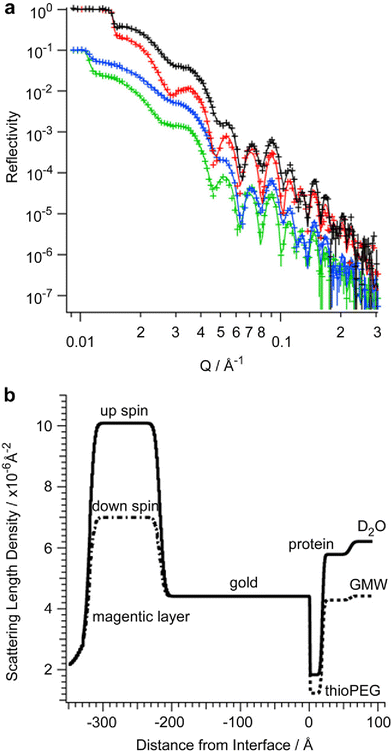 | ||
| Fig. 12 (a) The reflectivity of an array of ctOmpA in D2O (black for neutron spin up and red for spin down) and gold SLD-matched water (GMW) (blue for neutron spin up and green for spin down). The symbols represent the data and the solid lines the fits. The GMW data is offset for clarity. (b) The corresponding SLD profile of the ctOmpA array. (After Fig. 4 of Le Brun et al.28). | ||
A significant conclusion of this work was that a gold-immobilized, antibody-binding membrane protein can retain its function and provide a basis for sensitive immunodiagnostic devices. For a more comprehensive and detailed description, reference can be made to the original article.28
Additional research involving the application of PSNR include, for example, profiling the composition of a binary polymer blend,29 an organic photocell film,7 synthetic bio-compatible vascular coatings,30 and ion channel-containing membranes.31
Conclusion
In this brief review we have described some of the pioneering work that Professor Thomas P. Russell contributed to polymer science through the application of neutron reflectometry as a probe of the nanoscale morphology and physical behavior of diblock copolymer thin film systems. In addition, an overview of the subsequent development of even more powerful phase sensitive neutron reflectometry methods to address potential ambiguities, a limitation of ordinary reflectometry measurements that was recognized early on by Russell and his colleagues, is given. Neutron reflectometry, since the early pioneering work of Russell and co-workers has become established as a unique probe of soft condensed matter in general and polymer thin film systems in particular.Conflicts of interest
There are no conflicts to declare.Acknowledgements
A note of appreciation and recognition is due to my longtime NIST colleagues, in particular Sushil Satija, Susan Krueger, Norm Berk, Ursula Perez-Salas, Paul Kienzle and John Ankner for their early and significant contributions to the advancement of neutron reflectometry in studies of soft condensed matter. A special thanks is also due to Adrian Rennie for compiling and sharing a very useful bibliography of review articles describing neutron reflectivity and its application to the investigation of surfaces and interfaces.References
- T. P. Russell, Mater. Sci. Rep., 1990, 5, 171 CrossRef CAS.
- J. Penfold and R. K. Thomas, J. Phys.: Condens. Matter, 1990, 2, 1369 CrossRef CAS.
- C. F. Majkrzak and Gian P. Felcher, MRS Bull., 1990, 15, 65 CrossRef CAS.
- J. Penfold, R. M. Richardson, A. Zarbakhsh, J. R. P. Webster, D. G. Bucknall, A. R. Rennie, R. A. L. Jones, T. Cosgrove, R. K. Thomas, J. S. Higgins, P. D. I. Fletcher, E. Dickinson, S. J. Roser, I. A. McLure, A. R. Hillman, R. W. Richards, E. J. Staples, A. N. Burgess, E. A. Simister and J. W. White, J. Chem. Soc., Faraday Trans., 1997, 93, 3899 RSC.
- S. Krueger, Curr. Opin. Colloid Interface Sci., 2001, 6, 111 CrossRef CAS.
- J. Penfold, Curr. Opin. Colloid Interface Sci., 2002, 7, 139 CrossRef CAS.
- B. J. Kirby, P. A. Kienzle, B. B. Maranville, N. F. Berk, J. Krycka, F. Heinrich and C. F. Majkrzak, Curr. Opin. Colloid Interface Sci., 2012, 17, 44 CrossRef CAS.
- F. Heinrich and M. Lösche, Biochim. Biophys. Acta, 2014, 1838, 2341 CrossRef CAS PubMed.
- J. H. Lakey, Curr. Opin. Colloid Interface Sci., 2019, 42, 33 CrossRef CAS.
- A. R. Rennie, Review Articles about Neutron Reflection, http://www.reflectometry.net/biblio/Neutron_reflection_reviews_bibliography.pdf.
- C. F. Majkrzak, K. V. O'Donovan and N. F. Berk, Polarized Neutron Reflectometry, in Neutron Scattering from Magnetic Materials, ed. T. Chatterji, Elsevier Science, Amsterdam, 2006, ch. 9, pp. 397–471 Search PubMed.
- C. F. Majkrzak, N. F. Berk, B. B. Maranville, J. A. Dura and T. Jach, J. Appl. Crystallogr., 2022, 55, 787 CrossRef CAS PubMed.
- S. H. Anastasiadis, T. P. Russell, S. K. Satija and C. F. Majkrzak, Phys. Rev. Lett., 1989, 62, 1852 CrossRef CAS PubMed.
- S. H. Anastasiadis, T. P. Russell, S. K. Satija and C. F. Majkrzak, J. Chem. Phys., 1990, 92, 5677 CrossRef CAS.
- A. Menelle, T. P. Russell, S. H. Anastasiadis, S. K. Satija and C. F. Majkrzak, Phys. Rev. Lett., 1992, 68, 67 CrossRef CAS PubMed.
- D. G. Wiesler and C. F. Majkrzak, Phys. B, 1994, 198, 181 CrossRef CAS.
- N. F. Berk and C. F. Majkrzak, Phys. Rev. B: Condens. Matter Mater. Phys., 1995, 51, 11296 CrossRef CAS PubMed.
- C. F. Majkrzak and N. F. Berk, Phys. B, 2003, 336, 27 CrossRef CAS.
- Proceedings of the Workshop on Methods of Analysis and Interpretation of Neutron Reflectivity Data, Argonne, Illinois, 23–25 August, ed. G. P. Felcher and T. P. Russell, North Holland, 1991 Search PubMed.
- K. Chadan and P. C. Sabatier, Inverse Problems in Quantum Scattering Theory, Springer-Verlag, New York, 1989 Search PubMed.
- P. E. Sacks, Wave Motion, 1993, texts 18, p. 21 Search PubMed.
- C. F. Majkrzak and N. F. Berk, Phys. Rev. B: Condens. Matter Mater. Phys., 1995, 52, 10827 CrossRef CAS PubMed.
- V. O. de Haan, A. A. van Well, S. Adenwalla and G. P. Felcher, Phys. Rev. B: Condens. Matter Mater. Phys., 1995, 52, 10831 CrossRef CAS PubMed.
- C. F. Majkrzak and N. F. Berk, Phys. Rev. B: Condens. Matter Mater. Phys., 1998, 58, 15416 CrossRef CAS (Erratum Phys. Rev. B, 60, 16211.).
- C. F. Majkrzak, N. F. Berk and U. A. Perez-Salas, Langmuir, 2003, 19, 7796 CrossRef CAS.
- C. F. Majkrzak, N. F. Berk and P. Kienzle, Langmuir, 2009, 25, 4154 CrossRef CAS PubMed.
- C. F. Majkrzak, N. F. Berk, S. Krueger, J. A. Dura, M. Tarek, D. Tobias, V. Silin, C. W. Meuse, J. Woodward and A. L. Plant, Biophys. J., 2000, 79, 3330 CrossRef CAS PubMed.
- A. P. Le Brun, S. A. Holt, D. S. H. Shah, C. F. Majkrzak and J. H. Lakey, Biomaterials, 2011, 32, 3303 CrossRef CAS PubMed.
- H. Grull, A. Schreyer, N. F. Berk, C. F. Majkrzak and C. C. Han, Europhys. Lett., 2000, 50, 107 CrossRef CAS.
- U. A. Perez-Salas, K. M. Faucher, C. F. Majkrzak, N. F. Berk, S. Krueger and E. L. Chaikof, Langmuir, 2003, 19, 7688 CrossRef CAS.
- S. A. Holt, A. P. Le Brun, C. F. Majkrzak, D. J. McGillivray, F. Heinrich, M. Loesche and J. H. Lakey, Soft Matter, 2009, 5, 2576 CAS.
| This journal is © The Royal Society of Chemistry 2023 |


