An interlayer spacing design approach for efficient sodium ion storage in N-doped MoS2†
Peng
Wang‡
a,
Wenshan
Gou‡
a,
Tian
Jiang‡
 b,
Wenjing
Zhao
c,
Kunpeng
Ding
b,
Huanxing
Sheng
a,
Xin
Liu
d,
Qingyu
Xu
b,
Wenjing
Zhao
c,
Kunpeng
Ding
b,
Huanxing
Sheng
a,
Xin
Liu
d,
Qingyu
Xu
 *c and
Qi
Fan
 *a
*a
aSchool of Materials Science and Engineering, Jiulonghu Campus, Southeast University, Nanjing, 211189, People's Republic of China. E-mail: fanqi1984@126.com
bSchool of Chemistry and Chemical Engineering, Jiulonghu Campus, Southeast University, Nanjing, 211189, People's Republic of China
cSchool of Physics, Jiulonghu Campus, Southeast University, Nanjing, 211189, People's Republic of China. E-mail: xuqingyu@seu.edu.cn
dWeihai Institute of Marine Information Science and technology, Shandong Jiaotong University, 1508 Hexing Road, Weihai, 264300, China
First published on 14th February 2023
Abstract
MoS2 in a graphene-like structure that possesses a large interlayer spacing is a promising anode material for sodium ion batteries (SIBs). However, its poor cycling stability and bad rate performance limit its wide application. In this work, we synthesized an N-doped rGO/MoS2 (ISE, interlayer spacing enlarged) composite based on an innovative strategy to serve as an anode material for SIBs. By inserting NH4+ into the interlayer of MoS2, the interlayer spacing of MoS2 was successfully expanded to 0.98 nm. Further use of N plasma treatment achieved the doping of N element. The results show that N-rGO/MoS2(ISE) exhibits a high specific capacity of 542 mA h g−1 after 300 cycles at 200 mA g−1. It is worth mentioning that the capacity retention rate reaches an ultra-large percentage of 97.13%, and the average decline percentage per cycle is close to 0.01%. Moreover, it also presents an excellent rate performance (477, 432, 377, 334 mA h g−1 at 200, 500, 1000, 2000 m A g−1 respectively). This work reveals a unique approach to fabricating promising anode materials and the electrochemical reaction mechanism for SIBs.
New conceptsN-doped rGO/MoS2 (ISE, interlayer spacing enlarged) was synthesized by an innovative one-step hydrothermal method with N plasma treatment to achieve N-doping of the sample. The interlayer spacing of MoS2 was expanded from the initial 0.62 nm to 0.98 nm, and the electrical conductivity was also enhanced. The synthesized N-rGO/MoS2 (ISE) brings excellent electrochemical performance to the battery, particularly a high specific capacity of 540 mA h g−1 (200 mA g−1). After 300 cycles at 200 mA g−1, the capacity retention rate reaches an ultra-large percentage of 97.13%, and the average decline percentage per cycle is close to 0.01%. |
1. Introduction
At present, lithium-ion batteries (LIBs) are the most widely used energy storage devices in our lives; however, the further development of LIBs is restricted by low safety, limitation of lithium resources and high cost. Therefore, in order to meet the demands of the energy storage field, current research focuses on the development of new energy storage devices. Sodium-ion batteries have received increased attention from researchers and are considered to be the most likely to replace lithium-ion batteries in the future due to low cost, suitable redox potential (−2.71 V vs. SHE) and abundant sodium resources. However, the radius of sodium ions (1.02 Å) is larger than that of lithium ions (0.76 Å),1 so it is more difficult for sodium ions to move in the electrode material during the charging and discharging process, and it also causes a huge volume change to the electrode material and the battery capacity decays rapidly, and thus the storage capacity of sodium ions is low. This requires us to develop suitable electrode materials to minimize the volume expansion and ultimately enhance the electrochemical performance of the electrode material.In recent years, layered metal dichalcogenides such as WS2,2 SnSe2,3 VS2,4 MoSe2,5 MoS2,6,7 and SnS/SnS28–10 have attracted tremendous attention due to their large interlayer spacing.11 Metal dihalide compounds are suitable electrode materials for batteries because of their large interlayer spacing, which enables more ions to be stored.12–16 Among them, the two-dimensional (2D) nanomaterial MoS2 with a special S–Mo–S sandwich structure has been widely used as an electrode material for rechargeable batteries.17–19 MoS2 has attracted great attention due to its high theoretical capacity (670 mA h g−1), which is double that of graphite, and it is comparatively cheaper.20,21 As an anode material for sodium ion batteries, the weak van der Waals force between the layers of MoS2 helps the extraction and insertion of sodium ions.22 In addition, the four-electron transfer mechanism enables MoS2 to store more sodium ions. In the charge/discharge process, the deep conversion reaction MoS2 + 4Na+ + 4e− → Mo + 2Na2S occurs, and the MoS2 sodium storage process is a four-electron transfer mechanism.23 Theoretically, MoS2 has a high specific capacity and good rate capability. However, MoS2 is a semiconductor and has poor conductivity. In the process of charging and discharging, the volume change will reduce the activity of the material, resulting in rapid capacity decay and poor cycling performance.24 Moreover, although MoS2 has a larger interlayer spacing than other two-dimensional materials, in order to achieve a more ideal battery performance, the interlayer spacing of 0.62 nm is not large enough. Up to now, many studies have demonstrated that the large interlayer spacing and fewer-layer structure of MoS2 can greatly improve its electrochemical performance.25,26 Hu et al. enlarged the interlayer spacing of MoS2 nanosheets (002) from 0.62 nm to 0.69 nm, resulting in high discharge specific capacity (300 mA h g−1 at 1 A g−1) and excellent rate capability (195 mA h g−1 at 10 A g−1);6 Jia and co-workers synthesized a highly stable MoS2–O nanosphere, realizing the expansion of the interlayer spacing, and the initial specific capacity of the Zn-ion battery at 100 mA g−1 was 206.7 mA h g−1 with 300 cycles.27 The cycling stability of the battery is significantly improved. Therefore, the increase of the MoS2 interlayer spacing is an effective strategy to improve the electrochemical performance of new type secondary batteries. Another widely accepted strategy is to combine MoS2 with conductive and elastic carbonaceous additives, including graphene,28,29 carbon nanofibers17,30 and so on, which can significantly improve the conductivity of MoS2-based materials buffering structural changes during cycling. Zhang et al. grew MoS2 with a large (002) interlayer spacing on carbon nanotubes (CNTs) by a hydrothermal method with excellent electrochemical performance of a high specific capacity of 504.6 mA h g−1 at 50 mA g−1 over 100 cycles and 495.9 mA h g−1 at 200 mA g−1.31
This article mainly focuses on the expansion of the interlayer spacing of MoS2 and the plasma treatment to achieve element doping. GO/MoS2(ISE) was first synthesized by an L-cysteine-assisted hydrothermal process in this work. During this hydrothermal process, NH4+ was successfully intercalated into the interlayer of MoS2. Next, using nitrogen plasma to treat the above samples, the N plasma can be applied to GO to obtain N-doped GO, and the partial reduction of GO can be achieved by N plasma treatment to obtain rGO, and the N doping of MoS2 can also be achieved. Therefore, N plasma treatment can achieve N doping of GO and MoS2 at the same time. And causes the interlayer spacing to expand from the initial 0.62 nm to 0.98 nm, which further facilitates the Na+ transport between layers. In addition, the doped-N and loaded GO in MoS2 enhance the electronic conductivity. The related testing result shows that the electrochemical performance has been significantly improved. The final sample exhibits a high initial capacity and achieved a high specific capacity of 542 mA h g−1 after 300 cycles at 200 mA g−1, the capacity retention rate reaches an ultra-large percentage of 97.13%, and the average decline percentage per cycle is close to 0.01%. It also shows excellent rate performance with a specific capacity of 477, 432, 377, and 334 mA h g−1 at current densities of 200, 500, 1000, and 2000 mA g−1 respectively. When it goes back to 100 mA g−1, the capacity can remain 508 mA h g−1. In addition, the working mechanism of N-rGO/MoS2(ISE) is systematically investigated by ex situ XRD and ex situ XPS.
2. Experimental
2.1 Synthesis of materials
Synthesis of GO/MoS2: graphene oxide was synthesized by the modified Hummers’ method.32 30 mg of synthesized graphene oxide was added to 60 mL of deionized water, and the graphene oxide was completely dispersed in deionized water by ultrasonication for 2 h in an ice bath. Subsequently, 1.7655 g of ammonium molybdate tetrahydrate and 1.5225 g of thiourea were added in sequence, and the mixture was stirred for 0.5 h. After completion, the mixed solution was transferred into a 100 mL reaction kettle and kept at 220 °C for 24 h. A black precipitate was obtained, which was washed three times with deionized water and absolute ethanol, and the precipitate was collected by centrifugation to obtain GO/MoS2 samples.Synthesis of GO/MoS2(ISE) and N-rGO/MoS2(ISE): 30 mg of graphene oxide was taken and added to 22.5 mL of deionized water. Then it was sonicated in an ultrasonic machine for 1 h to make it fully dispersed in deionized water. Next, 300 mg of L-cysteine and 150 mg of Na2MoO4·2H2O were added to the above graphene oxide dispersion, respectively. After stirring uniformly for 0.5 h, 22.5 mL of absolute ethanol was then added, and the resulting solution was poured into a 100 mL Teflon-lined stainless steel autoclave, and keep at 220 °C for 24 h. The resulting black precipitate was collected by suction filtration, washed three times with deionized water and absolute ethanol, respectively, and dried in a vacuum drying oven at 80 °C for 12 h. GO/MoS2(ISE) was obtained. It was then put into a glass tube, nitrogen was passed for a period of time until the glass tube was filled with nitrogen, and it was treated with a plasma device for 40 min. The conditions of the treatment are nitrogen flow 100 mL min−1, the pressure in the glass tube is set to 40 Pa, and the power is set to 120 W. The obtained sample is labeled as N-rGO/MoS2(ISE).
2.2 Material characterization
The crystal structures and phases of the as-synthesized samples were investigated by X-ray diffraction (XRD) scanning at ambient temperature using a Cu Kα radiation source (λ = 1.5406 Å) in the 2θ range of 5 to 80°. The morphology of the samples was analyzed by scanning electron microscopy (SEM, FEI Inspect F50), and the elemental composition of the samples was analyzed by X-ray spectroscopy (EDS). The internal microstructure and structure of the samples were observed by transmission electron microscopy (TEM, JEOL JEM-2100F) at 200 kV, and the change of interlayer spacing was analyzed by high-resolution transmission electron microscopy. Raman spectroscopic analysis was carried out under 532 nm laser light on a confocal Raman microscopy spectrometer (LabRAM HR UV-Visible). Thermogravimetric analysis (TGA) was used to determine the content of MoS2 and graphene in the N-rGO/MoS2(ISE) composites. The thermogravimetric analysis was performed with a thermogravimetric analyzer (TG209 F3) under air atmosphere, the heating rate was 10 °C min−1, and the temperature range was 20–650 °C. The content of MoS2 in N-rGO/MoS2(ISE) is about 61.1% by calculation. X-Ray photoelectron spectroscopy (XPS) was carried out using a Thermo Fisher Scientific k-alpha model spectrometer with Al Kα radiation (hυ = 1486.6 eV). The equipment used to test the nitrogen adsorption and desorption isotherms was a Micrometritics TriStar II 3020M from Micron Instruments, Inc.2.3 Electrochemical measurements
The electrochemical test was carried out with the help of CR2032 coin cells. The active material (GO/MoS2(ISE) or N-rGO/MoS2(ISE)), acetylene black and PVDF were mixed uniformly in a certain ratio (8![[thin space (1/6-em)]](https://www.rsc.org/images/entities/char_2009.gif) :
:![[thin space (1/6-em)]](https://www.rsc.org/images/entities/char_2009.gif) 1
1![[thin space (1/6-em)]](https://www.rsc.org/images/entities/char_2009.gif) :
:![[thin space (1/6-em)]](https://www.rsc.org/images/entities/char_2009.gif) 1, wt%) in N-methyl-2-pyrrolidone (NMP), and blended for 24 h on a magnetic mixer to obtain a slurry. Then, it was evenly coated on copper foil and dried in a vacuum drying oven at 80 °C for 12 h. Then the copper foil was cut with a microtome to obtain a 12 mm round electrode sheet. Then, we assembled a CR2032 coin cell in a glove box with a metallic sodium sheet as the counter electrode and a glass fiber (Whatman) membrane as the separator. The electrolyte consisted of a mixture of 1 M NaClO4 in EC/DMC (1
1, wt%) in N-methyl-2-pyrrolidone (NMP), and blended for 24 h on a magnetic mixer to obtain a slurry. Then, it was evenly coated on copper foil and dried in a vacuum drying oven at 80 °C for 12 h. Then the copper foil was cut with a microtome to obtain a 12 mm round electrode sheet. Then, we assembled a CR2032 coin cell in a glove box with a metallic sodium sheet as the counter electrode and a glass fiber (Whatman) membrane as the separator. The electrolyte consisted of a mixture of 1 M NaClO4 in EC/DMC (1![[thin space (1/6-em)]](https://www.rsc.org/images/entities/char_2009.gif) :
:![[thin space (1/6-em)]](https://www.rsc.org/images/entities/char_2009.gif) 1, V%) with 5% fluoroethylene carbonate (FEC).
1, V%) with 5% fluoroethylene carbonate (FEC).
Charge and discharge experiments were performed at room temperature using the NEWARE battery test system (Wuhan, Wuhan NEWARE Technology Co., LTD) in the voltage range of 3–0.01 V, and different current densities and other electrochemical properties were set. Cyclic voltammetry (CV) was performed at a rate of 0.2 mV s−1 in the voltage range of 0.01–3 V. Electrochemical impedance spectroscopy (EIS) tests were performed on an electrochemical workstation (CHI660E, Shanghai Chenhua) with an alternating voltage amplitude of 5 mV and a frequency range of 0.1 Hz to 100 kHz.
3. Results and discussion
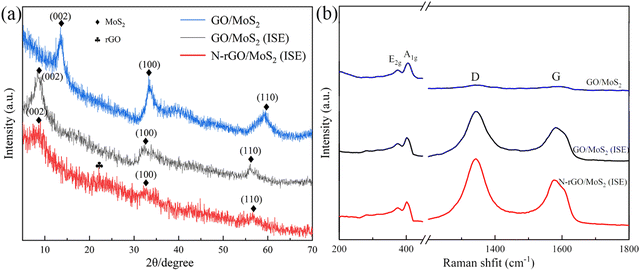
To examine the crystal structure and composition of the prepared samples, XRD measurements were carried out, and the spectra are shown in Fig. 1(a). For GO/MoS2, the observed (002), (100) and (110) characteristic diffraction peaks (2H-MoS2 JCPDS card No. 37-1492) can be found in the GO/MoS2(ISE) and N-rGO/MoS2(ISE) samples. It can be found that the structural characteristics of GO/MoS2(ISE) and N-rGO/MoS2(ISE) share similarities. The differences are since the N plasma treatment influences the structure of MoS2.33 The diffraction peaks corresponding to the (002) crystal surface of GO/MoS2(ISE) and N-rGO/MoS2(ISE) obviously shift to a lower angle (2θ = 8.8°) compared to the original Go/MoS2 (2θ = 13.6°). According to the Bragg's equation, nλ = 2d![[thin space (1/6-em)]](https://www.rsc.org/images/entities/char_2009.gif) sin
sin![[thin space (1/6-em)]](https://www.rsc.org/images/entities/char_2009.gif) θ, where n, λ, d, and θ, respectively, represent a positive integer, the incident X-ray wavelength, the spacing distance, and the diffraction angle. The d corresponding to the first XRD peak represents the layer spacing of MoS2. GO/MoS2 shows the (002) peak at 2θ = 13.6° in the Cu Kα line (λ = 0.15418 nm) as the incident light, corresponding to an interlayer distance of 0.65 nm. XRD patterns of GO/MoS2(ISE) and N-rGO/MoS2(ISE) clearly show the shift of the (002) peak to 8.8°, corresponding to an interlayer distance of 0.98 nm. The increased distance of 0.33 nm matches well with the size of NH4+ with a hydrogen bond diameter of about 0.35 nm.34 Additionally, the peaks of GO/MoS2(ISE) and N-rGO/MoS2(ISE) are weak compared with GO/MoS2. This indicates that MoS2 nanosheets are few-layer structures without restacking.35 Compared with GO/MoS2, the (100) and (110) peaks of GO/MoS2(ISE) and N-rGO/MoS2(ISE) have offset to the left. This indicates that the (100) and (110) peaks in diffraction expanded, which may derive from the defect formation along the basal planes of MoS2. After N plasma treatment, a new peak that is assigned to graphene emerges at about 2θ = 22°, which indicates the destruction of the interlayer structure of GO, and GO is effectively reduced to rGO.36 And the intensity of the peak becomes weak, which demonstrates that N plasma treatment reduces the crystallinity of the samples.
θ, where n, λ, d, and θ, respectively, represent a positive integer, the incident X-ray wavelength, the spacing distance, and the diffraction angle. The d corresponding to the first XRD peak represents the layer spacing of MoS2. GO/MoS2 shows the (002) peak at 2θ = 13.6° in the Cu Kα line (λ = 0.15418 nm) as the incident light, corresponding to an interlayer distance of 0.65 nm. XRD patterns of GO/MoS2(ISE) and N-rGO/MoS2(ISE) clearly show the shift of the (002) peak to 8.8°, corresponding to an interlayer distance of 0.98 nm. The increased distance of 0.33 nm matches well with the size of NH4+ with a hydrogen bond diameter of about 0.35 nm.34 Additionally, the peaks of GO/MoS2(ISE) and N-rGO/MoS2(ISE) are weak compared with GO/MoS2. This indicates that MoS2 nanosheets are few-layer structures without restacking.35 Compared with GO/MoS2, the (100) and (110) peaks of GO/MoS2(ISE) and N-rGO/MoS2(ISE) have offset to the left. This indicates that the (100) and (110) peaks in diffraction expanded, which may derive from the defect formation along the basal planes of MoS2. After N plasma treatment, a new peak that is assigned to graphene emerges at about 2θ = 22°, which indicates the destruction of the interlayer structure of GO, and GO is effectively reduced to rGO.36 And the intensity of the peak becomes weak, which demonstrates that N plasma treatment reduces the crystallinity of the samples.
Fig. 1(b) shows the Raman images of GO/MoS2, GO/MoS2 (ISE) and N-rGO/MoS2 (ISE). In the Raman spectrum, the A1g and E12g peaks represent the out-of-plane vibrational modes and in-plane vibrational modes of 2H-phase molybdenum sulfide, which are characteristic peaks of MoS2.37,38 As shown in the enlarged part of Fig. 1(b), the peaks of A1g and E12g of the sample are located at 400 cm−1 and 374 cm−1, respectively, indicating that the MoS2 in the sample is the structure of 2H phase.39,40 The D peak and G peak are attributed to the vibration of carbon in the sp2 orbital. The G peak corresponds to the E2g phonon vibration in the center of the Brillouin zone. The D peak is a defect peak caused by stretching of carbon at sp2 atoms.41 The two vibrational peaks at 1344 and 1591 cm−1 of the GO/MoS2 sample correspond to the D-band and G-band of graphene. The D and G bands of the GO/MoS2(ISE) and rGO/MoS2(ISE) samples appear at 1344/1344 and 1583/1576 cm−1, respectively. Through observation and calculation, the intensity ratio of the N-rGO/MoS2 (ISE) peaks is the largest (ID/IG = 1.06), followed by GO/MoS2 (ISE) (ID/IG = 1.05), and the ID/IG value (ID/IG = 1.005) of GO/MoS2 is the smallest. ID/IG is the intensity ratio between the D and G peaks, and this ratio can be used to describe the intensity relationship between these two peaks. The D peak represents the defects in the lattice, so the larger this value is, the more defects in graphene. And a previous study42 points out that the atom substitution defects inside and outside the graphene face formed by nitrogen atoms can improve the graphene conductivity.
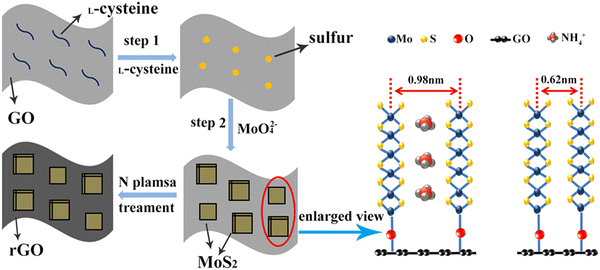
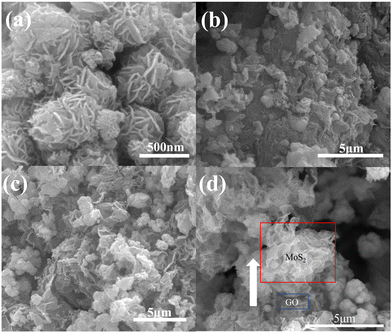
Scheme 1 shows the synthesis flow of GO/MoS2 (ISE) and N-rGO/MoS2 (ISE), and introduces the principle of the expansion of the interlayer spacing. In the hydrothermal process, L-cysteine will decompose in high temperature solution to obtain H2S and NH3,43 in which H2S serves as the source of sulfur for MoS2, and it is also a reducing agent, reducing MoO42− to MoS2, which can also partially reduce GO to rGO.43 NH3 will exist in the form of NH4+ in the solution and will be embedded in the interlayer of MoS2 during the formation of MoS2, consequently increasing the interlayer spacing of MoS2 from the initial 0.62 nm to 0.98 nm; the interlayer spacing increased by 0.36 nm. According to previous reports, the diameter of NH4+ is about 0.35 nm, which also agrees well with these results.34 In this way, MoS2 nanosheets can be grown vertically and closely on GO, and this can be observed in Fig. 2d, and furthermore MoS2 with fewer layers and larger interlayer spacing is obtained. These vertical MoS2 nanosheets with few layers and large interlayer spacing are tightly attached on the GO surface, which is conducive to electron transport and Na+ ion diffusion.
Fig. 2(a–c) depict a general view of the microstructure of GO/MoS2, GO/MoS2(ISE) and N-rGO/MoS2(ISE) observed by SEM, respectively. The SEM image of GO/MoS2 shows a 3D flower-like appearance, which consists of several layers of petals stacked on top of each other. As can be seen from Fig. 2(b and c), GO/MoS2(ISE) and N-rGO/MoS2(ISE) display similar morphology and structure, and the petal-like hybrid nanosheets are partially overlapped or crosslinked to form a three-dimensional structure, and GO/rGO is attached to the MoS2 nanosheets.
According to the low-magnification TEM images (Fig. 3(a and b)), the GO/rGO and MoS2 nanosheets can be identified. The brighter region is GO/rGO, and the dark region represents MoS2. The narrower MoS2 region on GO/rGO, compared to an average size of about 100 nm, indicates that the MoS2 nanosheets grow vertically on the GO sheets. In the TEM image, GO was observed. As shown in Fig. 3(a), the GO and MoS2 are connected tightly. The GO is evenly distributed around the layered structure MoS2. The structures and morphologies of GO/MoS2(ISE) and N-rGO/MoS2(ISE) are similar. The interlayer spacing of the MoS2 (002) plane was 0.68 nm.33 From Fig. 3(c and d), it can be confirmed that MoS2 nanosheets are uniformly grown vertically on GO and rGO, and the measured MoS2(002) interlayer spacing is 0.98 nm, indicating the expansion of the interlayer spacing. Moreover, the number of layers of MoS2 is less than 5 layers, which is less than that of MoS2 studied in the past (usually more than 10 layers).33 This also proves that L-cysteine can inhibit the growth of MoS2 on the (002) surface during the hydrothermal process. The elemental distribution images of GO/MoS2(ISE) and N-rGO/MoS2(ISE) are shown in Fig. S2(c and d) (ESI†), corresponding to Fig. 2(b and c), respectively. It can be seen that MoS2 dominates and the C element is evenly distributed indicating that MoS2 grows uniformly on GO. This structure not only provides a buffer for the volume deformation of MoS2, but also increases the overall electrical conductivity. Furthermore, the content of N element was enhanced after plasma treatment.
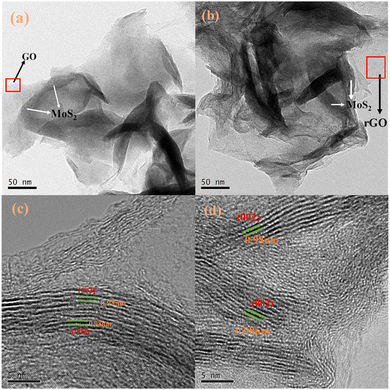 | ||
| Fig. 3 TEM images of (a) GO/MoS2 (ISE) and (b) N-rGO/MoS2 (ISE). HRTEM images of (c) GO/MoS2 (ISE) and (d) N-rGO/MoS2 (ISE). | ||
To study the effect of the enlarged interlayer spacing and plasma treatment on the electrochemical performance of the samples, GO/MoS2, GO/MoS2 (ISE) and N-rGO/MoS2 (ISE) were used to assemble SIBs, respectively. We assembled the coin cell with GO and rGO as the anode material, respectively, and the results are shown in Fig. S4 (ESI†). GO exhibits a capacity of 5 mA h g−1 while rGO exhibits a capacity of 19 mA h g−1. The experimental results show that GO and rGO contribute very little to the capacity. As is shown in the charge–discharge curve in Fig. 4(a), at the current density of 100 mA g−1, the initial discharge specific capacity of GO/MoS2 is 720 mA h g−1, and it drops to 360 mA h g−1 after 51 cycles. This indicates the bad cycling stability of GO/MoS2. Subsequently, we studied the rate performance and cycling stability of GO/MoS2, GO/MoS2 (ISE) and N-rGO/MoS2 (ISE). Fig. 4(b and c) show the charge–discharge curves of the first three cycles at 100 mA g−1 and the others obtained at 200, 500, 1000 and 2000 mA g−1 respectively. From the Fig. 4(b), we can understand that at the current density of 100 mA g−1, the first cycle discharge specific capacity of GO/MoS2(ISE) is 840 mA h g−1, and the charging specific capacity is 500 mA h g−1. The corresponding first cycle discharge/charge specific capacity of N-rGO/MoS2(ISE) is 1100/600 mA h g−1. The discharge specific capacity in the first cycle is significantly higher than that of charge mainly because of the formation of an SEI film, which basically remains the same in the subsequent cycles. In contrast, the specific capacity of N-rGO/MoS2 is higher than that of both GO/MoS2 (ISE) and GO/MoS2 in the first cycle, indicating that the expansion of the interlayer spacing and plasma treatment is beneficial to the improvement of the Na-ion storage capacity of the material. The capacity decays of N-rGO/MoS2 (ISE) and GO/MoS2 (ISE) in the first three cycles are faster than that of GO/MoS2 at the current density of 100 mA g−1. This is because the higher the capacity the material has, the more ions are stored, and the damage to the structure is larger, so the high capacity of the material shows the more obvious capacity decay in the first few cycles, which is a common phenomenon.
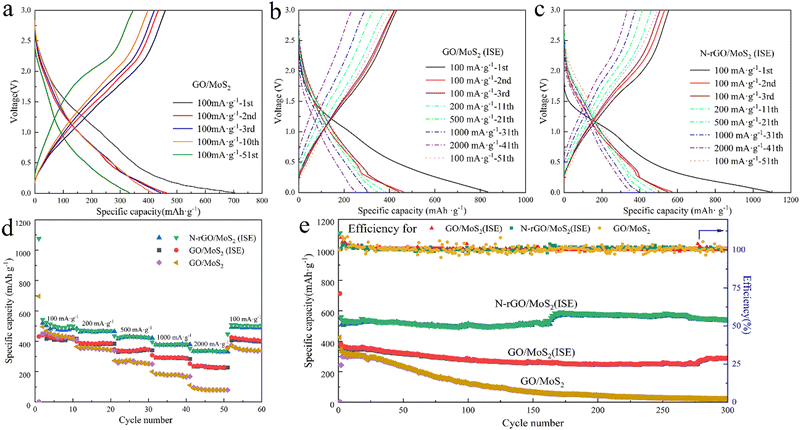 | ||
| Fig. 4 (a–c) are charge/discharge profiles at the different current densities, (d) rate performance, and (e) cycling performance at 200 mA g−1 of GO/MoS2, GO/MoS2 (ISE) and N-rGO/MoS2 (ISE). | ||
From the rate performance in Fig. 4(d), we can conclude that compared with GO/MoS2, both GO/MoS2(ISE) and N-rGO/MoS2(ISE) show brilliant rate performance; when going back from 2000 mA g−1 to 100 mA g−1, the capacity of the battery at 100 mA g−1 barely did not decrease compared with the original. In particular, the N-rGO/MoS2(ISE) exhibits the specific capacity of 477, 432, 377, and 334 mA h g−1 at the current densities of 200, 500, 1000, and 2000 mA g−1 respectively, indicating its high rate capability, which is significantly higher than that of GO/MoS2 and GO/MoS2(ISE) with only 98 and 211 mA h g−1 at 2000 mA g−1.
To test the cycling stability of the samples, the battery was cycled for 300 cycles at a current density of 200 mA g−1, as shown in Fig. 4(e). The N-rGO/MoS2(ISE) shows the best cycling stability with an excellent specific capacity of 540 mA h g−1, which is in distinct contrast with that of the slightly decreased GO/MoS2 (ISE), and the rapidly decreasing GO/MoS2. After 300 cycles, the capacity retention rate of N-rGO/MoS2(ISE) reaches an ultra-large percentage of 97.13%, and the average decline percentage per cycle is close to 0.01%, which benefits from the expanded interlayer spacing remitting the volume change during the charge and discharge processes.
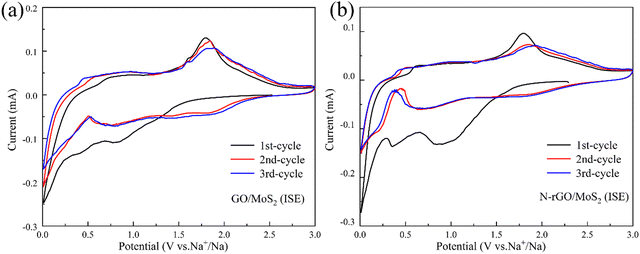
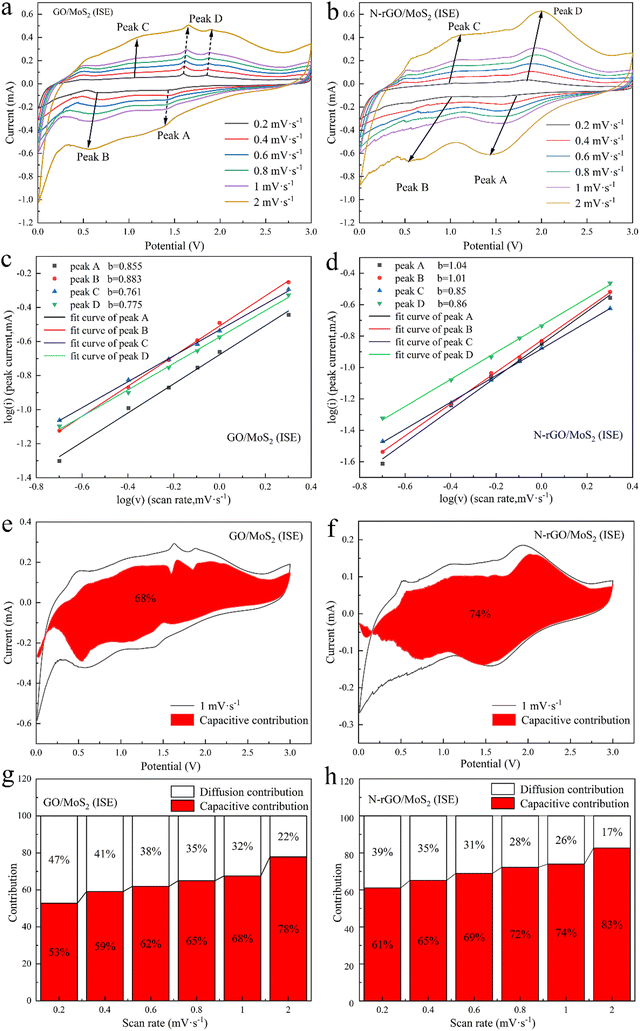
The cyclic voltammetry (CV) experiments are performed at various sweep rates of 0.2 mV s−1 within 0.01–3.00 V, revealing the redox mechanisms and capacitive contributions of GO/MoS2 (ISE) and N-rGO/MoS2 (ISE) (Fig. 5(a and b)). As displayed in Fig. 5(a), during the initial discharge process, the reduction peak at around 0.81 V is due to the intercalation of sodium ions into MoS2 and generates the intermediate NaxMoS2. With the progress of the negative sweep, after ∼0.40 V, the intermediate product NaxMoS2 undergoes new electrochemical decomposition to form Na2S and Mo. Subsequently, the reduction peak around 0.01 V is about the organic electrolyte being irreversibly decomposed to form a solid electrolyte membrane (SEI) and resulting in specific capacity loss. It is similar to the sodium storage principle of MoS2 reported in previous work.6,19,44 During the following charging process, a small oxidation peak appeared at about 0.70 V, which may be due to insufficient de-sodiumization of NaxMoS2. A broad oxidation peak appeared at 1.80 V, corresponding to the conversion reaction from Mo formation to MoS2.6 During the second discharge process, the original two peaks disappeared, and two new peaks appeared at 1.43 V and 0.71 V, which were related to the formation of Na2S and the combination of Na and Mo metal.45Fig. 5(b) shows the CV curves of the first three cycles of N-rGO/MoS2(ISE). The basic redox mechanism of N-rGO/MoS2(ISE) remains unchanged compared to GO/MoS2(ISE). It is worth noting that the peak of N-rGO/MoS2(ISE) at 0.01 V is sharper and stronger than that of GO/MoS2(ISE) in the first cycle. This is mainly due to the good adsorption capacity of oxide graphene for Na+ ions, indicating that N-rGO/MoS2(ISE) has faster Na+ ion diffusion kinetics.46,47 For the subsequent cycling process, the CV curve almost coincides with the second cycle, indicating that the GO/MoS2(ISE) and N-rGO/MoS2(ISE) have better stability during the repetitive sodium ion insertion/extraction process.
In order to further analyze the electrochemical properties, electrochemical impedance spectroscopy (EIS) tests were performed. Fig. 6(a) shows the equivalent circuit diagram of the samples, which includes contact resistance (Rs), charge transfer resistance (Rct) and Warburg impedance (Zw).48 According to the equivalent circuit in Fig. 6, the Rct of GO/MoS2(ISE) and N-rGO/MoS2(ISE) is 583 Ω and 141 Ω respectively. The Rct of GO/MoS2 is much larger than both. It can be concluded that N-rGO/MoS2(ISE) possesses outstanding charge transfer ability. The contact resistances Rs of these three samples are similar, and this is due to the use of the same battery structure and electrolyte. According to the slope σ of the linear fitting line, the ion transport rate of the sample can be identified (σ is the diffusivity of the samples). The σ of N-rGO/MoS2(ISE) and GO/MoS2(ISE) is 286 and 468 Ω s−1, respectively, which contrasted sharply with that of GO-MoS2 (1847 Ω s−1), indicating that the Na+ ion diffusion coefficient of N-rGO/MoS2(ISE) is 1.64/6.46 times higher than that of GO/MoS2(ISE)/GO/MoS2.49 Therefore, the N plasma treatment and the increases in the interlayer spacing in MoS2 by the intercalation of NH4+ can effectively increase the diffusion coefficient of Na+ ions.
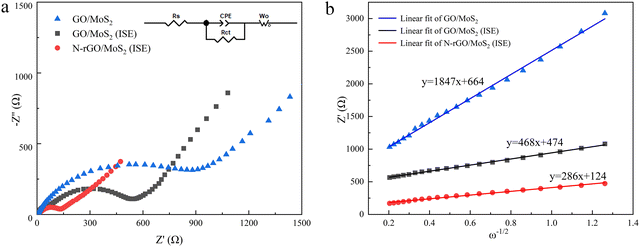 | ||
| Fig. 6 (a) EIS spectra of GO/MoS2 (ISE) and N-rGO/MoS2 (ISE) (inset is equivalent circuit); (b) the linear fits of Z′ and ω−1/2 of GO/MoS2 (ISE) and N-rGO/MoS2 (ISE). | ||
Fig. 7(a and b) show the CV curves of GO/MoS2(ISE) and N-rGO/MoS2(ISE) at different scan rates from 0.2 to 2 mV s−1. According to the equation i = aυb, where i is the peak current at the corresponding scan rate (υ, mV s−1), and a and b are empirical parameters, the degree of capacitive effect can be characterized by the equation log(i) = log(a) + b![[thin space (1/6-em)]](https://www.rsc.org/images/entities/char_2009.gif) log(υ),50 as shown in Fig. 7(c and d). By calculation, the b values of the four peaks corresponding to the N-rGO/MoS2(ISE) are 1.04, 1.01, 0.85 and 0.86, respectively; and the values of GO/MoS2(ISE) are 0.855, 0.883, 0.761, and 0.775, respectively, indicating that N-rGO/MoS2(ISE) has superior capacitive kinetics. According to the formula i(V) = k1υ + k2υ1/2, where k1 and k2 are the determined values, k1υ represents capacitance contribution, and k2υ1/2 represents diffusion contribution,50,51 the percentage of capacitance and diffusion contribution at a certain scan rate can be obtained. This pseudocapacitive contribution originates from the extraction and intercalation of sodium ions between the MoS2 layers. Fig. 7(e and f) show the capacitance contribution of GO/MoS2(ISE) at 1 mV s−1. According to the calculations, the capacitive contributions for scan rates of 0.2, 0.4, 0.6, 0.8, 1.0 and 2.0 mV s−1 are 53%, 59%, 62%, 65%, 68% and 78%, respectively. Fig. 7(g and h) show the capacitance contribution of N-rGO/MoS2(ISE) at 1 mV s−1. According to the calculations, the capacitive contributions for scan rates of 0.2, 0.4, 0.6, 0.8, 1.0 and 2.0 mV s−1 are 61%, 65%, 69%, 72%, 74% and 83%, respectively. The intrinsically fast Na+ transport and notable capacitance contribution of N-rGO/MoS2(ISE) work together to achieve a good electrochemical kinetic. The better electrochemical kinetic properties bring a better rate performance to N-rGO/MoS2(ISE)-based SIBs.
log(υ),50 as shown in Fig. 7(c and d). By calculation, the b values of the four peaks corresponding to the N-rGO/MoS2(ISE) are 1.04, 1.01, 0.85 and 0.86, respectively; and the values of GO/MoS2(ISE) are 0.855, 0.883, 0.761, and 0.775, respectively, indicating that N-rGO/MoS2(ISE) has superior capacitive kinetics. According to the formula i(V) = k1υ + k2υ1/2, where k1 and k2 are the determined values, k1υ represents capacitance contribution, and k2υ1/2 represents diffusion contribution,50,51 the percentage of capacitance and diffusion contribution at a certain scan rate can be obtained. This pseudocapacitive contribution originates from the extraction and intercalation of sodium ions between the MoS2 layers. Fig. 7(e and f) show the capacitance contribution of GO/MoS2(ISE) at 1 mV s−1. According to the calculations, the capacitive contributions for scan rates of 0.2, 0.4, 0.6, 0.8, 1.0 and 2.0 mV s−1 are 53%, 59%, 62%, 65%, 68% and 78%, respectively. Fig. 7(g and h) show the capacitance contribution of N-rGO/MoS2(ISE) at 1 mV s−1. According to the calculations, the capacitive contributions for scan rates of 0.2, 0.4, 0.6, 0.8, 1.0 and 2.0 mV s−1 are 61%, 65%, 69%, 72%, 74% and 83%, respectively. The intrinsically fast Na+ transport and notable capacitance contribution of N-rGO/MoS2(ISE) work together to achieve a good electrochemical kinetic. The better electrochemical kinetic properties bring a better rate performance to N-rGO/MoS2(ISE)-based SIBs.
Based on the above kinetics characterizations and analyses, it can be concluded that compared with the conventional GO/MoS2, the electrochemical performance of GO/MoS2 (ISE) synthesized by L-cysteine assisted hydrothermal synthesis has been significantly improved, both in Na+ storage capacity and cycling stability. The reasons for N-rGO/MoS2(ISE) obtaining such excellent electrochemical performance, mainly are: (1) the insertion of NH4+ makes the interlayer spacing larger, which can benefit the storage of ions, diminishing the resistance of Na+ transport, and reducing the damage to the material structure during the de-intercalation process; (2) the number of synthesized MoS2 layers is small, which can well alleviate the volume expansion during the charge and discharge process; (3) plasma treatment achieved N doping of graphene and MoS2, and reduced GO to rGO, thereby enhancing the electrical conductivity of the composites.
To investigate the storage mechanism of reversible sodium ion de-embedding, we performed ex situ XRD and XPS characterizations. Fig. S6 (ESI†) shows the ex situ XRD of N-rGO/MoS2 (ISE). The characteristic peak of MoS2 shifts to a lower angle during the discharge process; this is because the sodium ions are gradually inserted into the layers of MoS2, resulting in the layer spacing expansion. Along with the extraction of sodium ions in the charging process, the peak gradually returns to the initial state. It can be concluded that the sodium storage mechanism of MoS2 is highly reversible. However, since the XRD diffraction peaks of N-rGO/MoS2 (ISE) powder samples are inherently faint, and less on the electrode, we cannot accurately characterize the changes of diffraction peak positions under different charging and discharging states by ex situ XRD. To better determine this storage mechanism, we perform the ex situ XPS test (Fig. S7, ESI†). Fig, S7(a) (ESI†) shows the ex situ XPS fine spectra of Mo. Three peaks at 228.98 eV, 232.43 eV and 235.93 eV, correspond to Mo 3d5/2, Mo 3d3/2 of Mo+4 and a small amount of Mo+6, respectively. With the discharge process, the characteristic peak binding energy of Mo4+ decreases and increases in the following charge process, which is consistent with the reversible electrochemical reaction. This demonstrated that the insertion/extraction of Na+ in N-rGO/MoS2 (ISE) is accompanied by the valence state change of Mo during the discharge charging process. The binding energy and the percentage of peak area of Mo6+ increase with the electrochemical reaction process corresponding to the lower first-period Coulomb efficiency of N-rGO/MoS2 (ISE), and some of the Mo elements cannot reversibly undergo the valence change. Fig. S7(b) (ESI†) shows the reversible characteristic peak change of S. The binding energy increased during the discharge process, which derives from the elevated valence state of Mo during the discharge process.11 The ex situ XPS spectra of C 1s (Fig. S7(c), ESI†) remain stable during the charging and discharging process, indicating that GO did not participate in the electrochemical reaction.
4. Conclusions
In this study, the composite of MoS2 and GO was synthesized as an SIB anode material by an L-acid-assisted hydrothermal method, and NH4+ was successfully inserted into the interlayer of MoS2 to enlarge the interlayer spacing. Furthermore, through the N plasma treatment, GO was reduced to rGO and N element was doped in at the same time. The final (N-rGO/MoS2(ISE)) exhibited excellent electrochemical performance. In particular, the discharge capacity remains 542 mA h g−1 after 300 cycles at 200 mA g−1. The capacity retention rate reaches an ultra-large percentage of 97.13%, and the average decline percentage per cycle is close to 0.01%. The improvement of the electrochemical performance is due to the fewer layers of the synthesized MoS2 reducing the volume expansion, and the large interlayer spacing storing more ions, and reducing the resistance of ion transport. Meanwhile, doped N improves the conductivity of the composite material. Therefore, the synergistic effect of this work enables the synthesized samples to exhibit excellent electrochemical performance. This well-designed strategy provides a new thought to designing high-performance electrode materials for energy storage batteries in the future.Conflicts of interest
The authors declare no conflict of interest.Acknowledgements
The authors acknowledge financial support from the National Natural Science Foundation of China (51877045), National Key Research and Development Program (2021YFB2400401) and the Fundamental Research Funds for the Central University.References
- C. Wang, Q. Yang, G. Qin, Y. Xiao and J. Duan, Nanoscale, 2020, 12, 10532–10542 RSC.
- D. Su, H. J. Ahn and G. Wang, Chem. Commun., 2014, 45, 3131–3133 Search PubMed.
- J. Choi, J. Jin, I. G. Jung, J. M. Kim, H. J. Kim and S. U. Son, Chem. Commun., 2011, 47, 5241–5243 RSC.
- J. Wang, N. Luo, J. Wu, S. Huang, L. Yu and M. Wei, J. Mater. Chem. A, 2019, 7, 3691–3696 RSC.
- H. Wang, X. Lan, D. Jiang, Y. Zhang, H. Zhong, Z. Zhang and Y. Jiang, J. Power Sources, 2015, 283, 187–194 CrossRef CAS.
- Z. Hu, L. Wang, K. Zhang, J. Wang, F. Cheng, Z. Tao and J. Chen, Angew. Chem., Int. Ed., 2014, 53, 12794–12798 CrossRef CAS PubMed.
- C. Zhu, X. Mu, P. A. Van? Aken, Y. Yu and J. Maier, Angew. Chem., Int. Ed., 2014, 53, 2152–2156 CrossRef CAS PubMed.
- F. Tu, X. Xu, P. Wang, L. Si, X. Zhou and J. Bao, J. Phys. Chem. C, 2017, 121, 3261–3269 CrossRef CAS.
- X. Xiong, C. Yang, G. Wang, Y. Lin, X. Ou, J.-H. Wang, B. Zhao, M. Liu, Z. Lin and K. Huang, Energy Environ. Sci., 2017, 10, 1757–1763 RSC.
- Y. Liu, X.-Y. Yu, Y. Fang, X. Zhu, J. Bao, X. Zhou and X. W. (David) Lou, Joule, 2018, 2, 725–735 CrossRef CAS.
- N. Yabuuchi, K. Kubota, M. Dahbi and S. Komaba, Chem. Rev., 2014, 114, 11636–11682 CrossRef CAS PubMed.
- X. Zhang, W. Weng, H. Gu, Z. Hong, W. Xiao, F. (Ryan) Wang, W. Li and D. Gu, Adv. Mater., 2022, 34, 2104427 CrossRef CAS PubMed.
- S. Sui, H. Xie, M. Liang, B. Chen, C. Liu, E. Liu, B. Chen, L. Ma, J. Sha and N. Zhao, Adv. Funct. Mater., 2022, 32, 2110853 CrossRef CAS.
- J. Cheng, Z. Niu, Z. Zhao, X. Pei, S. Zhang, H. Wang, D. Li and Z. Guo, Adv. Energy Mater., 2022, 2203248 Search PubMed.
- J. Lin, Y.-H. Shi, Y.-F. Li, X.-L. Wu, J.-P. Zhang, H.-M. Xie and H.-Z. Sun, Chem. Eng. J., 2022, 428, 131103 CrossRef CAS.
- J. Sun, Z. Zhang, G. Lian, Y. Li, L. Jing, M. Zhao, D. Cui, Q. Wang, H. Yu and C.-P. Wong, ACS Nano, 2022, 16, 12425–12436 CrossRef CAS PubMed.
- C. Zhu, X. Mu, P. A. van Aken, Y. Yu and J. Maier, Angew. Chem., Int. Ed., 2014, 53, 2152–2156 CrossRef CAS PubMed.
- X. Xie, T. Makaryan, M. Zhao, K. L. Van Aken, Y. Gogotsi and G. Wang, Adv. Energy Mater., 2016, 6, 1502161 CrossRef.
- D. Su, S. Dou and G. Wang, Adv. Energy Mater., 2015, 5, 1401205 CrossRef.
- X. Cao, Y. Shi, W. Shi, X. Rui, Q. Yan, J. Kong and H. Zhang, Small, 2013, 9, 3433–3438 CrossRef CAS PubMed.
- J. Wang, C. Luo, T. Gao, A. Langrock and C. Wang, Small, 2015, 11, 473–481 CrossRef CAS PubMed.
- X. Geng, W. Sun, W. Wu, B. Chen, A. Al-Hilo, M. Benamara, H. Zhu, F. Watanabe, J. Cui and T. P. Chen, Nat. Commun., 2016, 7, 10672 CrossRef CAS PubMed.
- Z. Zhu, Y. Tang, W. R. Leow, H. Xia, Z. Lv, J. Wei, X. Ge, S. Cao, Y. Zhang, W. Zhang, H. Zhang, S. Xi, Y. Du and X. Chen, Angew. Chem., 2019, 131, 3559–3564 CrossRef.
- T. Stephenson, L. Zhi, B. Olsen and D. Mitlin, Energy Environ. Sci., 2013, 7, 209–231 RSC.
- X. Ni, H. Chen, C. Liu, F. Zeng, H. Yu and A. Ju, J. Alloys Compd., 2020, 818, 152835 CrossRef CAS.
- K. D. Rasamani, F. Alimohammadi and Y. Sun, Mater. Today, 2016, 20, 83–91 CrossRef.
- H. Jia, M. Qiu, B. Tawiah, H. Liu and S. Fu, Compos. Commun., 2021, 27, 100841 CrossRef.
- X. Xie, Z. Ao, D. Su, J. Zhang and G. Wang, Adv. Funct. Mater., 2015, 25, 1393–1403 CrossRef CAS.
- S. H. Choi, Y. N. Ko, J.-K. Lee and Y. C. Kang, Adv. Funct. Mater., 2015, 25, 1780–1788 CrossRef CAS.
- C. Chen, G. Li, Y. Lu, J. Zhu, M. Jiang, Y. Hu, L. Cao and X. Zhang, Electrochim. Acta, 2016, 222, 1751–1760 CrossRef CAS.
- S. Zhang, X. Yu, H. Yu, Y. Chen, P. Gao, C. Li and C. Zhu, ACS Appl. Mater. Interfaces, 2014, 6, 21880–21885 CrossRef CAS PubMed.
- S. Qin, X. Guo, Y. Cao, Z. Ni and Q. Xu, Carbon, 2014, 78, 559–565 CrossRef CAS.
- A. Jj, D. B. Kai, A. Yw, C. Ps, A. Hz, A. Pt, F. D. Qi, T. B. He, L. A. Qi and E. Qxa, Mater. Chem. Phys., 2020, 240, 122169 CrossRef.
- A. A. Jeffery, C. Nethravathi and M. Rajamathi, J. Phys. Chem. C, 2014, 118, 1386–1396 CrossRef.
- S. Ding, J. S. Chen and X. W. D. Lou, Chem. – Eur. J., 2011, 17, 13142–13145 CrossRef CAS PubMed.
- S. Chen, C. Peng, M. Wu, D. Pan and Y. Wang, Electrochem. Commun., 2010, 12, 1302–1306 CrossRef CAS.
- H. Wang, Z. Lu, S. Xu, D. Kong, J. J. Cha, G. Zheng, P.-C. Hsu, K. Yan, D. Bradshaw, F. B. Prinz and Y. Cui, Proc. Natl. Acad. Sci. U. S. A., 2013, 110, 19701–19706 CrossRef CAS PubMed.
- K. Gołasa, M. Grzeszczyk, R. Bożek, P. Leszczyński, A. Wysmołek, M. Potemski and A. Babiński, Solid State Commun., 2014, 197, 53–56 CrossRef.
- Y. Liu, R. Ghosh, D. Wu, A. Ismach, R. Ruoff and K. Lai, Nano Lett., 2014, 14, 4682–4686 CrossRef CAS PubMed.
- X. Wang, H. Feng, Y. Wu and L. Jiao, J. Am. Chem. Soc., 2013, 135, 5304–5307 CrossRef CAS PubMed.
- M. Sevilla and A. B. Fuertes, ACS Nano, 2014, 8, 5069–5078 CrossRef CAS PubMed.
- C. Bie, H. Yu, B. Cheng, W. Ho, J. Fan and J. Yu, Adv. Mater., 2021, 33, 2003521 CrossRef CAS PubMed.
- K. Chang and W. Chen, ACS Nano, 2011, 5, 4720–4728 CrossRef CAS PubMed.
- X. Shan, S. Zhang, N. Zhang, Y. Chen, H. Gao and X. Zhang, J. Colloid Interface Sci., 2018, 510, 327–333 CrossRef CAS PubMed.
- J.-W. Jung, W.-H. Ryu, S. Yu, C. Kim, S.-H. Cho and I.-D. Kim, ACS Appl. Mater. Interfaces, 2016, 8, 26758–26768 CrossRef CAS PubMed.
- Y. Liu, Y. Zhao, L. Jiao and J. Chen, J. Mater. Chem. A, 2014, 2, 13109–13115 RSC.
- Y. Tang, D. Wu, Y. Mai, H. Pan, J. Cao, C. Yang, F. Zhang and X. Feng, Nanoscale, 2014, 6, 14679–14685 RSC.
- P. Sun, X. Zhao, R. Chen, C. Tao and J. Liu, Nanoscale, 2016, 8, 7408–7415 RSC.
- B. Chen, H. Lu, J. Zhou, C. Ye, C. Shi, N. Zhao and S.-Z. Qiao, Adv. Energy Mater., 2018, 8, 1702909 CrossRef.
- J. B. Cook, H. Kim, T. C. Lin, C. Lai, B. Dunn and S. H. Tolbert, Adv. Energy Mater., 2017, 7, 1601283 CrossRef.
- F. Xie, L. Zhang, D. Su, M. Jaroniec and S. Qiao, Adv. Mater., 2017, 29, 1700989 CrossRef PubMed.
Footnotes |
| † Electronic supplementary information (ESI) available. See DOI: https://doi.org/10.1039/d2nh00488g |
| ‡ The authors contributed equally to this work. |
| This journal is © The Royal Society of Chemistry 2023 |

