
 Open Access Article
 This Open Access Article is licensed under a Creative Commons Attribution-Non Commercial 3.0 Unported Licence
Comprehensive advances in the synthesis, fluorescence mechanism and multifunctional applications of red-emitting carbon nanomaterials
Tuhin
Mandal
 ab,
Shiv Rag
Mishra
ab and
Vikram
Singh
*ab
ab,
Shiv Rag
Mishra
ab and
Vikram
Singh
*ab
aEnvironment Emission and CRM Section, CSIR-Central Institute of Mining and Fuel Research Dhanbad, Jharkhand 828108, India. E-mail: vikku.010@gmail.com; vikramsingh@cimfr.nic.in
bAcademy of Scientific and Innovative Research (AcSIR), Ghaziabad, 201 002, India
First published on 12th September 2023
Abstract
Red emitting fluorescent carbon nanomaterials have drawn significant scientific interest in recent years due to their high quantum yield, water-dispersibility, photostability, biocompatibility, ease of surface functionalization, low cost and eco-friendliness. The red emissive characteristics of fluorescent carbon nanomaterials generally depend on the carbon source, reaction time, synthetic approach/methodology, surface functional groups, average size, and other reaction environments, which directly or indirectly help to achieve red emission. The importance of several factors to achieve red fluorescent carbon nanomaterials is highlighted in this review. Numerous plausible theories have been explained in detail to understand the origin of red fluorescence and tunable emission in these carbon-based nanostructures. The above advantages and fluorescence in the red region make them a potential candidate for multifunctional applications in various current fields. Therefore, this review focused on the recent advances in the synthesis approach, mechanism of fluorescence, and electronic and optical properties of red-emitting fluorescent carbon nanomaterials. This review also explains the several innovative applications of red-emitting fluorescent carbon nanomaterials such as biomedicine, light-emitting devices, sensing, photocatalysis, energy, anticounterfeiting, fluorescent silk, artificial photosynthesis, etc. It is hoped that by choosing appropriate methods, the present review can inspire and guide future research on the design of red emissive fluorescent carbon nanomaterials for potential advancements in multifunctional applications.
 Tuhin Mandal | Mr Tuhin Mandal received his BSc and MSc degrees in chemistry from Guru Ghasidas Vishwavidyalaya, Bilaspur, India in the year 2016 and 2018 respectively. He also completed his Bachelor of Education degree from Burdwan University in 2020. Currently, he is working as a research scholar under the guidance of Dr Vikram Singh at the Environment Emission and CRM section in the CSIR-Central Institute of Mining and Fuel Research, Dhanbad. His research mainly includes the ‘Synthesis of fluorescent carbon nanomaterials from coal and its derivatives’. |
 Shiv Rag Mishra | Mr Shiv Rag Mishra completed his BSc (2003) and MSc (2005) in chemistry at Bundelkhand University, Jhansi, India. He also qualified for the UGC-CSIR NET examination in Chemical Science (2010). He is a regular employee (Assistant Professor) of D. V. P. G College, Orai, UP, India and for his doctoral study, he joined the Environment Emission and CRM section, CSIR-Central Institute of Mining and Fuel Research Dhanbad as a research scholar under the supervision of Dr Vikram Singh in Aug 2022. His research interest focuses on the ‘Development of fluorescent carbon nanomaterials for white-light-emitting devices’. |
 Vikram Singh | Dr Vikram Singh received his PhD degree in Chemistry from the Indian Institute of Technology Madras in Jul 2016. After completing his doctoral research, he worked as a National-PDF (SERB) and Institute-PDF at CSIR-CDRI Lucknow (2016–2018) and IIT Kanpur (2018–2021) respectively. He has been awarded various prestigious awards such as the ‘Langmuir Best PhD Thesis Award in Physical & Theoretical Chemistry’ at IIT Madras, ‘Gandhian Young Technological Innovation Award’ at Rashtrapati Bhawan New Delhi, etc. He has published more than 20 scientific articles in leading peer-reviewed journals and patents. Currently, he is working as a Scientist in the Environment Emission and CRM section, CSIR-Central Institute of Mining and Fuel Research Dhanbad. His research group focuses on the development of fluorescent carbon nanomaterials using green and cost-effective processes for biomedical, energy and environmental applications. |
1. Introduction
Fluorescent carbon nanomaterials (FCNMs) are a predominant star of the new era among fluorescent nanomaterials, which griped a lot of scientific attention for the promising area of research over the past few decades. The FCNMs have a lot of advantages such as biocompatibility, cost-effectiveness and environmental friendliness over the conventional semiconductor nanocrystals, organic dyes and rare earth-based fluorescent materials. These advantageous properties make them potential candidates for biomedical applications such as medication administration, biosensing, optical imaging, and cell labeling. Apart from biomedical applications, FCNMs are also widely used in various technologies such as light-induced catalytic water splitting, optoelectronics, photocatalysis, sensing, anti-counterfeiting, etc.1–8 Numerous types of FCNMs have been developed so far. However, the majority of them only exhibit an intense blue-to-green fluorescence short emissive spectrum when excited by ultraviolet light. The majority of carbon nanomaterials (CNMs) show bright fluorescence in the blue-green region, whereas they show comparatively poor quantum yields in the red region under ultra-violet light exposure. The application of blue emitting CNMs has various disadvantage in biomedical applications and in the fabrication of white light emitting devices such as the interference of autofluorescence of the biological matrix and retinal damage by blue dominating light-emitting diode (LED) chips, respectively. As a result, such disadvantages limit their potential uses, notably in the realms of biomedical and other potential applications in various fields.1,9–16Recently, red-emitting CNMs have gained a lot of attention from the scientific community because of their deep tissue penetration, minimum autofluorescence, large Stokes shift, low photon scattering and long fluorescence lifetime. The red emitting CNMs are very essential materials for developing warm white light-emitting diodes (WLEDs) with a high colour rendering index (CRI > 80) and low correlated colour temperature (CCT 4000 K), which prevent eye tiredness and eye toxicity. These advantages are successfully applied in a variety of fields for the sustainable development of society and help to overcome the drawbacks of short wavelength emissive FCNMs.17–26
The synthesis of red/infrared emitting CNMs with high quantum yields is crucial and the origin of their fluorescence is still a matter of debate. The fluorescence originates in CNMs may be due to the presence of sp2-conjugation units, surface defects, quantum confinement, crosslinked enhance emission and the presence of heteroatom containing functional groups. The tunability in the fluorescence emission of CNMs also depends on the type of precursor, reaction conditions, solvents, purification and post-treatment. The size of isolated sp2 domains, hydrophilicity, the level of oxidation, surface charges, surface functional groups and heteroatom doping are also regarded as important factors for shifting the emission in the red region.
In this review, we have compiled a comprehensive overview of existing and emerging research techniques, choice of carbon-rich precursors, fluorescence mechanisms and factors affecting the optical properties to achieve red emission. Furthermore, we have explored the applications of red emitting CNMs in various fields such as biomedicine, optoelectronics, photocatalysis, chemical sensing, solar technology, anticounterfeiting, fluorescent silk, artificial photosynthesis, fluorescent nanothermometers, etc.
2. Synthesis of red-emitting FCNMs
Red emissive fluorescent carbon nanomaterials can be achieved using surface and conjugation chemistry. The optical properties of FCNMs depend on the presence of auxochromes at the surface and the type of conjugation present in the carbon core. Increasing the number of sp2 hybridized carbon atoms, oxide surface content, nitrogen and sulfur heteroatoms results in the shifting of wavelengths towards the longer wavelength region. It is very crucial to choose cost-effective and environmentally friendly carbon precursors, solvents and methods for the synthesis of red emitting CNMs by employing two classified processes: top-down and bottom-up (Fig. 1).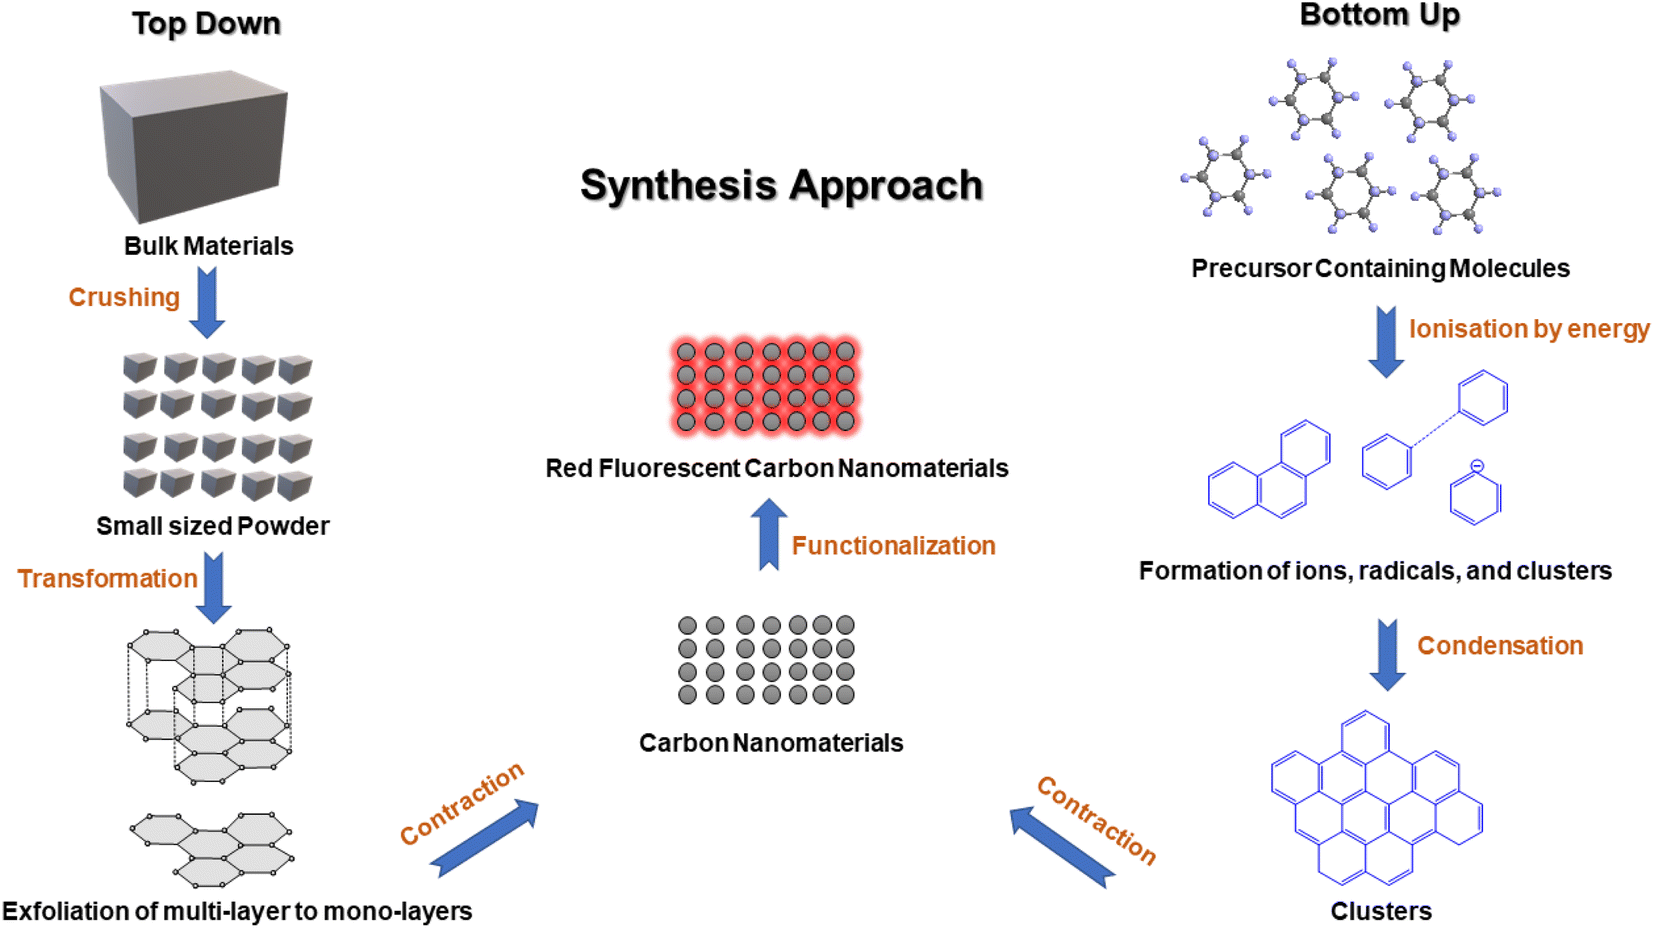 | ||
| Fig. 1 Schematic representation of the synthesis approach. | ||
2.1. Crucial aspects for the synthesis of red-emitting FCNMs
Various factors such as carbon precursors, methodology (reaction conditions), surface functionalization, and purifying FCNM blend influence the emission properties of FCNMs. Therefore, researchers are making significant attempts to synthesize extremely effective FCNMs that can emit in the longer wavelength region.2.1.1.1. Large organic materials. Organic materials made of bulk carbon are typically non-luminescent because the band gap transitions either did not occur or occurred outside the UV-visible region. Only the organic compounds with nanoscale carbon can emit fluorescence as the band gap transition occurs in the UV-visible region.27–29 As technology advances, specific larger organic materials, including coal, graphene oxide, graphite, carbon fibers, tyre soot, and carbon nanotubes, have been employed as a precursor through a top-down and a bottom-up process.30–32 The prepared FCNMs showed a broad emission profile, excitation dependent emission and solvent concentration-dependent properties.33,34 The tunable emission suggests that the fluorescence is originated from the defect state emission and the excitation-dependent emission from the sp2 clusters in carbon cores.35–37 The FCNMs with abundant oxygen, nitrogen and sulfur-related functional groups showed broad excitation-dependent emission spectra with moderate quantum yields and nanosecond fluorescent lifetimes.38,39 Song et al. developed humic acid mixed coal-derived multicolor carbon dots by using solvothermal treatment in dimethyl formamide for utilization as a cold white light emission material.40 Hu et al. reported a red colour fluorescent center via embedding phosphorus on the surface of carbon dots, which were developed from coal using diammonium phosphate. The synthesized carbon dots were used as a ratiometric fluorescent probe for the determination of the pH of metal-complex systems.41 Tripathi et al. synthesized green to red and near infrared multicolour emissive carbon dots from diesel-based pollutant carbon soot through a reflux reaction in the presence of concentrated nitric acid for 10 hours. The as-prepared carbon dots had been used for the imaging of Escherichia coli and the sensing of cholesterol.42 Meng et al. reported red to blue multicolour fluorescent carbon dots from coal tar pitch using a mixture of formic acid and hydrogen peroxide. The as-synthesized red carbon dots showed a shift of their emission wavelength to the blue region with increasing the degree of the reduction process.43 Ko et al. demonstrated oxidative treatment of tire carbon soot using nitric acid to develop infrared emissive carbon dots. The carbon dots showed excitation dependent fluorescent emission with the excitation range of 430 nm to 710 nm and were used as a fluorescent probe for the bioimaging of cancer bearing cells.44 Tan et al. produced red-emitting fluorescent carbon dots via an electrochemical reaction of graphite in potassium persulfate solution. The red emission was attributed to the lower energy gap, caused by the larger sp2 domain. The carbon dots were applied for the bioimaging of HeLa cells.45 Tunable red carbon dots were prepared via an oxidative reaction of carbon fibers in nitric acid followed by ultrafiltration. The tunability in the emission wavelength was caused by the surface state electronic transitions and the size of the carbon dots.46 Ke et al. reported a one-pot synthesis method of red emissive graphene quantum dots from graphene oxide via a hydroxyl radical and heteroatom doping technique, using ammonium hydroxide and thiourea-mediated dissociation of hydrogen peroxide.47
2.1.1.2. Small organic materials. Small organic molecules are amorphous or crystalline and made of a lot of polar functional groups and often employ bottom-up techniques, mainly solvothermal and hydrothermal for the preparation of FCNMs.48–51 Amino acids, citric acids, naphthalene, saccharides, phenylenediamines, polythiophene, etc., are the most frequently employed small organic materials to synthesize far-red or near IR emissive CNMs.52,53 Citric acid has a carboxylic functional group, which rapidly reacts with nitrogen containing amino groups to form fused α, β or α, γ bi-amines. This alkylation reaction results as the increasing of carbonization degree with nitrogen content, continuing the formation of –C
![[double bond, length as m-dash]](https://www.rsc.org/images/entities/char_e001.gif) C–, –CN–, –CO–, and –C–NH– bonds to produce 2-pyridone fused large organic rings, followed by the reduction of the band gap between the HOMO and LUMO. This outcome brings about a noticeable red shift in emission spectra as a contribution of multiple emission centers and the different types of bonds. Hence, the blend of citric acid and polyamines can be used as a precursor to synthesize an N-doped sp2 core, responsible for far red or near IR FCNMs.25,54–60
C–, –CN–, –CO–, and –C–NH– bonds to produce 2-pyridone fused large organic rings, followed by the reduction of the band gap between the HOMO and LUMO. This outcome brings about a noticeable red shift in emission spectra as a contribution of multiple emission centers and the different types of bonds. Hence, the blend of citric acid and polyamines can be used as a precursor to synthesize an N-doped sp2 core, responsible for far red or near IR FCNMs.25,54–60
Similarly, amino acids contain both amino and carboxylic acid groups and are used as suitable precursors for the synthesis of far red or near IR FCNMs. Several derivatives of amino acids contain nitrogen and sulfur heteroatoms, enrich the electronic states and facilitate the generation of in-gap states that could act as non-radiative and recombination centers. As a result, it showed a strong bathochromic shift in emissions.61–63
Aromatic precursors having multiple rings (two or more) or –R–NH–, –OH, and –R–S–H polar functional groups as substituents are also important for the development of red emissive CNMs. Poly-benzene ring containing aromatic precursors have produced a large number of conjugated sp2 domains in their core by dehydration and carbonization mechanisms. The conjugated sp2 core reduced the energy level between the HOMO and LUMO, which shifts the excitation and emission wavelength towards the red region.64–68 Aromatic precursors consisting of aromatic amines, phenols and polythiophene derivatives are dominating precursors for red emissive CNMs, since there are many options and definable chemical structures. The presence of a stiff π-conjugated skeletal structure with the passivation of the –R–NH–, –OH, and –R–S–H functional groups on the surface plays a vital role in the induced charge transfer excited state in the π-conjugated systems of FCNMs with the formation of π-type and n-type carriers. As a result, it contributes to narrowing the optical band gap of FCNMs, followed by the emission in the far red or near IR region with high fluorescence quantum yield.69–74
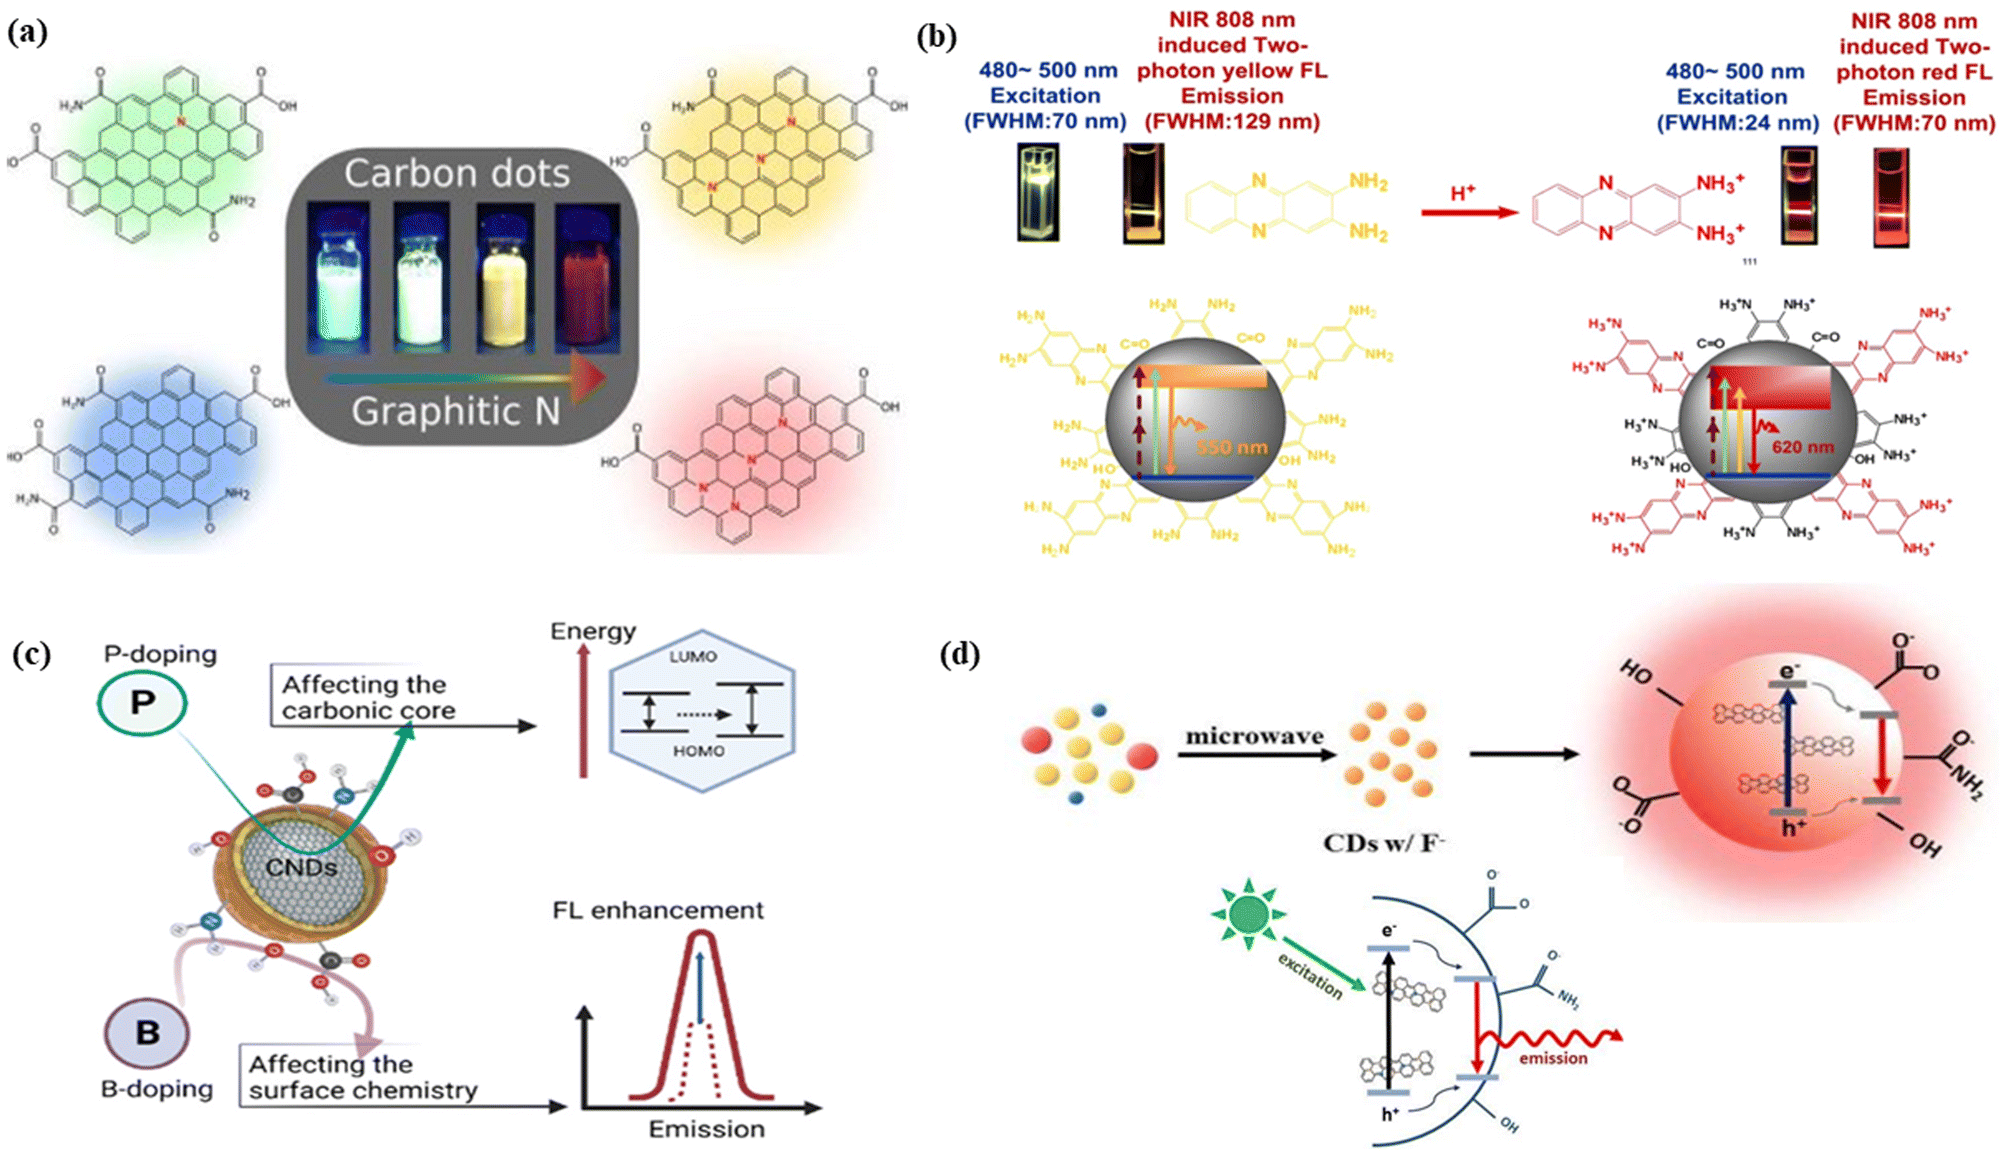
Other atoms like selenium, boron, and fluorine are also utilized for shifting the wavelength to the red region after doping at edges on the surface of the organic precursor. The band gap is opened by the incorporation of these heavy atoms into the carbon core. It also weakens the nonradiative recombination through the increase of surface defects. The fluorine has the highest effect among heavy atoms due to the electron-withdrawing capacity of fluorine, decreases the energy gap between the HOMO and LUMO, and leads to the shifting of excitation and emission wavelengths towards the red region.75–80 Li et al. developed tetraphenyl porphyrin-derived red-emitting carbon dots via a simple solvothermal method using a sulfonation reaction with sulfuric acid. The developed carbon dots were utilized for the bioimaging of HeLa cells.81 Shao reported highly water-dispersible red fluorescent carbon dots from glutathione as a precursor using a solvothermal method. The carbon dots showed intense near infrared emission with a very narrow emission band and were utilized for the sensing of carcinoembryonic antigens in pleural effusion.82 Zhao et al. synthesized near-infrared emissive carbon dots with a large conjugated sp2 core. The charge transfer properties between the electron donor and acceptor lead to the longer wavelength absorption of the carbon dots. The as-synthesized carbon dots were used for photothermal therapy and multiphoton therapy.83 Ji et al. synthesized microwave-assisted near infrared carbon dots from o-phenylenediamine through a hydrothermal method. The developed carbon dots showed a red-shift via protonation, while deprotonation resulted in a three times higher quantum yield, and were demonstrated as a red phosphor.84 Geng et al. produced tunable green to red emissive fluorescent carbon dots from citric acid and m-aminophenol via a microwave irradiation method. The carbon dots exhibited excellent competence of biocompatibility properties and were utilized for bioimaging.85 Wei et al. developed blue, green, yellow, and orange multicolour emitting carbon dots from a mixture of glucose and amino acid via a microwave-assisted Maillard reaction. The multicolour emission of the carbon dots originated from the carbon cores and the surface defect states. The teams reported that the emission of the carbon dots could be controlled by modifying the precursors. They also showed that the carbon dots were also applied for multicolour display and cell imaging.86 Li et al. reported p-phenylenediamine and hydroquinone derived red fluorescent carbon dots via a mild solvothermal treatment by merely changing the relative ratios of the precursors, which were used for the detection of Fe3+ and pyrophosphate.87 Wang et al. produced red fluorescent carbon dots via a surface modification with polyetherimide through a microwave heating technique. This synthesis technique promotes the surface charges from negative to positive and shielding the red colour emission from being quenched by water. These characteristics encourage bioimaging and cell absorbtion.88 Niu et al. produced phloroglucinol and boric acid derived excitation dependent boron doped red carbon dot powder. The red carbon dots exhibited solid state fluorescence and showed intense red fluorescence under UV light excitation and were utilized for fingerprint detection.89
2.1.1.3. Renewable organic materials. An organic material that can be recycled from both plants and animals is called biomass. So, it is a renewable organic material.90–92 Cellulose is the most plentiful organic compound present in this world and the main component of biomass. It is a complex carbohydrate composed of chiral carbon, oxygen and hydrogen.93–96 Biomass is one of the most commonly used carbon precursors for the development of red-emitting CNMs using solvothermal and hydrothermal methods. The optical properties of biomass-derived red emissive CNMs depend on the excitation and the functional groups of the solvent used. The addition of sulfinyl and carbonyl functional groups on the surface leads to the rising of discrete energy levels due to the gaining of oxygen atoms and losing of electrons on the surface. These processes boost the absorption in the red region or near the IR region and increase the red fluorescence.97–104 Zhang et al. fabricated Arabidopsis thaliana-derived nitrogen and sulfur co-doped multicolour carbon dots through a Maillard reaction using sulfuric acid. The developed red carbon dots exhibited excellent biocompatibility, fluorescence properties, and solubility. The team used the carbon dots for the labeling and imaging of a plant.105 Liang et al. developed rose red emissive fluorescent carbon dots from wedelia trilobata biomass via microwave-assisted solvothermal treatment using ethanol and water solution. The red carbon dots were used for the detection of glutathione and the imaging of cells.106 Tang et al. synthesized red emissive carbon dots from black pepper through a solvothermal method. The red carbon dots showed strong biocompatibility, selectivity, sensitivity and low toxicity. These properties of the as-synthesized carbon dots were utilized for the sensing and imaging of ascorbic acid in living cells.107 Zhang et al. synthesized red fluorescent carbon dots from herbaceous Andrographis paniculata via solvothermal synthesis using ethanol. The carbon dots were used as a smartphone integrated green optosensor.108 Wang et al. derived blue-to-red emissive fluorescent carbon dots using solvothermal methods from spinach. The modification of the boiling point and polarity of solvents causes the red-shifted emission. The team used the as-synthesized carbon dots for the anticounterfeiting and the sensing of Cr6+.109 Tariq et al. reported microwave-assisted fig biomass extracted red emissive carbon dots, which exhibited excellent antibacterial properties and were used as a antibacterial agent for the diagnosis of bacterial infection.110 Yang et al. developed glutathione-supported waste tobacco leaf-derived red emissive fluorescent carbon dots via a simple hydrothermal method. The red carbon dots exhibited large stoke shift with the advantages of selective and sensitive detection of analytes.111 Zhang fabricated red, green and blue emissive fluorescent carbon dots using a solvothermal method from waste leather scrap. The size of the carbon atoms and the functional group cause the addition of a new energy level for electronic transition, leading to red fluorescence emission.112
Thus, these demonstrated aspects including choosing organic precursors, reaction conditions and purifying the FCNM blend with post-modification techniques are so vital to focus for the development of red-emitting CNMs (Table 1).
| CNMs | Carbon precursor | Synthetic route | λ exc/λemi (nm) | Application | Reference |
|---|---|---|---|---|---|
| CDs | Carbon fibres | Acid oxidation | 360/610 | Bioimaging | Bao et al.46 |
| CDs | Waste expanded polystyrene | Solvothermal | 365/630 | White light-emitting diodes | Song et al.180 |
| CDs | Sugarcane bagasse | Carbonization | 372/630 | Ammonia sensing | Jiang et al.181 |
| CDs | Spinach | Solvothermal | 620/680 | Bioimaging | Li et al.182 |
| CDs | Lemon juice | Solvothermal | 610/704 | Bioimaging | Ding et al.183 |
| CDs | Watermelon juice | Hydrothermal | 808/925 | Imaging and photothermal therapy | Li et al.184 |
| CPDs | Taxus leaves | Solvothermal | 420/673 | One and two photon bioimaging | Liu et al.185 |
| GQDs | Graphite rods | Electrochemical exfoliation | 500/610 | Cellular imaging | Tan et al.45 |
| GQDs | Graphene oxide | Chemical degradation | 420/630 | Bioimaging | Ke et al.47 |
| CDs | Coal pitch | Acid oxidation | 365/630 | — | Meng et al.43 |
| CDs | Citric acid | Solvothermal | 561/627 | In vitro and in vivo bioimaging | Ding et al.9 |
| CDs | Bougainvillea leaves | Microwave charring | 420/678 | Photodegradation of dye | Bhati et al.186 |
| CDs | Cyanine dye | Solvothermal | 720/820 | Cancer imaging & therapy | Zheng et al.187 |
| CDs | Resorcinol | Carbonization | 490/600 | — | Ghosh et al.188 |
| GQDs | Graphene nano-particles | Mechanical exfoliation & oxidation | 380/650 | Optoelectronic device | Tetsuka et al.171 |
| CDs | Glutathione | Microwave-mediated heating | 420/683 | Bioimaging | Pan et al.189 |
| GQDs | Trinitro pyrene & boric acid | Ultra-sonication | 380/617 | — | Juang et al.190 |
| CDs | Malic acid & neutral red | Hydrothermal | 400/627 | Per-manganate & pH sensing | Dan Chang et al.191 |
| CQDs | p-Phenylene-diamine & urea | Solvothermal | 286/614 | — | Song et al.192 |
| CNPs | Eucalyptus leaves | Hydrothermal | 620/680 | Theranostics | Damera et al.193 |
| CDs | p-Phenylene-diamine & hydro-quinone | Solvothermal | 455/590 | Fe3+ & pyro-phosphate detection | Li et al.87 |
| CDs | Citric acid & urea | Solvothermal | 520/614 | Light-emitting diodes | Qu et al.194 |
| CDs | Diaminobenzene-sulfonic acid & amino-phenyl-boronic acid hydro-chloride | Hydrothermal | 520/595 | Dual-mode sensing of ClO−/GSH | Li et al.195 |
| CDs | Diamino-benzoic acid & catechol | Solvothermal | 545/619 | Detection of peroxynitrite in living cells | Fu et al.196 |
| CDs | Citric acid & bi-naphthyl diamine | Solvothermal | 540/603 | Solid state luminescence & sensing of Fe3+ and F− | Wang et al.197 |
| CDs | 4-Chloro-benzene-1,2-diamine & diluted HCl with deionized water | Sonication assisted solvothermal | 540/650 | Detection of tea polyphenols & cellular imaging | Cao et al.198 |
| CDs | Neutral red & thiourea | Hydrothermal | 520/637 | Detection and reduction of Au3+ | Li et al.199 |
| CNDs | Perilla leaves | Ultrasonication | 420/670 | Bacterial imaging | Zhao et al.200 |
| CDs | Citric acid & p-phenylene-diamine | Hydrothermal | 360/650 | Mitochondria-targetable imaging and monitoring of biological processes in living cells | Jin et al.201 |
| CDs | 3-Dimethyl-amino-phenol | Solvothermal | 540/632 | Detecting and tracking lipid droplets in live cells | Jing et al.202 |
3. Fluorescence mechanisms of red-emitting FCNMs
The fluorescence mechanism is so important to explore the red region and near IR region very widely. Recognizing the fluorescence mechanism is essential for obtaining FCNMs with the desired optical properties. However, it is still challenging to understand the precise fluorescence process of red FCNMs. Numerous plausible theories have been put out to increase the understanding of red fluorescence origins.3.1. Quantum confinement effect
The significant characteristics of FCNMs are responsible for the featured optical properties. Bandgap transition is one of the most fundamental methods, engineered in the conjugated π-domain for achieving the quantum confinement effect.203–205 The quantum confinement effect occurs when FCNMs have a smaller size than the exciton Bohr radius.206,207 The phase “quantum confinement” means the energy of confined electrons. When the potential dimension comes close to the de Broglie wavelength of the electron, the confined electron wavefunction of nanomaterials emerged as a discrete set of energy levels. The changes are named “quantum confinement”. It has an impact on material behavior in terms of electrical, optical, and mechanical properties of nanomaterials.208–211 When nanomaterials are compressed to sizes and shapes of 100–10 nm or even smaller, the quantum confinement phenomenon takes place. These modifications are brought about by a distinct set of electron energies and lead to size confinement. Solid-state physics states that the energy band gap is split into the valence band and conduction band. The absorption of photons or the thermal excitation supplies adequate energy to the valence band electrons to surpass the energy gap and transit to the conduction band. As a result, holes act as a positive charge and are created at that place of the surpass electrons. The hole might be filled by an electron from the valence band, leaving another hole in its stead. In this way, the holes travel to the conduction band. Excitons are developed when electron and hole pair combinations occur.212–220 When the size of the three-dimensional materials is reduced to the nanoscale, the band gap expands. It causes the electronic transition between the band gaps in the ultraviolet to visible range and sometimes in the infrared region.221–223 Nanosized carbon cores containing conjugated π-domains with significant functional groups produce multicolour fluorescence due to the quantum confinement effect, one of the main mechanisms among the others.224–226 It is plausible to tweak the characteristic bandgap transition by modifying the size of the π-domains. The increase in the size of the π-domain carbon core causes a smaller bandgap. As a result, a redshifted emission wavelength is noticed.46,227,228 The valence band of the carbon core is separated from the conduction band by the conjugated π-domains of finite size. When there is an excess population of electrons and holes, a direct transition of the electrons present in the conduction band to an empty state of the valence band occurs. During this transitions a electron released a photon as a energy. This process is called “direct radiative recombination”.229–231 The quantum confinement effect helps in the π−π* transition of the sp2 carbon core, which causes the direct radiative recombination of excitons. This direct radiative recombination process of excitons leads to multicolor fluorescence emission.232–234 Increasing the number of conjugated π-domains through quantum confinement phenomena is directly responsible for redshift in the emission wavelength.235–2383.2. Surface state defects
Surface engineering with functional groups of the carbonaceous core is very essential for red emission since the surface defects act as a vital factor for this phenomenon. The addition of different functional groups helps in the n−π* transition of the aromatic sp2 carbon core to exhibit different energy states, resulting in the development of multiple surface defect states.239,240 A border zone or spherical shell that is different from the carbon core region or body is referred to as a surface defect. The complex diversity is caused by the functional groups present on the surface or sp2 and sp3 hybrid carbon cores, leading to the defect state.241–243 Different types of reasons cause different defect states, which leads to different colors of fluorescence in CNMs.244 Surface oxidation is the primary cause, which can serve as a center for the attraction of excitons and produce surface defect state fluorescence.245,246 Surface oxidation occurs in the presence of significant functional groups, which causes the addition of oxygen atoms, loss of electrons, or removal of hydrogen.247–250 The more oxidized surface helps to develop more defects frequently. The result is accompanied by the red shift in the emission wavelength of FCNMs.251,252 Relaxation achieved via the radiation from the excitation state to the ground state is the reason for the surface defect state.253,254 A variety of emission traps are produced by various functional groups, each with a unique energy level that results in a varied degree of defects. The ability of a functional group to deliver electrons, making them used on the surface of the carbon core, would make it possible to modify the colour emission.255–257 When a beam of photons of a specific wavelength is incident on the surface of the carbon materials, the photons whose energy fulfills the band gap energy will transit and assemble at the nearest surface defect traps. Then the photons return to the ground state to radiate tunable emission in the UV-visible region.258–261 It is found that the functional groups support the π*–n and σ*–n transitions, following the molecular type of fluorescence and fixed spectral band changes with the excitation energy and size of the particles.262–265 The functional group also causes structural deformation to the aromatic core, resulting in mid-gap states or energy traps, which contribute to π*–mid-gap–π transitions. Consequently, these transitions broaden the emission wavelength to a longer wavelength.262,266–2694. Optical properties of red-emitting CNMs
The red-emitting CNMs are highly photobleaching resistant and have strong absorption and biodegradability in the red region or near infrared region. They have a very high penetration depth because of their high wavelength. The electronic and optical properties of luminescent CNMs can be studied using UV-visible and fluorescence spectroscopy followed by the determination of the steady-state and lifetime. The red emissive properties of FCNMs can be tuned by several factors including size, surface state, element doping, hydrogen bond, surface functionalization, energy transfer, crosslink-enhanced emission effect, and solvent effect.4.1. Factors influencing the optical properties of red-emitting CNMs
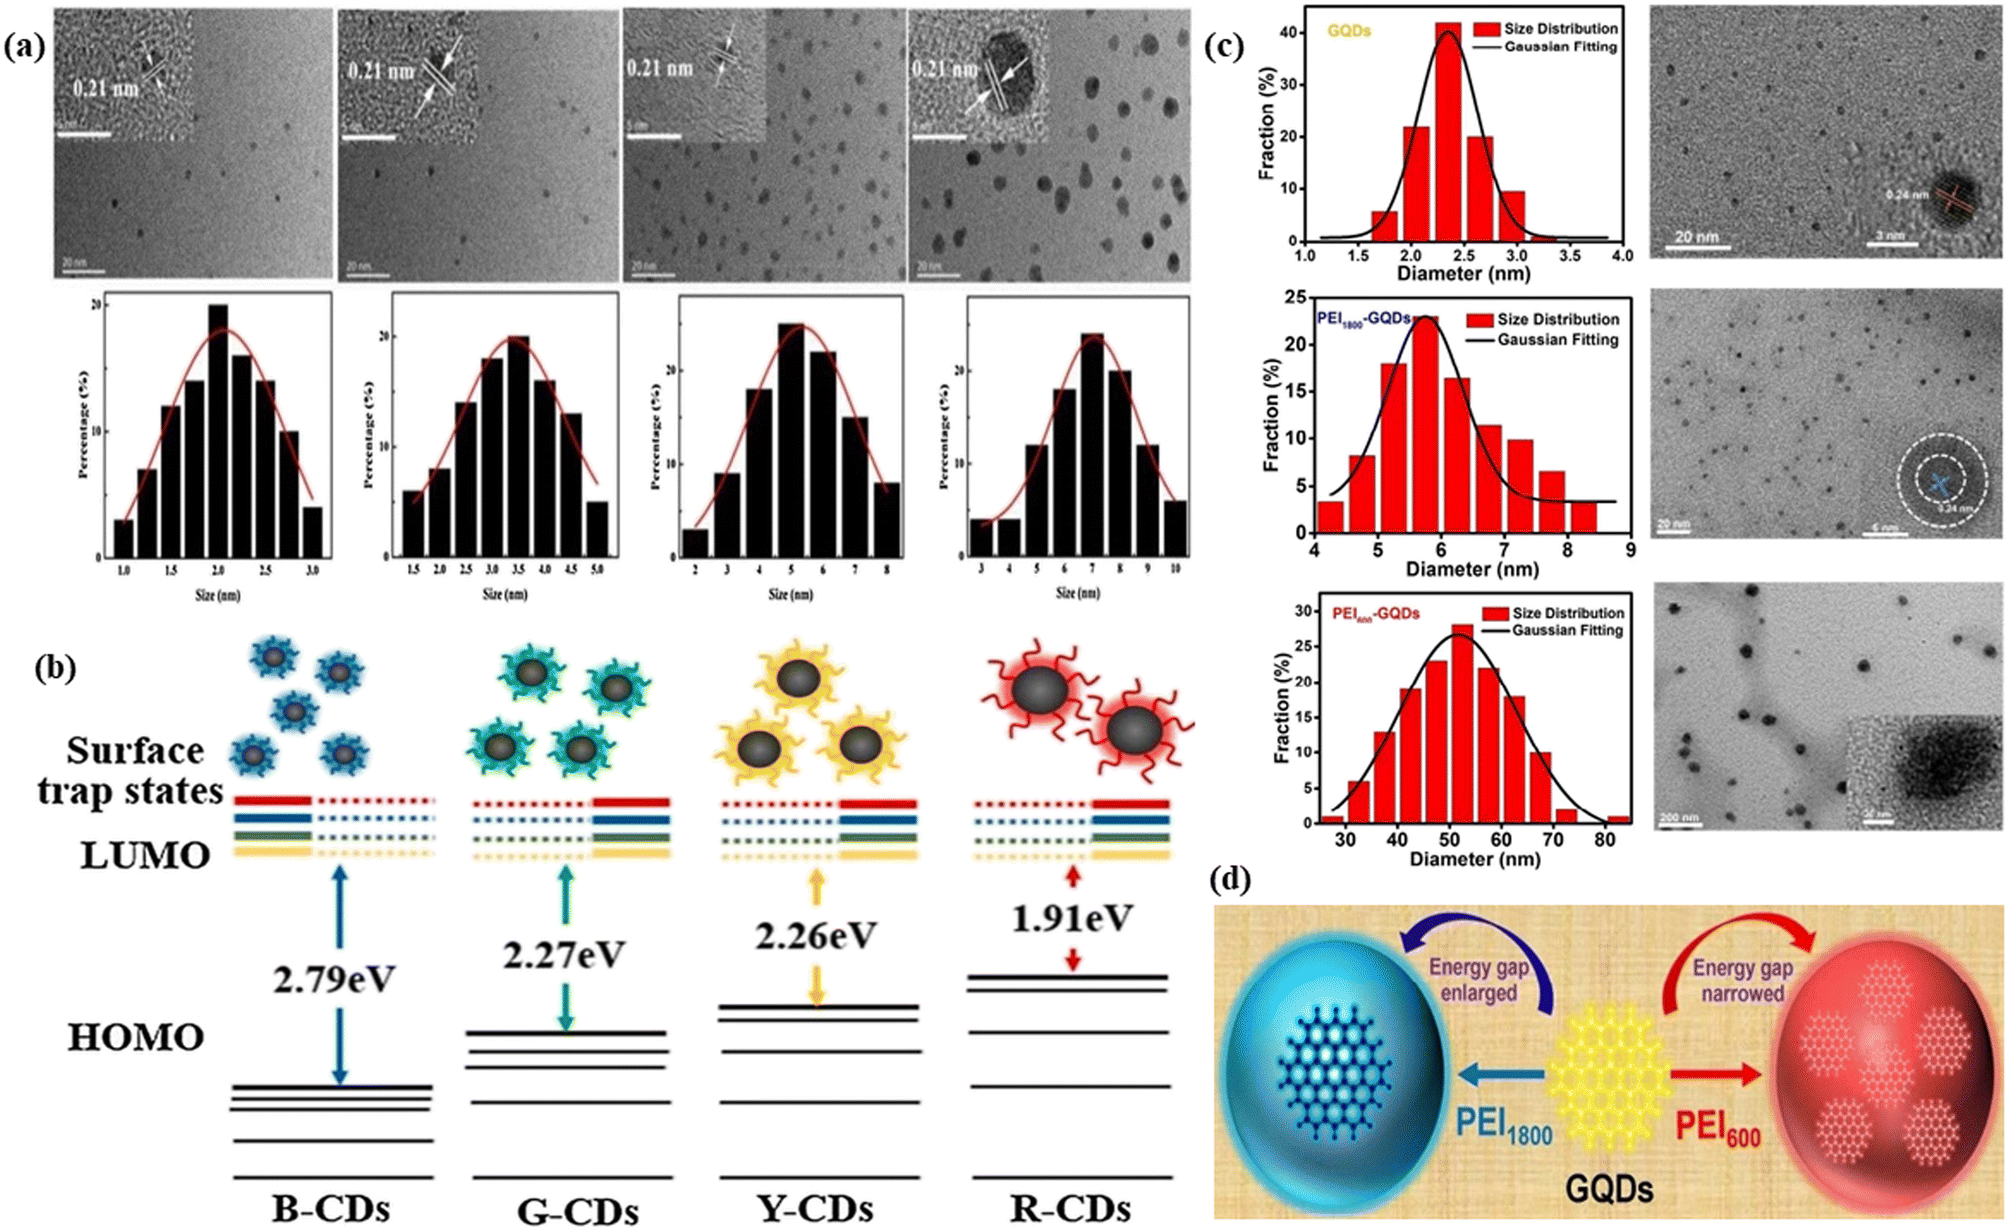 | ||
| Fig. 2 Representation of the size effect on the red fluorescence of FCNMs: (a) TEM and HRTEM images of blue, green, yellow and red carbon dots respectively with size distribution plots; (b) tunable fluorescent carbon dots with their respective electronic energy level diagram, starting from blue, green, yellow and red respectively. Reprinted with permission from ref. 276, Copyright 2021, Elsevier; (c) TEM and HRTEM images of blue, green, yellow and red graphene quantum dots respectively with diameter distribution plots. Gaussian fitting curve is also plotted by the black line; (d) graphical representation of the transformation of yellow fluorescence graphene quantum dots to red fluorescence graphene quantum dots by narrowing the energy gap and yellow fluorescence graphene quantum dots to blue graphene quantum dots caused by enlarging the energy gap. Reprinted with permission from ref. 278, Copyright 2017, American Chemical Society. | ||
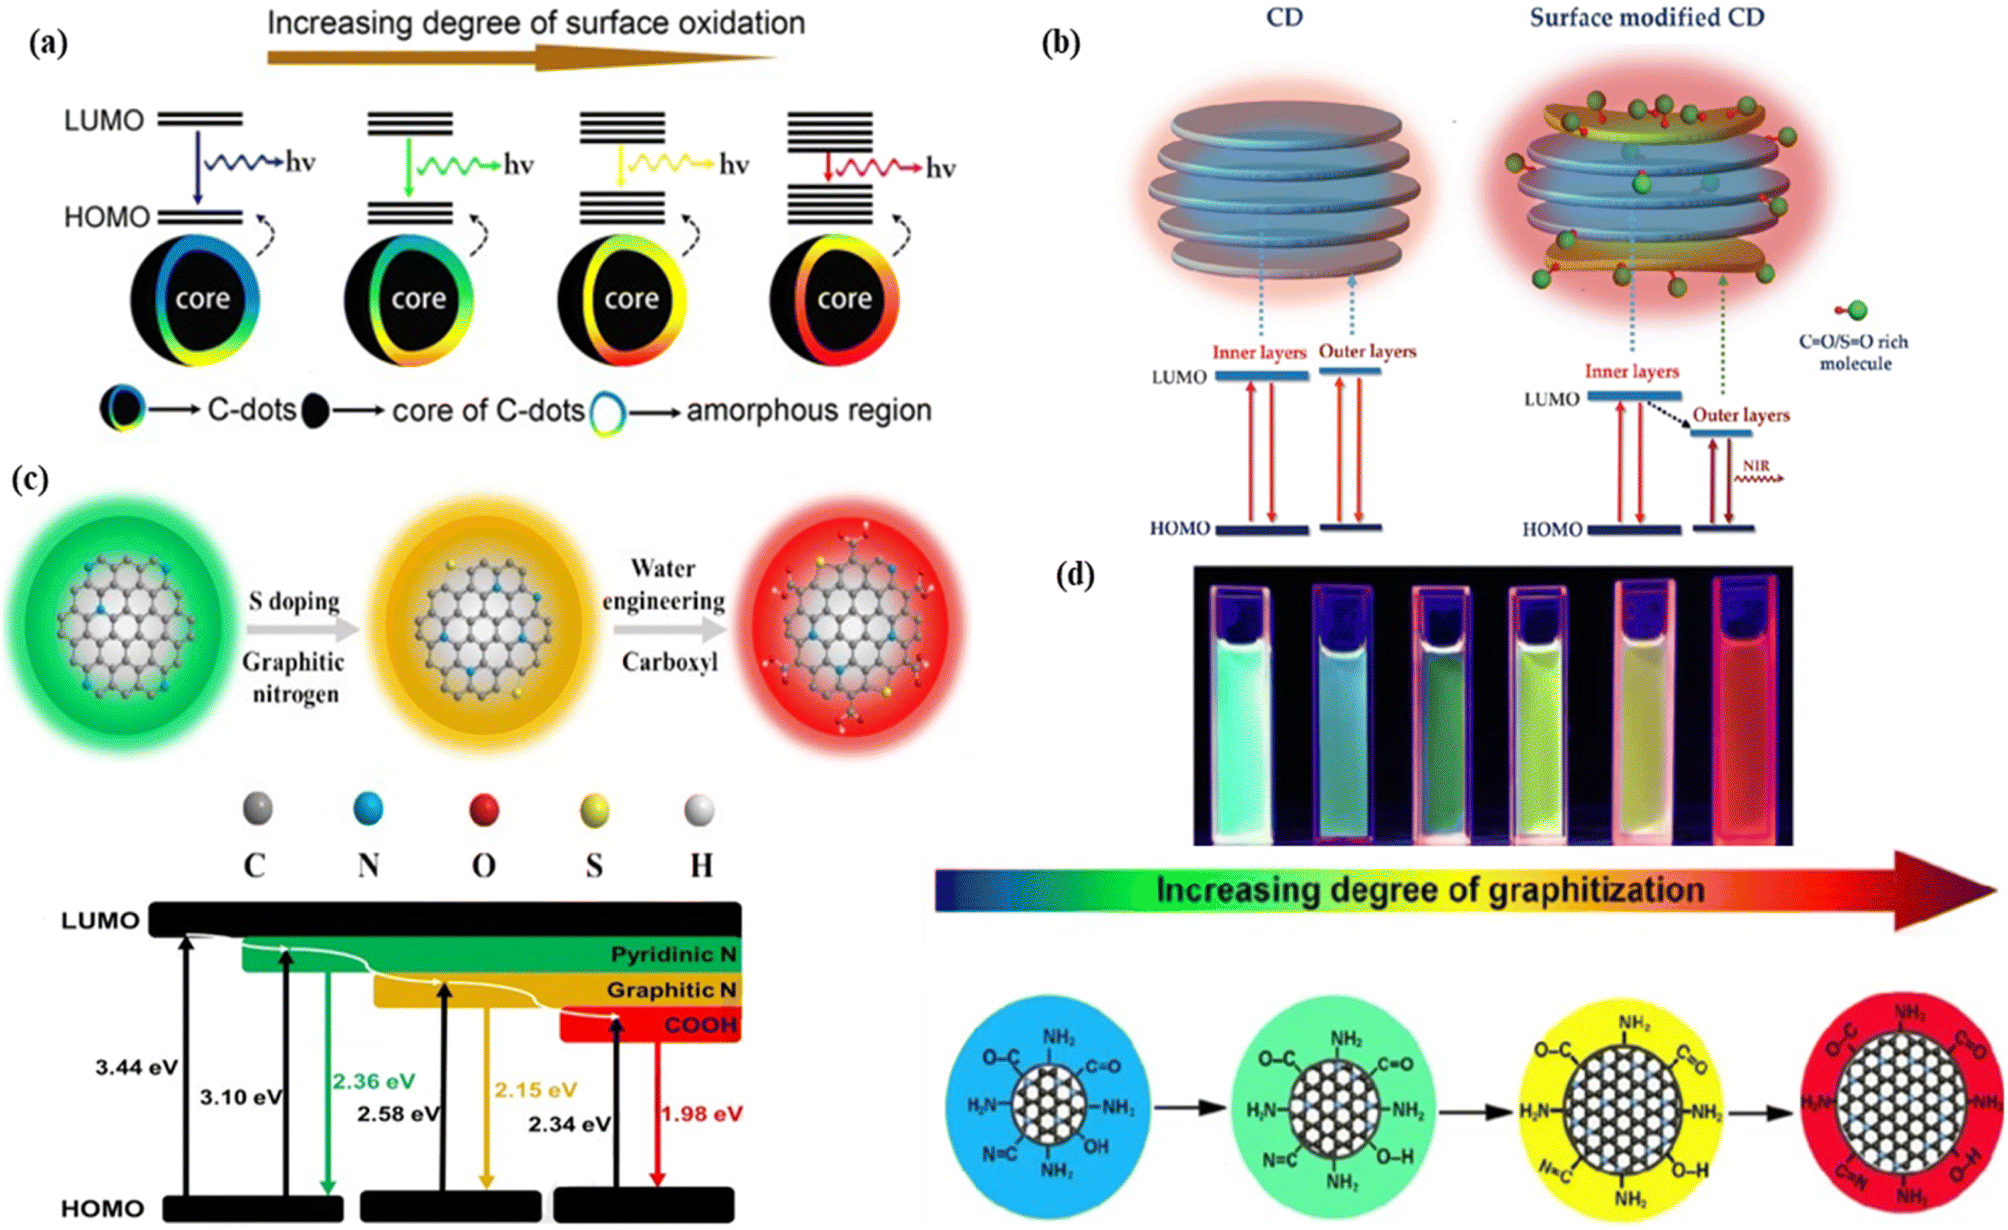 | ||
| Fig. 3 Representation of the surface functionalization and passivation effect on the red fluorescence of CNMs: (a) graphical representation of the increasing degree of surface oxidation causing decrease in the energy gap, followed by red colour fluorescence. Reprinted with permission from ref. 286, Copyright 2016, American Chemical Society; (b) representation of the effect of sulfinyl and carbonyl groups on the red fluorescence of the carbon dots with the energy level diagram. Reprinted with permission from ref. 285, Copyright 2018, WILEY-VCH Verlag GmbH & Co. KGaA, Weinheim; (c) shifting of green fluorescence to red fluorescence by increasing the graphitic nitrogen content and the number of surface carboxyl functional groups with decreasing the energy gap between the HOMO and LUMO. Reprinted with permission from ref. 287, Copyright 2020, Elsevier (d) shifting of the fluorescence colour based on the graphitization degree, graphitization nitrogen, and oxygen containing functional group. Reprinted with permission from ref. 289, Copyright 2022, Springer. | ||
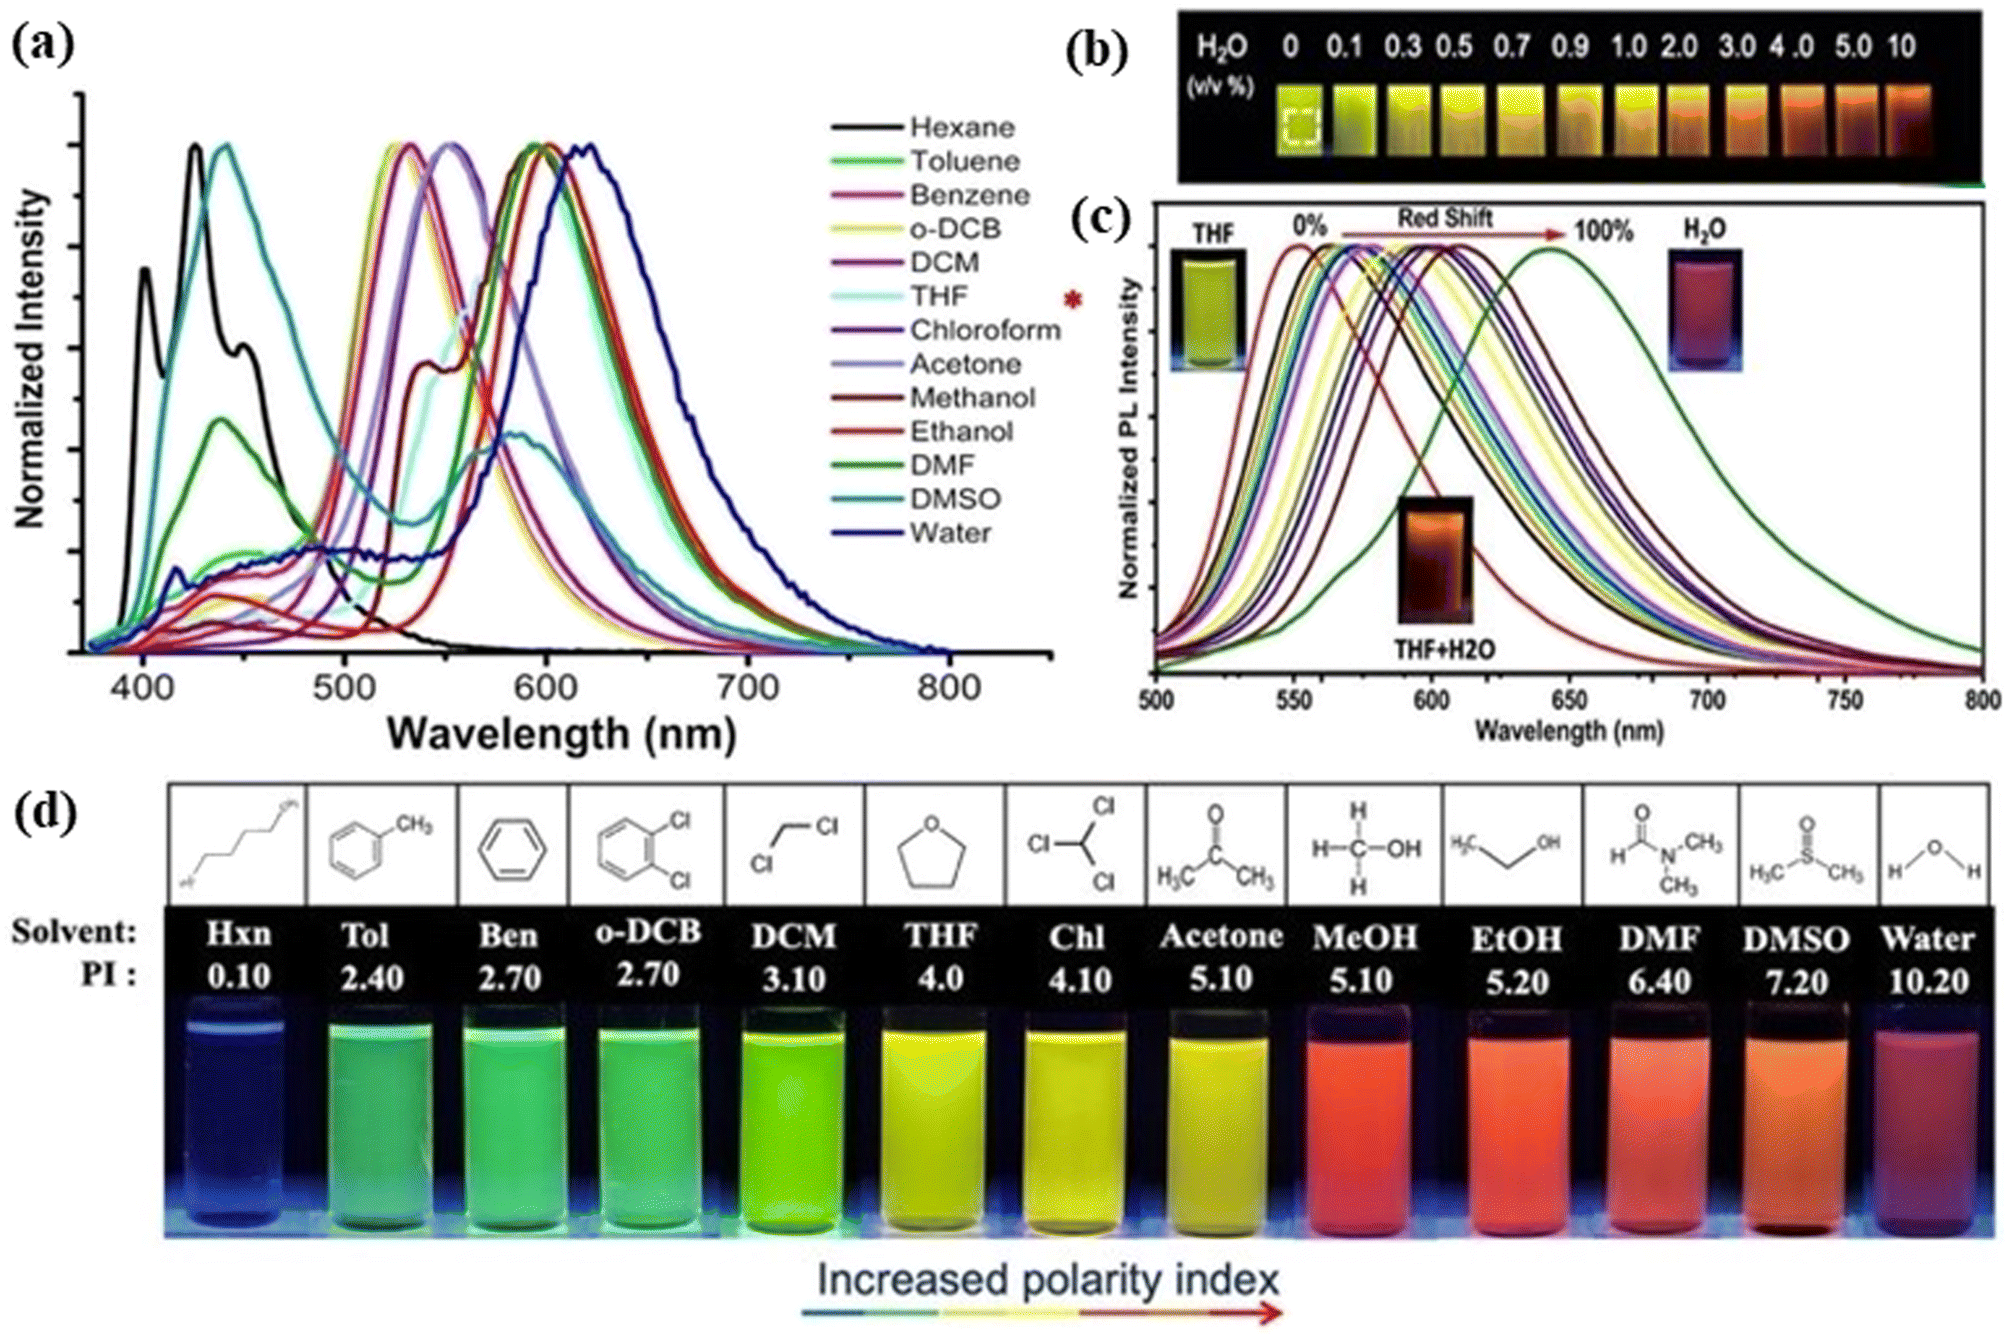 | ||
| Fig. 4 Representation of the solvatochromism effect on red fluorescent carbon dots: (a) emission of the spectra of red carbon dots under different solvents including hexane, toluene, benzene, ortho-dichlorobenzene, di-chloromethane, tetrahydrofuran, chloroform, acetone, methanol, ethanol, dimethylformamide, dimethyl sulfoxide, and water. The asterisk sign reveals the highest intensity peak in chloroform; (b) image of carbon dot solution with the rising amount of water (0–10% vol) under UV light; (c) emission spectra showing the red shift of red carbon dot solution with tetrahydrofuran, tetrahydrofuran & water and only water; (d) fluorescence images of red carbon dots dissolved in different solvents under 365 nm UV light excitation. Reprinted with permission from ref. 300, Copyright 2021, American Chemical Society. | ||
O bonds and fewer C–C bonds, Fig. 5(c).315 It is generally observed that the increase in the nitrogen-containing graphitic carbon core caused a red shift in the emission of CNMs. Holá et al. reported that the increase of electron-donating nitrogen containing graphitic carbon cores produced a midgap state between the HOMO and LUMO, leading to red-shifted emission, Fig. 5(a).11 Zhang et al. described the amino protonation treatment of carbon dots with 2,3-diaminophe-nazine, minimizing the energy bandgap. As a result, the yellow color fluorescence solution of the carbon dots turned into red colour emissive carbon dots with narrow peak widths, Fig. 5(b).316 Yang et al. showed red-shifted emission upon doping of electron-withdrawing fluorine atoms into carbon dots. The authors explained that the extension of the π-electron system due to the addition of the fluorine atom reduces the energy gap, which results in the red shifting, Fig. 5(d).317
 | ||
| Fig. 5 The effect of heteroatoms on FCNMs for red fluorescence: (a) schematic illustration of red colour emission caused by graphitic nitrogen. Reprinted with permission from ref. 11, Copyright 2017, American Chemical Society; (b) the fluorescence mechanism of carbon dots (protonation of 2,3-diaminophe-nazine caused the red emission). Reprinted with permission from ref. 316, Copyright 2021, Springer Nature; (c) the effect of phosphorus and boron doping on the emission of carbon nanodots. Reprinted with permission from ref. 315, Copyright 2023, American Chemical Society; (d) red shifted fluorescence caused by the fluorine doping on carbon dots with the narrowing energy gap mechanism. Reprinted with permission from ref. 317, Copyright 2018, Elsevier. | ||
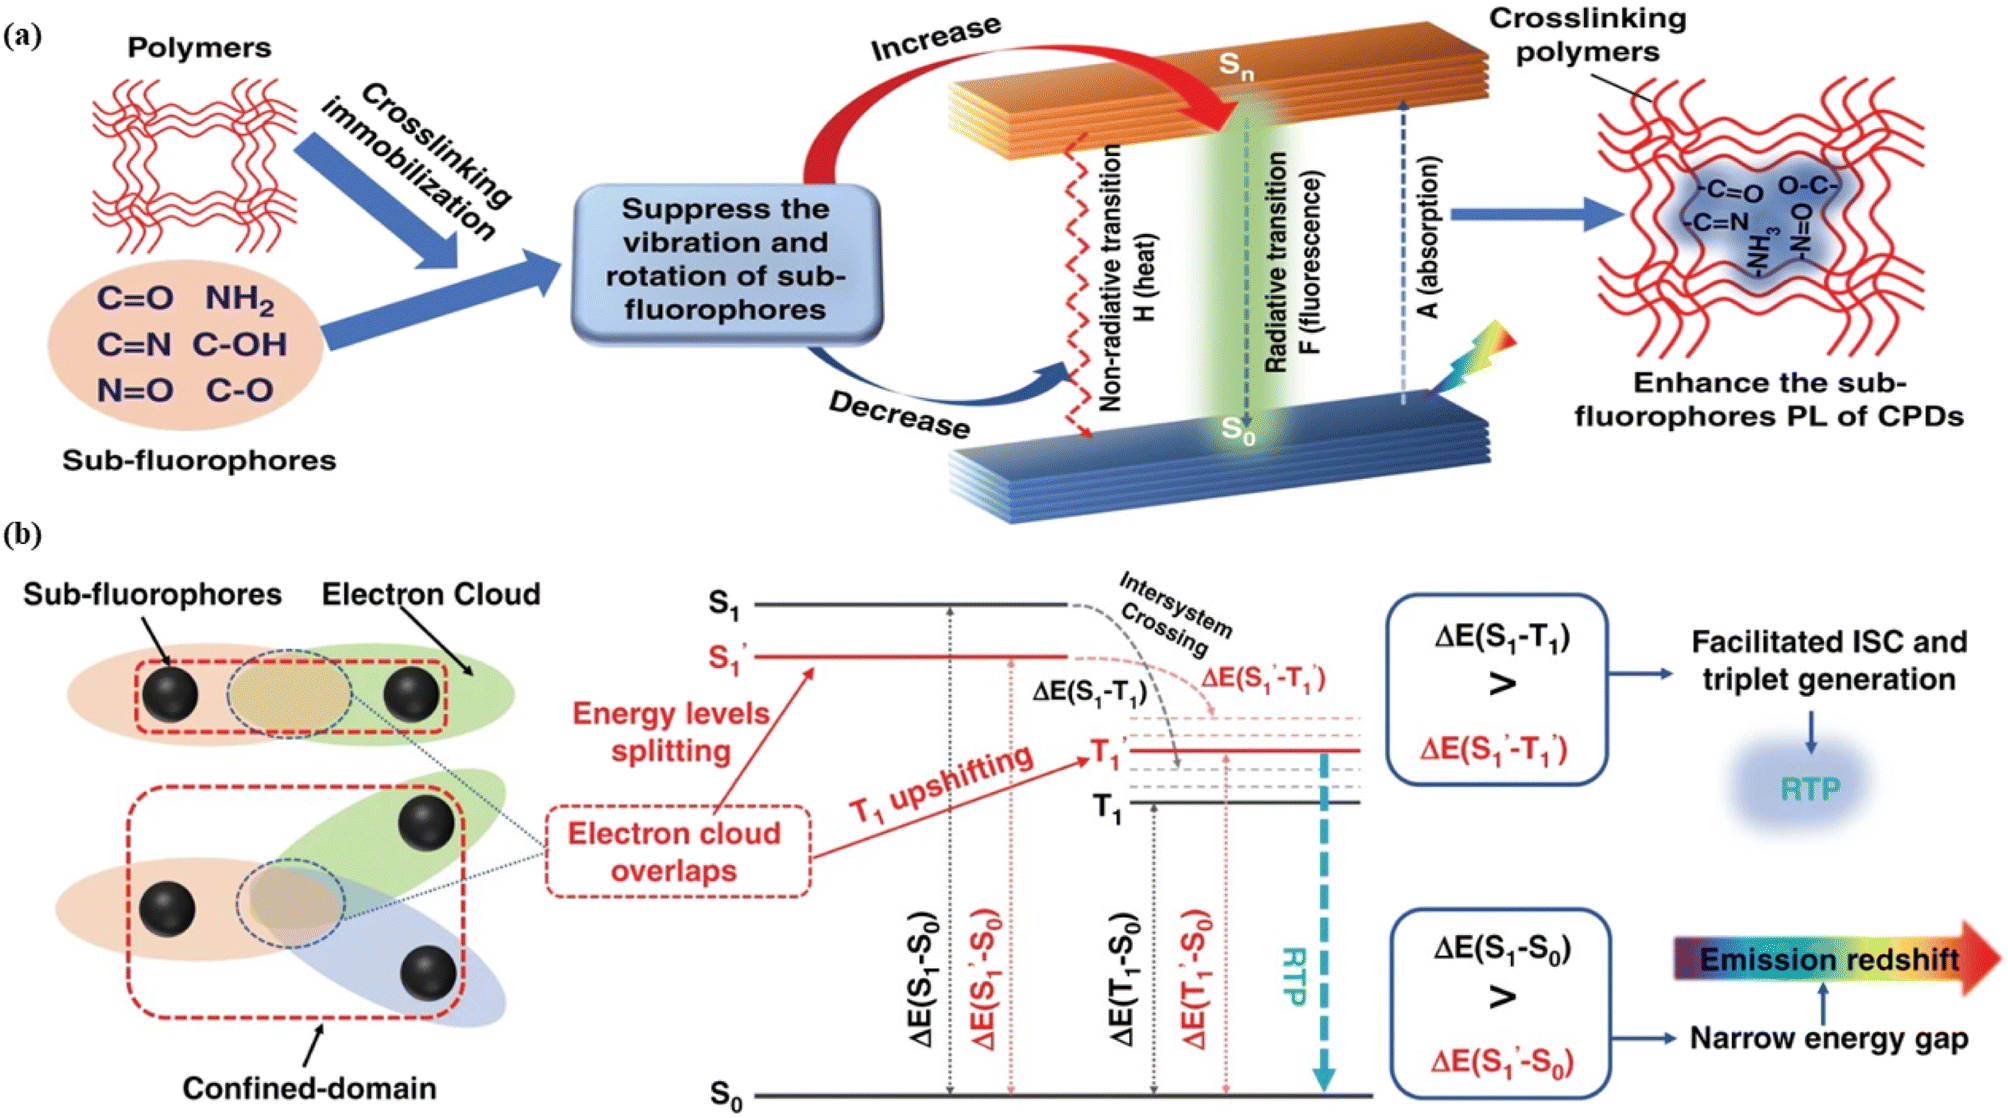 | ||
Fig. 6 Schematic representation of the crosslinking effect for the red emission: (a) the vibrational and rotational changes of the single bond and sub-fluorophores due to the crosslinking restriction, following the rising of radiative transition and minimizing the non-radiative transition; (b) the splitting of the confined domain into intrinsic energy levels to sublevels and raising the energy level of the triplet state lead to the overlapping and coupling of electron clouds followed by red shift of the emission [sub fluorophores-heteroatom holding double bonds like CO, CN, and NO; single bonds-amino based groups, C–O; S0 – ground singlet state; S1 – excited singlet state; T1 – triplet excited state; S1 – first singlet excited state; T1 – first triplet excited state; ΔE(S1–S0) – the energy gap between S1 and S0;  – the energy gap after the crosslinking between S0 and – the energy gap after the crosslinking between S0 and  ; ΔE(S1–T1) – the energy gap between S1 and T1; ; ΔE(S1–T1) – the energy gap between S1 and T1;  – the energy gap after crosslinking between – the energy gap after crosslinking between  and and  ]. Reprinted with permission from ref. 325, Copyright 2022, Springer Nature. ]. Reprinted with permission from ref. 325, Copyright 2022, Springer Nature. | ||
5. Multifunctional applications
Because of the very high wavelength, penetration depth, biodegradability, absorption and photobleaching resistance properties of red emissive CNMs, they are used in biomedical applications, energy-related applications and many other valuable applications. The features and properties of carbon nanomaterials have been modified using a variety of surface and conjugation approaches.5.1. Theranostics
It is a biomedical application process. The word “Theranostics” represents diagnosis and therapy at the nanoscale level or molecular level. This process involves simultaneously one radiological medicine to detect and another radiological medicine to provide therapy treatment to both the primary and spreading tumours diagnostically.335 Theranostic techniques connect specialized therapeutic material delivery with imaging using one of the non-invasive imaging tools based on various biophysical and biological principles.336 Nanomaterials as a nanomedicine are used as theranostic agents to target the diseased affected area for diagnosis and then emerged for the delivery of therapy as needed. Therapy is none other than the delivery of nanomedicine for treatment to relieve or heal a disease or disorder. So, theranostic agents are used for the primary check-up of the problems and controlled release of nanomedicine with efficiency.337,338 FCNMs emerged as theranostic agents due to their easy synthesis method, low cytotoxicity, easy surface functionalization, low photobleaching, and high penetration.3395.1.1.1. One photon fluorescence bioimaging. One-photon fluorescence bioimaging is a very crucial method in the field of bioimaging. When a laser beam of a particular wavelength is incident on a fluorophore, it excites the electrons present in the valence band, which go to a higher energy level. These excited electrons become unstable and stay for a certain time in the excited state. Later they return to the ground state by radiating some amount of energy in the form of photons following the emission of light. The whole process of excitation utilizes only one photon of light. Generally, one-photon fluorescence bioimaging uses near infrared or infrared light due to its longer penetration power.342,343 Red emitting CNMs are very suitable for one photon fluorescence bioimaging as they have the absorption and emission wavelength in the red region.344,345 Karakoçak et al. reported deep red fluorescent nitrogen-doped carbon dots via a microwave pyrolysis method. These red carbon dots are applied in the bioimaging of whole mouse and porcine ocular globes. Two different types of imaging including post-mortem and ex vivo imaging were performed after being embedded with the red carbon dots. The fluorescence image of red carbon dot injected porcine ocular globes was captured at 650 nm excitation wavelength and 700 nm emission wavelength at several time intervals, Fig. 7(c). The post-mortem of red carbon dot injected mice was performed under 550 nm and 660 nm excitation wavelengths, Fig. 7(b).309 Su et al. developed antibacterial fluorescent curcumin carbon quantum dots that exhibit orange-red to infrared fluorescence. The curcumin carbon quantum dots were used in the bioimaging of bacteria cells.346 Yang et al. synthesized fluorine-embedded red fluorescent carbon dots from urea and sodium fluoride mixed citric acid via a microwave synthesis method for both vitro and in vivo bioimaging. The developed red carbon dots were injected into a tumor-bearing mouse for in vivo bioimaging. An intense fluorescence image of the tumour-bearing mouse was observed at different time intervals, Fig. 7(a).317 Huo et al. generated three red fluorescent carbon dots through a hydrothermal method using two isomers 1,5-diaminonaphthalene and 1,8-diaminonaphthalene with ethanol acetone and water. The generated carbon dots have strong red fluorescence and exhibited up conversion fluorescence nature. The red carbon dots are employed in multiple applications including in vivo and in vitro bioimaging, light activation and microarray detection. Confocal fluorescence images of three different types of red carbon dot embedded zebrafish larvae and HeLa cells under various excitation were captured for further diagnosis, Fig. 7(d) and (e).347 Liu et al. demonstrated a red fluorescent carbon dot superoxide dismutase nano-enzyme for in vivo bioimaging of lung injury.348 Wang et al. produced photostable red emissive carbon dots through a microwave heating and polyetherimide-assisted surface-modification method for cell fluorescence imaging.88 Ge et al. synthesized bright red fluorescence carbon dots from polythiophene benzoic acid for both therapeutic and imaging applications.349 Jiang et al. reported water soluble red emitting carbon dots using neutral red and levofloxacin as precursors via the de novo design and microwave assisted synthesis method for the visualization of RNA dynamics and exploring phase-separation behaviour in living cells.350 Liu et al. developed a red carbon dot superoxide dismutase nanoenzyme, which was effectively used as a protector of living cells from oxidative damage via gathering the reactive oxygen species and reducing the levels of pro-inflammatory factors. The carbon dots were also explored for the bioimaging of tissues for the tracking of the heart, liver, spleen, lung, and kidney.351
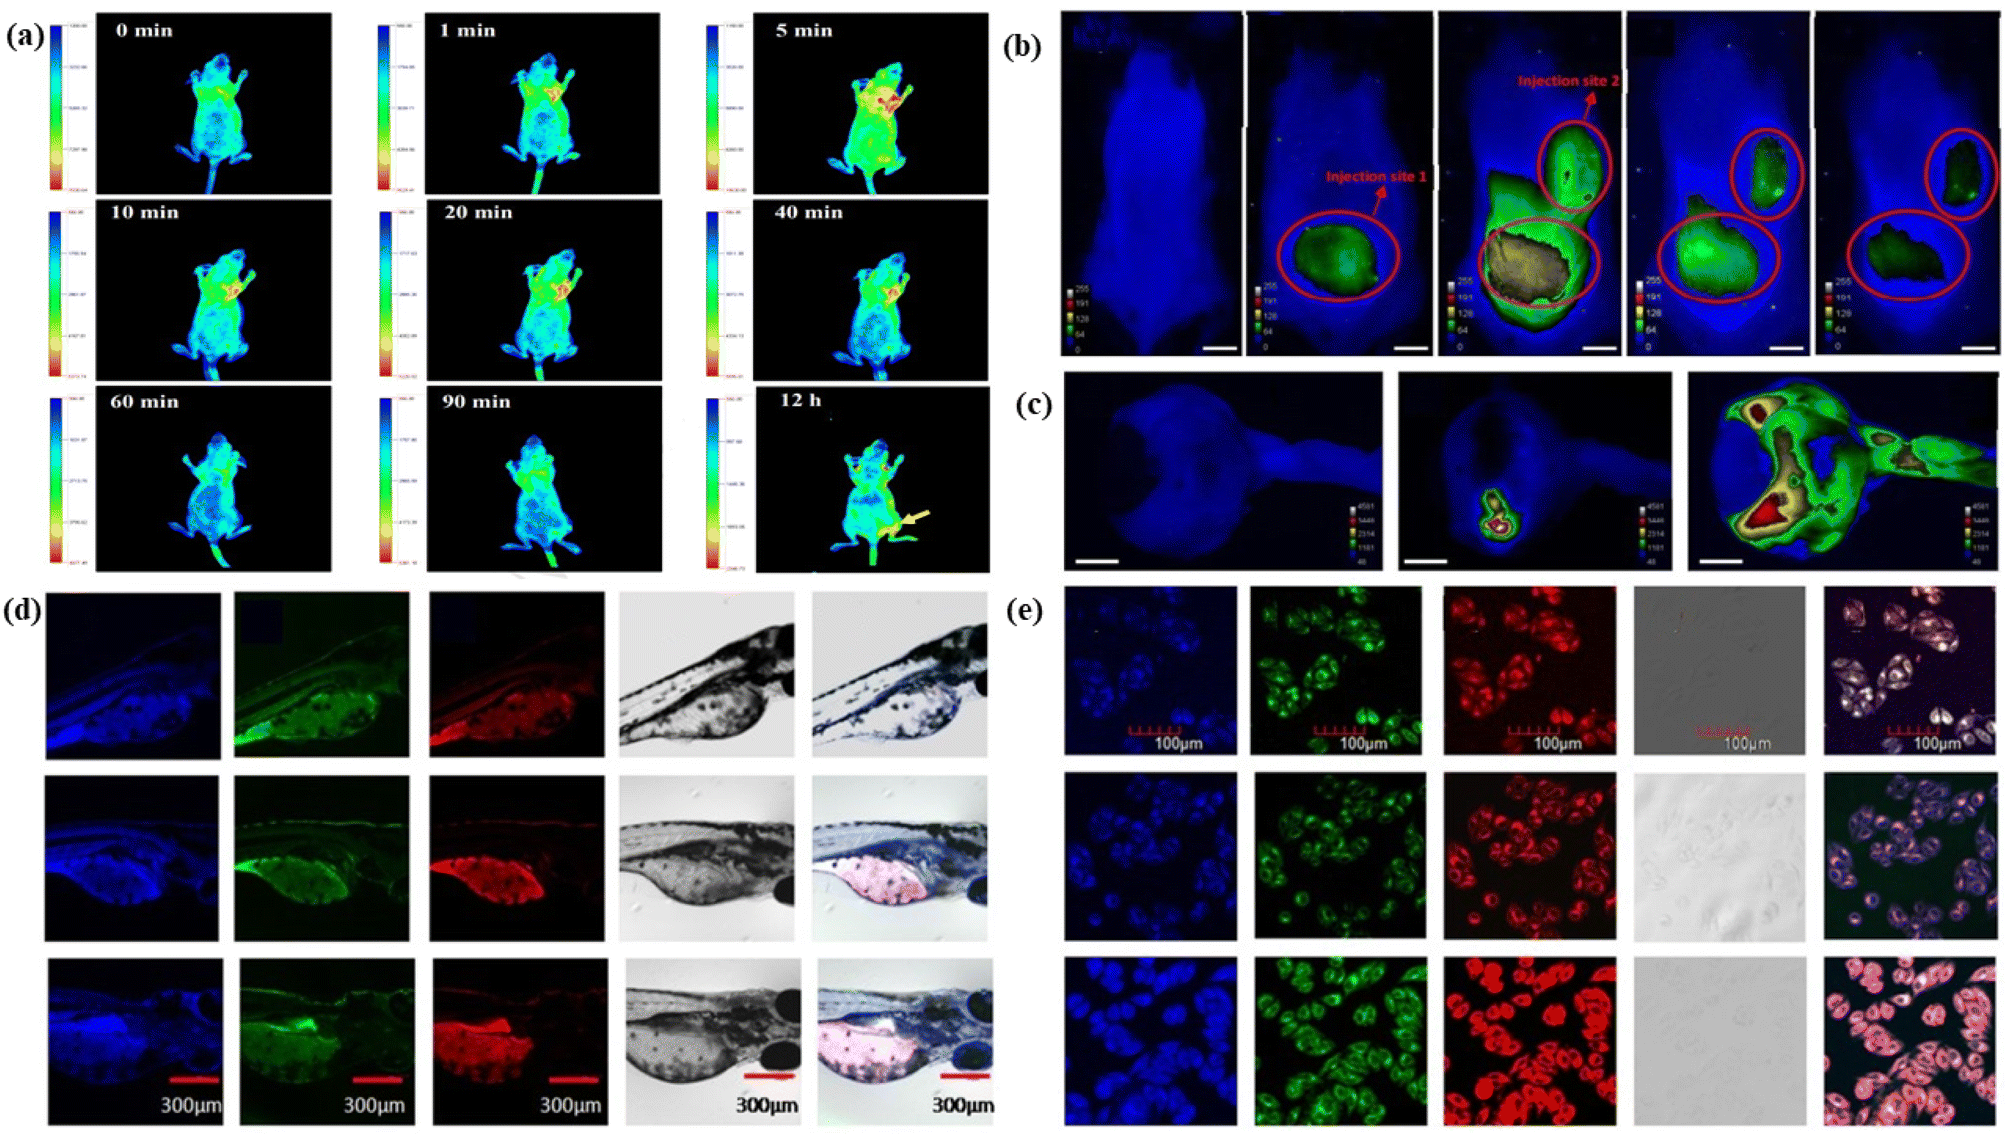 | ||
| Fig. 7 Representation of red carbon dot assisted single photon fluorescence bioimaging: (a) in vivo fluorescence images of tumor-bearing mice after being injected with red carbon dots at different time intervals. Reprinted with permission from ref. 317, Copyright 2017, Elsevier; (b) post-mortem photograph of red carbon dot embedded mice with various concentrations of red carbon dots and a control one, under 550 nm excitation; (c) the red carbon dot injected porcine ocular globes under various conditions. Reprinted with permission from ref. 309, Copyright 2018, American Chemical Society; (d) confocal fluorescence images of three different types of red carbon dot embedded zebrafish larvae under various excitation; (e) confocal fluorescence images of three different types of red carbon dot embedded living HeLa cells under various excitation. Reprinted with permission from ref. 347, Copyright 2019, Springer. | ||
5.1.1.2. Two-photon fluorescence bioimaging. Two-photon fluorescence bioimaging is one of the most emergent discoveries in modern technologies. This technology involves a non-invasive investigation of a biological object with three-dimensional, bright contrasted and sub-micrometer depth resolution images of the object. In this technique, fluorophores are excited by two photons following the simultaneous absorption of the two photons by the fluorophores. When the photon energy is at least half the band gap energy, the two-photon absorption occurs normally. The two-photon fluorescence bioimaging has higher resolution and specificity than one-photon fluorescence bioimaging because the laser beam does not excite the sample area outside the focus center as a result of the quadratic dependence of two-photon absorption on laser power, thereby protecting the nearby health tissue.352 The visualization of the living tissue at a very long depth with a long observation time is possible by two-photon fluorescence bioimaging. Red emissive FCNMs can be developed by exciting fluorophores in red to near-infrared regions. Red-emissive two-photon CNMs are a great choice for utilization in theragnostics i.e., therapeutic and diagnostic applications due to their biocompatible, less overlapping with biological autofluorescence, extremely low photobleaching, prolonged photostability, low photodamage to tissues, and depth penetration.353 Pan et al. synthesized hydrophilic biocompatible near-infrared carbon dots, which showed two-photon fluorescence properties. These properties of red carbon dots are used for the deep-tissue two-photon bioimaging of living cells.189 Zhang et al. produced pure red fluorescent carbon dots from formic acid mixed urea and citric acid blending. The as-developed carbon dots were applied in the in vivo tumour imaging and two-photon fluorescence imaging of the blood vessels in mouse ears. Green colour and red colour signals were detected from the mouse ear. Clear detection of the mouse ear vessel after the injection of the red carbon dots was observed in the two photon fluorescence images, Fig. 8(f).354 Feng et al. created near-infrared graphene quantum dots that have two-photon fluorescence properties with an emission wavelength of 660 nm upon the excitation of 810 nm femtosecond pulses. The carbon dots were applied in two-photon nanoprobe identification and fluorescence imaging of ascorbic acid.355 Kuo et al. generated nitrogen-embedded graphene quantum dots which possess excitation independent two-photon fluorescence emission varying from ultraviolet (UV) to infrared (IR). The materials were employed as a two-photon contrast agent in cellular imaging.356 Liu et al. fabricated highly biocompatible and quantum-yielded carbon quantum dot materials by choosing a conjugated amine precursor. The materials were used in both one-photon and two-photon bio-imaging. The as-synthesized carbon dots showed a highly intense fluorescence colour with a sharp absorbance peak at 592 nm. The fluorescence emission peak was seen at 615 nm wavelength with a quantum yield of 80.77%, Fig. 8(a). The multiphoton fluorescence characteristics of the red carbon dots were examined with various tests. The excitation peaks of the carbon dots was apperaed at 1060 nm and 1100 nm respectively, after the laser irradiation. Both peaks confirmed that the red carbon dots could be used for near-infrared light-assisted multiphoton bioimaging, Fig. 8(b). The intensity of multiphoton emission spectra enhanced with gradually rising laser power, Fig. 8(e). The plotted graph of fluorescence intensity as a function of laser power was found to be linear, Fig. 8(d). A HeLa cell embedded with red carbon dots was examined under 1100 nm near-infrared laser excitation and the images of both confocal and two-photon imaging were captured, Fig. 8(c). It was observed that the two-photon excitation exhibited higher depth penetration as compared to the single photon. A zebrafish larva was coated with red carbon dots and the images under two-photon excitation were captured. A penetration depth of nearly about five hundred micrometres was attained. The whole outline of the larva was imagined in three-dimensional mode. In contrast only the near side larva was captured, in confocal single photon excitation images. So, it was easily concluded that the two photon imaging showed the clear, depth and three dimensional images of the object, Fig. 8(g).357
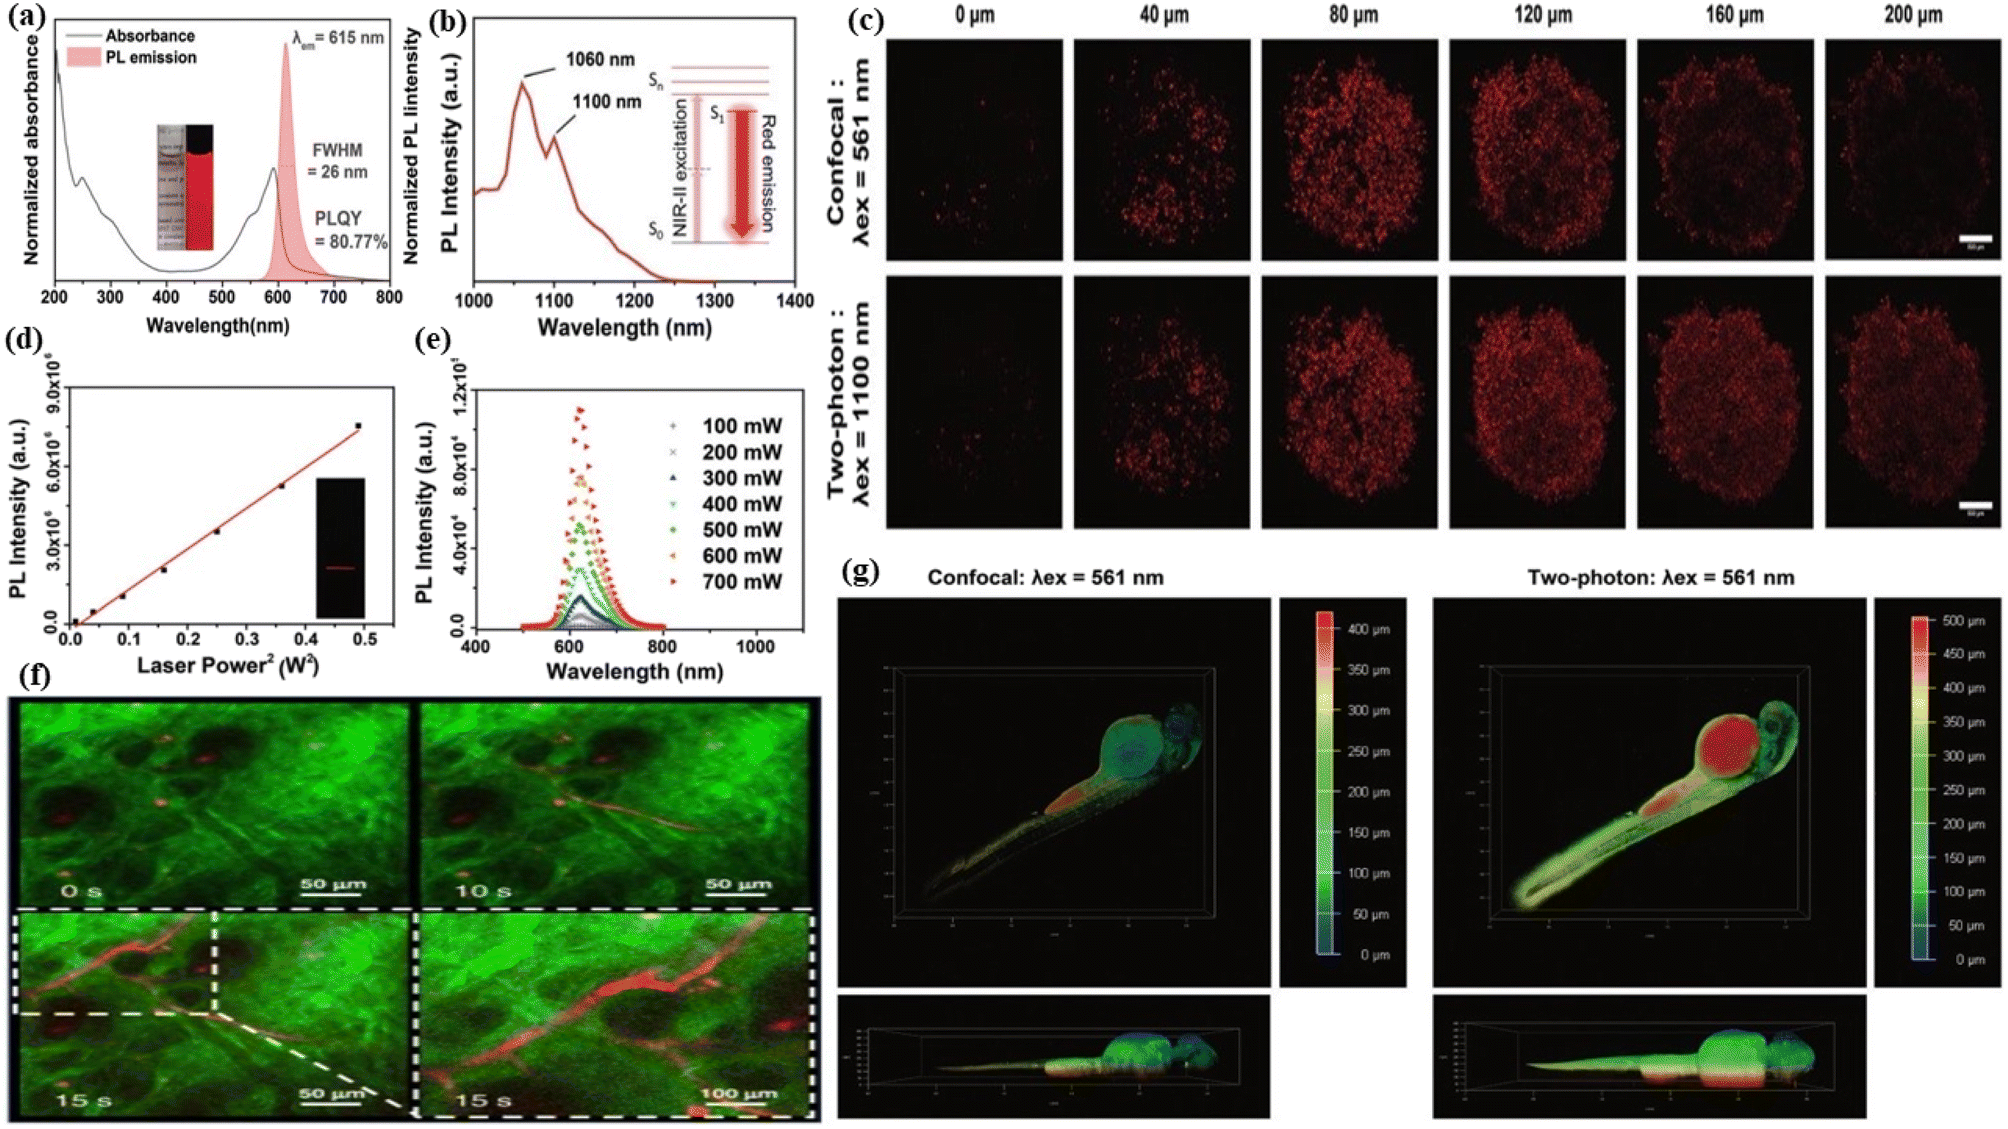 | ||
| Fig. 8 Schematic representation of red carbon dot assisted two-photon bioimaging: (a) the fluorescence spectra and the UV-visible absorbance spectra of red carbon dots; (b) multiphoton excitation spectrum of the red carbon dots; (c) the two-photon and confocal imaging of HeLa cell tumour embedded with red carbon dots under different magnification; (d) the quadratic relationship between the multi-photon fluorescence intensity and excitation intensity after laser irradiation; (e) the multiphoton emission spectrum of red carbon dots under various excitation power. Reprinted with permission from ref. 357, Copyright 2019, Royal Society of Chemistry; (f) two photon fluorescence images of the blood vessel of a mouse ear before and after injection of the red carbon dots. The dashed line shows the partial enlargement. Reprinted with permission from ref. 354, Copyright 2022, Springer Nature; (g) the analysis of confocal and two-photon imaging of red carbon dot embedded zebrafish larvae. Reprinted with permission from ref. 357, Copyright 2019, Royal Society of Chemistry. | ||
5.1.1.3. Photoacoustic bioimaging. Photoacoustic imaging is a hybrid imaging technique developed based on the principle of the photoacoustic effect . It is a non-invasive imaging technique consisting of both optical and ultrasound imaging techniques called photoacoustic imaging.358–360 The photoacoustic effect is a phenomenon whereby light energy absorbers in tissues are treated with a non-ionizing pulsed laser beam in the near-infrared range for a nanosecond time-range. Some of the light energy of the laser beam is transformed to heat that prompts a quick expansion of thermoelastic materials followed by the generation of an ultrasonic wave. The produced waves are detected by an ultrasonic sensor presented on the surface of the object being imaged. It is time-saving, non-intrusive and safe. Hence it is suitable for kids. Like fluorescence imaging, photoacoustic imaging also has sensitive light absorption and can produce high-contrast images (with a few centimeters of depth) in the areas of biological tissues.361–364 Ge et al. produced broad absorption red fluorescent carbon dots from polythiophene phenyl propionic acid. The red carbon dots showed photoacoustic phenomena and high photothermal conversion efficiency characteristics when treated with a laser. The characteristics of red carbon dots were utilized in photoacoustic imaging and cancer therapy.365 Parvin et al. reported phosphorus and nitrogen co-doped red emissive higher quantum yielded carbon dots from citric acid via a simple hydrothermal treatment for utilization in the photoacoustic imaging of living tissue. The excitation-dependent fluorescent emission of the as-synthesized red carbon dots was observed in this case. Fluorescence images were captured under various excitation wavelengths of 455 nm, 523 nm, 595 nm and 605 nm, Fig. 9(a). The response photoacoustic intensity spectrum of the red carbon dots was recorded under various concentrations of carbon quantum dots and it was seen that the photoacoustic signal increased with concentration, Fig. 9(b). Real-time photoacoustic imaging was performed after injecting the red carbon dots into cancer-affected mice. A controlled experiment was also performed along with the first one. The red carbon dots were spread all over the body of mice as well as the affected tumour area. Their photoacoustic images were captured. After six hours the red carbon dots were concentrated in the tumour-affected area, Fig. 9(c). After one day other organs including the liver, heart, lung, kidneys, spleen and tumour were also recorded. The liver and tumour of the mice exhibited maximum fluorescence whereas the others showed very low fluorescence, Fig. 9(d). The fluorescence of the tumour area increased very fast after the injection due to the fast settling down in the area. For better diagnosis various deposition stages were recorded at various time intervals, Fig. 9(e).366 Jia et al. developed gold nanorod and silica-coated carbon dots with excitation wavelengths ranging from 680–980, which were utilized in both photoacoustic imaging and photothermal therapy.367 Bao et al. developed photostable near-infrared emissive sulphur and nitrogen-embedded carbon dots that showed good theranostic potential for use in photoacoustic imaging.368 Xu et al. demonstrated cobalt oxyhydroxide-coated red fluorescent carbon dots for the photoacoustic and fluorescence probe for the sensitive and selective identification of ascorbic acid. This result influenced researchers to develop oxyhydroxide-based photoacoustic probes.369
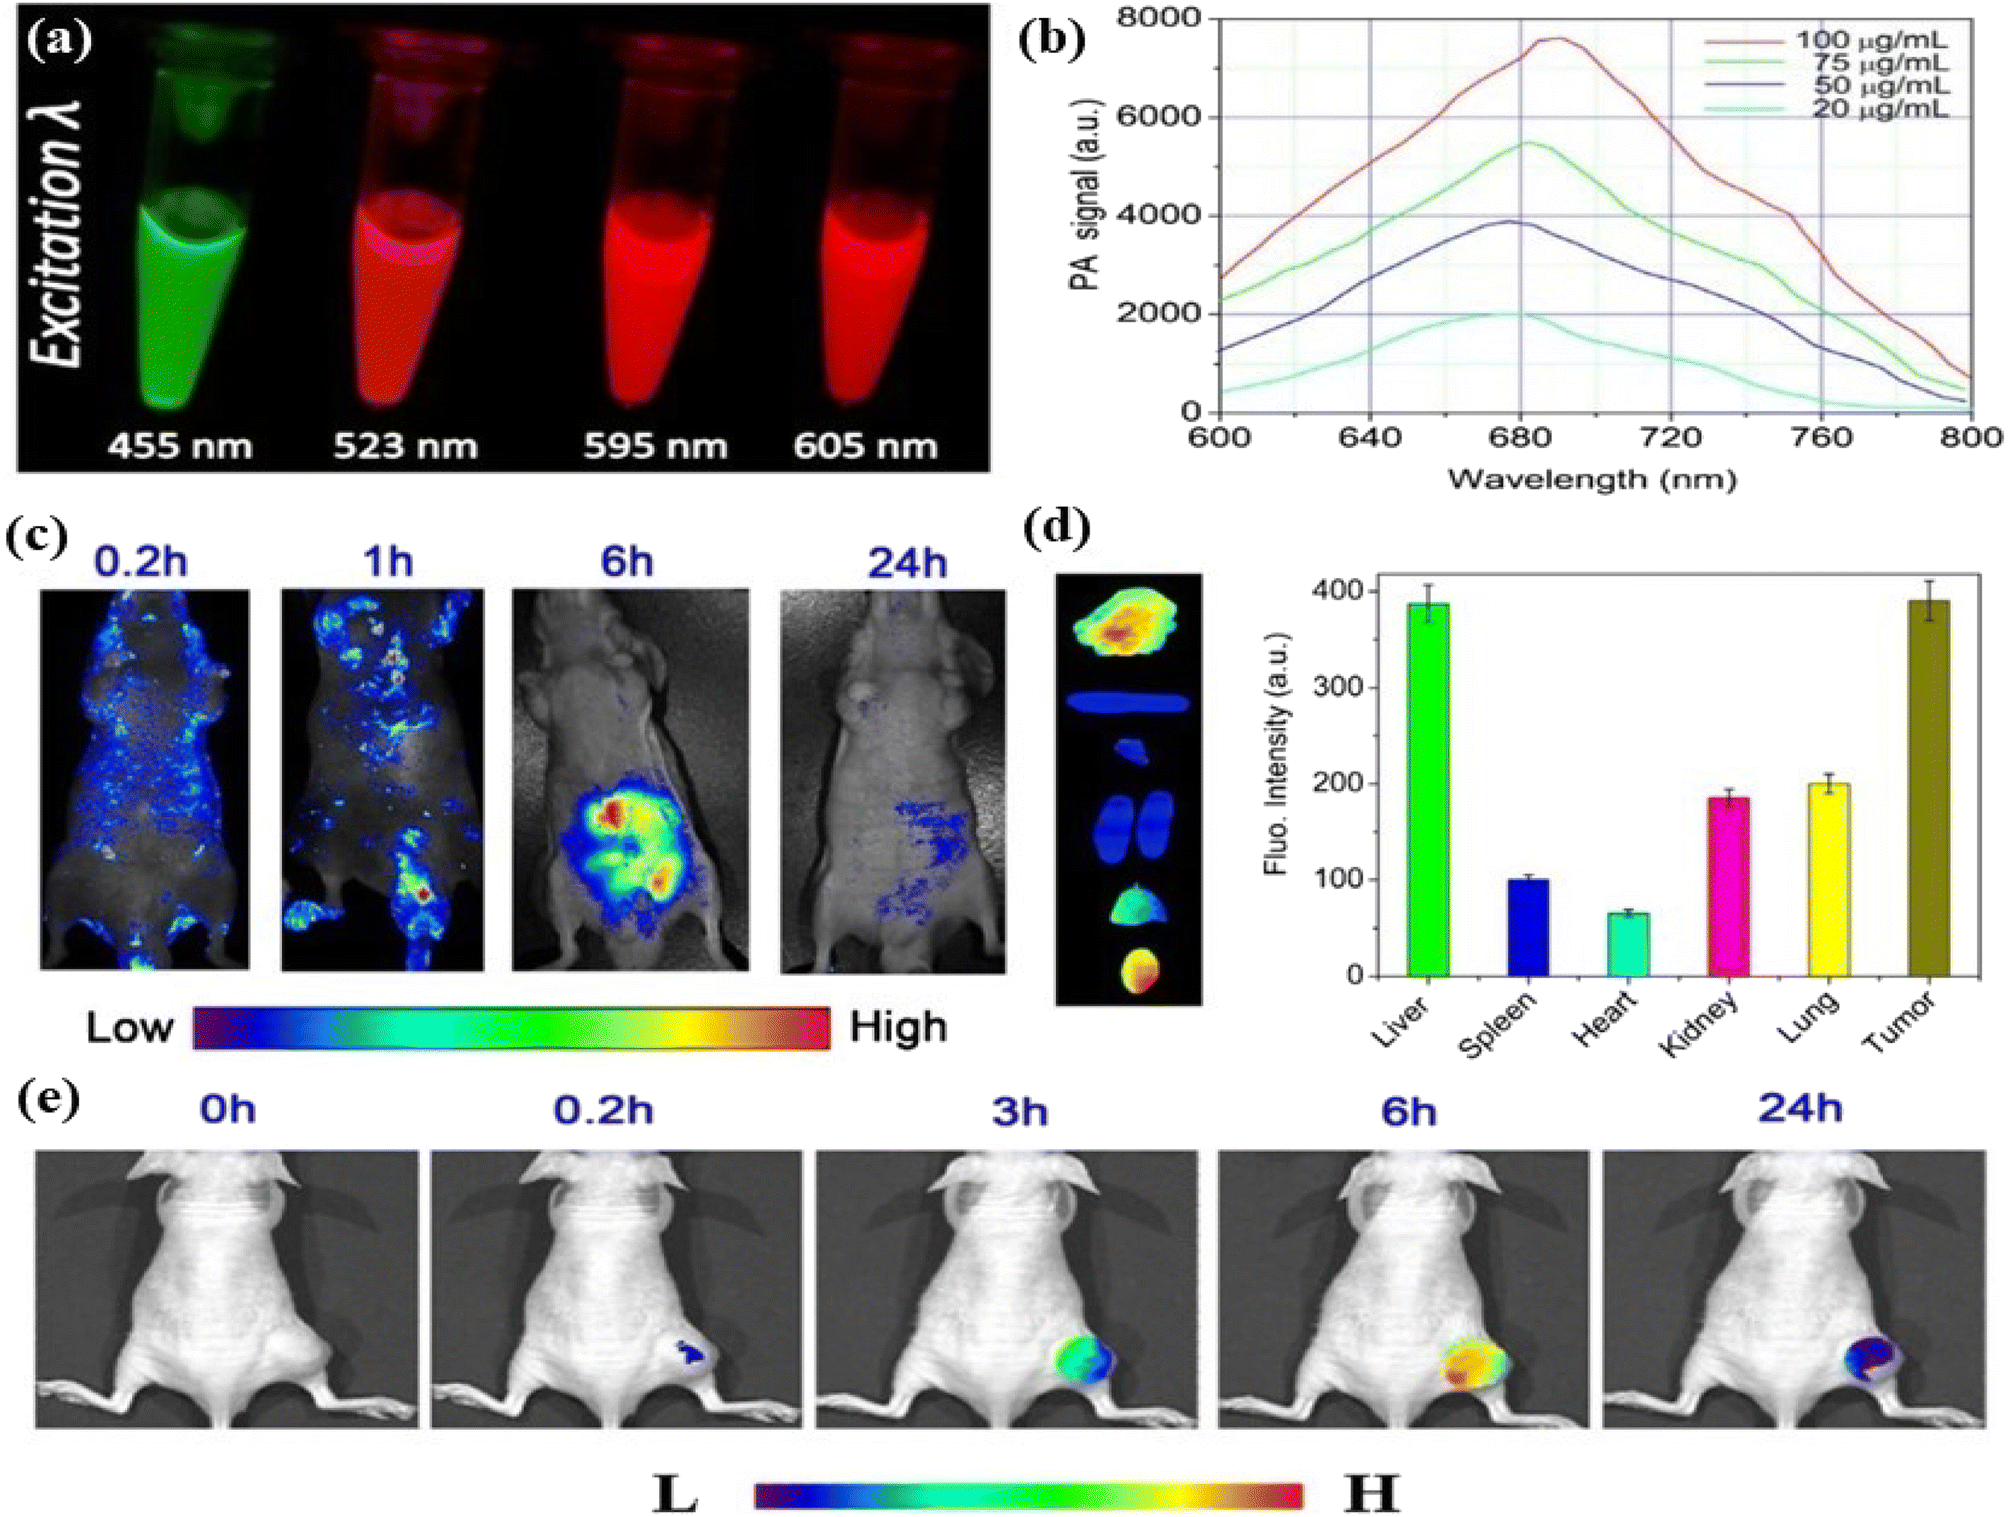 | ||
| Fig. 9 Photoacoustic imaging of red carbon dots: (a) excitation dependent fluorescence of carbon dots solution; (b) photoacoustic response of red carbon dots with various concentrations; (c) photoacoustic photograph of the red carbon dots injected mice at various time intervals; (d) experimental in vivo photographs of the red carbon dots injected liver, spleen, heart, kidney, lung, and tumour of cancer affected mice; (e) photoacoustic photographs of tumour in mice after being injected with red carbon dots under excitation wavelength at various time intervals. Reprinted with permission from ref. 366, Copyright 2017, Springer. | ||
5.1.2.1. Photothermal therapy. As the name suggests “Photothermal Therapy” involves “photo” which means light and “thermal” which means heat. This process is one of the types of therapeutic models for cancer treatment through a photothermal agent that transformed the nonradiative absorbed light to heat energy in the location area. It has reduced side effects unlike traditional chemotherapy.370,371 Permatasari et al. reported red-shifted pyrrolic nitrogen-rich carbon dots via microwave-assisted hydrothermal synthesis. The red carbon dots showed photothermal effects with high near-infrared photothermal efficiency and high fluorescence characteristics. These characteristics are used in photothermal cancer therapy.372 Scialabba et al. prepared red fluorescent biotin-coated carbon dots as nano-heaters to convert near-infrared light into heat for the photothermal therapy of the cancer cell.373 Lan et al. developed sulphur and selenium-embedded carbon dots with excitation independent near-infrared emission. The as-developed carbon dots possess high photothermal conversion efficiency that is employed in the photothermal therapy of cancer cells with the assistance of fluorescence imaging. The team injected the red carbon dots into cancer-affected mice to investigate the photothermal effect of the red carbon dots. The tumour of the mice illuminated strong fluorescence under 560 nm laser excitation, Fig. 10(a) right. A controlled experiment was also performed to observe the difference after being injected with the red carbon dots and excited under normal light, Fig. 10(a) left. A full-body inferred thermal image was captured after being injected with red carbon dots and saline in the cancer-affected mice. The red carbon dot injected mice showed a large temperature increase under laser illumination in comparison with saline, which caused a low-temperature increase, Fig. 10(b). The irradiated area temperature as a function of irradiation time was noted. The surface temperature of the tumour of red carbon dots injected mice increased very fast to 52 °C while the surface temperature of the saline-injected mice increased by only 5–6 °C, six minutes after the laser irradiation, Fig. 10(c). The maturation of tumour volume as a function of post-day treatment was recorded for the red carbon dots with light, only red carbon dots, only light and only saline, Fig. 10(d). It was observed that the cancer-affected HeLa cells glowed under the excitation of 488 nm and 880 nm wavelengths, Fig. 10(e) and (f). Cell death was seen after producing various blebs, caused by the photothermal effect of the red carbon dots after excitation, Fig. 10(g) and (h).374 Weng et al. produced a nano-vehicle with a red emissive carbon dot induced indocyanine green and ultrathin layered double hydroxide mixture. The mixed materials exhibit great fluorescence, photoacoustic, two-photon bioimaging and effective photothermal properties. These properties are employed in multifunctional applications including photothermal therapy.375 Hou et al. proposed gold-doped carbon dot nanoflowers with strong red emission under 750 nm laser irritation for novel photothermal cancer therapy.376
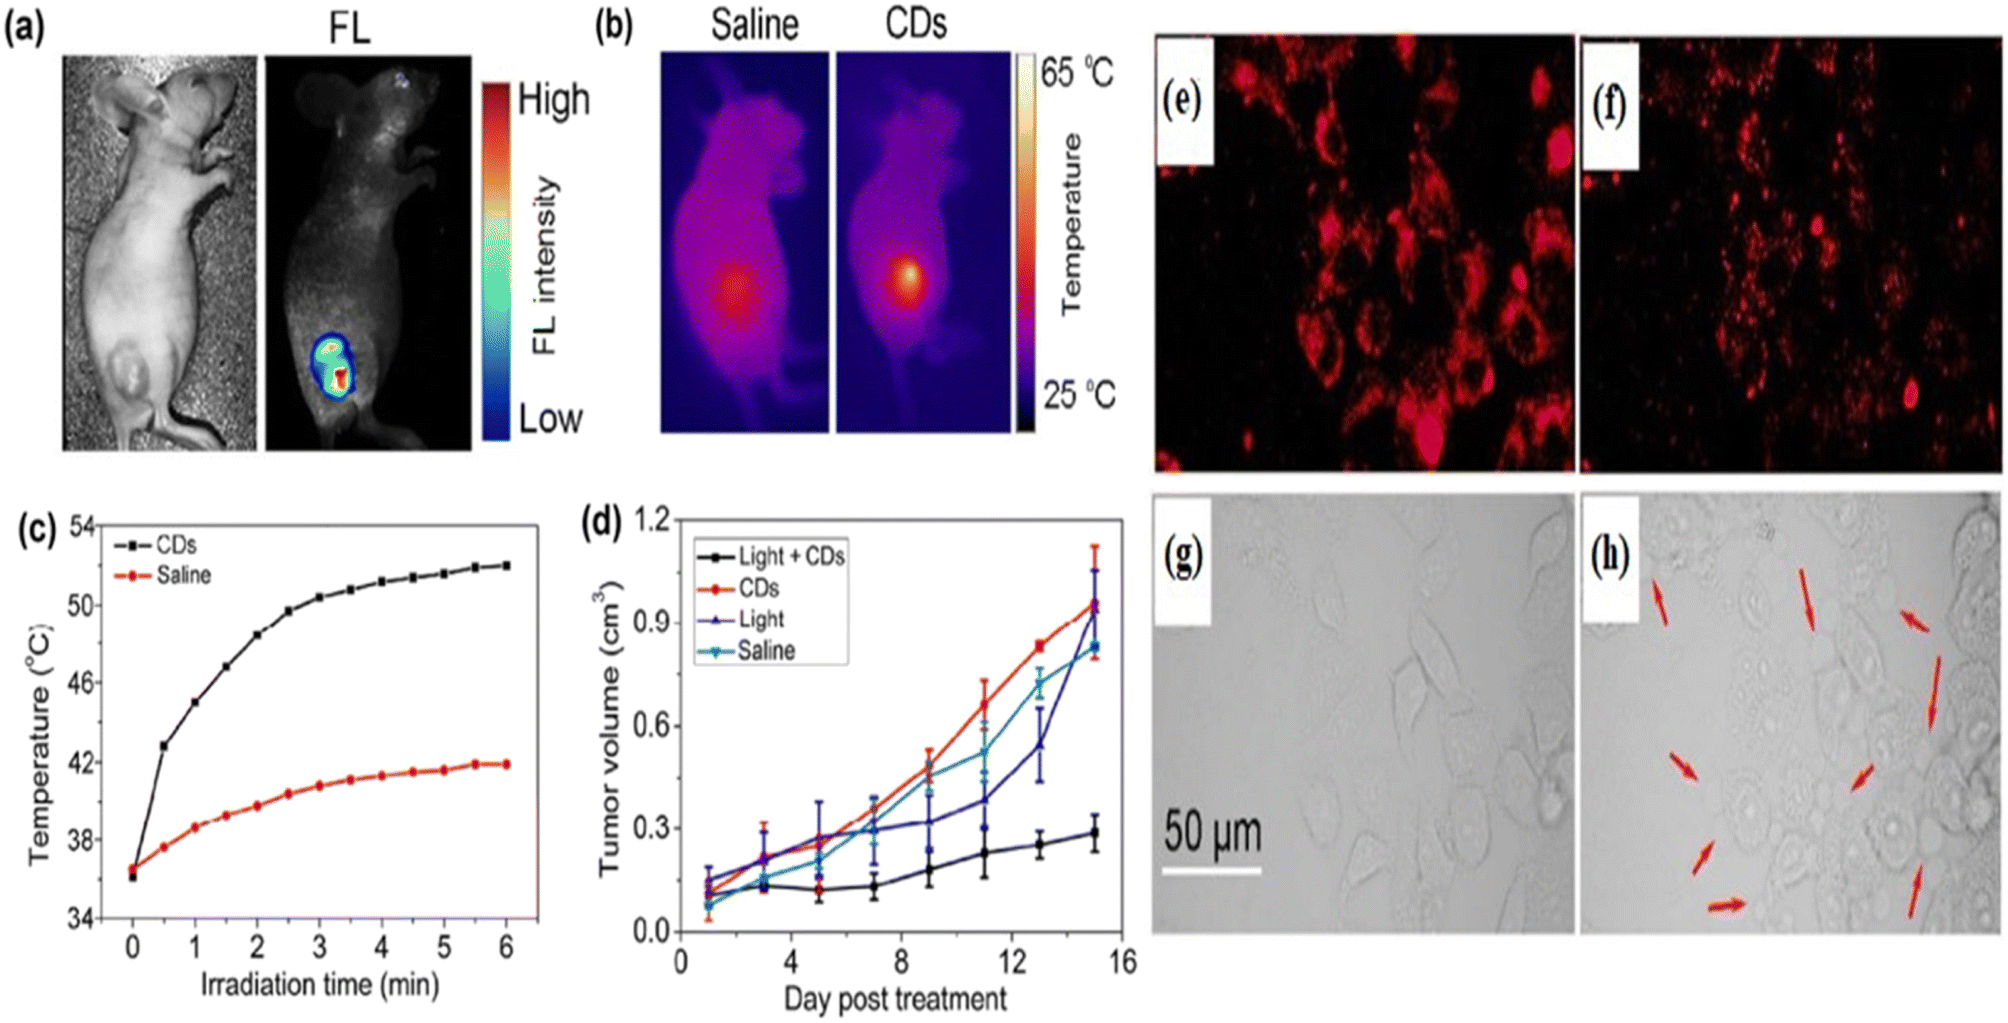 | ||
| Fig. 10 Representation of the red carbon dot assisted photothermal therapy: (a) white light image (left) and fluorescence image (right) of red carbon dot injected mice; (b) infrared thermal images of tumour bearing mice after injection of saline and red carbon dots, respectively; (c) temperature changes as a function of time of the tumour bearing mice under 880 nm laser irradiation; (d) changes in the tumour volumes as a function of post-day treatment with the red carbon dots; (e) confocal fluorescent microscopy images of a cancer affected cell after the injection of red carbon dots under 488 nm excitation; (f) confocal fluorescence microscopy images of the cancer affected cell after the injection of red carbon dots under 880 nm excitation; (g) transmission images of the cancer affected cell after the injection of red carbon dots before laser illumination; (h) transmission images of the cancer affected cell after the injection of red carbon dots three minutes after the laser illumination. Reprinted with permission from ref. 374, Copyright 2017, Springer. | ||
5.1.2.2. Photodynamic therapy. Photodynamic therapy, a two-stage procedure, uses a photosensitizer medicine to kill malignant and precancerous cells after light activation of the medicine. Until light activation, the photosensitizer medicine is non-toxic. The photosensitizer turns poisonous to the malignant and the precancerous cell after being activated by light energy. A certain wavelength of light radiation, typically from a laser source, activates the photosensitizer medicine.377–379 Photodynamic therapy has the potential to activate the immune system, offering the human body an additional tool to assist the elimination of malignant and precancerous cells. Several diseases, including skin malignancies, brain malignancies, lung malignancies, bile duct malignancies, bladder malignancies, pancreatic malignancies, oesophagus malignancies, head-neck malignancies, and macular degeneration are caused by aging, skin acne, and skin disease psoriasis. These diseases are treated with photodynamic therapy using various types of photosensitizer. The bacterial and fungal infectional disorders are also treated with photodynamic therapy using photosensitizer.380–383 Zhao et al. proposed biocompatible nitrogen and phosphorus co-embedded red fluorescent carbon dots that empower the ability of 1O2 production and utilized them as a photosensitizer in the photodynamic therapy of lung cancer cells.384 Yi et al. developed nitrogen embedded two photon carbon dots with red emission that offers the generation of reactive singlet oxygen (ROS). The produce ROS helps in the photodynamic treatment of the nucleus to identify dynamic changes.385 Xu et al. fabricated photostable, biocompatible and singlet oxygen yielded red fluorescent carbon dots as a photodynamic therapeutic agent for lung cancer cells and apoptotic cells.386 Liu et al. reported photostable antibacterial red emissive carbon dots for photodynamic therapy of Gram-negative Acinetobacter baumannii. The as-synthesized red carbon dots enter into the bacteria cell very rapidly and kill it successfully. The red carbon dots produced reactive oxygen species under the light illumination of 590 nm. The reactive oxygen quickens the killing of multi-drug resistance Acinetobacter baumannii bacteria, Fig. 11(a).387 Ge et al. demonstrated the photodynamic therapy of red fluorescent graphene quantum dots in a breast cancer cell transplanted female mice model via a multistep photosensitization process followed by the generation of singlet oxygen. They synthesized the graphene quantum dots through a single step hydrothermal method of polythiophene derivatives. As a photodynamic agent, other sensitizers took part in the production of 1O2via electronic transition from excited triplet state (T1) to ground state (G), Fig. 11(b) left. The energy gap between the first singlet excited state (S1) and the first triplet excited state (T1) of graphene quantum dots is larger than the formation energy of 1O2 . The energy gap between the first triplet excited state (T1) and the ground state (G) of the graphene quantum dots is also larger than the formation energy of 1O2. As a result, the production of 1O2 followed two paths. First, the electronic transition from the first triplet excited state (T1) and second, the electronic transition from first singlet excited state (S1) to ground state (G) via a intersytem crossing. Consequently, it was possible to attain a total 1O2 quantum yield greater than 1, Fig. 11(b) right. For photodynamic therapy, a breast cancer affected mice model was examined under different treatments on the first, ninth, seventeenth and twenty fifth days. In the case of photothermal therapy, the tumour initially turned black and decomposed, which reduced the size of the tumour. After nine days, it started to decompose and then uprooted after seventeen days. One week later, it left dark marks, where they originally were before peeling off. After fifty days of the photodynamic therapy, no sign of tumour progression was seen. Tumor progression was compared using different types of photodyanamic therapy (PDT: GQDs+light irradiation; C1: GQDs only; C2: light irradiation only), Fig. 11(d).388 Zhao et al. developed nitrogen and sulfur-embedded red emissive carbon dots to penetrate tumor cells as an effective photosensitizer for image-guided photodynamic therapy.389 Zheng et al. synthesized red carbon dot doped carbon nitride for increasing the water-splitting ability to produce reactive oxygen. Water splitting by the carbon nitride helps in the photodynamic therapy of tumor cells. When the carbon dot doped carbon nitride nanoparticles were applied, they entered the cancer tissues and had an impact on the permeability and retention of those tissues. A laser with a 630 nm wavelength was used in the hybrid carbon nanosystem to split water and produce oxygen. Singlet oxygen was produced from this oxygen for cancer diagnosis under laser irradiation and this produced reactive oxygen species helps to treat the cancer cells, Fig. 11(c).390 Yang et al. fabricated red fluorescent carbon dots using citric acid and tea polyphenol as precursors via a formamide assisted solvothermal method. The team explored the excellent antitumour properties of the carbon dots as a photosensitizer via the photodynamic therapy of a breast cancer cell affected mouse model.391 Cai et al. reported red carbon dots from metformin and methylene blue for the development of light controlled nitric oxide generation and the liposome targeted photodynamic therapy of cancer cells efficiently.392
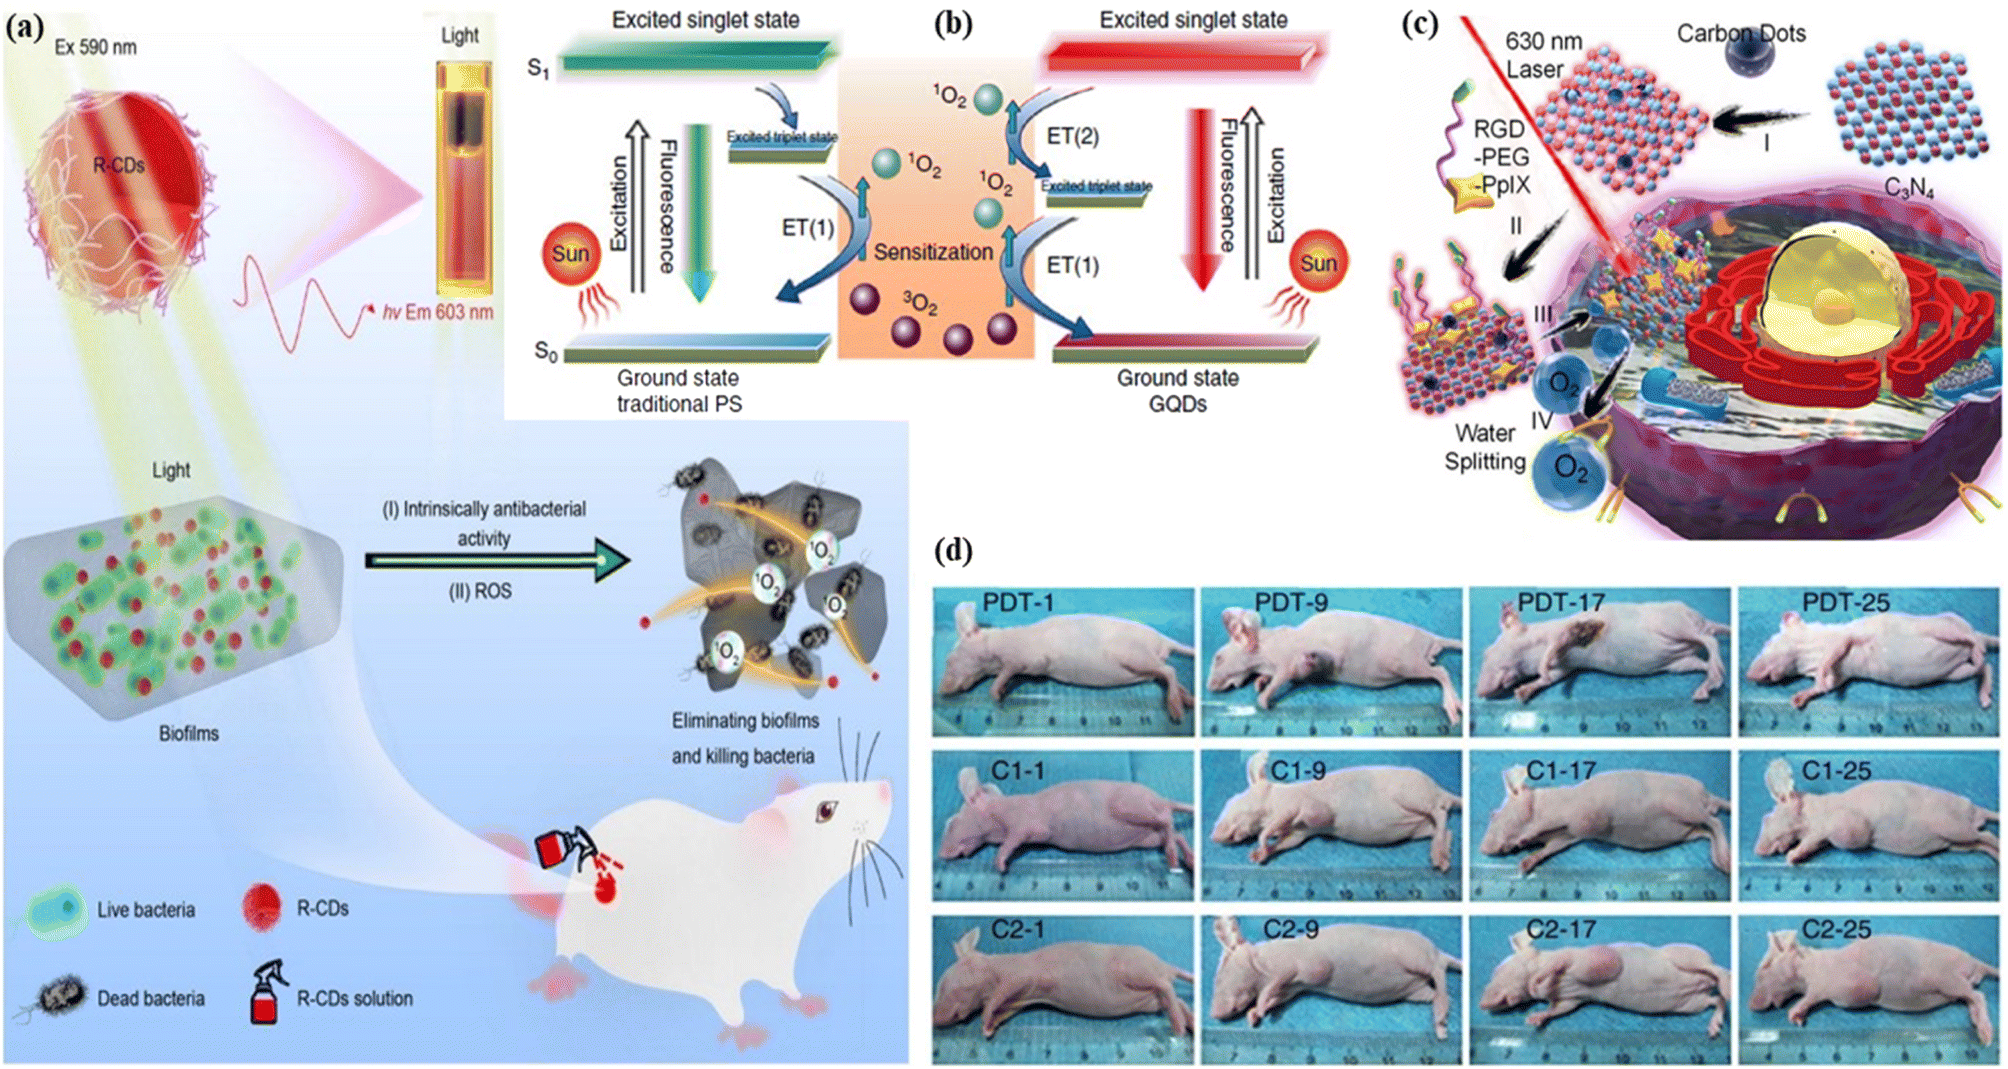 | ||
| Fig. 11 Representation of red carbon dot assisted photodynamic therapy: (a) red carbon dots for the diagnosis of multi-drug resistance Acinetobacter baumannii bacteria using photoexcitation. Reprinted with permission from ref. 387, Copyright 2022, Springer; (b) mechanism of the photodynamic treatment agent red graphene quantum dots under light sensitization. Reprinted with permission from ref. 388, Copyright 2014, Springer Nature; (c) graphical representation of the light-assisted water splitting photodynamic therapy with several mechanisms. Reprinted with permission from ref. 390, Copyright 2016, American Chemical Society; (d) in vivo imaging of the mice under different treatments on the first, ninth, seventeenth and twenty-fifth days. Reprinted with permission from ref. 388, Copyright 2014, Springer Nature. | ||
5.1.2.3. Synergistic therapy. Synergistic therapy, an efficient new way of anticancer therapy, involves a higher collective effect of two or more medications which is larger than the total effect of the individual medicine. Basically, the new synergistic therapy is developed by combining the beneficial properties of photothermal and photodynamic therapy.393,394 Red FCNMs can be successfully employed to produce synergetic therapy treatment that contains both the photothermal and photodynamic effects.25 Bai et al. fabricated sulphur and nitrogen co-doped two-photon emissive red carbon dots for fluorescence imaging-assisted synergistic photodynamic therapy and photothermal therapy of tumour cells. The as-synthesized carbon dots have a 27% efficiency rate of singlet oxygen production and 34.4% photothermal conversion efficiency. The doping of sulphur and nitrogen helped to increase the synergistic therapy in this model, Fig. 12(c).395 Shinde et al. reported biocompatible and stable lipid-coated red fluorescent carbon dots derived from Clitoria ternatea leaves for red fluorescence imaging of zebrafish embryos and synergistic therapy of breast cancer cells.396 Jia et al. synthesized hydrophilic red fluorescent carbon dots as a photo-synergistic agent from Hypocrella bambusae for bimodal fluorescence imaging-guided synergistic photodynamic and photothermal therapy in cancer cells. It was observed that these as-synthesized carbon dots could effectively produce 1O2 species and hyperthermia for bimodal synergistic photothermal and photodynamic therapy of cancer, in contrast to single photodynamic therapy, Fig. 12(b).397 Sun et al. demonstrated photosensitizer chlorin e6 doped amino-rich red fluorescent carbon dots for photoacoustic image guided and near infrared laser excited synergistic therapy of cancer cells.398 Song et al. developed red light-emitting carbon dots and latterly photosensitizer chlorin-e6 embedded with the red carbon dots through an amide reaction. As a result, they reduced phototoxicity and photodynamic and photothermal therapy could be achieved under a single laser excitation. These chlorin-e6 embedded carbon dots are utilized in fluorescence image-guided tumour treatment and synergistic therapy for tumour cells, Fig. 12(a).399 Chu et al. produced copper-doped antibacterial red carbon dots for a fluorescence imaging-assisted triple synergistic disinfection effect induced by a near-infrared light source. The carbon dots were embedded with cocamidopropyl betaine, a quaternary ammonium complex for the synergistic antibacterial effect with the help of reactive oxygen species at a low concentration and temperature under 808 nm laser irradiation, Fig. 12(d).400
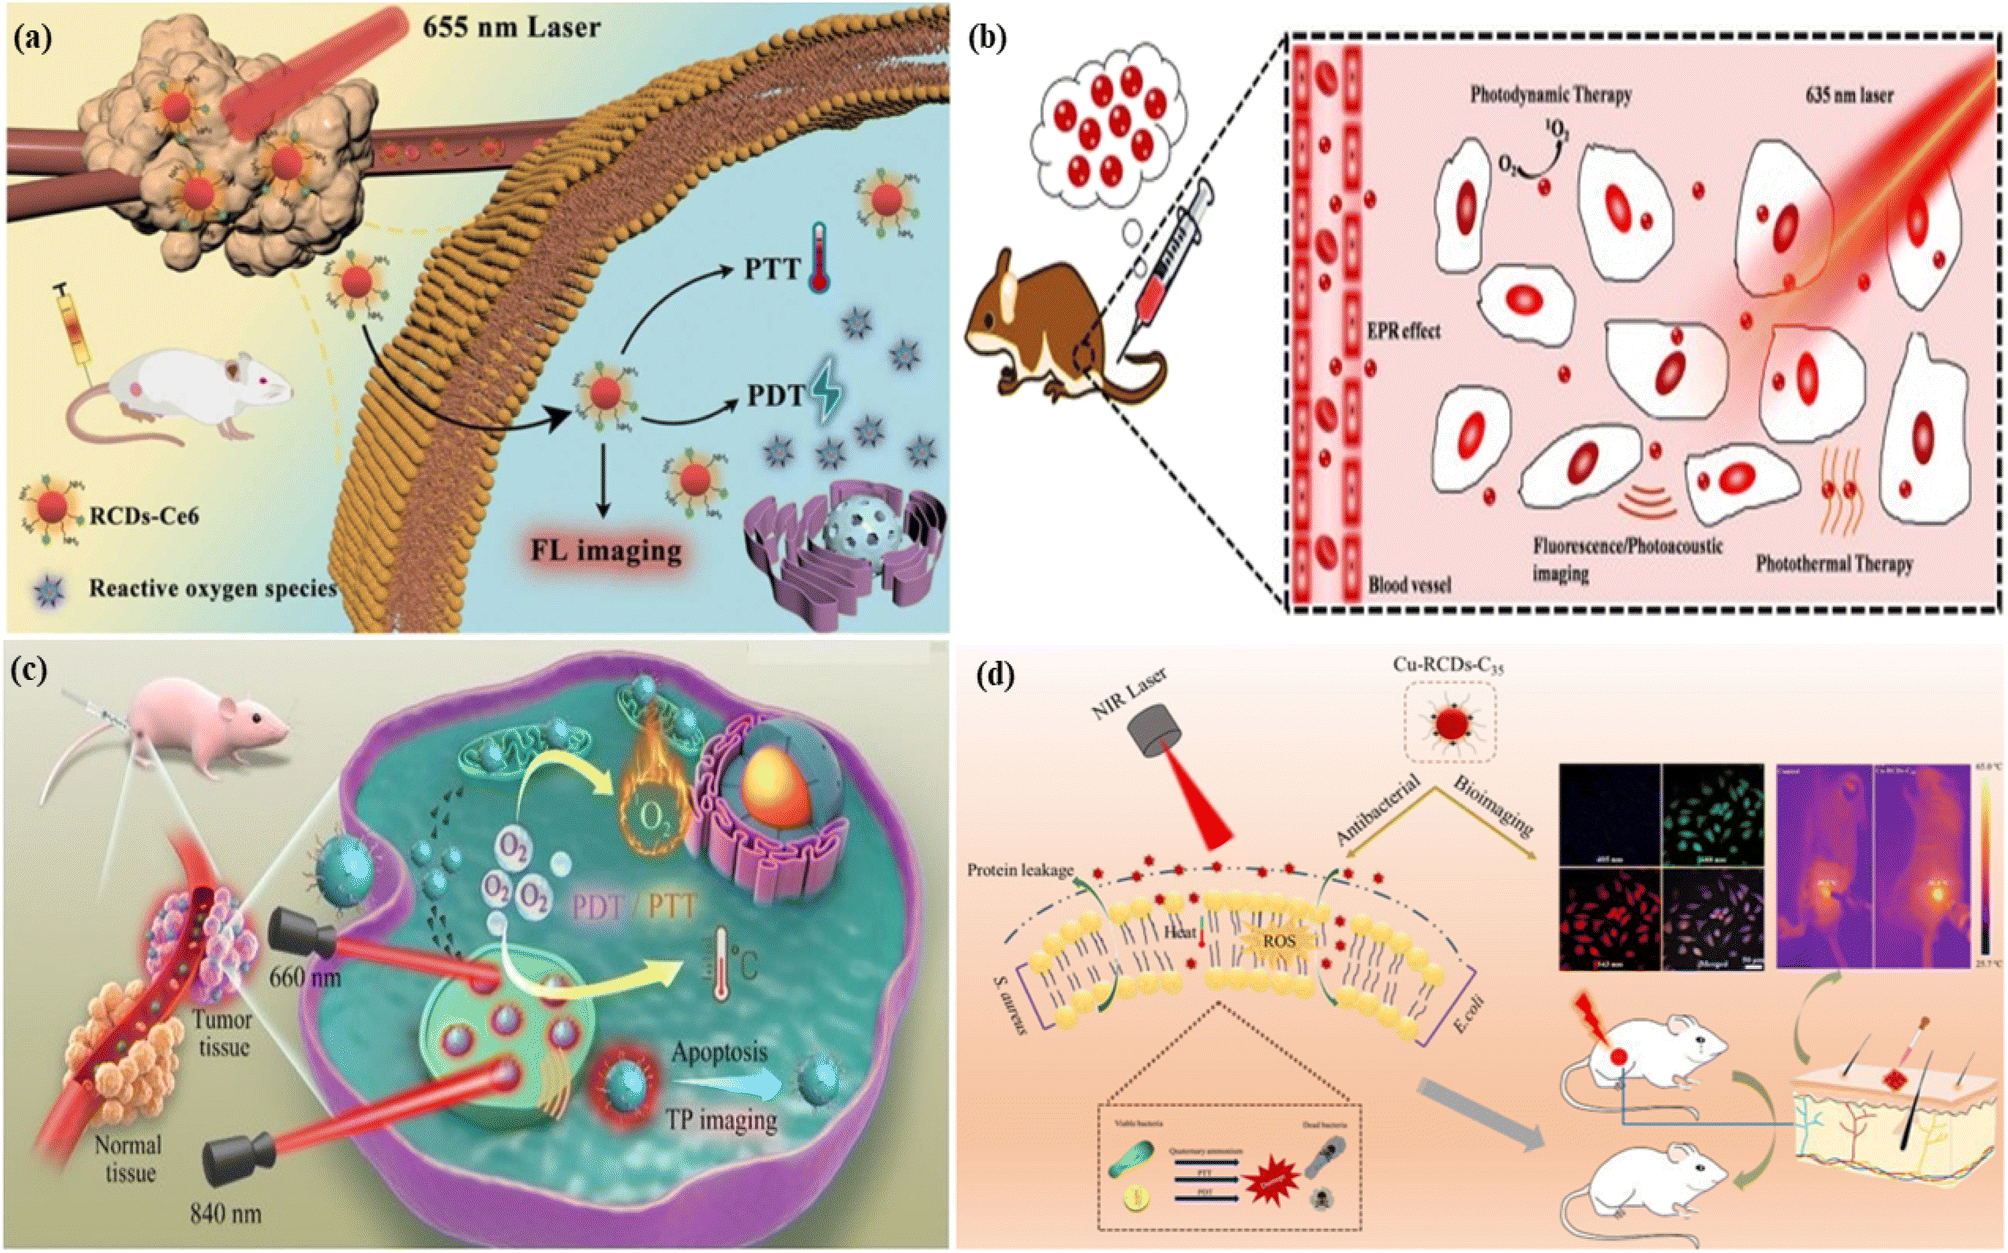 | ||
| Fig. 12 Representation of the synergistic therapy: (a) chlorin-e6 doped red fluorescent carbon dot-based hybrid nanoplatform for synergistic photodynamic and photothermal therapy. Reprinted with permission from ref. 399, Copyright 2023, Elsevier; (b) red carbon dots for the synergistic bimodal photodynamic and photothermal therapy of cancer. Reprinted with permission from ref. 397, Copyright 2018, Elsevier; (c) sulphur and nitrogen co-doped two-photon emissive red carbon dots for the synergistic therapy of the tumour cell. Reprinted with permission from ref. 395, Copyright 2021, American Chemical Society; (d) copper doped and cocamidopropyl betaine conjugated red carbon dots for the bioimaging assisted synergistic therapy of cancer affected cells. Reprinted with permission from ref. 400, Copyright 2021, Elsevier. | ||
5.1.2.4. Sonodynamic therapy. The name suggests that it involves sound. Sonodynamic therapy is an ultrasound-assisted therapeutic approach. The activation process using non-toxic sonosensitizers in the presence of molecular oxygen produced an excessive amount of reactive oxygen to destroy cancer-affected cells.401,402 It is similar to photodynamic therapy but employs ultrasound stimulation as the stimulus rather than light. This therapy penetrates affected tissues more deeply, in contrast to photodynamic therapy.403,404 The combination of photodynamic therapy and sonodynamic therapy is known as sono-photodynamic therapy and often involves both illuminated photon and ultrasound wave sensitizers. As a result, these types of therapy exhibit deeper penetrating power.405,406 Ju et al. reported deep red emissive hydrophilic graphene quantum dots as a sensitizer for generating reactive oxygen molecules by ultrasound activation. The ultrasonic-assisted reactive oxygen stimulation potential of red graphene quantum dots was examined by using 2,7-dichlorodihydrofluorescein diacetate. It was observed that compared to other sensitizers, the red graphene quantum dots help in the high-level generation of reactive oxygen species which helps in cancer therapy, Fig. 13(d). After six hours, superior production of reactive oxygen species was observed with ultrasonic assistance (green colour), Fig. 13(b). In contrast, the production of reactive oxygen species was not seen in the case of ultrasonic assistance, Fig. 13(b). The damage of lysosomes and their removal through the production of reactive oxygen species were seen with ultrasonic treatment. The lysosome removal was compared with and without ultrasonic assistance, Fig. 13(c).407 Geng et al. demonstrated near infrared phosphorescent carbon dots as a sonosensitizer with a narrow band gap and long-life triplet excited state. These properties help in sonodynamic tumour therapy under low-intensity ultrasound sound activation. The carbon dots produced ingenious p-type and n-type junctions and a narrow band to increase the charge separation dynamics with near-infrared absorption and emission. This specific electron withdrawing and electron donating electronic state enriches the low energy carrier excitation and highly efficient charge separation of the carbon dots. The p-type and n-type junctions enable effective high 1O2 generation under ultrasonic irradiation via a three-step mechanism. In the first step, highly efficient p–n junction-mediated inhibition of e−–h+ pair recombination took place, followed by sustained triplet state-mediated 1O2 generation in the second step. The third step involved employing overemphasized glutathione as a hole sacrificial agent to reduce glutathione levels which was oxidized to glutathione disulfide. The developed carbon dot-based near-infrared bioimaging assisted sonodynamic therapy targeted cancer-affected cells, Fig. 13(a).408 Wei et al. proposed titanium dioxide and silica-assisted carbon dots exhibited outstanding photothermal effects and photodynamic properties for sonodynamic therapy. These carbon dots played a key role in the diagnosis of carcinogenic tumor effectively.409
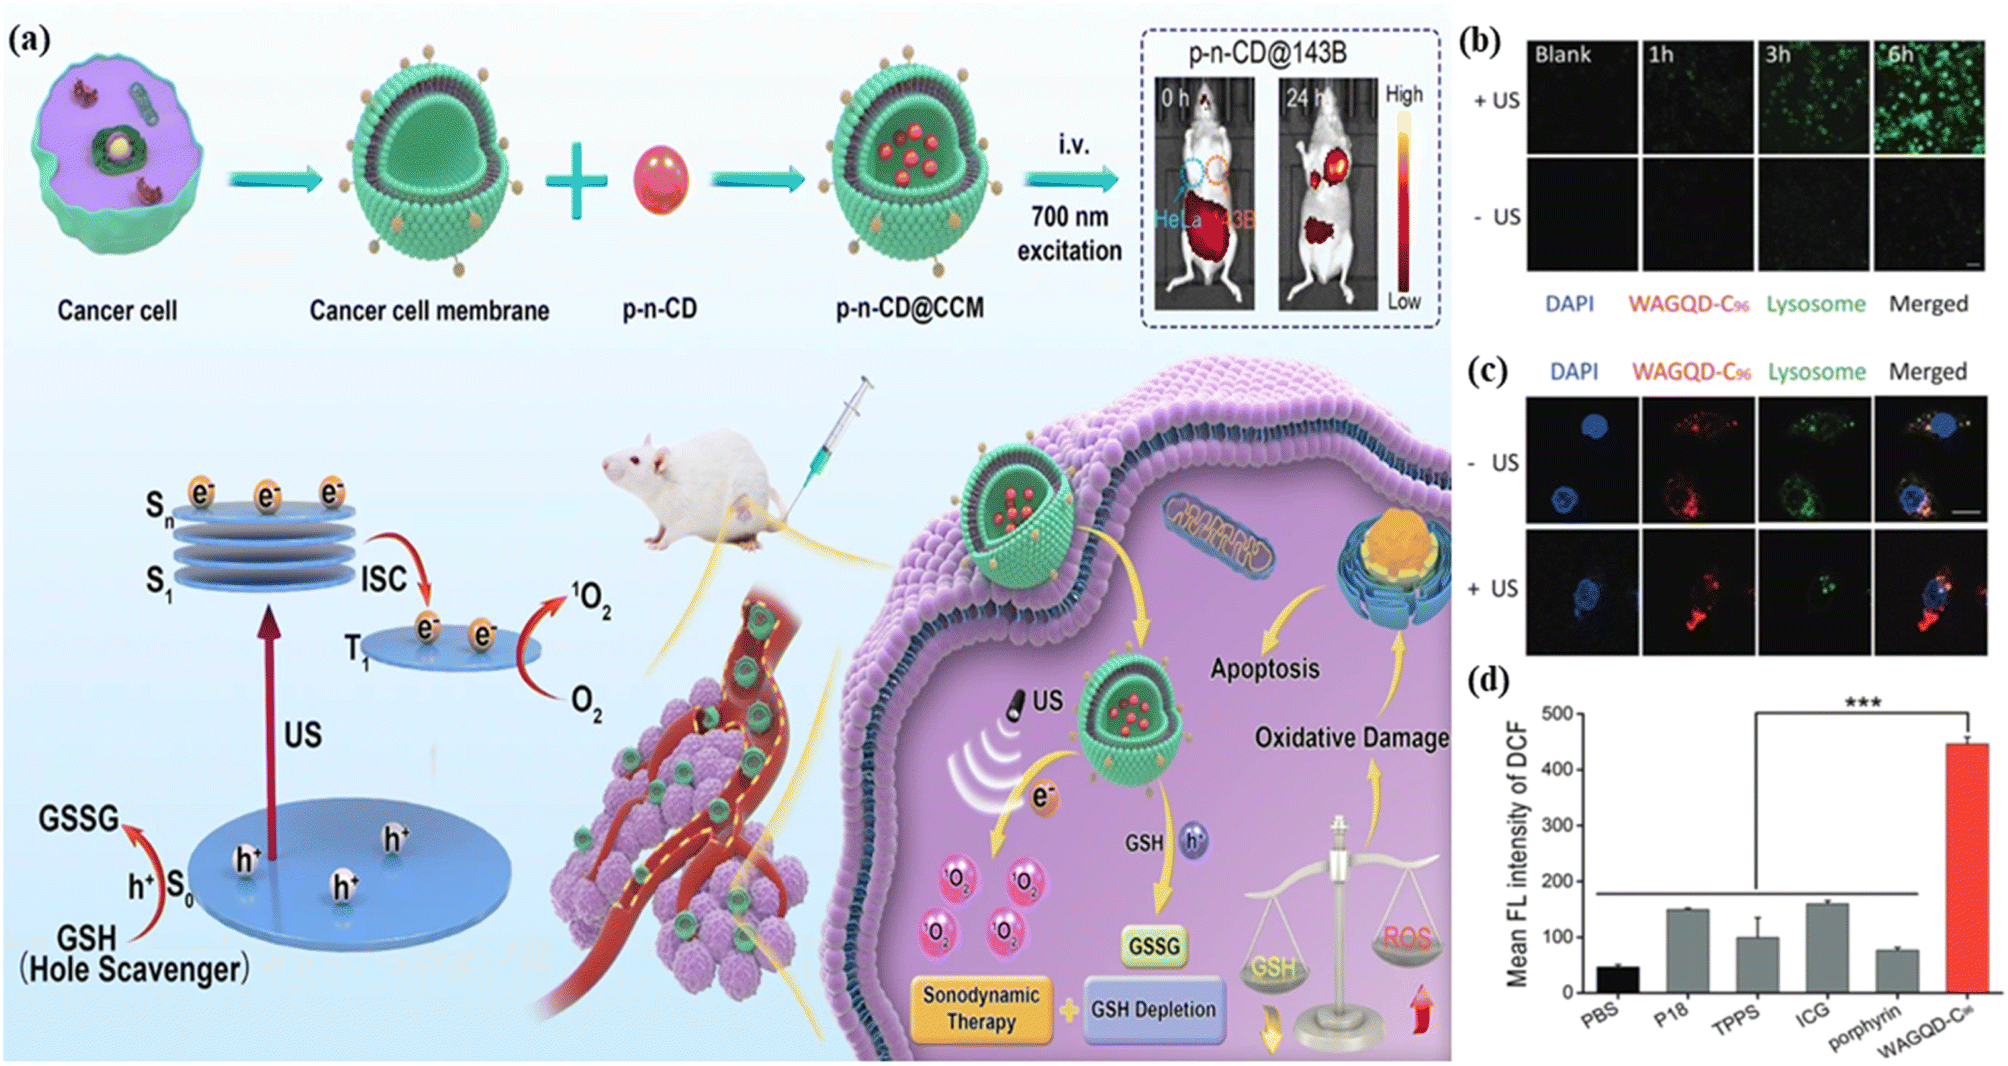 | ||
| Fig. 13 (a) The representation of mechanism and design of sonodynamic therapy for cancer cells using the infrared-excited red carbon dots; (b) the comparison of reactive oxygen species generation using red graphene quantum dots with (top) and without (bottom) ultrasonic assistance; (c) the comparison of lysosome removal with (top) and without (bottom) ultrasonic assistance (d) the comparison bar digram of reactive oxygen species generation using red graphene quantum dots sensitizer vs other sensitizers. | ||
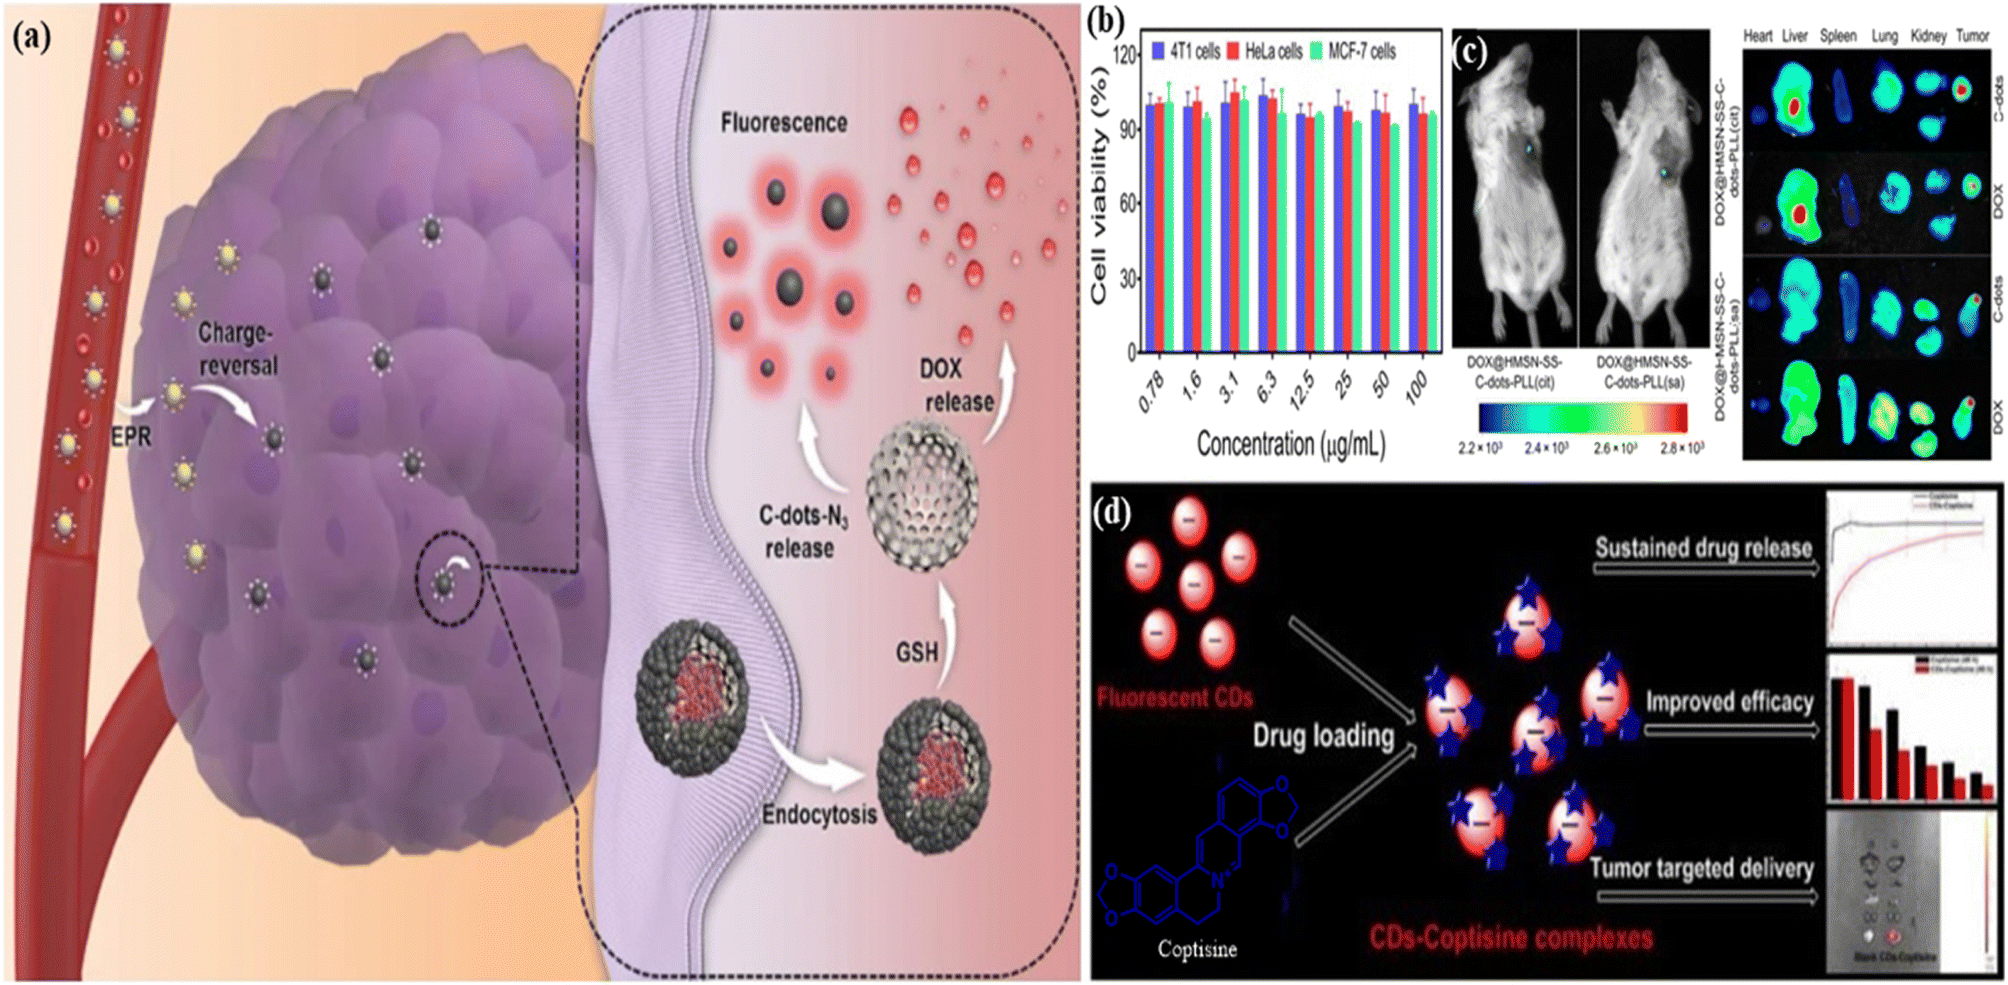 | ||
| Fig. 14 (a) Graphical representation of red FCNMs as a nanocarrier for drug delivery in the tumour cell with the anticancer mechanism; (b) the cell viability of different types of cells including 4T1 (blue), MCF-7 (green), and HeLa (red) cells; (c) the fluorescence images of breast-cancer infected mice after being injected with the red emissive hollow silica nanoparticle doped disulphide linked and doxorubicin hydrochloride (DOX) loaded carbon dots and biodistribution of the red carbon dots and doxorubicin hydrochloride in the mice, as shown on the side. Reprinted with permission from ref. 416, Copyright 2021, Springer; (d) the illustration of the red carbon dots as a nanocarrier of coptisine for effective therapy of cancer with several advantages including sustained drug release, improved efficiency and tumour targeted delivery. Reprinted with permission from ref. 415, Copyright 2021, Wiley-VCH GmbH. | ||
5.2. In vivo and vitro sensing
Fluorogenic sensing is widely utilized for the identification of biomolecules or metal ions or the pH of the solution because of its high sensitivity, high selectivity, high specificity, high resistance for light scattering and ease of use. The difference between the fluorescence intensities of the reference and sample is utilized to determine the sensing target both qualitatively and quantitatively when excitation by light energy occurs.418,419 The main requirements for a good sensor are target selectivity, strong response, great stability, very low limit of detection, and very high sensitivity. Various types of fluorogenic sensors have been reported till now.420,421 Among them, red FCNMs attract a lot of attention as a sensor in vivo and in vitro because of their small size, low toxicity, easy-to-surface modification, excellent stability, tunable behavior, high signal-to-noise ratio and large penetration depth.422 Mainly are there three types of sensing including metal ion sensing, organic molecule sensing and pH sensing.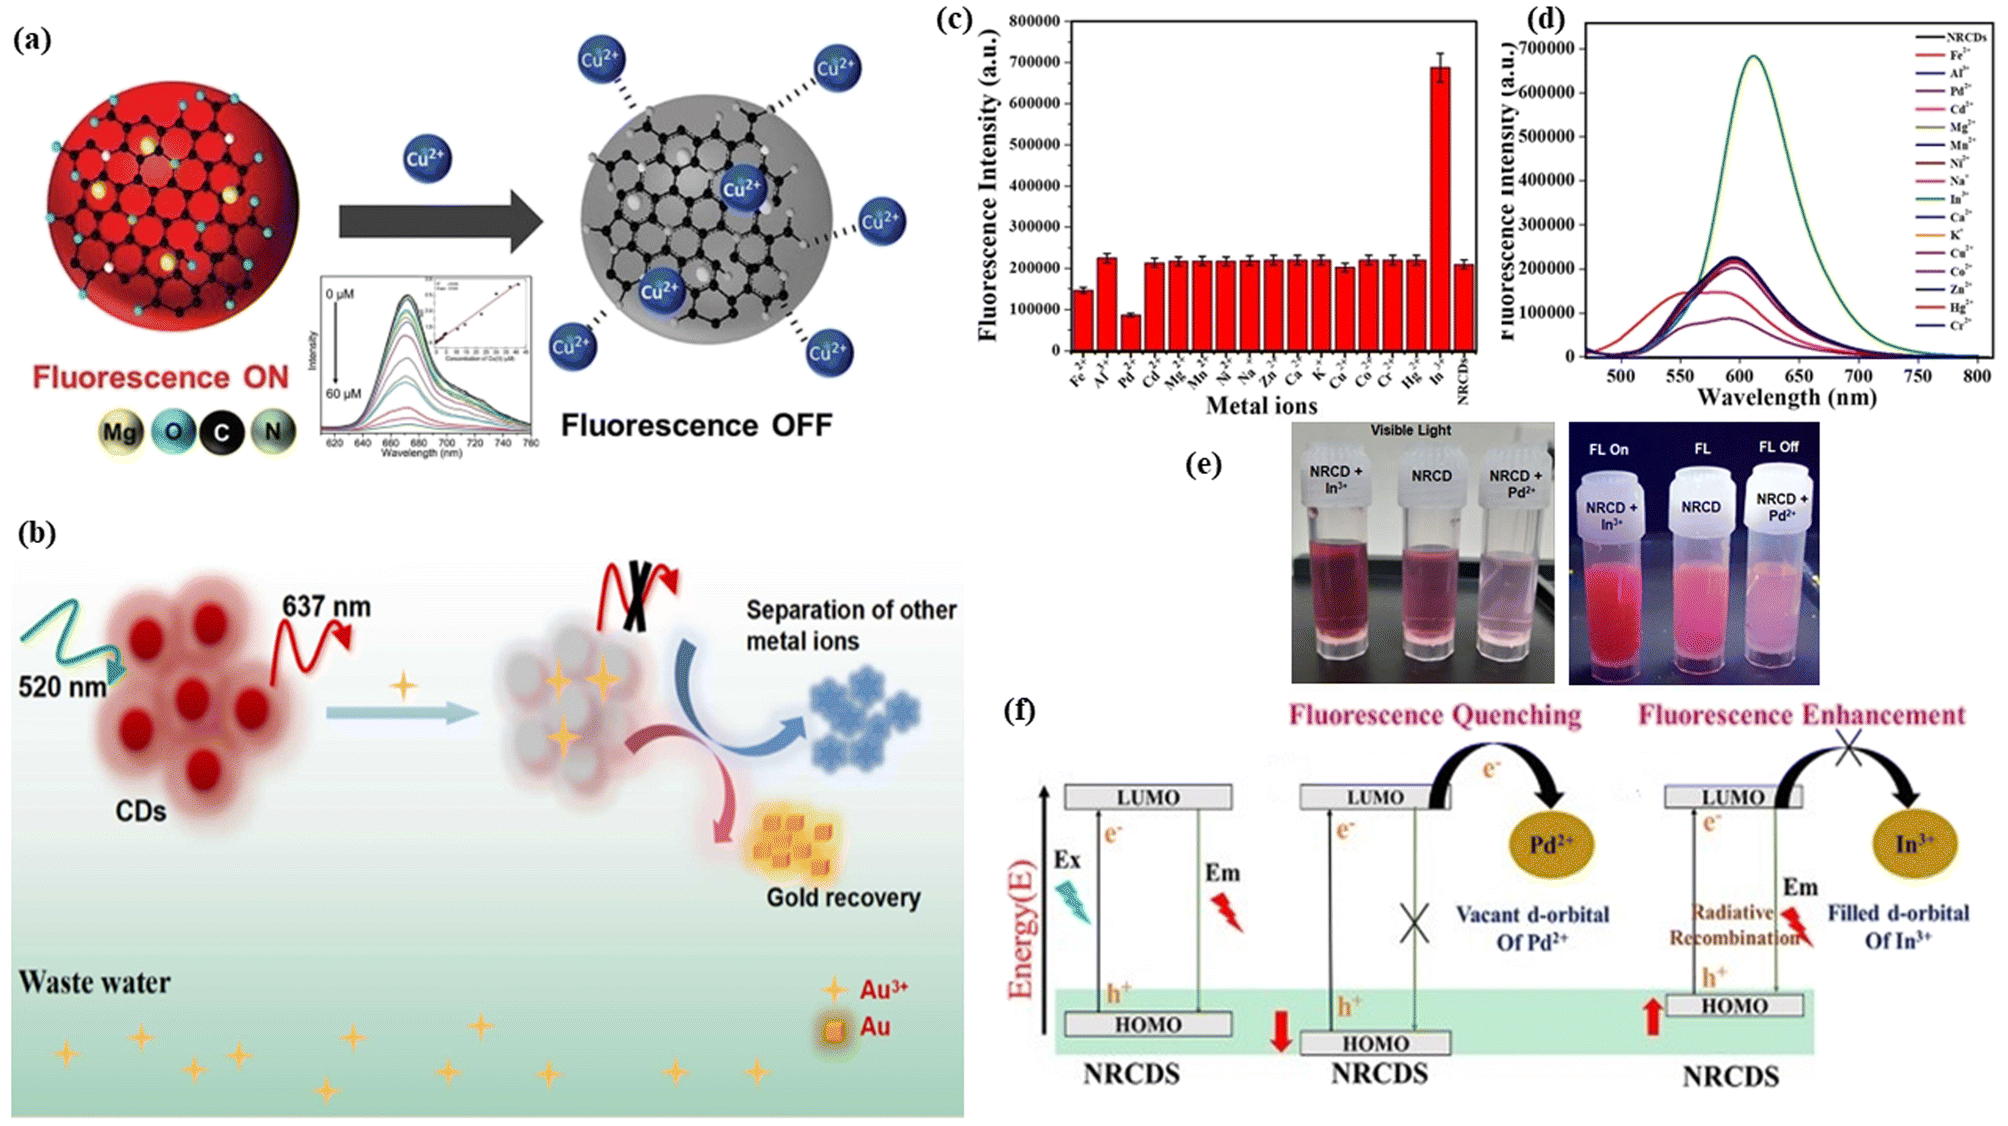 | ||
| Fig. 15 Schematic illustration of metal ion sensing: (a) representation of the fluorescence quenching noted as fluorescence “ON–OFF” as a result of di-valent copper interactions with red carbon dots, and the fluorescence intensity decreases with increasing concentration of copper ions as shown in the inset. Reprinted with permission from ref. 429, Copyright 2018, Royal Society of Chemistry; (b) the red fluorescent carbon dots with an emission wavelength of 637 nm at the excitation of the 520 nm wavelength for the detection of gold in wastewater as a quenching effect in fluorescence and gold can be recovered via a redox reaction. Reprinted with permission from ref. 199, Copyright 2022, Elsevier; (c) the bar plot of the emission intensity changes with various metal ion concentrations at the 460 nm excitation wavelength; (d) the selectivity study of the emission spectra of red carbon dots; (e) the fluorescence “ON–OFF” images of the trivalent indium mixed carbon dots, red carbon dots and di-valent palladium mixed carbon dots at the 365 nm excitation wavelength of UV light with visible light images of the trivalent indium mixed carbon dots, red carbon dots and di-valent palladium mixed carbon dots respectively; (f) the fluorescence and quenching mechanism of red carbon dots, di-valent palladium mixed red carbon dots and trivalent indium mixed carbon dots, respectively. Reprinted with permission from ref. 428, Copyright 2020, American Chemical Society. | ||
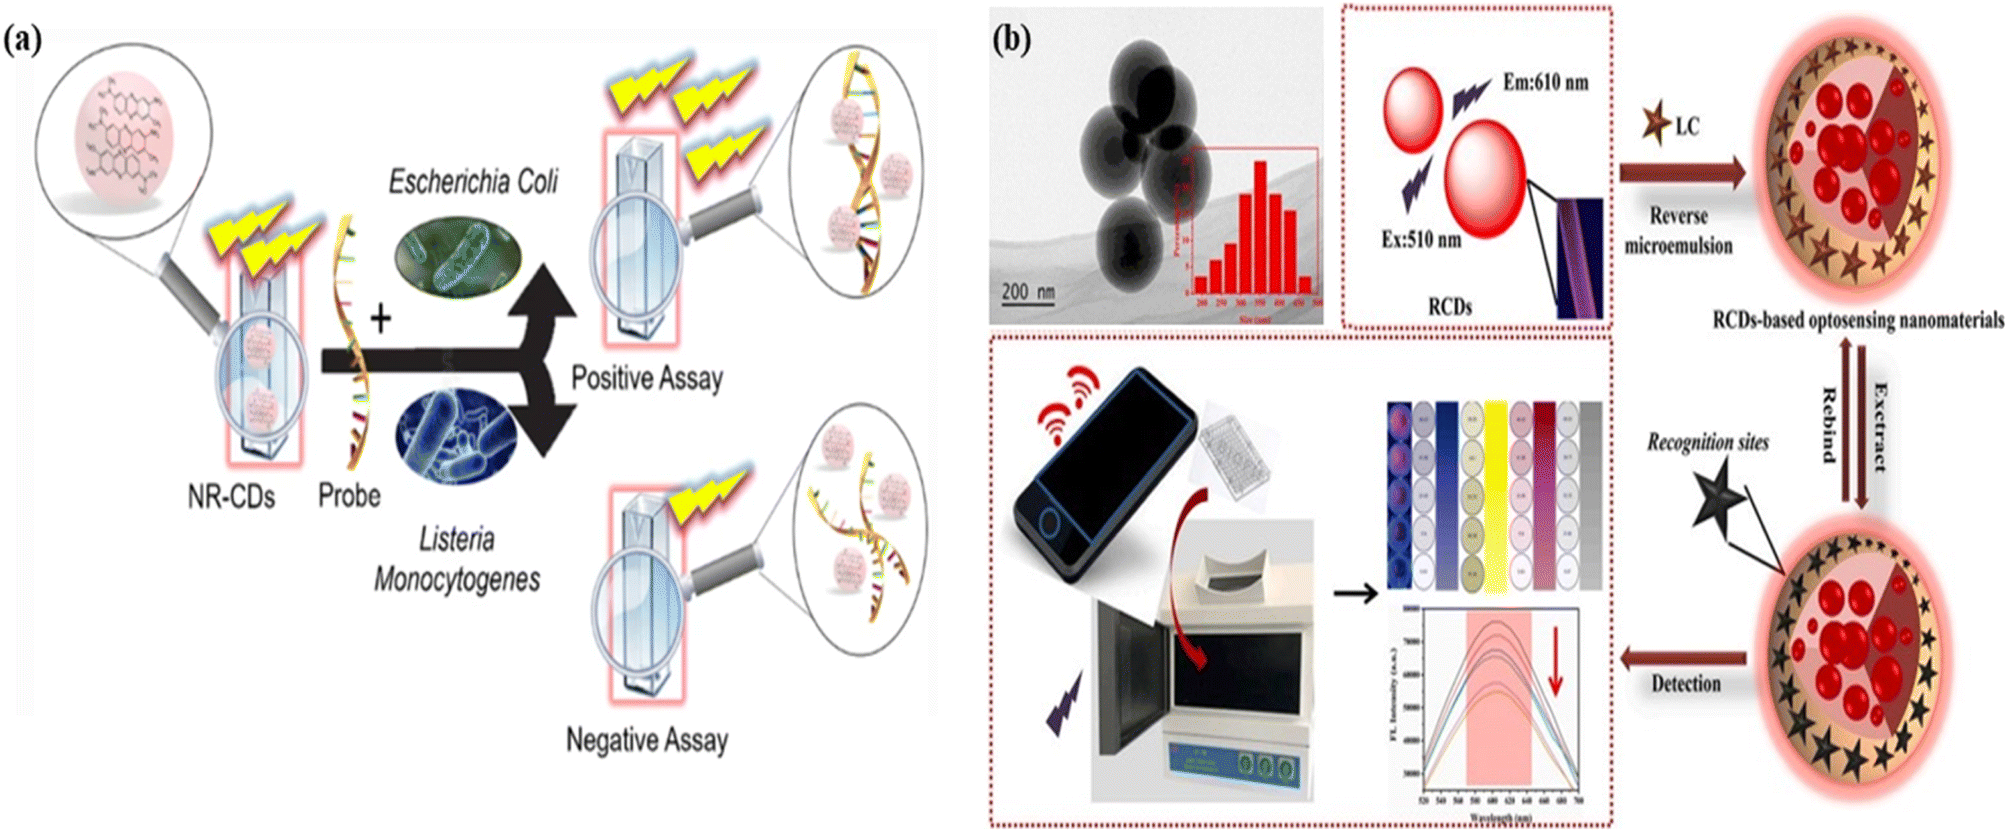 | ||
| Fig. 16 Graphical representation of carbon dots for sensing of organic molecules: (a) the red carbon dots as a fluorescent probe for the identification of the specific DNA sequence of Escherichia coli bacteria. Reprinted with permission from ref. 435, Copyright 2022, Springer; (b) red fluorescent carbon dots with a smartphone-based signal output terminal for the identification of Lambda-Cyhalothrin (LC) pesticides in tea. Reprinted with permission from ref. 437, Copyright 2021, Elsevier. | ||
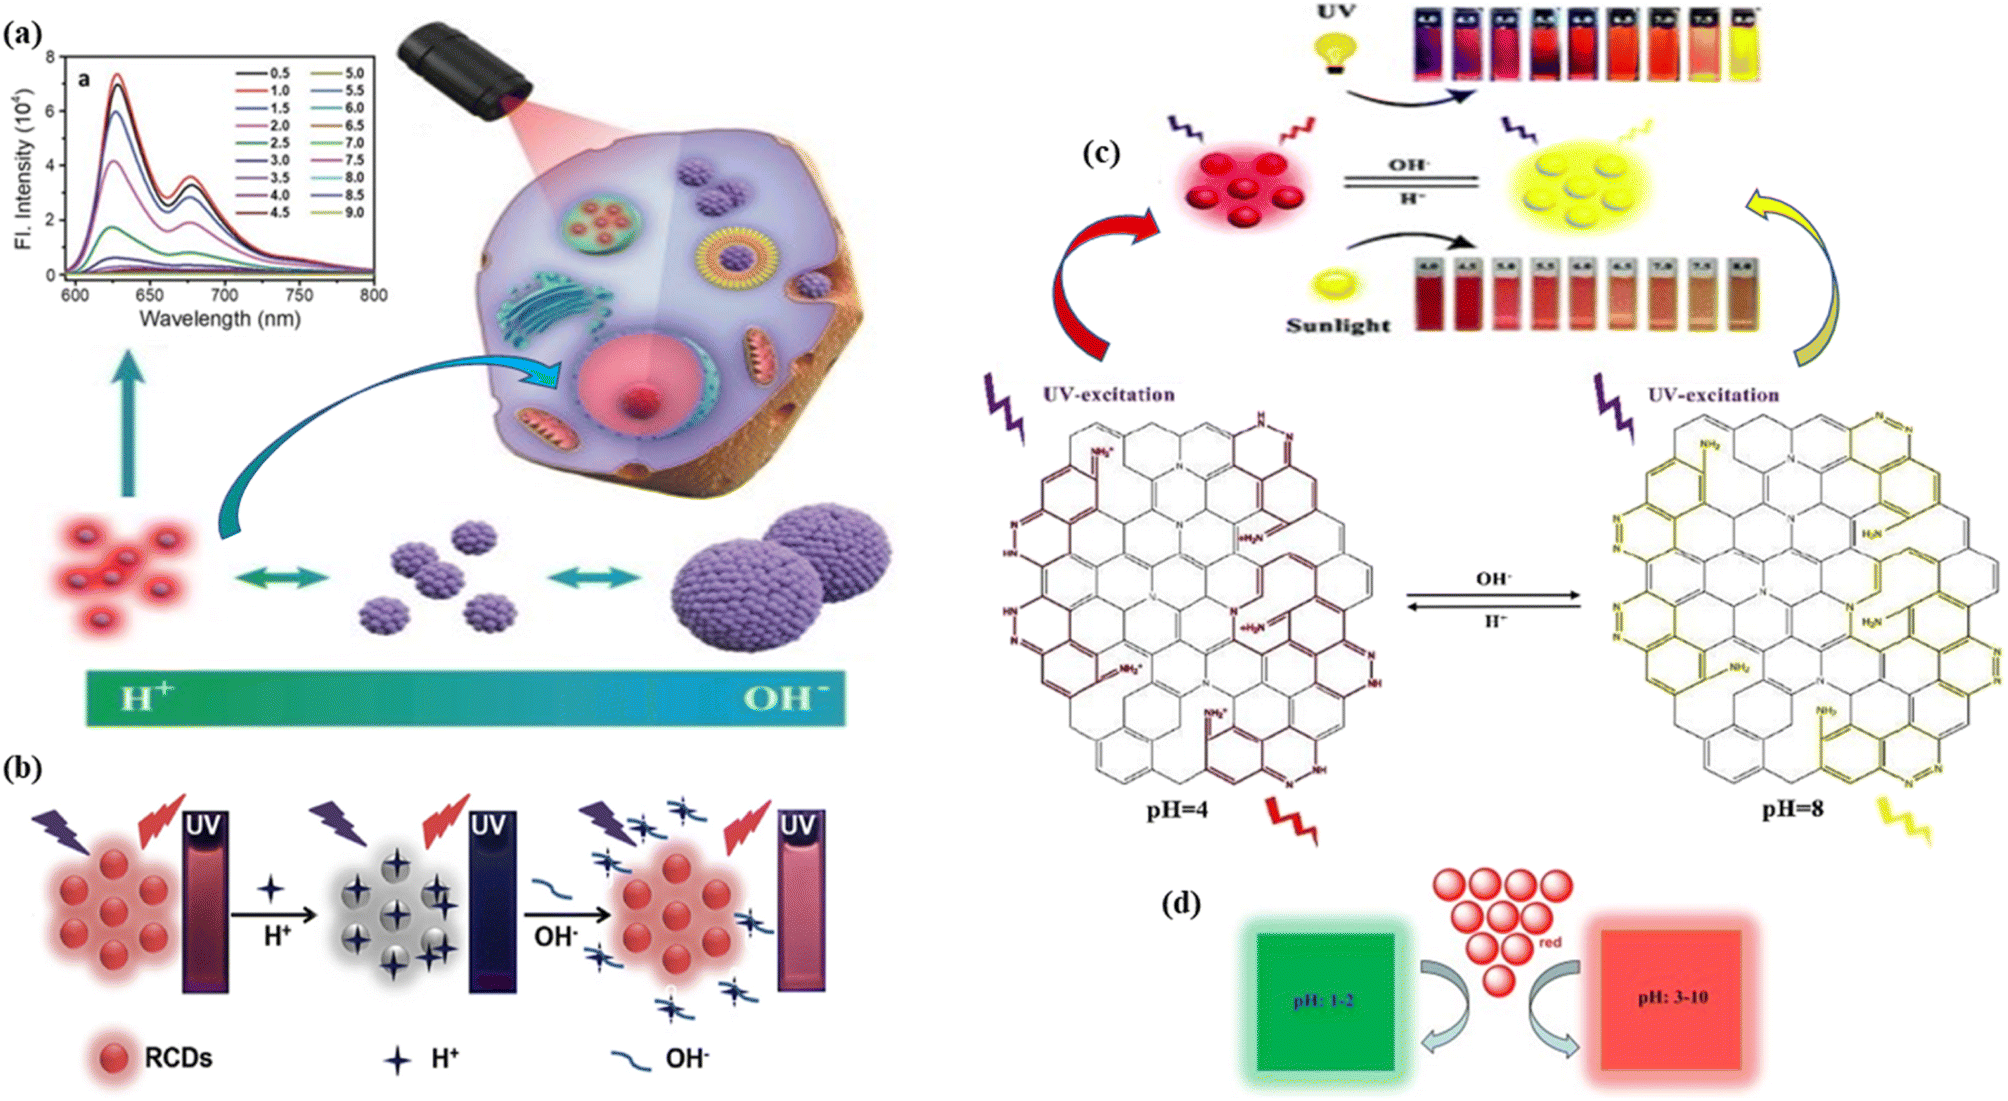 | ||
| Fig. 17 Schematic representation of pH sensing of red carbon dots: (a) red carbon dots for two-photon pH imaging with pH-dependent fluorescence emission spectra at 573 nm excitation in the inset. Reprinted with permission from ref. 442, Copyright 2019, WILEY-VCH Verlag GmbH & Co. KGaA, Weinheim; (b) the red carbon dot based “on–off–on” sensing of pH with increasing concentration of H+ (acidic) and OH− (basic). Reprinted with permission from ref. 443, Copyright 2019, Elsevier; (c) red carbon dots for colorimetric and fluorogenic sensing of pH with structural colour change from red to yellow, when changing the pH from 4 to 8. Reprinted with permission from ref. 440, Copyright 2020, Royal Society of Chemistry; (d) the pH colour change of red carbon dots to green at pH 1–2 and red at pH 3–10. Reprinted with permission from ref. 438, Copyright 2019, Royal Society of Chemistry. | ||
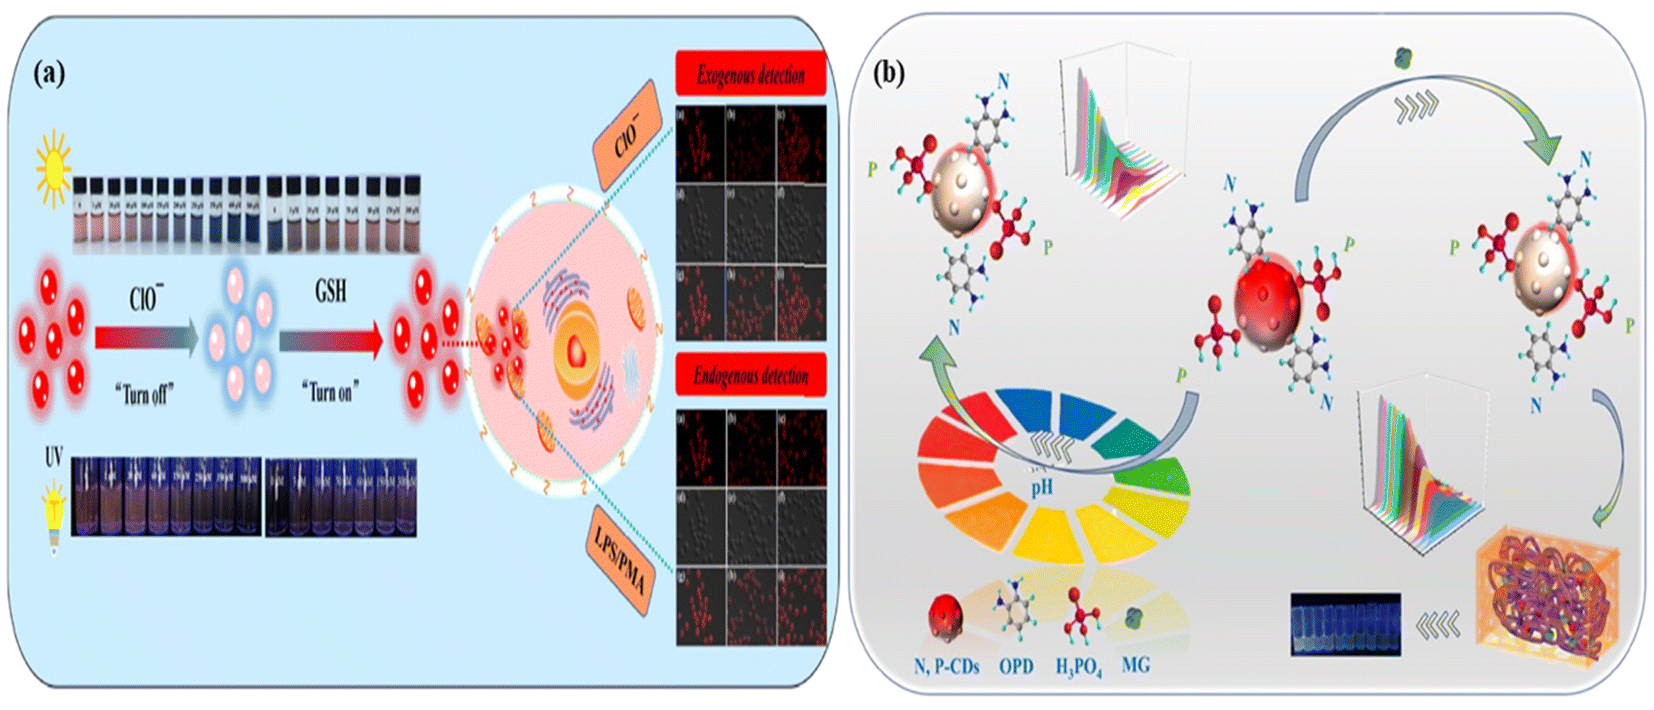 | ||
| Fig. 18 (a) Schematic representation of red-emitting carbon dots as an “on–off–on” switchable sensor for the detection of CIO− and GSH and the exogenous and endogenous identification of hypochlorite and glutathione in red carbon dot embedded living cells using fluorescence images. Reprinted with permission from ref. 195, Copyright 2022, Elsevier; (b) schematic representation of red-emitting nitrogen and phosphorus co-doped carbon dots for the detection of toxic dye malachite green and pH. Reprinted with permission from ref. 449, Copyright 2023, Elsevier. | ||
5.3. Energy
![[thin space (1/6-em)]](https://www.rsc.org/images/entities/char_2009.gif) 000 hours longer. The high performance of LEDs includes microsecond level ultrafast response, a large range of programmable color temperatures including 4500 K to 12000 K, and a larger operating temperature range including −20 °C to 85 °C. Because of their low UV radiation and lack of mercury, LEDs are also sustainable and environment-friendly products.452,453 LEDs can illuminate light in a wide range of spectral bands including red, yellow, green, and blue from small bands to a larger white light band with a variable distribution of illuminating strength. LEDs generate light due to the electroluminescence phenomenon that occurs at the p–n junction. When a p–n junction is driven in the upward orientation, holes are pumped from the p-junction across the active layer into the n-junction, and electrons in the n-junction have enough energy to flow across the boundary layer into the p-junction.454,455 FCNMs attracted attention as light emitting diodes for having superior optical properties, high photostability, low cost, and ease of synthesis. Solid-state FCNMs showed a notable fluorescence redshift in contrast to their aqueous solution due to supramolecular crossing-linking between neighboring carbon nanomaterials, indicating the possibility for solid-state light emitting diode (LED) applications.456–458 Zhang et al. reported high thermal and photostable red fluorescent carbon dots with self-quenching resistant properties. The red carbon dots were integrated with Ce3+:Y3Al5O12 to develop high-quality warm white light-emitting diodes.459 Cai et al. prepared red, blue and green fluorescence carbon dots with solubility in both aqueous solutions via a solvothermal treatment. The individual polymer coated red, green and blue composites glow with bright red, green and blue colours respectively, when under 360 nm wavelength excitation, Fig. 19(i). The as-prepared blue, green and red carbon dots were mixed with polyvinylpyrrolidone polymer to build ultraviolet-assisted white light-emitting diodes, which cover the entire range of visible light. The fluorescence spectra of the mixed carbon dot coated polymer composite are illustrated at excitation 360 nm and 340 nm wavelengths in Fig. 19(k). The CIE colour coordinate of the developed white light-emitting diodes was calculated to be (0.33, 0.33), similar to sunlight, Fig. 19(j). The fluorescence spectrum of white light emitting diodes maintained good luminescence with very low photobleaching, following a 15 day exposure to ultraviolet light, Fig. 19(l).460 Zhu et al. developed red fluorescent carbon dots by the surface modification of nitrogen via treatment with hexadecyl trimethyl ammonium bromide. They dissolved the red carbon dots with blue and green carbon dots to develop UV-excited white light-emitting diodes with a high colour rendering index.461 Zhai et al. fabricated red-emitting carbon dots and green-emitting carbon dots. The green-emitting carbon dots are mixed with starch to get luminescence solid-state phosphor materials. Similarly, red carbon dots are mixed with polyvinyl pyrrolidone polymer to get solid-state phosphor materials. The green and red phosphors were mixed with epoxy-silicone to get differently shaped luminescent materials without changing the initial fluorescence wavelength. Under blue light excitation, the green phosphor glows with bright green light and the red phosphor glow with bright red light under green light excitation, Fig. 19(g). When both blue and red phosphors were installed in commercially available blue-emitting InGaN LED chips (with an emission peak at 450 nm) and after solidification for one hour at 80 °C, a cool WLEDs with CIE color coordinates of (0.27, 0.28) and CCT of 12942 K were derived, Fig. 19(a). The emission spectra of the cool white light emitting diodes were also recorded, inset of Fig. 19(a). A WLED prototype was achieved by first exciting the green phosphors, and then red phosphors, Fig. 19(h). A yellow-green light was emitted when the green phosphor was taken under the blue-emitting InGaN LED chips, Fig. 19(b). The CIE colour coordinate chromaticity plot of both WLEDs and yellow LEDs was obtained, Fig. 19(c). Various colour pen caps were taken under produced WLEDs to confirm the e-colour rendering properties, Fig. 19(d). The same experiment was done under sunlight, Fig. 19(e). No such difference was found. The emission spectra of the working WLED are illustrated, in Fig. 19(f). The produced white light emitting phosphor illuminated very brightly under UV light excitation with a high colour rendering index and colour coordinate.462 An et al. reported red carbon dots using solvothermal treatment of 1,4-diaminonaphthalene. The red carbon dots possess a tunable emission wavelength when treated with various organic solvents. The red carbon dots are utilized as red light-emitting diodes.463 Kumari et al. produced red, orange and green colour emitting carbon dots for colour emitting diodes. The multicolour carbon dots are mixed with polyvinyl alcohol to get red, orange and green phosphors individually. A fluorescent solid polymeric film is prepared by combining the three phosphors for the application of monochromatic and white light-emitting diodes.464
000 hours longer. The high performance of LEDs includes microsecond level ultrafast response, a large range of programmable color temperatures including 4500 K to 12000 K, and a larger operating temperature range including −20 °C to 85 °C. Because of their low UV radiation and lack of mercury, LEDs are also sustainable and environment-friendly products.452,453 LEDs can illuminate light in a wide range of spectral bands including red, yellow, green, and blue from small bands to a larger white light band with a variable distribution of illuminating strength. LEDs generate light due to the electroluminescence phenomenon that occurs at the p–n junction. When a p–n junction is driven in the upward orientation, holes are pumped from the p-junction across the active layer into the n-junction, and electrons in the n-junction have enough energy to flow across the boundary layer into the p-junction.454,455 FCNMs attracted attention as light emitting diodes for having superior optical properties, high photostability, low cost, and ease of synthesis. Solid-state FCNMs showed a notable fluorescence redshift in contrast to their aqueous solution due to supramolecular crossing-linking between neighboring carbon nanomaterials, indicating the possibility for solid-state light emitting diode (LED) applications.456–458 Zhang et al. reported high thermal and photostable red fluorescent carbon dots with self-quenching resistant properties. The red carbon dots were integrated with Ce3+:Y3Al5O12 to develop high-quality warm white light-emitting diodes.459 Cai et al. prepared red, blue and green fluorescence carbon dots with solubility in both aqueous solutions via a solvothermal treatment. The individual polymer coated red, green and blue composites glow with bright red, green and blue colours respectively, when under 360 nm wavelength excitation, Fig. 19(i). The as-prepared blue, green and red carbon dots were mixed with polyvinylpyrrolidone polymer to build ultraviolet-assisted white light-emitting diodes, which cover the entire range of visible light. The fluorescence spectra of the mixed carbon dot coated polymer composite are illustrated at excitation 360 nm and 340 nm wavelengths in Fig. 19(k). The CIE colour coordinate of the developed white light-emitting diodes was calculated to be (0.33, 0.33), similar to sunlight, Fig. 19(j). The fluorescence spectrum of white light emitting diodes maintained good luminescence with very low photobleaching, following a 15 day exposure to ultraviolet light, Fig. 19(l).460 Zhu et al. developed red fluorescent carbon dots by the surface modification of nitrogen via treatment with hexadecyl trimethyl ammonium bromide. They dissolved the red carbon dots with blue and green carbon dots to develop UV-excited white light-emitting diodes with a high colour rendering index.461 Zhai et al. fabricated red-emitting carbon dots and green-emitting carbon dots. The green-emitting carbon dots are mixed with starch to get luminescence solid-state phosphor materials. Similarly, red carbon dots are mixed with polyvinyl pyrrolidone polymer to get solid-state phosphor materials. The green and red phosphors were mixed with epoxy-silicone to get differently shaped luminescent materials without changing the initial fluorescence wavelength. Under blue light excitation, the green phosphor glows with bright green light and the red phosphor glow with bright red light under green light excitation, Fig. 19(g). When both blue and red phosphors were installed in commercially available blue-emitting InGaN LED chips (with an emission peak at 450 nm) and after solidification for one hour at 80 °C, a cool WLEDs with CIE color coordinates of (0.27, 0.28) and CCT of 12942 K were derived, Fig. 19(a). The emission spectra of the cool white light emitting diodes were also recorded, inset of Fig. 19(a). A WLED prototype was achieved by first exciting the green phosphors, and then red phosphors, Fig. 19(h). A yellow-green light was emitted when the green phosphor was taken under the blue-emitting InGaN LED chips, Fig. 19(b). The CIE colour coordinate chromaticity plot of both WLEDs and yellow LEDs was obtained, Fig. 19(c). Various colour pen caps were taken under produced WLEDs to confirm the e-colour rendering properties, Fig. 19(d). The same experiment was done under sunlight, Fig. 19(e). No such difference was found. The emission spectra of the working WLED are illustrated, in Fig. 19(f). The produced white light emitting phosphor illuminated very brightly under UV light excitation with a high colour rendering index and colour coordinate.462 An et al. reported red carbon dots using solvothermal treatment of 1,4-diaminonaphthalene. The red carbon dots possess a tunable emission wavelength when treated with various organic solvents. The red carbon dots are utilized as red light-emitting diodes.463 Kumari et al. produced red, orange and green colour emitting carbon dots for colour emitting diodes. The multicolour carbon dots are mixed with polyvinyl alcohol to get red, orange and green phosphors individually. A fluorescent solid polymeric film is prepared by combining the three phosphors for the application of monochromatic and white light-emitting diodes.464
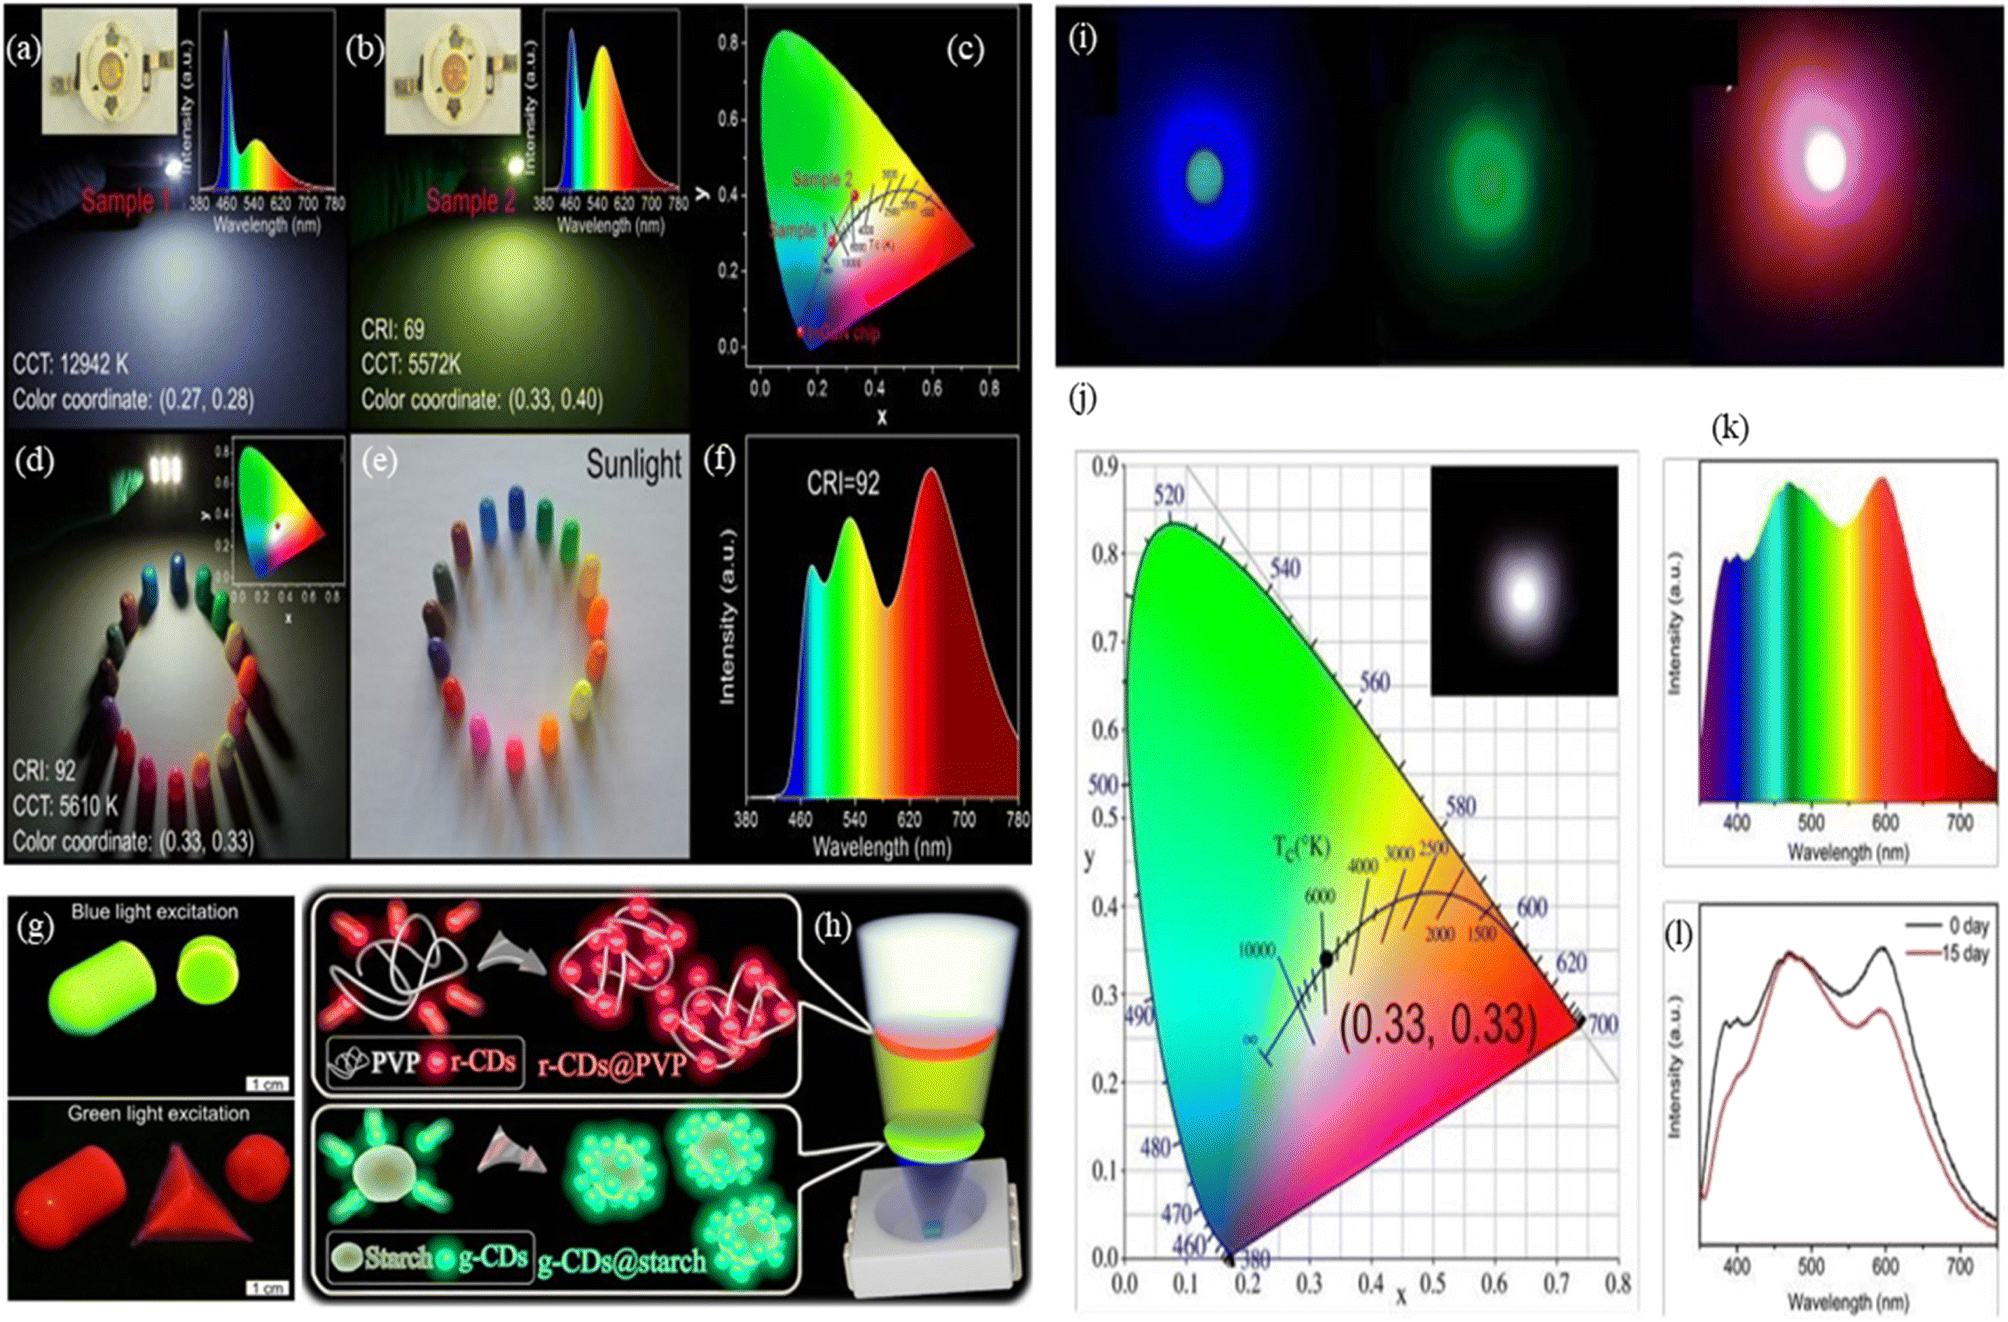 | ||
| Fig. 19 Schematic representation of the FCNM based LEDs: (a) optical image of the cool WLED with a CIE colour coordinate of (0.27, 0.28) and a CCT of 12942 K and the emission spectrum of the cool WLED is shown in the inset; (b) optical image of a yellow green LED with a CIE colour coordinate of (0.33, 0.40), a CCT of 5572 K, and a CRI of 69 and the emission spectrum of the yellow green LED is shown in the inset; (c) diagram of the CIE chromaticity colour coordinates of the cool WLED and yellow green LED; (d) image of various colour pen caps under working WLEDs with a CIE colour coordinate of (0.33, 0.33), CCT of 5610 K and CRI of 92 and the high CRI diagram of the CIE chromaticity colour coordinate of WLEDs in the inset at the right top corner; (e) image of various colour pen caps under daylight; (f) the emission spectrum of WLEDs as shown in (d); (g) carbon dot based green phosphors & epoxy-silicone resin under a long pass 495 nm blue light filter (top) and carbon dot based red phosphors & epoxy-silicone resin under a long pass 550 nm green light filter; (h) testing of the WLED prototype with the first excitation of the green phosphors, and then red phosphors, thereby achieving white light. Reprinted with permission from ref. 462, Copyright 2018, Elsevier; (i) the images of the monochromatic blue, green and red LED devices derived from polyvinylpyrrolidone-coated carbon dots, under same excitation; (j) the CIE colour coordinates of the white LEDs, the photo of the WLEDs upon excitation is shown in the inset; (k) the emitting light spectrum of WLEDs; (l) the emitting spectrum of WLEDs before and after 15 days, respectively. Reprinted with permission from ref. 460, Copyright 2019, Royal Society of Chemistry. | ||
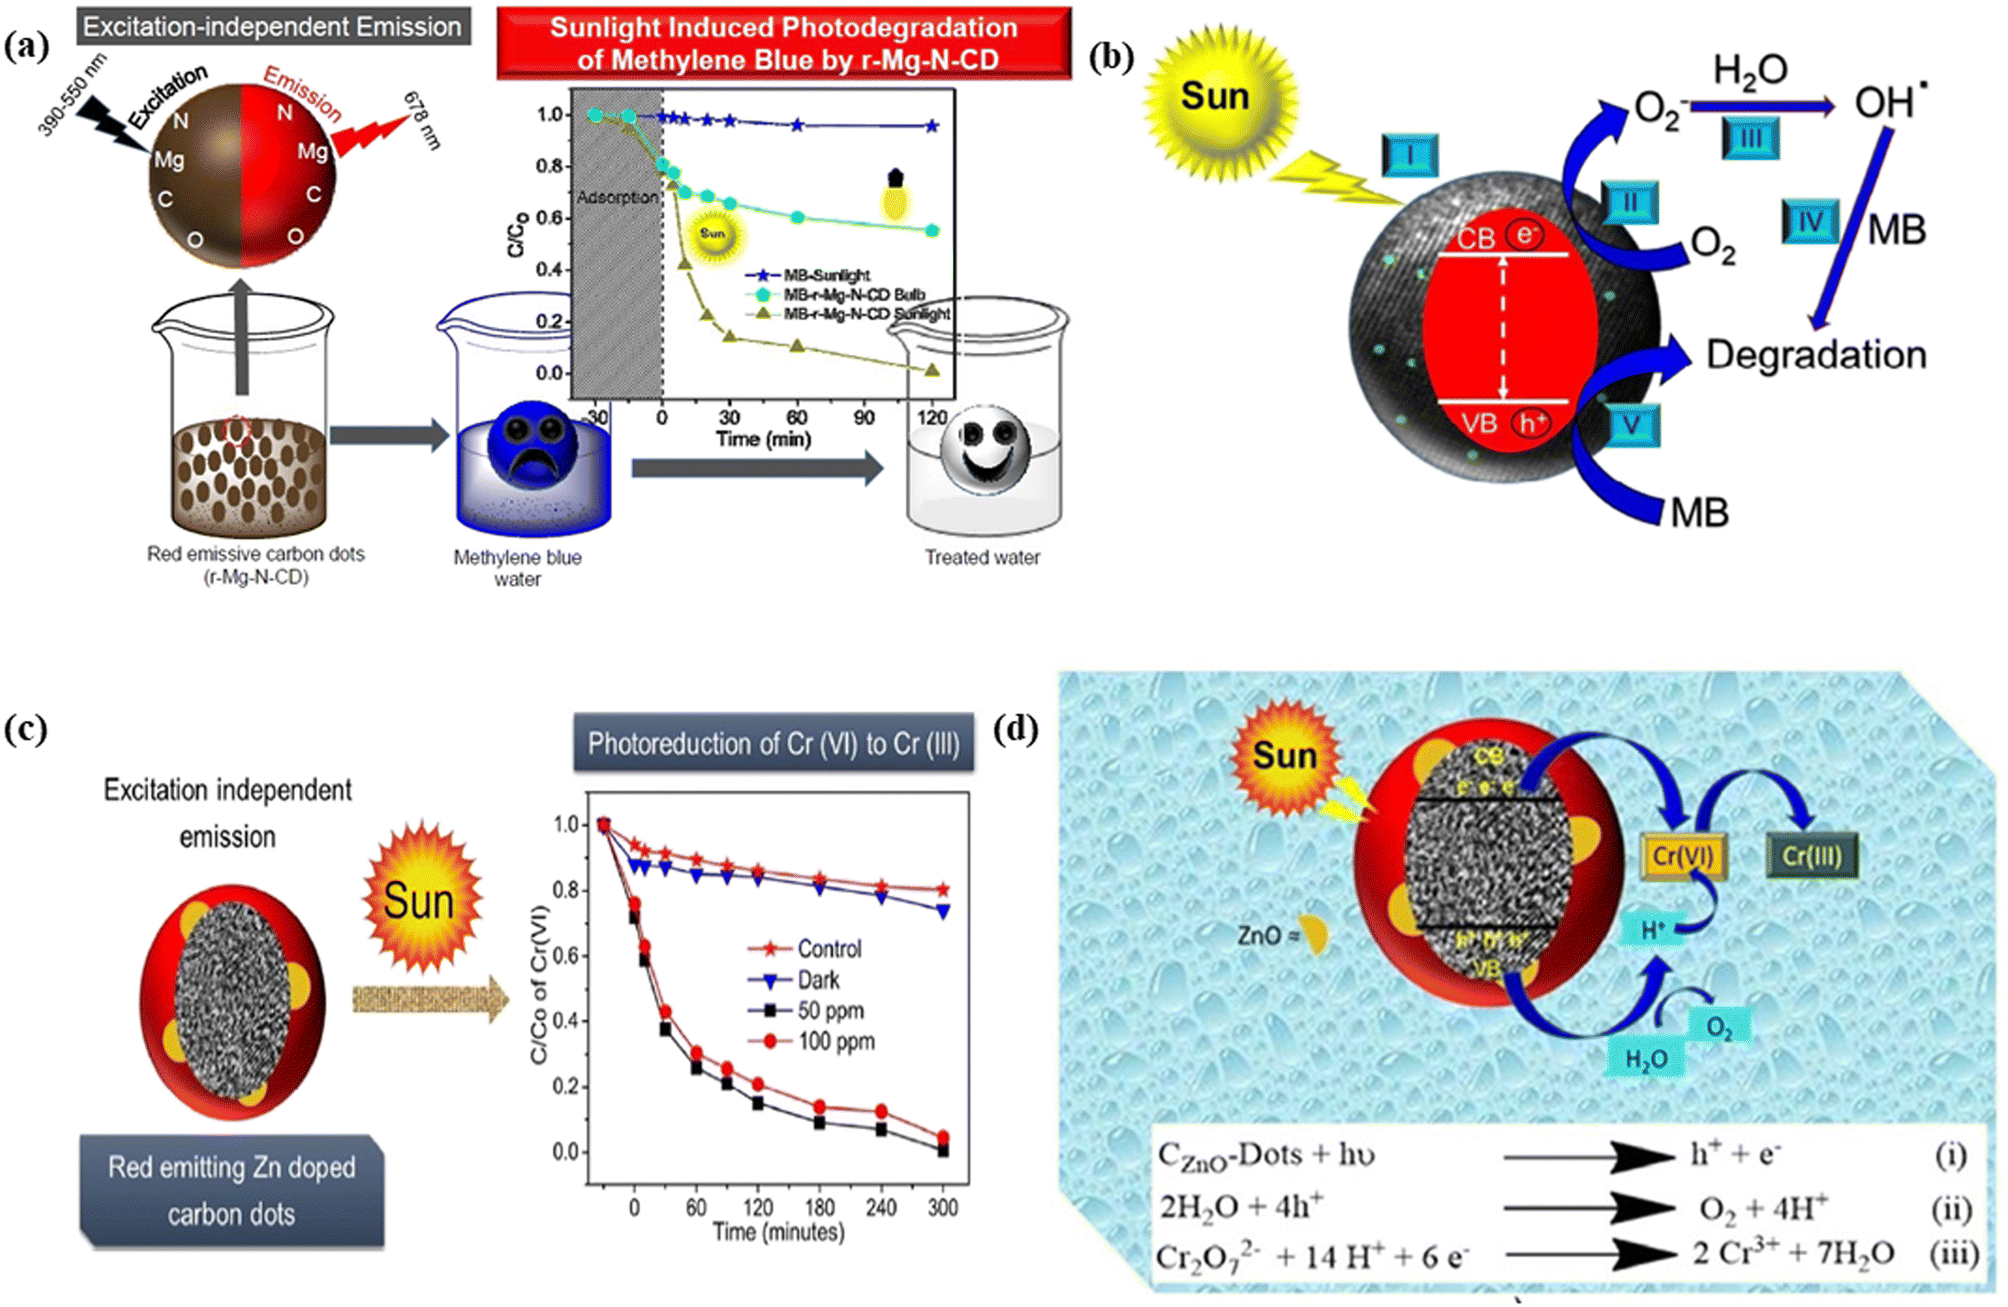 | ||
| Fig. 20 Schematic representation of several photocatalysis processes of red fluorescent carbon dots: (a) excitation dependent emission of magnesium and nitrogen doped red carbon dots utilized in the sunlight induced photodegradation of methylene blue, the photodegradation plot of methylene blue and methylene blue mixed graphene quantum dots under 120 minutes of sunlight illumination, tungsten bulb light and in the dark with the colour change effect of methylene blue solution as an effect of photodegradation is shown in the inset; (b) mechanism of red carbon dot assisted photodegradation of methylene blue (MB) with various pathways including I, II, III, IV and V. Reprinted with permission from ref. 186, Copyright 2018, American Chemical Society; (c) the utilization of the excitation dependent red emitting zinc doped carbon dots in the aqueous-phase photoreduction of hexa-valent chromium to tri-valent chromium, under sunlight illumination with the photoreduction graph of the relative chromium concentration as a function of time under different conditions; (d) possible photoreduction mechanism of hexavalent chromium to trivalent chromium under light. Reprinted with permission from ref. 472, Copyright 2018, American Chemical Society. | ||
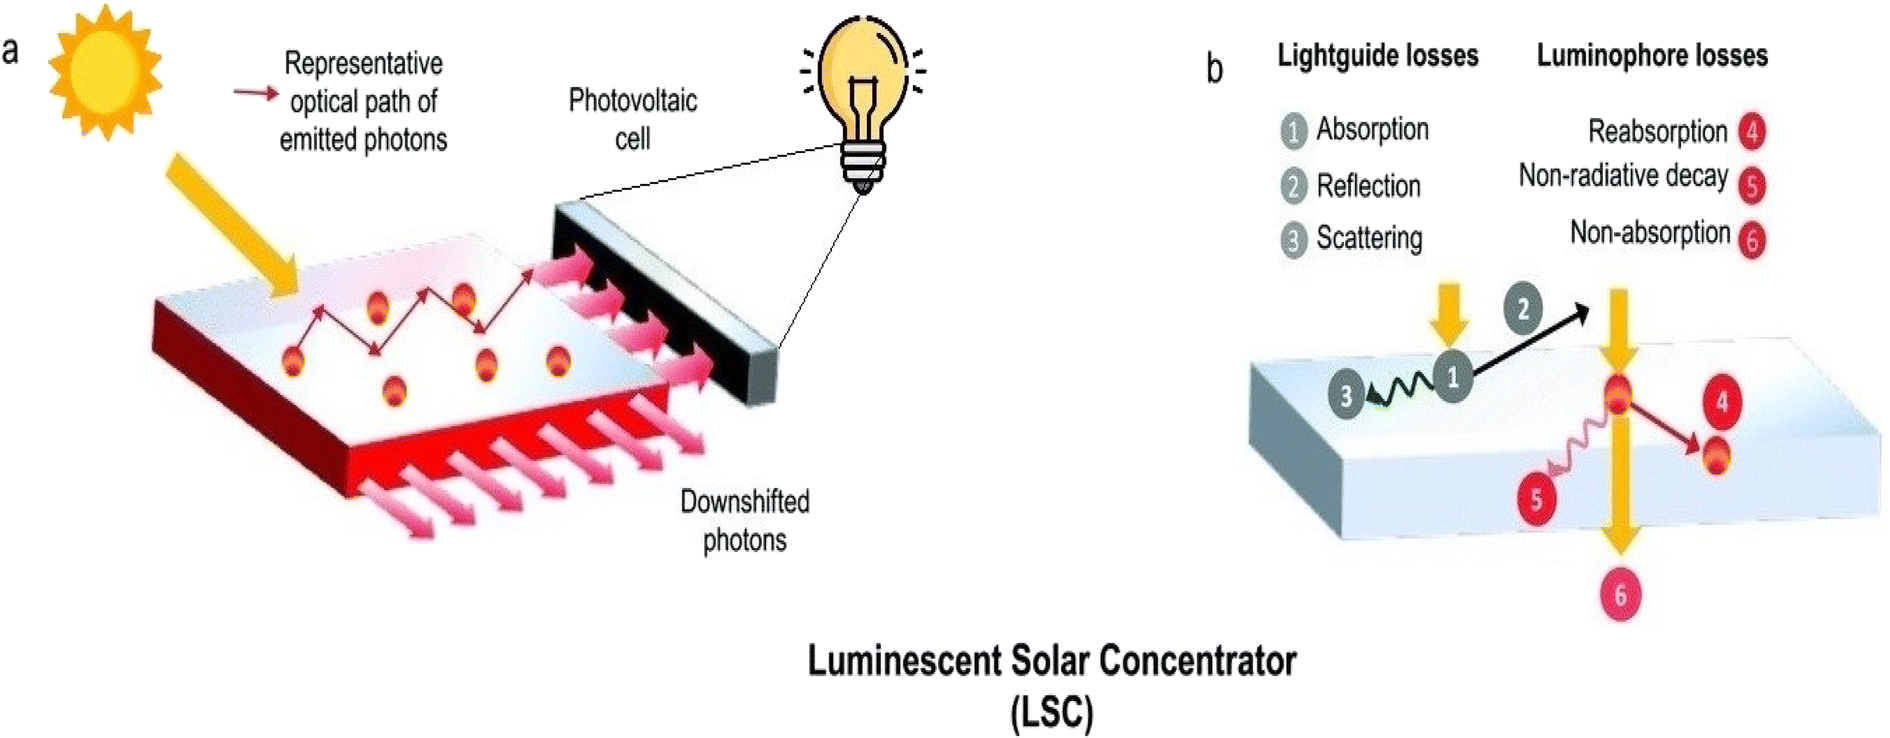 | ||
| Fig. 21 Graphical representation of luminescent solar concentrator: (a) A fluorophore-coated light-guided plate absorbs the emitted photons of the sun. Then the downshifted photons are transported through total internal reflection to the edges of the light guide. A small photovoltaic cell is placed at one of the edges of the plate to capture the optically concentrated sunlight. A small bulb is illuminated when connected to the photovoltaic cell. (b) Various optical phenomena happen with the absorption of sunlight, transport of the downshifted photons and their absorption by the small photovoltaic cell. Reprinted with permission from ref. 480, Copyright 2021, Royal Society of Chemistry. | ||
Liu et al. developed a red fluorescent carbon quantum dot-based large-area sunlight collector named a luminescent solar concentrator (LSC) for the conversion of solar to electricity so effectively. The as-synthesized carbon dots have a broad absorption region, large Stokes shift value, and high quantum yield, which are advantageous for developing red fluorescent embedded LSCs, Fig. 22(e). They find the interspace distance-dependent efficiency of LSCs by examining the changes in fluorescence intensity with changing the distance. It is shown from a graph, Fig. 22(a), that the intensity enhanced with a lower distance of illumination from the edge, and this is the indication of very weak reabsorption loss. It is also clear from the graph of normalized fluorescence as a function of the distance, Fig. 22(b). The fluorescence emission intensity of red-emitting carbon dots decreased with increased interspace distance between the spot of the beam and the edge of the LSC because of reabsorption followed by reabsorption loss, as shown in the inset of Fig. 22(b). Generally, reabsorption loss is caused by the re-absorption and re-emission, non-absorption of the incident light, partial photon loss, surface reflection, and the escape of light below the critical angle. The power conversion efficiency (ηopt) was calculated from the relationship between the current density (J) and voltage (V) of the luminescence solar concentrator system under daylight and it was close to 4.81%, Fig. 22(c). The temperature dependence of the efficiency was also evaluated. As can be observed, the power conversion efficiency steadily dropped as the temperature rose from room temperature to 60 °C. The power conversion efficiency rose as the temperature dropped until it reached the adjacent room temperature, Fig. 22(d).481 Han et al. reported biocompatible red and green carbon quantum dots, having a 300–650 nm broad absorption range. Furthermore, they combined red and green carbon dots via a vacuum heating approach to obtain two slab-incorporated tandem structured LSCs with greater efficiency.482 Cai et al. fabricated boric acid functionalized red emissive broadband absorption graphene quantum dots with a high quantum yield to develop high power conversion efficient LSCs. The developed graphene quantum dots showed vibronic-coupled excitonic emission due to the crystalline graphitic structure and hydrogen bonding functionalities. These capabilities of graphene quantum dots help to build highly effective LSCs.483 Li et al. developed a novel and highly effective tandem LSC by mixing red luminescent carbon dots with yellow emissive carbon dots. The as-developed LSC showed big advantages for building integrated photovoltaics.484 Ali et al. proposed surface modification-dependent carbon quantum dots (CQDs) with multicolor emission. Among them, the red emissive CQDs showed the largest Stokes shift and better electrocatalytic activity, causing an increase in surface reactivity and charge transfer. The red CQDs are embedded with carbon nanotubes (CNTs) to remove the aggregation-induced quenching of electrocatalytic activity and increase the conductivity. The red CQD-doped CNTs are used as a counter electrode in solar cells.485 Dey et al. reported red emissive graphene quantum dots (GQDs) synthesized using a polar aprotic solvent with increasing nitrogen units in the GQDs. The red GQDs showed superior photovoltaic performance due to the charge transport properties and higher absorptivity and carrier density.486
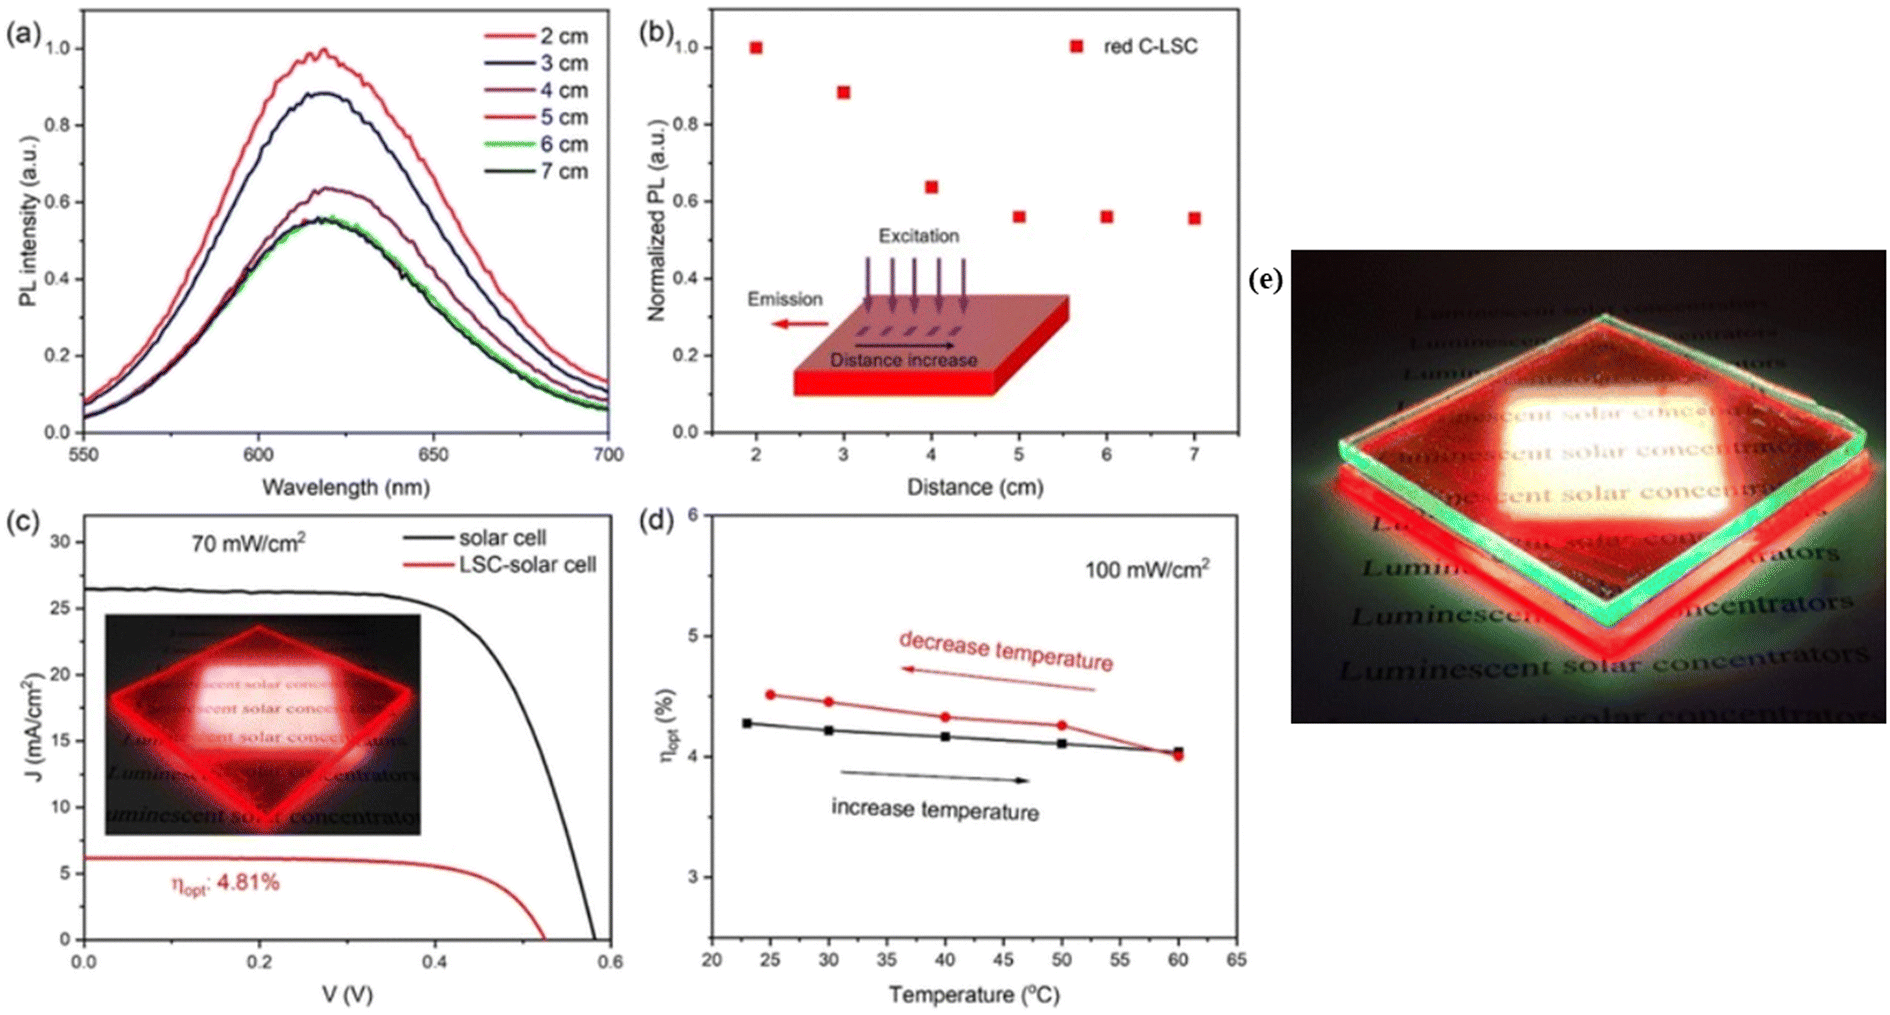 | ||
| Fig. 22 (a) Fluorescence intensity spectra from various interspaces of illumination from the edge of the light guide; (b) total fluorescence intensity as a function of the interspace distance of the illumination from edges; a schematic for the measurement is shown in the inset; (c) the power conversion efficiency (ηopt) is evaluated from the current density (J) as a function of voltage (V) of the luminescence solar concentrator system under daylight, and the photograph of a red emissive solar concentrator under solar illumination is shown in the inset; (d) the relationship between temperature changes and variations in the power conversion efficiency of the luminescence solar concentrators; (e) real life luminescence solar concentrators glowing under the illumination of light in the laboratory. Reprinted with permission from ref. 481, Copyright 2023, Royal Society of Chemistry. | ||
5.4. Others
Dong et al. reported red fluorescent carbon dots with starch to form a hybrid phosphor for the detection of latent fingerprints more accurately on glass, paper and plastic by the powder dusting method via high contrast red fluorescent signals. The team detected latent fingerprint images on glass, paper and plastic. The arches, loops and whorls of the fingerprint are identified by highly contrasted red bright fluorescent signals, resulting in great identification information in the analysis of fingerprint, Fig. 23(A), (B) and (C). The characteristic marked points of bifurcation, island, termination, eye, core, ridge divergence, and crossover are also recognized so nicely for further analysis, Fig. 23(D). The fluorescent fingerprint images stand by for several weeks without any loss, Fig. 23(E).500 Yuan et al. demonstrated a dual-mode anti-counterfeiting technology with the help of red emissive boron-doped carbon dots, which shows a reversible switching emission after doping with boron. The acid-induced discoloration technique is mainly used in this anticounterfeiting application.501 Yang et al. showed aggregation-induced on–off emission phenomena of red emissive hydrophobic carbon dots, caused by the limitation of intermolecular rotation of the surfaces around the –SS– bond. The turning on–off red fluorescence properties of the hydrophobic carbon dots were used in anticounterfeiting and dual encryption applications.502 Liao et al. developed a photo-switchable carbon nanomaterial embedded with the copolymers of styrene and spiropyran. The team showed that the fluorescence colour switches between red, green and blue when excited by UV radiation and could be used in anticounterfeiting applications.503 Wei et al. achieved a red emissive hybrid nanocomposite by mixing NaYF4:Yb,Er with carbon dots via an electrostatic reaction for 30 s. This hybrid nanocomposite is used in advanced dual-mode anticounterfeiting applications. For the anticounterfeiting experiment, first, they prepared two types of ink made of NaYF4:Yb,Er (ink-1) and NaYF4:Yb,Er embedded carbon dots (ink-2), respectively. After that, they wrote two symbols “SC” with ink-2 and “AU” with ink-1, on a paper, respectively. When these written symbols are excited with 365 nm UV, a 980 nm laser and 365 nm UV with a 980 nm laser simultaneously, they show dual mode excitation characteristics. The images obtained through a 550 nm cut-off filter is highly applicable for anticounterfeiting application, Fig. 23(F). With addition, some symbols for graphitic security made of ink-1 and ink-2 showed dual mode anticounterfeiting, Fig. 23(G).504
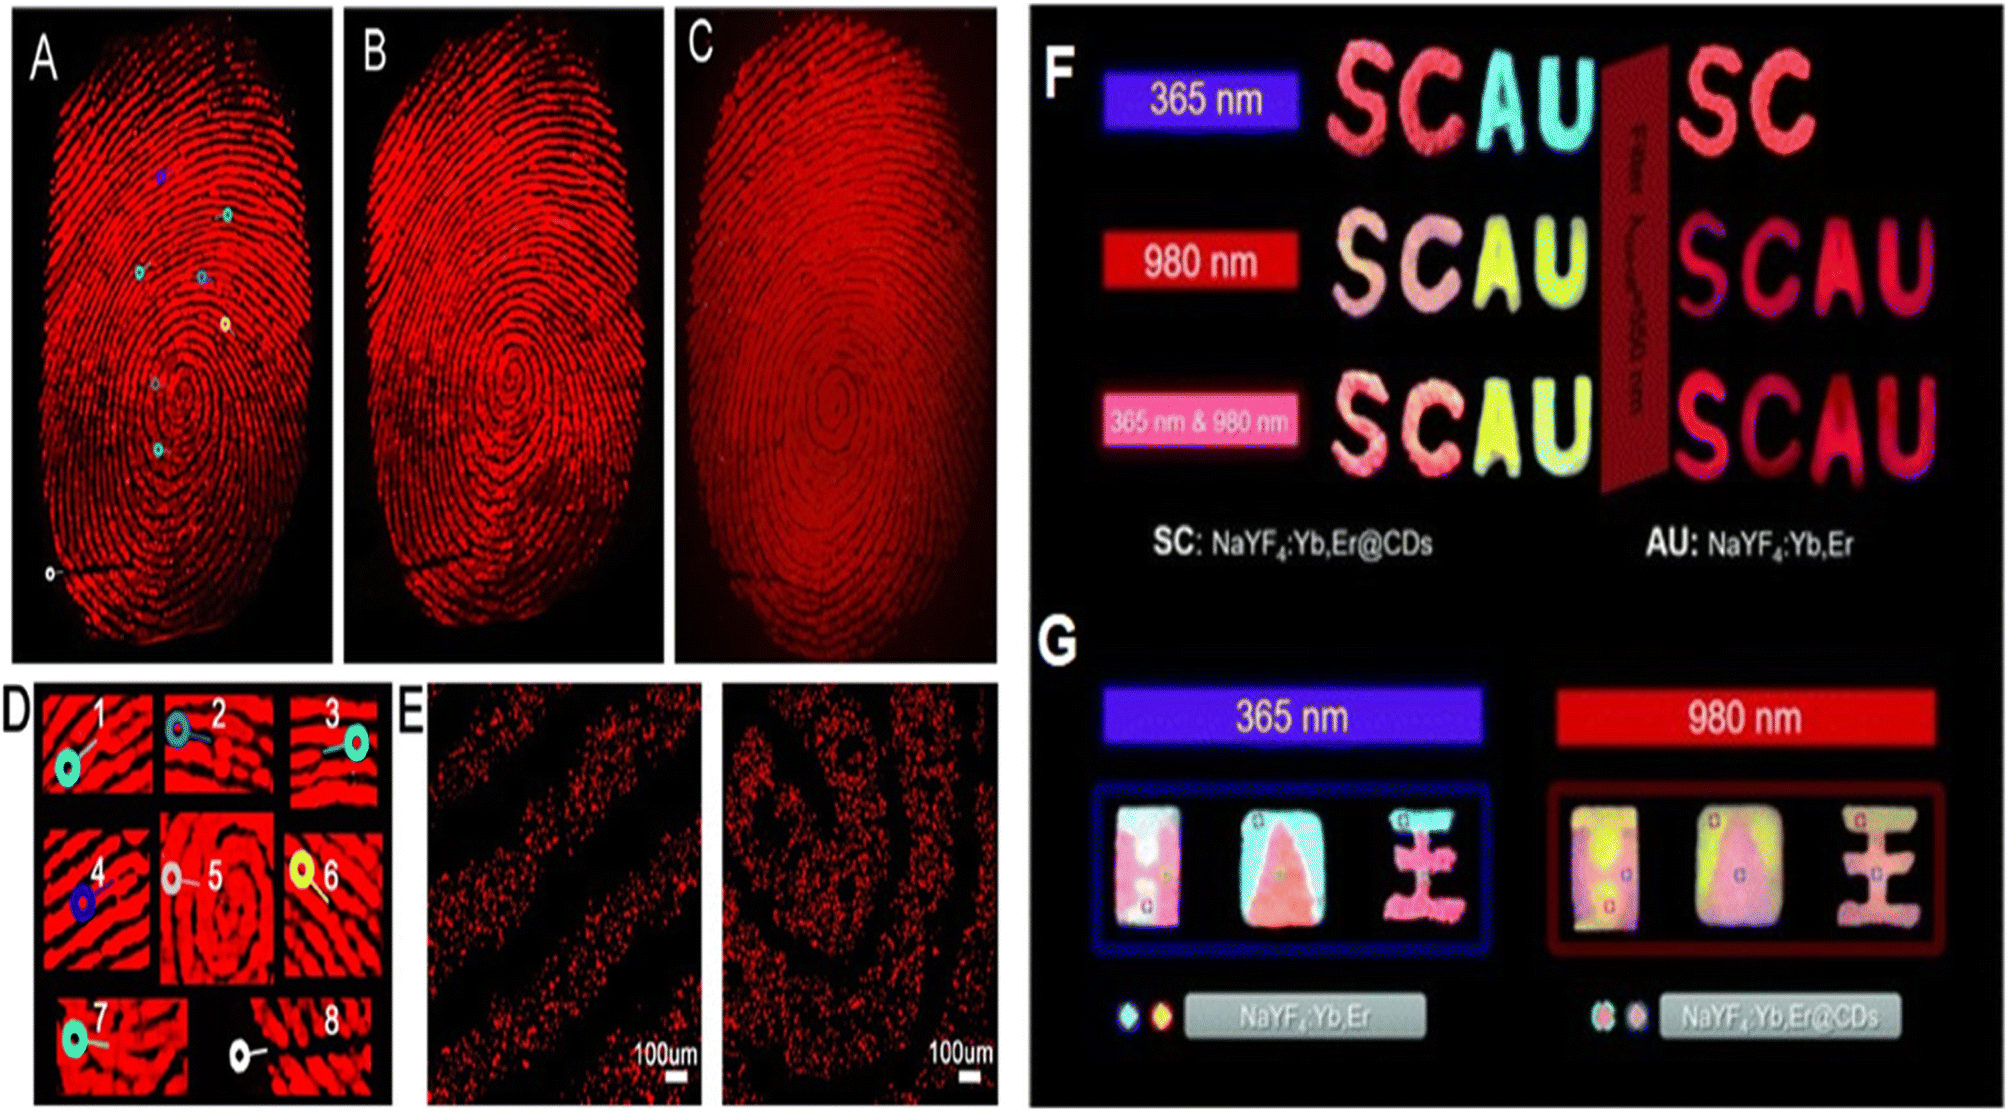 | ||
| Fig. 23 Red fluorescent starch embedded carbon dot dipped fingerprint images on (A) on glass; (B) on paper; (C) on plastic, under green light excitation, respectively; (D) magnified fingerprint images of (1) bifurcation, (2) island, (3) termination, (4) eye, (5) core, (6) ridge divergence, (7) crossover and (8) scar; (E) first one is the confocal red fluorescence image of starch embedded carbon dot dipped fingerprints on a glass sheet and second one is the same image after several weeks, reprinted with permission from ref. 500, Copyright 2020, American Chemical Society; (F) first, the “SC” & “AU” pattern photograph made with the ink of NaYF4:Yb,Er embedded carbon dots and only NaYF4:Yb,Er under the 365 nm UV excitation wavelength with a 550 nm cut-off filter; second one is the same logo under the 980 nm laser excitation wavelength with a 550 nm cut-off filter; third one is the same logo under 360 nm UV & 980 laser nm excitation with a 550 nm cut-off filter for dual mode anticounterfeiting; (G) first, the graphic security pattern photographs made with NaYF4:Yb,Er ink and NaYF4:Yb,Er embedded carbon dot ink under 365 nm UV and 980 nm laser excitation respectively, for dual mode anticounterfeiting, reprinted with permission from ref. 504, Copyright 2022, Royal Society of Chemistry. | ||
FCNMs have caught the attention for improving solar energy harvesting and boosting the efficient operation of photosynthesis due to their biocompatibility, photobleaching, easy synthesis method and low cytotoxic nature. Engineering FCNMs with plants will follow the light conversion to energy and supply this energy to the chloroplast for accelerating the electron conduction mechanism followed by boosting the photosynthesis in the plant.516–519
Li et al. proposed a technology for utilizing sunlight by plants by developing a hybrid photosynthetic system. They used hydrophilic, biocompatible and high quantum yield-based far-red carbon dots as a light-harvesting agent and converter. When the carbon dots are excited by ultraviolet rays, they emit 625–800 nm far-red radiation which is utilized and absorbed by the chloroplasts and as a result Emerson effect starts to occur. The team showed that their demonstrated hybrid system leads to enhancing the electron transfer mechanism, production of ATP and gathering of biomass followed by an increase in the efficiency of photosynthesis. The proposed mechanism of this experiment is illustrated below, in Fig. 24. The fluorescence images of chloroplasts, far-red CD and far-red CD assisted chloroplast complexes were taken respectively under UV light excitation, Fig. 25(e). When the illuminated UV light from the sun or an artificial source is absorbed by the red carbon dot accumulated chloroplast hybrid system, the carbon dots convert the UV light to far-red radiation. It increases the electron transfer mechanism, and consequently, the photosynthesis efficiency of plants gradually increased. The electron transfer chain consists of four stages including photosystems I & II (PS I & II), the cytochrome b6f complex (Cyt b6f), and ATP synthase. The two pigments of thylakoid membranes are the reaction center pigments that are responsible for converting harvesting light into electricity and the second one is antenna pigments (AP1 and AP2) that are transferring light energy. The primary electron donor (P680) of the reaction center pigment in PS II absorbs the emitted fluorescent radiation. The antenna pigments transfer the radiation to excite the P680 donor and produce electrons. The hole containing P680 leads to splitting of water into protons and oxygen. The black arrow shows the transfer of electrons from PS II to the Cyt b6f complex followed by the route of pheophytin (Pheo) and plastoquinone (PQ). The primary electron donor (P700) of the reaction of the reaction center pigments in PS I excited and lost electrons. They extend to a steady state by gaining electrons from PQ. The ultimate acceptor nicotinamide adenine dinucleotide phosphate (NADP+) is changed to reduced nicotinamide adenine dinucleotide phosphate (NADPH) by accepting electrons. Due to high electron affinity for electrons 2,6-dichlorophenolindophenol (DCPIP) captures the transported electrons from PS II to PS I, following the Hill reaction causing the splitting of water. The splitting of water generates protons and oxygen. The protons can produce energy for ATP formation by transportation via ATP synthase due to the concentration gradient. The growth of Rome lettuce was affected by far-red CDs at various concentrations (0, 1, 3, 5, and 7 g mL−1), Fig. 25(d). The far-red CD treated confocal images of the root, stem and leaf of lettuce at a concentration of 10 μg per mL were also collected under excitation of 405 nm and the emission range of 630–700 nm, on a 200 μm scale bar, Fig. 25(c).520
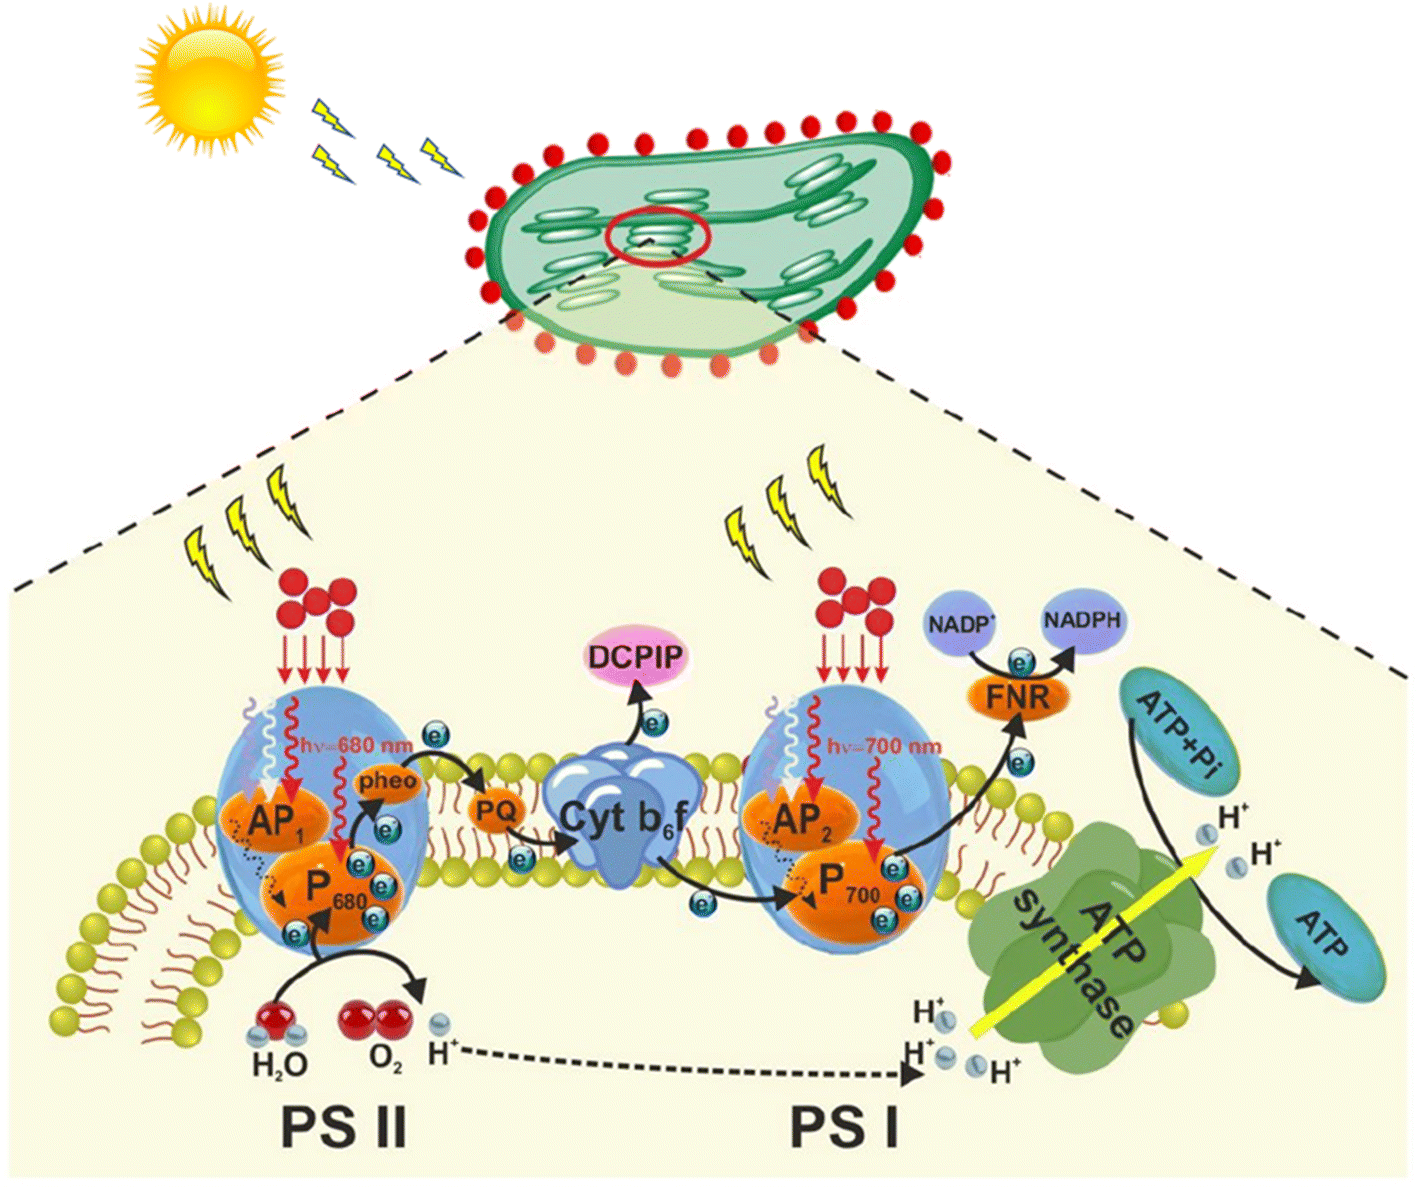 | ||
| Fig. 24 Mechanism representation of the photosynthesis activity of the far-red carbon dots based chloroplast hybrid system: PS II & I are the photosystems I and II; AP1 and AP2 are the antenna pigments; P680 & P700 are the primary electron donor of PS II and PS I respectively; “Pheo” is pheophytin; PQ is plastoquinone; Cyt b6f is the cytochrome b6f complex; DCPIP is 2,6-dichlorophenolindophenol; FNR is ferredoxin reductase; NADP+ and NADPH are nicotinamide adenine dinucleotide phosphate and its reduced form respectively; ATP synthase is adenosine triphosphate synthase; ATP + Pi is adenosine triphosphate with inorganic phosphate. Reprinted with permission from ref. 520, Copyright 2020, American Chemical Society. | ||
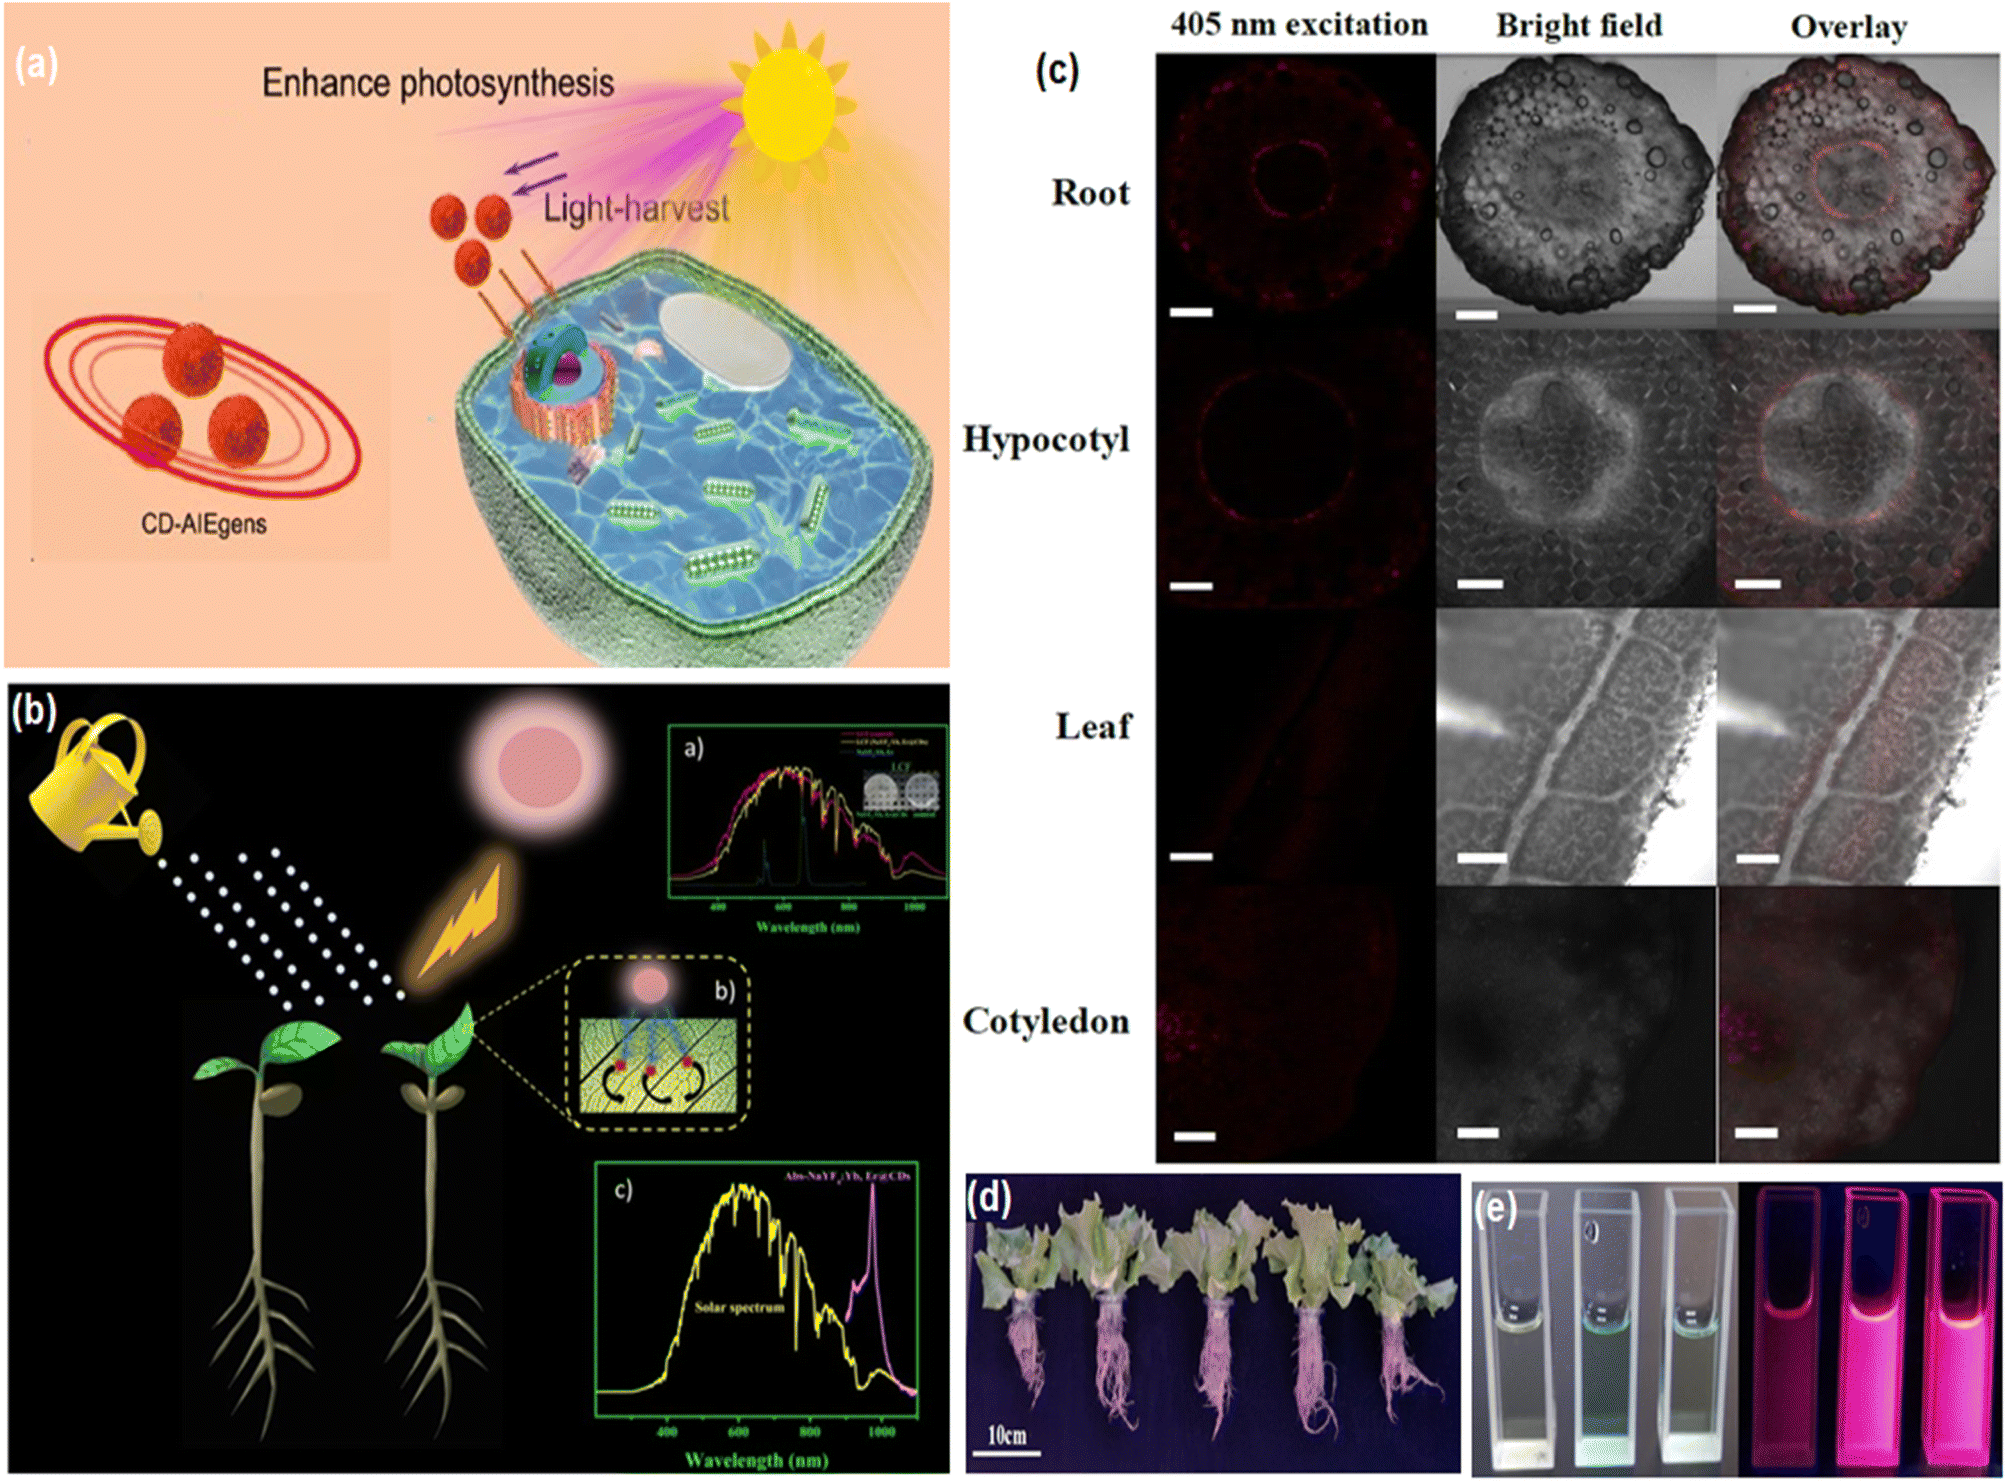 | ||
| Fig. 25 (a) Representation of the aggregation-induced emission carbon dot assisted photosynthesis enhancement; reprinted with permission from ref. 523, Copyright 2021, American Chemical Society (b) schematic representation diagram of the red CD assisted light conversion effect under sunlight on mung bean seedlings; reprinted with permission from ref. 521, Copyright 2020, American Chemical Society; (c) far-red CD treated confocal images of the root, stem and leaf of lettuce at a concentration of 10 μg per mL, collected under excitation of 405 nm and the emission range of 630–700 nm, on a 200 μm scale bar; reprinted with permission from ref. 520, Copyright 2020, American Chemical Society (d) far-red CD effect at different concentrations (0, 1, 3, 5, and 7 μg mL−1) on the growth of Rome lettuce; reprinted with permission from ref. 520, Copyright 2020, American Chemical Society; (e) the fluorescence images of chloroplasts, far-red CD and far-red CD assisted chloroplast complexes, respectively, reprinted with permission from ref. 520, Copyright 2020, American Chemical Society. | ||
Xu et al. reported red emissive NaYF4:Yb,Er doped carbon dots which are used to increase the water absorption capacity and promote the growth of hydroponic mung beans. The ability of these as-synthesized carbon dots to convert near-infrared radiation into red light helps in the boosting of photosynthesis by more than two times to promote the mung bean plant growth, Fig. 25(b).521 Wang et al. demonstrated NIR emissive carbon dots for improving the absorption and the electron transfer mechanism to increase the photosynthesis efficiency of N. benthamiana plants. The team identified that the PsbP and PsiK genes were the controllers of photosynthesis in N. benthamiana plant.522 Xiao et al. first developed aggregation-induced emission carbon dots derived from natural quercetin and coated with a chloroplast to develop a new type of biobased optical hybrid material for artificial photosynthesis. This hybrid material can increase the photosynthesis rate by regulating the harvesting of light over a wide spectral range, Fig. 25(a).523
Liu et al. synthesized biocompatible and hydrophobic bright red fluorescent carbon dots (CDs) from mulberry leaves via a simple solvothermal route. The as-synthesized carbon dots showed a full width at half maximum emission curve peak at the 676 nm wavelength with a high quantum yield of 73%. The team fed the red carbon dots to silkworms and when the silkworms consumed enough red CDs, they grew up gradually. They took various photographs of an adult silkworm under UV light, Fig. 26(f) and under green light. The fluorescence microscopy images of the head and chest of the silkworm were taken under green excitation light, Fig. 26(e). The source of the luminescence was determined by the ethanolic extraction technique. The cocoon coatings and shells were dissolved in ethanol and then filtered to develop the ethanoic solution. The ethanoic solution was taken to get the fluorescent emission spectra under different excitation wavelengths, are shown Fig. 26(j). The anatomy of the control silkworm showed that the alimentary tract appears green in natural light and faintly fluoresces yellow-green when exposed to UV light, Fig. 26(c) and (g), top. In comparison, the alimentary tract of the examined group (red CDs) appears greyish-yellow in natural light and fluoresces reddish-yellow, when exposed to UV light, Fig. 26(c) and (g), bottom. The photograph of silk glands was also taken under daylight and UV light to confirm the diffusion of red CDs, Fig. 26(d) and (h). After a certain time, the silkworm constructed a cocoon made of fluorescent silk fibers and inside the cocoon, it changed into a pupa. After many days, the pupa changed into an adult silkworm moth and came out through a saliva-soaked aperture at the bottom of the cocoon. The day light & fluorescence images of the cocoon and adult silkworm moth were taken, respectively, Fig. 26(a), (b) and (k). These researchers showed that these cocoons showed vivid pink-red fluorescence under UV light, Fig. 26(k), and used for the production of fluorescent silk.533
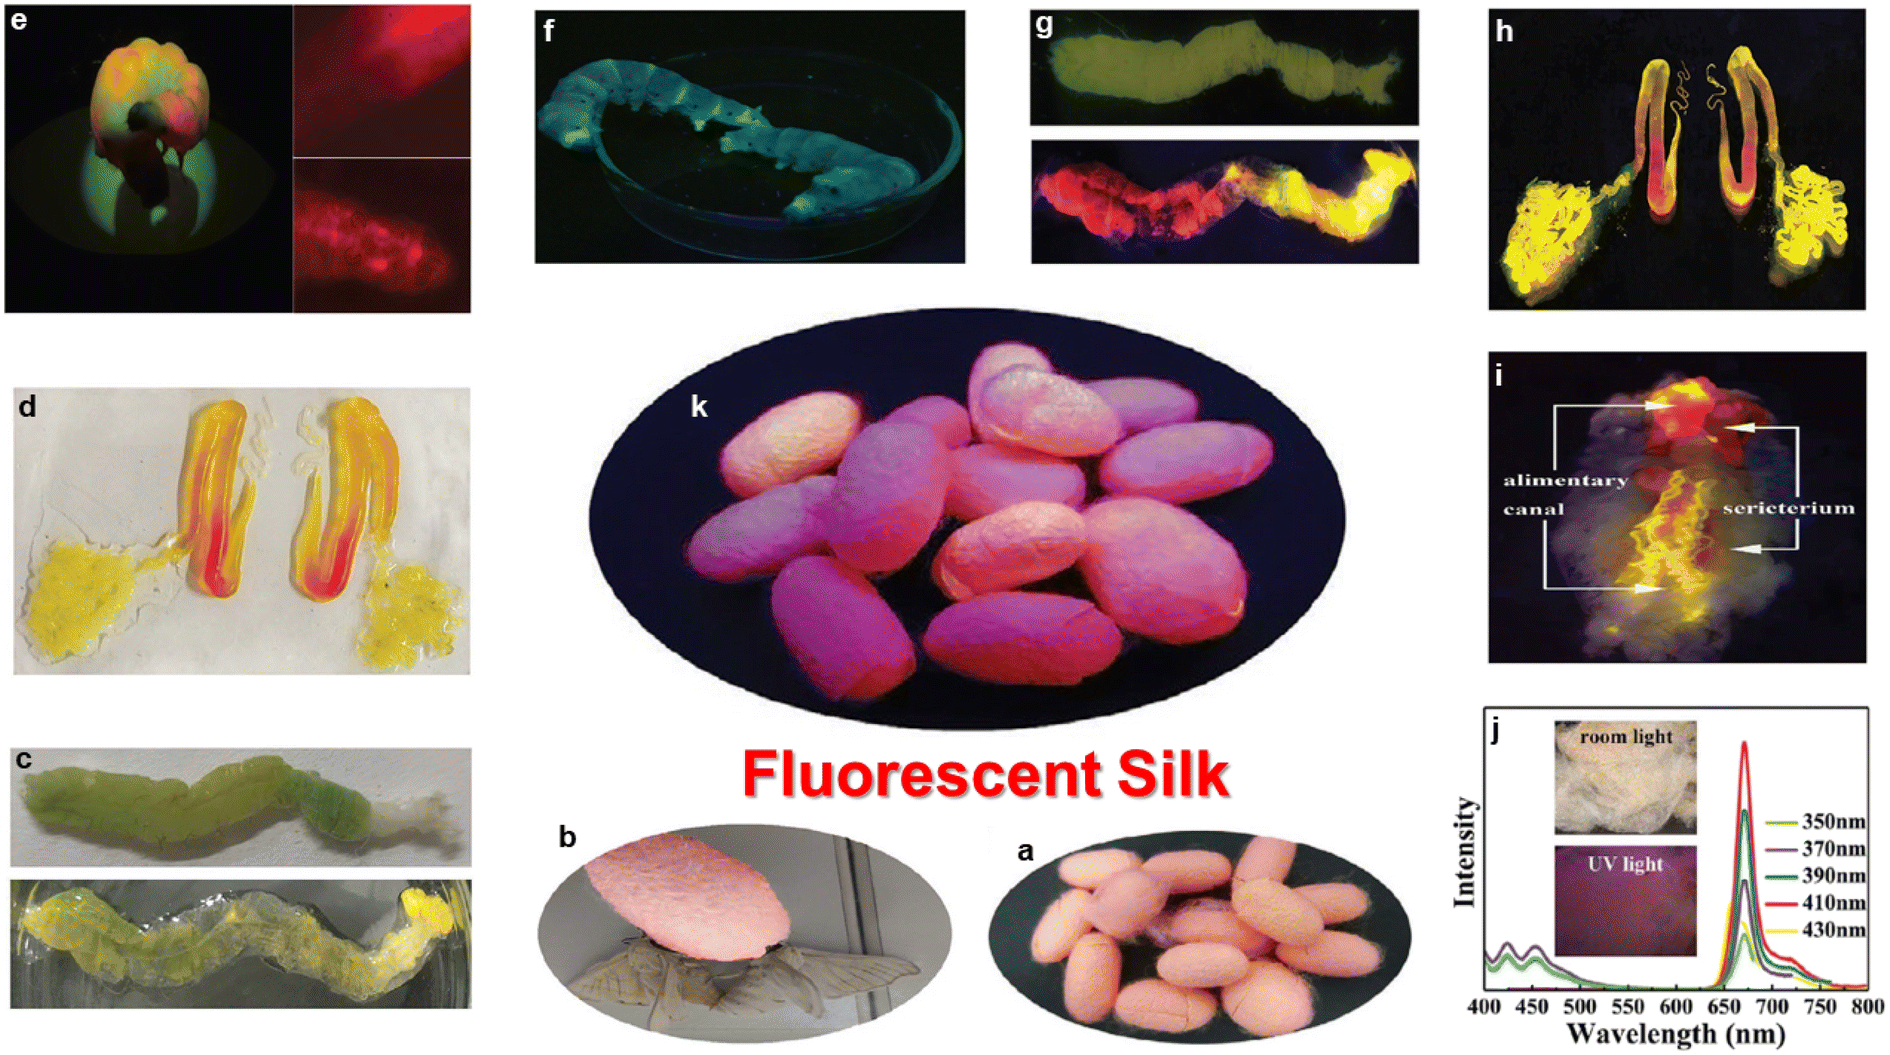 | ||
| Fig. 26 Schematic representation of fluorescent silk – (a) & (k) fluorescent cocoon under daylight & UV light, respectively; (b) adult silkworm moth emerging from the bottom of the cocoon; (c) the alimentary canal of the control and test groups from up to down, respectively; (d) the photograph of silk glands under daylight; (e) photograph of an adult silkworm and the fluorescent microscopy images of the head and chest of the silkworm, under green excitation light; (f) the photograph of adult silkworms under UV light; (g) the alimentary canal of the control and test groups from up to down under UV light, respectively; (h) the photograph of silk glands under UV light; (i) the full anatomical photograph of the silkworm under UV light; (j) the fluorescent emission spectra of ethanoic solution taken out from the cocoon coats and shells, under different excitation wavelengths. Reprinted with permission from ref. 533, Copyright 2022, Wiley-VCH GmbH. | ||
Maltseva et al. developed a fluorescent silk fiber material from the in situ modification of spider silk and fluorescent carbon dots. The resulting hybrid materials showed intense red fluorescence with an emission wavelength of 590 nm when excited with a 480 nm wavelength. They utilized the developed materials for the closure of wounds and the detection of pathogens.534
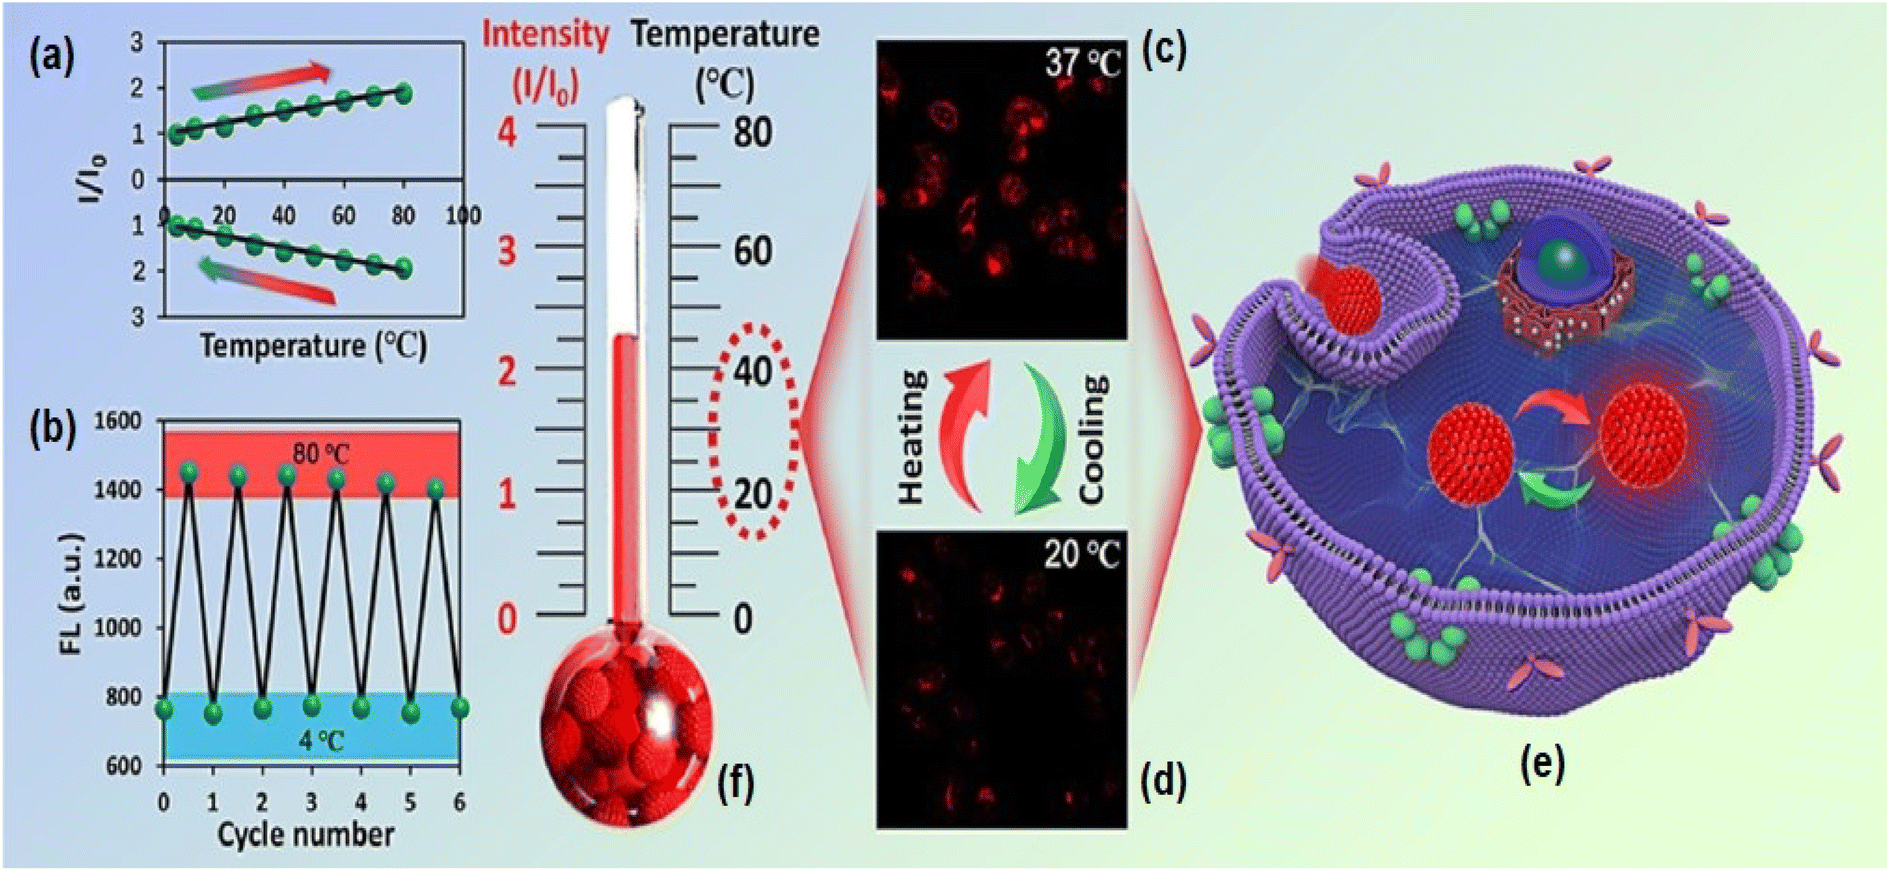 | ||
| Fig. 27 Schematic representation of a fluorescent nanothermometer: (a) graph of the relative fluorescence intensity of the red fluorescent carbon dot solution vs. varying temperatures during the heating and cooling processes; (b) graph of the fluorescence intensity of red carbon dots in six cycles of heating and cooling at temperatures ranging from 4–80 °C using a 500 nm excitation wavelength; (c) & (d) the confocal fluorescence images of cells after being embedded with red carbon dots at the temperatures of 20 °C and 37 °C, respectively on a 100 μm scale bar; (e) microscopic intercellular representation of the cell with the red carbon dot injection and heating-cooling effect; (f) red carbon dot integrated thermometer representation with relative intensity and temperature (°C) scaling, reprinted with permission from ref. 544, Copyright 2020, American Chemical Society. | ||
Wang et al. developed red fluorescent carbon dots, derived from o-phenylenediamine, employed as a nanothermometer for controlling very accurately and sensitively the intracellular temperature value. The team examined the fluorescent emission spectra of red carbon dots in an aqueous solution as a function of varying temperatures of 15–60 °C. The red carbon dots were used as a probe for the indication of temperature. A gradual increase in the fluorescence intensity of the red carbon dots was noticed with rising the temperature from 15 °C to 60 °C. A sharp increase in the fluorescence intensity was observed at 60 °C.545 Lee et al. prepared graphene quantum dots with emission in both visible and infrared regions for microscopic intercellular temperature identification as a function of fluorescence intensity.546 Wang et al. produced microwave-assisted red-emitting carbon dots for measuring the temperature inside a living cell.547
6. Conclusion
Red emissive CNMs are the most predominant nanomaterials compared to others due to their several advantages such as a high penetration depth, wide absorption, biodegradability, and the photobleaching resistance effect. Hence, these red emissive CNMs are mostly useful in the fields of biomedical, anticounterfeiting and energy-related applications. Based on the above advantage and wide range of applications, we have outlined the fascinating aspects and ongoing research on red emissive CNMs. It should be noted that the scientific community has made significant efforts to date for the advancement of red-emissive CNM technologies. In this review, we have discussed the synthesis of FCNMs, the origin of fluorescence mechanisms, factors affecting the synthetic procedure for achieving tuneable emission properties, and applications in various current fields. This review summarized each aspect of red emissive CNMs to promote future research in the context of their synthesis, innovation, and exploring their additional applications.7. Future prospects
In addition to synthetic strategies for developing a variety of red-emissive CNM samples, several factors for red-shifting fluorescence and the applications of FCNMs have also been demonstrated in this journey. However, further research and advancements are still needed to broaden the uses of red emission fluorescence. The followings are the present issues and prospective directions:(1) The preparation of red emissive CNMs ought to be economical, scalable, reproducible, and environmentally friendly. However, in the majority of recent reports the preparation of red-emitting CNMs is costly, requires harmful chemical reagents, is time taking, and involves ineffective purification techniques, which limit their practical applicability. Hence, cost-effective carbon precursors and quick purification techniques are the way for the development of large-scale and environmentally friendly red FCNMs in the coming years.
(2) The majority of red-emissive CNMs have low quantum yield, and therefore it is essential to develop a new method that increases the quantum yield of red-emissive CNMs in an aqueous medium.
(3) The origin of red fluorescence in carbon nanomaterials can be understood or explored in detail by sophisticated techniques such as lifetime microscopy, scanning tunneling microscopy, single-particle imaging, and related super-resolution techniques. Efficient machine learning techniques and computational modeling are also extremely desirable to reveal the red emission in FCNMs.
(4) The synthesis of far infrared emissive FCNMs with high quantum yield has been high in demand in recent times due to their excellent applications in the biomedical field. The researchers may select the best precursors, synthesis techniques and functionalization of ligands to prepare highly intense infrared emissive CNMs.
(5) The biodistribution, pharmacokinetics, and clearance studies of red emissive CNMs are required for further research to improve their clinical usage.
With the aforementioned initiatives, it is anticipated that the production of red emissive CNMs would increase their biomedical as well as energy-related applications. These low cytotoxic red FCNMs will also open up new avenues to meet the demands of clinical applications.
Author contributions
Conceptualization, methodology, and writing original draft: Tuhin Mandal; writing-review and editing: Shiv Rag Mishra; conceptualization, methodology, supervision, writing original draft and funding acquisition: Vikram Singh.Conflicts of interest
The authors declare that they have no conflicts of interest.Acknowledgements
This work is financially supported by the CSIR-Central Institute of Mining and Fuel Research Dhanbad (Project No. MLP-155/2021-2022).References
- B. Wang and S. Lu, Matter, 2022, 5, 110–149 CrossRef CAS
.
- Y. Wang, Y. Zhu, S. Yu and C. Jiang, RSC Adv., 2017, 7, 40973–40989 RSC
- Y.-P. Sun, B. Zhou, Y. Lin, W. Wang, K. A. S. Fernando, P. Pathak, M. J. Meziani, B. A. Harruff, X. Wang, H. Wang, P. G. Luo, H. Yang, M. E. Kose, B. Chen, L. M. Veca and S.-Y. Xie, J. Am. Chem. Soc., 2006, 128, 7756–7757 CrossRef CAS PubMed
- T. Mandal, S. R. Mishra, K. Singh, H. Agarwalla, R. E. Masto, M. Kumar and V. Singh, J. Nanopart. Res., 2023, 25, 125 CrossRef CAS
- K. S. Rawat, V. Singh, C. P. Sharma, A. Vyas, P. Pandey, J. Singh, N. M. Gupta, M. Sachdev and A. Goel, J. Imaging, 2023, 9, 19 CrossRef PubMed
- V. Singh, B. Gorbel, S. Chatterjee, P. Sen and V. Verma, Mater. Lett., 2022, 309, 131446 CrossRef CAS
- D. Bharathi, R. H. Krishna, V. Singh, N. Kottam and B. Siddlingeshwar, J. Lumin., 2017, 190, 328–334 CrossRef CAS
- T. Mandal, A. K. Ghosh, S. R. Mishra, S. K. Pandey and V. Singh, Nanoscale Adv., 2023, 5, 4269–4285 RSC
- H. Ding, J.-S. Wei, N. Zhong, Q.-Y. Gao and H.-M. Xiong, Langmuir, 2017, 33, 12635–12642 CrossRef CAS PubMed
- Y. Gao, Y. Jiao, W. Lu, Y. Liu, H. Han, X. Gong, M. Xian, S. Shuang and C. Dong, J. Mater. Chem. B, 2018, 6, 6099–6107 RSC
- K. Holá, M. Sudolská, S. Kalytchuk, D. Nachtigallová, A. L. Rogach, M. Otyepka and R. Zbořil, ACS Nano, 2017, 11, 12402–12410 CrossRef PubMed
- Q. Wu, S. Zhang, S. Li, Y. Yan, S. Yu, R. Zhao and L. Huang, Nano Res., 2023, 16, 1835–1845 CrossRef CAS
- S. Zhu, Y. Song, X. Zhao, J. Shao, J. Zhang and B. Yang, Nano Res., 2015, 8, 355–381 CrossRef CAS
- V. Georgakilas, J. A. Perman, J. Tucek and R. Zboril, Chem. Rev., 2015, 115, 4744–4822 CrossRef CAS PubMed
- C. Lin, Y. Zhuang, W. Li, T.-L. Zhou and R.-J. Xie, Nanoscale, 2019, 11, 6584–6590 RSC
- X. Xu, L. Mo, W. Li, Y. Li, B. Lei, X. Zhang, J. Zhuang, C. Hu and Y. Liu, Chin. Chem. Lett., 2021, 32, 3927–3930 CrossRef CAS
- H. Ding, Y. Ji, J.-S. Wei, Q.-Y. Gao, Z.-Y. Zhou and H.-M. Xiong, J. Mater. Chem. B, 2017, 5, 5272–5277 RSC
- M. K. Kumawat, M. Thakur, R. B. Gurung and R. Srivastava, ACS
Sustain. Chem. Eng., 2017, 5, 1382–1391 CrossRef CAS
- S. Sun, L. Zhang, K. Jiang, A. Wu and H. Lin, Chem. Mater., 2016, 28, 8659–8668 CrossRef CAS
- Q. Han, W. Xu, C. Ji, G. Xiong, C. Shi, D. Zhang, W. Shi, Y. Jiang and Z. Peng, ACS Appl. Nano Mater., 2022, 5, 15914–15924 CrossRef CAS
- Y. Shi, W. Su, F. Yuan, T. Yuan, X. Song, Y. Han, S. Wei, Y. Zhang, Y. Li, X. Li and L. Fan, Adv. Mater., 2023, 2210699 CrossRef PubMed
- Y. Wang, J. Zheng, J. Wang, Y. Yang and X. Liu, Opt. Mater., 2017, 73, 319–329 CrossRef CAS
- Z. Wang, N. Jiang, M. Liu, R. Zhang, F. Huang and D. Chen, Small, 2021, 17, 2104551 CrossRef CAS PubMed
- Y. Zhang, J. Xiao, P. Zhuo, H. Yin, Y. Fan, X. Liu and Z. Chen, ACS Appl. Mater. Interfaces, 2019, 11, 46054–46061 CrossRef CAS PubMed
- X. Shi, H. Meng, Y. Sun, L. Qu, Y. Lin, Z. Li and D. Du, Small, 2019, 15, 1901507 CrossRef CAS PubMed
- F. Yan, Z. Sun, H. Zhang, X. Sun, Y. Jiang and Z. Bai, Microchim. Acta, 2019, 186, 583 CrossRef PubMed
- A. Kubacka, U. Caudillo-Flores, I. Barba-Nieto and M. Fernández-García, Appl. Catal., A, 2021, 610, 117966 CrossRef CAS
-
M. Gaft, R. Reisfeld and G. Panczer, Modern Luminescence Spectroscopy of Minerals and Materials, Springer, 2015 Search PubMed
- K.-W. Chu, S. L. Lee, C.-J. Chang and L. Liu, Polymers, 2019, 11, 689 CrossRef CAS PubMed
- H. Ding, X.-X. Zhou, J.-S. Wei, X.-B. Li, B.-T. Qin, X.-B. Chen and H.-M. Xiong, Carbon, 2020, 167, 322–344 CrossRef CAS
- W. Yang, X. Li, L. Fei, W. Liu, X. Liu, H. Xu and Y. Liu, Green Chem., 2022, 24, 675–700 RSC
-
S. Dutta Choudhury, in Handbook on Synthesis Strategies for Advanced Materials: Volume-III: Materials Specific Synthesis Strategies, ed. A. K. Tyagi and R. S. Ningthoujam, Springer Singapore, Singapore, 2021, pp. 421–460, DOI:10.1007/978-981-16-1892-5_11
- M. Esmaeili, Z. Wu, D. Chen, A. Singh, P. Sonar, D. Thiel and Q. Li, Adv. Powder Technol., 2022, 33, 103560 CrossRef CAS
- S. Tao, S. Zhu, T. Feng, C. Xia, Y. Song and B. Yang, Mater. Today Chem., 2017, 6, 13–25 CrossRef
- P. Yang, Z. Zhu, X. Li, T. Zhang, W. Zhang, M. Chen and X. Zhou, J. Alloys Compd., 2020, 834, 154399 CrossRef CAS
- T. Dey, S. Mukherjee, A. Ghorai, S. Das and S. K. Ray, Carbon, 2018, 140, 394–403 CrossRef CAS
- Q. Fang, Y. Dong, Y. Chen, C.-H. Lu, Y. Chi, H.-H. Yang and T. Yu, Carbon, 2017, 118, 319–326 CrossRef CAS
- O. Kozák, M. Sudolská, G. Pramanik, P. Cígler, M. Otyepka and R. Zbořil, Chem. Mater., 2016, 28, 4085–4128 CrossRef
- K. Y. Zhang, Q. Yu, H. Wei, S. Liu, Q. Zhao and W. Huang, Chem. Rev., 2018, 118, 1770–1839 CrossRef CAS PubMed
- S. Song, Z. Wang, C. Pan, Z. Li, J. Yan, Z. Lei, S. Ren, S. Kang and H. Shui, J. Mater. Chem. C, 2022, 10, 10124–10131 RSC
- S. Hu, X. Meng, F. Tian, W. Yang, N. Li, C. Xue, J. Yang and Q. Chang, J. Mater. Chem. C, 2017, 5, 9849–9853 RSC
- K. M. Tripathi, A. K. Sonker, S. K. Sonkar and S. Sarkar, RSC Adv., 2014, 4, 30100–30107 RSC
- X. Meng, Q. Chang, C. Xue, J. Yang and S. Hu, Chem. Commun., 2017, 53, 3074–3077 RSC
- H. Y. Ko, Y. W. Chang, G. Paramasivam, M. S. Jeong, S. Cho and S. Kim, Chem. Commun., 2013, 49, 10290–10292 RSC
- X. Tan, Y. Li, X. Li, S. Zhou, L. Fan and S. Yang, Chem. Commun., 2015, 51, 2544–2546 RSC
- L. Bao, C. Liu, Z.-L. Zhang and D.-W. Pang, Adv. Mater., 2015, 27, 1663–1667 CrossRef CAS PubMed
- C.-C. Ke, Y.-C. Yang and W.-L. Tseng, Part. Part. Syst. Charact., 2016, 33, 132–139 CrossRef CAS
- A. Sharma and J. Das, J. Nanobiotechnol., 2019, 17, 1–24 CrossRef CAS PubMed
- D. Mijatovic, J. C. T. Eijkel and A. van den Berg, Lab Chip, 2005, 5, 492–500 RSC
- D. Qu and Z. Sun, Mater. Chem. Front., 2020, 4, 400–420 RSC
- B. Wang, H. Song, Z. Tang, B. Yang and S. Lu, Nano Res., 2022, 15, 942–949 CrossRef CAS
- M. M. Hussain, W. U. Khan, F. Ahmed, Y. Wei and H. Xiong, Chem. Eng. J., 2023, 465, 143010 CrossRef CAS
- Y. Han, L. Liccardo, E. Moretti, H. Zhao and A. Vomiero, J. Mater. Chem. C, 2022, 10, 11827–11847 RSC
- R. Vithalani, D. Patel, C. K. Modi and D. H. Suthar, J. Mater. Sci., 2020, 55, 8769–8792 CrossRef CAS
- Y. Zhang, Y. Wang, X. Feng, F. Zhang, Y. Yang and X. Liu, Appl. Surf. Sci., 2016, 387, 1236–1246 CrossRef CAS
- F. Yan, Y. Jiang, X. Sun, Z. Bai, Y. Zhang and X. Zhou, Microchim. Acta, 2018, 185, 424 CrossRef PubMed
- W. Liu, C. Li, Y. Ren, X. Sun, W. Pan, Y. Li, J. Wang and W. Wang, J. Mater. Chem. B, 2016, 4, 5772–5788 RSC
- W. Liang, P. Wang, M. J. Meziani, L. Ge, L. Yang, A. K. Patel, S. O. Morgan and Y.-P. Sun, Nanoscale Adv., 2021, 3, 4186–4195 RSC
- B. Zhi, X. Yao, M. Wu, A. Mensch, Y. Cui, J. Deng, J. J. Duchimaza-Heredia, K. J. Trerayapiwat, T. Niehaus, Y. Nishimoto, B. P. Frank, Y. Zhang, R. E. Lewis, E. A. Kappel, R. J. Hamers, H. D. Fairbrother, G. Orr, C. J. Murphy, Q. Cui and C. L. Haynes, Chem. Sci., 2021, 12, 2441–2455 RSC
- J. Schneider, C. J. Reckmeier, Y. Xiong, M. von Seckendorff, A. S. Susha, P. Kasák and A. L. Rogach, J. Phys. Chem. C, 2017, 121, 2014–2022 CrossRef CAS
- W. Ji, J. Yu, J. Cheng, L. Fu, Z. Zhang, B. Li, L. Chen and X. Wang, ACS Appl. Nano Mater., 2022, 5, 1656–1663 CrossRef CAS
- B. Zhao, H. Ma, M. Zheng, K. Xu, C. Zou, S. Qu and Z. a. Tan, Carbon Energy, 2022, 4, 88–114 CrossRef CAS
- A. Ghaffarkhah, E. Hosseini, M. Kamkar, A. A. Sehat, S. Dordanihaghighi, A. Allahbakhsh, C. van der Kuur and M. Arjmand, Small, 2022, 18, 2102683 CrossRef CAS PubMed
- Y. Sun, H. Qin, X. Geng, R. Yang, L. Qu, A. N. Kani and Z. Li, ACS Appl. Mater. Interfaces, 2020, 12, 31738–31744 CrossRef CAS PubMed
- D. Li, Y. Qu, X. Zhang, W. Zheng, A. L. Rogach and S. Qu, Chem. Eng. J., 2023, 454, 140069 CrossRef CAS
- D. Zhao, X. Liu, C. Wei, Y. Qu, X. Xiao and H. Cheng, RSC Adv., 2019, 9, 29533–29540 RSC
- X. Wei, D. Yang, L. Wang, Z. Wen, Z. Cui, L. Wang, H. He, W. Zhang, Z. Han, S. Mei, S. Qu and R. Guo, Colloids Surf., B, 2022, 220, 112869 CrossRef CAS PubMed
- T. Zhang, J. Zhu, Y. Zhai, H. Wang, X. Bai, B. Dong, H. Wang and H. Song, Nanoscale, 2017, 9, 13042–13051 RSC
- E. V. Kundelev, N. V. Tepliakov, M. Y. Leonov, V. G. Maslov, A. V. Baranov, A. V. Fedorov, I. D. Rukhlenko and A. L. Rogach, J. Phys. Chem. Lett., 2019, 10, 5111–5116 CrossRef CAS PubMed
- E. V. Kundelev, N. V. Tepliakov, M. Y. Leonov, V. G. Maslov, A. V. Baranov, A. V. Fedorov, I. D. Rukhlenko and A. L. Rogach, J. Phys. Chem. Lett., 2020, 11, 8121–8127 CrossRef CAS PubMed
- M. Fu, F. Ehrat, Y. Wang, K. Z. Milowska, C. Reckmeier, A. L. Rogach, J. K. Stolarczyk, A. S. Urban and J. Feldmann, Nano Lett., 2015, 15, 6030–6035 CrossRef CAS PubMed
- Y. Yan, J. Chen, N. Li, J. Tian, K. Li, J. Jiang, J. Liu, Q. Tian and P. Chen, ACS Nano, 2018, 12, 3523–3532 CrossRef CAS PubMed
- Z. Liu, X. Lu, M. Liu and W. Wang, Molecules, 2023, 28, 2957 CrossRef CAS PubMed
- F. Ehrat, S. Bhattacharyya, J. Schneider, A. Löf, R. Wyrwich, A. L. Rogach, J. K. Stolarczyk, A. S. Urban and J. Feldmann, Nano Lett., 2017, 17, 7710–7716 CrossRef CAS PubMed
- S. Ghosh, A. Ghosh, G. Ghosh, K. Marjit and A. Patra, J. Phys. Chem. Lett., 2021, 12, 8080–8087 CrossRef CAS PubMed
- S. Anwar, H. Ding, M. Xu, X. Hu, Z. Li, J. Wang, L. Liu, L. Jiang, D. Wang, C. Dong, M. Yan, Q. Wang and H. Bi, ACS Appl. Bio Mater., 2019, 2, 2317–2338 CrossRef CAS PubMed
- P. Sengar, K. Chauhan and G. A. Hirata, Transl. Oncol., 2022, 24, 101482 CrossRef CAS PubMed
- A. L. Abdelhady, M. I. Saidaminov, B. Murali, V. Adinolfi, O. Voznyy, K. Katsiev, E. Alarousu, R. Comin, I. Dursun, L. Sinatra, E. H. Sargent, O. F. Mohammed and O. M. Bakr, J. Phys. Chem. Lett., 2016, 7, 295–301 CrossRef CAS PubMed
- P. Rani, R. Dalal, S. Srivastava and K. Tankeshwar, Phys. Chem. Chem. Phys., 2022, 24, 26232–26240 RSC
- R. Kumari, A. Kumar, N. K. Mishra and S. K. Sahu, Langmuir, 2022, 38, 9389–9399 CrossRef CAS PubMed
- L.-p. Li, X.-f. Ren, P.-r. Bai, Y. Liu, W.-y. Xu, J. Xie and R.-p. Zhang, New Carbon Mater., 2021, 36, 632–638 CrossRef CAS
- K. Shao, L. Wang, Y. Wen, T. Wang, Y. Teng, Z. Shen and Z. Pan, Anal. Chim. Acta, 2019, 1068, 52–59 CrossRef CAS PubMed
- W.-B. Zhao, D.-D. Chen, K.-K. Liu, Y. Wang, R. Zhou, S.-Y. Song, F.-K. Li, L.-Z. Sui, Q. Lou, L. Hou and C.-X. Shan, Chem. Eng. J., 2023, 452, 139231 CrossRef CAS
- C. Ji, Q. Han, Y. Zhou, J. Wu, W. Shi, L. Gao, R. M. Leblanc and Z. Peng, Carbon, 2022, 192, 198–208 CrossRef CAS
- X. Geng, Y. Sun, Z. Li, R. Yang, Y. Zhao, Y. Guo, J. Xu, F. Li, Y. Wang, S. Lu and L. Qu, Small, 2019, 15, 1901517 CrossRef CAS PubMed
- W. Wei, C. Xu, L. Wu, J. Wang, J. Ren and X. Qu, Sci. Rep., 2014, 4, 1–7 Search PubMed
- X. Li, X. Yan, C. Wang, Y. Ma, Y. Jiang, R. Wang, D. Shi, Z. Li, G. Zhu and B. Tan, Microchem. J., 2022, 183, 108123 CrossRef CAS
- L. Wang, B. Wang, E. Liu, Y. Zhao, B. He, C. Wang, G. Xing, Z. Tang, Y. Zhou and S. Qu, Chin. Chem. Lett., 2022, 33, 4111–4115 CrossRef CAS
- X. Niu, T. Song and H. Xiong, Chin. Chem. Lett., 2021, 32, 1953–1956 CrossRef CAS
- A. Demirbaş, Energy Convers. Manage., 2001, 42, 1357–1378 CrossRef
-
M. Kaltschmitt, in Energy from Organic Materials (Biomass): A Volume in the Encyclopedia of Sustainability Science and Technology, ed. M. Kaltschmitt, Springer New York, New York, NY, 2nd edn, 2019, pp. 1–14, DOI:10.1007/978-1-4939-7813-7_924
- J. C. Serrano-Ruiz, Molecules, 2020, 25, 5217 CrossRef CAS PubMed
- D. Shen, R. Xiao, S. Gu and K. Luo, RSC Adv., 2011, 1, 1641–1660 RSC
- H. Wang, G. Gurau and R. D. Rogers, Chem. Soc. Rev., 2012, 41, 1519–1537 RSC
- G. Stork and S. Raucher, J. Am. Chem. Soc., 1976, 98, 1583–1584 CrossRef CAS PubMed
-
A. Blanco and G. Blanco, in Medical Biochemistry, ed. A. Blanco and G. Blanco, Academic Press, 2017, pp. 73–97, DOI:10.1016/B978-0-12-803550-4.00004-5
- H. Rao, W. Liu, K. He, S. Zhao, Z. Lu, S. Zhang, M. Sun, P. Zou, X. Wang, Q. Zhao, Y. Wang and T. Liu, ACS Sustain. Chem. Eng., 2020, 8, 8857–8867 CrossRef CAS
- J. Wang, J. Wang, W. Xiao, Z. Geng, D. Tan, L. Wei, J. Li, L. Xue, X. Wang and J. Zhu, Anal. Methods, 2020, 12, 3218–3224 RSC
- T. C. Wareing, P. Gentile and A. N. Phan, ACS Nano, 2021, 15, 15471–15501 CrossRef CAS PubMed
- S. Perumal, R. Atchudan, T. N. J. I. Edison and Y. R. Lee, J. Environ. Chem. Eng., 2021, 9, 105802 CrossRef CAS
- C. Kang, Y. Huang, H. Yang, X. F. Yan and Z. P. Chen, Nanomaterials, 2020, 10, 2316 CrossRef CAS PubMed
- H. Liu, J. Ding, K. Zhang and L. Ding, TrAC, Trends Anal. Chem., 2019, 118, 315–337 CrossRef CAS
- V. Singh, S. Chatterjee, M. Palecha, P. Sen, B. Ateeq and V. Verma, Carbon Lett., 2021, 31, 117–123 CrossRef
- V. Singh, K. S. Rawat, S. Mishra, T. Baghel, S. Fatima, A. A. John, N. Kalleti, D. Singh, A. Nazir, S. K. Rath and A. Goel, J. Mater. Chem. B, 2018, 6, 3366–3371 RSC
- C. Zhang, Y. Xiao, Y. Ma, B. Li, Z. Liu, C. Lu, X. Liu, Y. Wei, Z. Zhu and Y. Zhang, J. Photochem. Photobiol., B, 2017, 174, 315–322 CrossRef CAS PubMed
- C. Liang, X. Xie, D. Zhang, J. Feng, S. Lu and Q. Shi, J. Mater. Chem. B, 2021, 9, 5670–5681 RSC
- C. Tang, R. Long, X. Tong, Y. Guo, C. Tong and S. Shi, Microchem. J., 2021, 164, 106000 CrossRef CAS
- D. Zhang, F. Zhang, S. Wang, S. Hu, Y. Liao, F. Wang and H. Liu, Spectrochim. Acta, Part A, 2023, 290, 122285 CrossRef CAS PubMed
- S. Wang, H. Zhao, J. Yang, Y. Dong, S. Guo, Q. Cheng, Y. Li and S. Liu, ACS Omega, 2023, 8, 6550–6558 CrossRef CAS PubMed
- M. Tariq, A. Singh, N. Varshney, S. K. Samanta and M. P. Sk, Mater. Today Commun., 2022, 33, 104347 CrossRef CAS
- H. Yang, X. Su, L. Cai, Z. Sun, Y. Lin, J. Yu, L. Hao and C. Liu, J. Environ. Chem. Eng., 2022, 10, 108718 CrossRef CAS
- W. Zhang, L. Li, M. Yan, J. Ma, J. Wang, C. Liu, Y. Bao, H. Jin and Q. Fan, ACS Sustain. Chem. Eng., 2023, 11, 5082–5092 CrossRef CAS
- S. Hu, A. Trinchi, P. Atkin and I. Cole, Angew. Chem., Int. Ed., 2015, 54, 2970–2974 CrossRef CAS PubMed
- D. Qu, M. Zheng, J. Li, Z. Xie and Z. Sun, Light: Sci. Appl., 2015, 4, e364 CrossRef CAS
- A. Lv, Q. Chen, C. Zhao, S. Li, S. Sun, J. Dong, Z. Li and H. Lin, Chin. Chem. Lett., 2021, 32, 3653–3664 CrossRef CAS
- Z. Tian, X. Zhang, D. Li, D. Zhou, P. Jing, D. Shen, S. Qu, R. Zboril and A. L. Rogach, Adv. Opt. Mater., 2017, 5, 1700416 CrossRef
- Y. Xian and K. Li, Adv. Mater., 2022, 34, 2201031 CrossRef CAS PubMed
- D. Gao, X. Liu, D. Jiang, H. Zhao, Y. Zhu, X. Chen, H. Luo, H. Fan and X. Zhang, Sens. Actuators, B, 2018, 277, 373–380 CrossRef CAS
- J. Li and X. Gong, Small, 2022, 18, 2205099 CrossRef CAS PubMed
- L. Jiang, H. Ding, M. Xu, X. Hu, S. Li, M. Zhang, Q. Zhang, Q. Wang, S. Lu, Y. Tian and H. Bi, Small, 2020, 16, 2000680 CrossRef CAS PubMed
- Z. Sun, F. Yan, J. Xu, H. Zhang and L. Chen, Nano Res., 2022, 15, 414–422 CrossRef CAS
- C. J. Reckmeier, Y. Wang, R. Zboril and A. L. Rogach, J. Phys. Chem. C, 2016, 120, 10591–10604 CrossRef CAS
- Y.-H. Chien, K. K. Chan, S. H. K. Yap and K.-T. Yong, J. Chem. Technol. Biotechnol., 2018, 93, 1519–1528 CrossRef CAS
- M. Behi, L. Gholami, S. Naficy, S. Palomba and F. Dehghani, Nanoscale Adv., 2022, 4, 353–376 RSC
- S. Hill and M. C. Galan, Beilstein J. Org. Chem., 2017, 13, 675–693 CrossRef CAS PubMed
- X. Li, S. Zhang, S. A. Kulinich, Y. Liu and H. Zeng, Sci. Rep., 2014, 4, 4976 CrossRef CAS
- Q. Wang, H. Zheng, Y. Long, L. Zhang, M. Gao and W. Bai, Carbon, 2011, 49, 3134–3140 CrossRef CAS
- J.-I. Yoshida, Chem. Rec., 2010, 10, 332–341 CrossRef CAS PubMed
- N. Papaioannou, M.-M. Titirici and A. Sapelkin, ACS Omega, 2019, 4, 21658–21665 CrossRef CAS PubMed
- S. Sri, R. Kumar, A. K. Panda and P. R. Solanki, ACS Appl. Mater. Interfaces, 2018, 10, 37835–37845 CrossRef CAS PubMed
- M. Sun, Y. Han, X. Yuan, P. Jing, L. Zhang, J. Zhao and Y. Zheng, Nanoscale, 2020, 12, 15823–15831 RSC
- R. Dai, X. Chen, N. Ouyang and Y. Hu, Chem. Eng. J., 2022, 431, 134172 CrossRef CAS
- S. Khan, A. Gupta, N. C. Verma and C. K. Nandi, Nano Lett., 2015, 15, 8300–8305 CrossRef CAS PubMed
- A. O. da Silva, M. O. Rodrigues, M. H. Sousa and A. F. C. Campos, Colloids Surf., A, 2021, 621, 126578 CrossRef CAS
- K. Zhao, X. Zheng, H. Zhang, M. Xu, S. Wang, Q. Yang and C. Xiong, J. Alloys Compd., 2019, 793, 613–619 CrossRef CAS
- L. Yang, S. Liu, T. Quan, Y. Tao, M. Tian, L. Wang, J. Wang, D. Wang and D. Gao, J. Colloid Interface Sci., 2022, 612, 650–663 CrossRef CAS PubMed
- T. V. de Medeiros, J. Manioudakis, F. Noun, J.-R. Macairan, F. Victoria and R. Naccache, J. Mater. Chem. C, 2019, 7, 7175–7195 RSC
- X. Sun and Y. Lei, TrAC, Trends Anal. Chem., 2017, 89, 163–180 CrossRef CAS
- W. Meng, X. Bai, B. Wang, Z. Liu, S. Lu and B. Yang, Energy Environ. Mater., 2019, 2, 172–192 CrossRef CAS
-
O. Polat, S. G. Gizer, M. Sahiner and N. Sahiner, in Functionalized Carbon Nanomaterials for Theranostic Applications, ed. S. Mallakpour and C. M. Hussain, Elsevier, 2023, pp. 19–53, DOI:10.1016/B978-0-12-824366-4.00012-1
-
R. Jelinek, in Carbon Quantum Dots: Synthesis, Properties and Applications, ed. R. Jelinek, Springer International Publishing, Cham, 2017, pp. 29–46, DOI:10.1007/978-3-319-43911-2_3
- Y. Choi, Y. Choi, O.-H. Kwon and B.-S. Kim, Chem. – Asian J., 2018, 13, 586–598 CrossRef CAS PubMed
- Y. Ganjkhanlou, J. J. E. Maris, J. Koek, R. Riemersma, B. M. Weckhuysen and F. Meirer, J. Phys. Chem. C, 2022, 126, 2720–2727 CrossRef CAS PubMed
- V. Michaud, J. Pracht, F. Schilfarth, C. Damm, B. Platzer, P. Haines, C. Harreiß, D. M. Guldi, E. Spiecker and W. Peukert, Nanoscale, 2021, 13, 13116–13128 RSC
- P. Bag, R. K. Maurya, A. Dadwal, M. Sarkar, P. A. Chawla, R. K. Narang and B. Kumar, ChemistrySelect, 2021, 6, 2774–2789 CrossRef CAS
- C. He, P. Xu, X. Zhang and W. Long, Carbon, 2022, 186, 91–127 CrossRef CAS
-
S. Mallakpour and C. M. Hussain, Environmental Applications of Carbon Nanomaterials-Based Devices, Wiley Online Library, 2021 Search PubMed
- A. A. Kokorina, A. V. Sapelkin, G. B. Sukhorukov and I. Y. Goryacheva, Adv. Colloid Interface Sci., 2019, 274, 102043 CrossRef CAS PubMed
- J. B. Essner, J. A. Kist, L. Polo-Parada and G. A. Baker, Chem. Mater., 2018, 30, 1878–1887 CrossRef CAS
- A. L. Himaja, P. S. Karthik and S. P. Singh, Chem. Rec., 2015, 15, 595–615 CrossRef CAS PubMed
- A. L. Himaja, P. S. Karthik, B. Sreedhar and S. P. Singh, J. Fluoresc., 2014, 24, 1767–1773 CrossRef CAS PubMed
- M. Irfan, M. Irfan, A. Idris, N. Baig, T. A. Saleh, R. Nasiri, Y. Iqbal, N. Muhammad, F. Rehman and H. Khalid, J. Biomed. Mater. Res., Part A, 2019, 107, 513–525 CrossRef CAS PubMed
- S. Paul, S. Hazra and A. Banerjee, ACS Sustain. Chem. Eng., 2021, 9, 12912–12921 CrossRef CAS
- Y. Song, S. Zhu, S. Zhang, Y. Fu, L. Wang, X. Zhao and B. Yang, J. Mater. Chem. C, 2015, 3, 5976–5984 RSC
- Y.-P. Sun, X. Wang, F. Lu, L. Cao, M. J. Meziani, P. G. Luo, L. Gu and L. M. Veca, J. Phys. Chem. C, 2008, 112, 18295–18298 CrossRef CAS PubMed
- P. Li, A. Kumar, J. Ma, Y. Kuang, L. Luo and X. Sun, Sci. Bull., 2018, 63, 645–662 CrossRef CAS PubMed
- J. Chen, Z. Gong, W. Tang, K. H. Row and H. Qiu, TrAC, Trends Anal. Chem., 2021, 134, 116135 CrossRef CAS
- F. de Andrés and Á. Ríos, Microchem. J., 2021, 161, 105773 CrossRef
- Y. Shen, M. Y. Gee and A. B. Greytak, Chem. Commun., 2017, 53, 827–841 RSC
- Z. Liu, F. Li, Y. Luo, M. Li, G. Hu, X. Pu, T. Tang, J. Wen, X. Li and W. Li, Molecules, 2021, 26, 3922 CrossRef CAS PubMed
- Y. Zhou, E. M. Zahran, B. A. Quiroga, J. Perez, K. J. Mintz, Z. Peng, P. Y. Liyanage, R. R. Pandey, C. C. Chusuei and R. M. Leblanc, Appl. Catal., B, 2019, 248, 157–166 CrossRef CAS PubMed
- A. M. P., S. Pardhiya and P. Rajamani, Small, 2022, 18, 2105579 CrossRef CAS PubMed
- S. Xiong, R. Tang, D. Gong, Y. Deng, J. Zheng, L. Li, Z. Zhou, L. Yang and L. Su, Chin. J. Catal., 2022, 43, 1719–1748 CrossRef CAS
- Y. Park, J. Yoo, B. Lim, W. Kwon and S. W. Rhee, J. Mater. Chem. A, 2016, 4, 11582–11603 RSC
- A. Loukanov, R. Sekiya, M. Yoshikawa, N. Kobayashi, Y. Moriyasu and S. Nakabayashi, J. Phys. Chem. C, 2016, 120, 15867–15874 CrossRef CAS
- L. Liu and Z. Xu, Anal. Methods, 2019, 11, 760–766 RSC
- Z. Zhou, P. Tian, X. Liu, S. Mei, D. Zhou, D. Li, P. Jing, W. Zhang, R. Guo, S. Qu and A. L. Rogach, Adv. Sci., 2018, 5, 1800369 CrossRef PubMed
- S. Mukherjee, E. Prasad and A. Chadha, Phys. Chem. Chem. Phys., 2017, 19, 7288–7296 RSC
- C. M. Singaravelu, X. Deschanels, C. Rey and J. Causse, ACS Appl. Nano Mater., 2021, 4, 6386–6397 CrossRef CAS
- S. Chernyak, A. Podgornova, S. Dorofeev, S. Maksimov, K. Maslakov, S. Savilov and V. Lunin, Appl. Surf. Sci., 2020, 507, 145027 CrossRef CAS
- H. Tetsuka, A. Nagoya, T. Fukusumi and T. Matsui, Adv. Mater., 2016, 28, 4632–4638 CrossRef CAS PubMed
- B. Zhang, B. Wang, E. V. Ushakova, B. He, G. Xing, Z. Tang, A. L. Rogach and S. Qu, Small, 2204158 Search PubMed
- Y. Ma, X. Zhang, J. Bai, K. Huang and L. Ren, Chem. Eng. J., 2019, 374, 787–792 CrossRef CAS
- F. Yan, Y. Jiang, X. Sun, J. Wei, L. Chen and Y. Zhang, Nano Res., 2020, 13, 52–60 CrossRef CAS
- K. Jiang, S. Sun, L. Zhang, Y. Lu, A. Wu, C. Cai and H. Lin, Angew. Chem., Int. Ed., 2015, 54, 5360–5363 CrossRef CAS PubMed
- B. Wang, J. Yu, L. Sui, S. Zhu, Z. Tang, B. Yang and S. Lu, Adv. Sci., 2021, 8, 2001453 CrossRef CAS PubMed
- X. Yang, L. Ai, J. Yu, G. I. N. Waterhouse, L. Sui, J. Ding, B. Zhang, X. Yong and S. Lu, Sci. Bull., 2022, 67, 1450–1457 CrossRef CAS PubMed
- B. Lyu, H.-J. Li, F. Xue, L. Sai, B. Gui, D. Qian, X. Wang and J. Yang, Chem. Eng. J., 2020, 388, 124285 CrossRef CAS
- M. Zheng, L. Qiao, Y. Su, P. Gao and Z. Xie, J. Mater. Chem. B, 2019, 7, 3840–3845 RSC
- H. Song, X. Liu, B. Wang, Z. Tang and S. Lu, Sci. Bull., 2019, 64, 1788–1794 CrossRef CAS PubMed
- B.-P. Jiang, B. Zhou, X.-C. Shen, Y.-X. Yu, S.-C. Ji, C.-C. Wen and H. Liang, Chem. –Eur. J., 2015, 21, 18993–18999 CrossRef CAS PubMed
- L. Li, R. Zhang, C. Lu, J. Sun, L. Wang, B. Qu, T. Li, Y. Liu and S. Li, J. Mater. Chem. B, 2017, 5, 7328–7334 RSC
- H. Ding, X. Zhou, B. Qin, Z. Zhou and Y. Zhao, J. Lumin., 2019, 211, 298–304 CrossRef CAS
- Y. Li, G. Bai, S. Zeng and J. Hao, ACS Appl. Mater. Interfaces, 2019, 11, 4737–4744 CrossRef CAS PubMed
- J. Liu, Y. Geng, D. Li, H. Yao, Z. Huo, Y. Li, K. Zhang, S. Zhu, H. Wei, W. Xu, J. Jiang and B. Yang, Adv. Mater., 2020, 32, 1906641 CrossRef CAS PubMed
- A. Bhati, S. R. Anand, Gunture, A. K. Garg, P. Khare and S. K. Sonkar, ACS Sustain. Chem. Eng., 2018, 6, 9246–9256 CrossRef CAS
- M. Zheng, Y. Li, S. Liu, W. Wang, Z. Xie and X. Jing, ACS Appl. Mater. Interfaces, 2016, 8, 23533–23541 CrossRef CAS PubMed
- S. Ghosh, H. Ali and N. R. Jana, ACS Sustain. Chem. Eng., 2019, 7, 12629–12637 CAS
- L. Pan, S. Sun, L. Zhang, K. Jiang and H. Lin, Nanoscale, 2016, 8, 17350–17356 RSC
- R.-S. Juang, C.-T. Hsieh, C.-P. Kao, Y. A. Gandomi, C.-C. Fu, S.-H. Liu and S. Gu, Carbon, 2021, 176, 61–70 CrossRef CAS
- C. Dan, Z. Zhao, J. Feng, Y. Xin, Y. Yang and L. Shi, Sens. Actuators, B, 2021, 349, 130774 CrossRef
- D. Song, J. Tian, W. Xu, H. Wen, C. Wang, J. Tang, J. Zhang and M. Guo, Carbon, 2021, 174, 741–749 CrossRef CAS
- D. P. Damera, V. Krishna, V. V. K. Venuganti and A. Nag, J. Photochem. Photobiol., B, 2021, 225, 112335 CrossRef CAS PubMed
- Y. Qu, X. Bai, D. Li, X. Zhang, C. Liang, W. Zheng and S. Qu, J. Colloid Interface Sci., 2022, 613, 547–553 CrossRef CAS PubMed
- H. Li, Z. Wei, X. Zuo, H. Chen, C. Ren, Y. Dong and X. Chen, Dyes Pigm., 2022, 206, 110614 CrossRef CAS
- M.-J. Fu, N. Wei, L.-F. Pang, X.-F. Guo and H. Wang, Sens. Actuators, B, 2022, 351, 130939 CrossRef CAS
- W. Wang, J. Wu, Y. Xing and Z. Wang, Sens. Actuators, B, 2022, 360, 131645 CrossRef CAS
- L. Cao, T. Zhu, M. Zan, Y. Liu, X. Xing, Q. Qian, Q. Mei, W.-F. Dong and L. Li, Sens. Actuators, B, 2022, 370, 132424 CrossRef CAS
- X. Li, Q. Hu, K. Yang, S. Zhao, S. Zhu, B. Wang, Y. Zhang, J. Yi, X. Song and M. Lan, Sens. Actuators, B, 2022, 371, 132534 CrossRef CAS
- W. Zhao, Y. Wang, K. Liu, R. Zhou and C. Shan, Chin. Chem. Lett., 2022, 33, 798–802 CrossRef CAS
- L. Jin, Y. Shao, X. Chen, X. Wang, Q. Wang, Y. Wang, Y. Zhu, H. Yu, L. Han and F. Tian, J. Photochem. Photobiol., A, 2022, 425, 113702 CrossRef CAS
- Y. Jing, G. Liu, C. Zhang, B. Yu, J. Sun, D. Lin and J. Qu, ACS Appl. Bio Mater., 2022, 5, 1187–1193 CrossRef CAS PubMed
- C. Xia, S. Zhu, T. Feng, M. Yang and B. Yang, Adv. Sci., 2019, 6, 1901316 CrossRef CAS PubMed
- S. A. Shaik, S. Sengupta, R. S. Varma, M. B. Gawande and A. Goswami, ACS Sustain. Chem. Eng., 2021, 9, 3–49 CrossRef CAS
- Z. Hallaji, Z. Bagheri, S.-O. Kalji, E. Ermis and B. Ranjbar, FlatChem, 2021, 29, 100271 CrossRef CAS
- S. K. Tammina, A. Khan and J.-W. Rhim, Chemosphere, 2023, 313, 137433 CrossRef CAS PubMed
- M. Dyksik, S. Wang, W. Paritmongkol, D. K. Maude, W. A. Tisdale, M. Baranowski and P. Plochocka, J. Phys. Chem. Lett., 2021, 12, 1638–1643 CrossRef CAS PubMed
- D. Thureja, A. Imamoglu, T. Smoleński, I. Amelio, A. Popert, T. Chervy, X. Lu, S. Liu, K. Barmak, K. Watanabe, T. Taniguchi, D. J. Norris, M. Kroner and P. A. Murthy, Nature, 2022, 606, 298–304 CrossRef CAS PubMed
- N. N. Negulyaev, V. S. Stepanyuk, L. Niebergall, P. Bruno, W. Hergert, J. Repp, K. H. Rieder and G. Meyer, Phys. Rev. Lett., 2008, 101, 226601 CrossRef CAS PubMed
-
R. W. Kelsall, I. W. Hamley and M. Geoghegan, Nanoscale Science and Technology, 2005 Search PubMed
- X. Li, Z. Lu and T. Wang, Nano Res., 2021, 14, 1233–1243 CrossRef CAS
- J. Shamsi, A. S. Urban, M. Imran, L. De Trizio and L. Manna, Chem. Rev., 2019, 119, 3296–3348 CrossRef CAS PubMed
- F. A. Permatasari, M. A. Irham, S. Z. Bisri and F. Iskandar, Nanomaterials, 2021, 11, 91 CrossRef CAS PubMed
- T. T. Tran, J. R. Panella, J. R. Chamorro, J. R. Morey and T. M. McQueen, Mater. Horiz., 2017, 4, 688–693 RSC
- M. S. Rudner and N. H. Lindner, Nat. Rev. Phys., 2020, 2, 229–244 CrossRef CAS
- J. Even, L. Pedesseau, C. Katan, M. Kepenekian, J.-S. Lauret, D. Sapori and E. Deleporte, J. Phys. Chem. C, 2015, 119, 10161–10177 CrossRef CAS
- Y. E. Panfil, M. Oded and U. Banin, Angew. Chem., Int. Ed., 2018, 57, 4274–4295 CrossRef CAS PubMed
- R. Negishi, M. Akabori, T. Ito, Y. Watanabe and Y. Kobayashi, Sci. Rep., 2016, 6, 1–10 CrossRef PubMed
- S. Winkler, P. Amsalem, J. Frisch, M. Oehzelt, G. Heimel and N. Koch, Mater. Horiz., 2015, 2, 427–433 RSC
- X. Wang, F. Wang, Y. Sang and H. Liu, Adv. Energy Mater., 2017, 7, 1700473 CrossRef
- S. Kanungo, G. Ahmad, P. Sahatiya, A. Mukhopadhyay and S. Chattopadhyay, npj 2D Mater. Appl., 2022, 6, 83 CrossRef CAS
- J. Jin, N. Hu and H. Hu, Int. J. Mech. Sci., 2022, 219, 107100 CrossRef
- A. Chaves, J. G. Azadani, H. Alsalman, D. R. da Costa, R. Frisenda, A. J. Chaves, S. H. Song, Y. D. Kim, D. He, J. Zhou, A. Castellanos-Gomez, F. M. Peeters, Z. Liu, C. L. Hinkle, S.-H. Oh, P. D. Ye, S. J. Koester, Y. H. Lee, P. Avouris, X. Wang and T. Low, npj 2D Mater. Appl., 2020, 4, 29 CrossRef CAS
- M. J. Molaei, Talanta, 2019, 196, 456–478 CrossRef CAS PubMed
- K. Barve, U. Singh, P. Yadav and D. Bhatia, Mater. Chem. Front., 2023, 7, 1781–1802 RSC
- H.-L. Yang, L.-F. Bai, Z.-R. Geng, H. Chen, L.-T. Xu, Y.-C. Xie, D.-J. Wang, H.-W. Gu and X.-M. Wang, Mater. Today Adv., 2023, 18, 100376 CrossRef CAS
- K. Davis, R. Yarbrough, M. Froeschle, J. White and H. Rathnayake, RSC Adv., 2019, 9, 14638–14648 RSC
- Y. Yan, J. Gong, J. Chen, Z. Zeng, W. Huang, K. Pu, J. Liu and P. Chen, Adv. Mater., 2019, 31, 1808283 CrossRef PubMed
- Z.-G. Yu, Phys. Chem. Chem. Phys., 2017, 19, 14907–14912 RSC
- F. Murphy-Armando, M. Brehm, P. Steindl, M. T. Lusk, T. Fromherz, K. Schwarz and P. Blaha, Phys. Rev. B, 2021, 103, 085310 CrossRef CAS
- E. Cerrato, M. C. Paganini and E. Giamello, J. Photochem. Photobiol., A, 2020, 397, 112531 CrossRef CAS
- V. L. John, Y. Nair and T. P. Vinod, Part. Part. Syst. Charact., 2021, 38, 2100170 CrossRef CAS
- N. Li, F. Lei, D. Xu, Y. Li, J. Liu and Y. Shi, Opt. Mater., 2021, 111, 110618 CrossRef CAS
- B. Yang, X. Mao, F. Hong, W. Meng, Y. Tang, X. Xia, S. Yang, W. Deng and K. Han, J. Am. Chem. Soc., 2018, 140, 17001–17006 CrossRef CAS PubMed
- C. Kang, S. Tao, F. Yang and B. Yang, Aggregate, 2022, 3, e169 CrossRef CAS
- Z. Zhu, Y. Zhai, Z. Li, P. Zhu, S. Mao, C. Zhu, D. Du, L. A. Belfiore, J. Tang and Y. Lin, Mater. Today, 2019, 30, 52–79 CrossRef CAS
- X.-D. Tang, H.-M. Yu, W. Nguyen, E. Amador, S.-P. Cui, K. Ma, M.-L. Chen, S.-Y. Wang, Z.-Z. Hu and W. Chen, Adv. Photonics Res., 2023, 4, 2200314 CrossRef CAS
- Y. Liu, X. Kang, Y. Xu, Y. Li, S. Wang, C. Wang, W. Hu, R. Wang and J. Liu, ACS Appl. Mater. Interfaces, 2022, 14, 22363–22371 CrossRef CAS PubMed
-
G. A. Medeiros, C. V. da Silva Rodrigues, J. Spencer and B. A. D. Neto, in Quantum Materials, Devices, and Applications, ed. M. Henini and M. O. Rodrigues, Elsevier, 2023, pp. 201–213, DOI:10.1016/B978-0-12-820566-2.00004-1
- C. Han, Y.-H. Li, M.-Y. Qi, F. Zhang, Z.-R. Tang and Y.-J. Xu, Sol. RRL, 2020, 4, 1900577 CrossRef CAS
- H. A. Nguyen, I. Srivastava, D. Pan and M. Gruebele, ACS Nano, 2020, 14, 6127–6137 CrossRef CAS PubMed
- J. Shen, Y. Zhu, X. Yang, J. Zong, J. Zhang and C. Li, New J. Chem., 2012, 36, 97–101 RSC
- J. Shen, Y. Zhu, X. Yang and C. Li, Chem. Commun., 2012, 48, 3686–3699 RSC
- S. Ahirwar, S. Mallick and D. Bahadur, ACS Omega, 2017, 2, 8343–8353 CrossRef CAS PubMed
- M. Nirmal, C. B. Murray and M. G. Bawendi, Phys. Rev. B: Condens. Matter Mater. Phys., 1994, 50, 2293–2300 CrossRef CAS PubMed
- J. E. Abraham and M. Balachandran, J. Fluoresc., 2022, 32, 887–906 CrossRef PubMed
- K. A. Wepasnick, B. A. Smith, K. E. Schrote, H. K. Wilson, S. R. Diegelmann and D. H. Fairbrother, Carbon, 2011, 49, 24–36 CrossRef CAS
- J. T. Paci, T. Belytschko and G. C. Schatz, J. Phys. Chem. C, 2007, 111, 18099–18111 CrossRef CAS
- T. Szabó, O. Berkesi, P. Forgó, K. Josepovits, Y. Sanakis, D. Petridis and I. Dékány, Chem. Mater., 2006, 18, 2740–2749 CrossRef
- P. Chingombe, B. Saha and R. J. Wakeman, Carbon, 2005, 43, 3132–3143 CrossRef CAS
- Z. Gan, H. Xu and Y. Hao, Nanoscale, 2016, 8, 7794–7807 RSC
- C. Hu, M. Li, J. Qiu and Y.-P. Sun, Chem. Soc. Rev., 2019, 48, 2315–2337 RSC
- F. Vetrone, R. Naccache, V. Mahalingam, C. G. Morgan and J. A. Capobianco, Adv. Funct. Mater., 2009, 19, 2924–2929 CrossRef CAS
- R. Arppe, I. Hyppänen, N. Perälä, R. Peltomaa, M. Kaiser, C. Würth, S. Christ, U. Resch-Genger, M. Schäferling and T. Soukka, Nanoscale, 2015, 7, 11746–11757 RSC
- Z. Liu, H. Zou, N. Wang, T. Yang, Z. Peng, J. Wang, N. Li and C. Huang, Sci. China: Chem., 2018, 61, 490–496 CrossRef CAS
- Y. Zhang, R. Yuan, M. He, G. Hu, J. Jiang, T. Xu, L. Zhou, W. Chen, W. Xiang and X. Liang, Nanoscale, 2017, 9, 17849–17858 RSC
- S. Chen, N. Ullah, T. Wang and R. Zhang, J. Mater. Chem. C, 2018, 6, 6875–6883 RSC
- L. Jia, W. Zheng and F. Huang, PhotoniX, 2020, 1, 22 CrossRef
- H. Zhang, G. Chen and D. W. Bahnemann, J. Mater. Chem., 2009, 19, 5089–5121 RSC
- A. Alhebshi, E. Sharaf Aldeen, R. S. Mim, B. Tahir and M. Tahir, Int. J. Energy Res., 2022, 46, 5523–5584 CrossRef CAS
-
N. Joshi, Photoconductivity: Art: Science & Technology, CRC Press, 1990 Search PubMed
- S. Wang, I. S. Cole, D. Zhao and Q. Li, Nanoscale, 2016, 8, 7449–7458 RSC
- R. Wang, H. Fan, W. Jiang, G. Ni and S. Qu, Appl. Surf. Sci., 2019, 467–468, 446–455 CrossRef CAS
- N. Dhenadhayalan, K.-C. Lin, R. Suresh and P. Ramamurthy, J. Phys. Chem. C, 2016, 120, 1252–1261 CrossRef CAS
- X. Zheng, Y. Huang, D. Xiao, S. Yang, Z. Lin and Q. Ling, Mater. Chem. Front., 2021, 5, 6960–6968 RSC
- B. Wang, Z. Wei, L. Sui, J. Yu, B. Zhang, X. Wang, S. Feng, H. Song, X. Yong, Y. Tian, B. Yang and S. Lu, Light: Sci. Appl., 2022, 11, 172 CrossRef CAS PubMed
- H. Matsuo, Y. Noguchi and M. Miyayama, Nat. Commun., 2017, 8, 207 CrossRef PubMed
- P. N. O. Gillespie and N. Martsinovich, ACS Appl. Mater. Interfaces, 2019, 11, 31909–31922 CrossRef CAS PubMed
- L. Tang, L. Ai, Z. Song, L. Sui, J. Yu, X. Yang, H. Song, B. Zhang, Y. Hu, Y. Zhang, Y. Tian and S. Lu, Adv. Funct. Mater., 2303363 Search PubMed
- P. Lesani, Z. Lu, G. Singh, M. Mursi, M. Mirkhalaf, E. J. New and H. Zreiqat, Nanoscale, 2021, 13, 11138–11149 RSC
- H. Wang, C. Sun, X. Chen, Y. Zhang, V. L. Colvin, Q. Rice, J. Seo, S. Feng, S. Wang and W. W. Yu, Nanoscale, 2017, 9, 1909–1915 RSC
- P. R. Kharangarh, S. Umapathy and G. Singh, Integr. Ferroelectr., 2017, 184, 114–123 CrossRef CAS
- X. Yang, X. Li, B. Wang, L. Ai, G. Li, B. Yang and S. Lu, Chin. Chem. Lett., 2022, 33, 613–625 CrossRef CAS
- M. A. Sk, A. Ananthanarayanan, L. Huang, K. H. Lim and P. Chen, J. Mater. Chem. C, 2014, 2, 6954–6960 RSC
- C. Huang, M. Feng, X. Zhu, Q. Zhou, S. Zeng, Y. Huang and H. Zhang, Macromolecules, 2021, 54, 11497–11507 CrossRef CAS
- G. Liu, D. Kong, J. Han, R. Zhou, Y. Gao, Z. Wu, L. Zhao, C. Wang, L. Wang and G. Lu, Sens. Actuators, B, 2021, 342, 129963 CrossRef CAS
- J. Zhan, B. Geng, K. Wu, G. Xu, L. Wang, R. Guo, B. Lei, F. Zheng, D. Pan and M. Wu, Carbon, 2018, 130, 153–163 CrossRef CAS
- T. Gao, X. Wang, L.-Y. Yang, H. He, X.-X. Ba, J. Zhao, F.-L. Jiang and Y. Liu, ACS Appl. Mater. Interfaces, 2017, 9, 24846–24856 CrossRef CAS PubMed
- L. Li and T. Dong, J. Mater. Chem. C, 2018, 6, 7944–7970 RSC
- H. Ding, X.-H. Li, X.-B. Chen, J.-S. Wei, X.-B. Li and H.-M. Xiong, J. Appl. Phys., 2020, 127, 231101 CrossRef CAS
- Y. Alqaheem and A. A. Alomair, Membranes, 2020, 10, 33 CrossRef CAS PubMed
-
U. Issar and R. Arora, in Environmental Applications of Carbon Nanomaterials-Based Devices, 2021, pp. 395–422, DOI:10.1002/9783527830978.ch17
- A. Kumar, S. Thota, S. Varma and J. Kumar, J. Lumin., 2011, 131, 640–648 CrossRef CAS
- N. Soni, S. Singh, S. Sharma, G. Batra, K. Kaushik, C. Rao, N. C. Verma, B. Mondal, A. Yadav and C. K. Nandi, Chem. Sci., 2021, 12, 3615–3626 RSC
- D. Li, P. Jing, L. Sun, Y. An, X. Shan, X. Lu, D. Zhou, D. Han, D. Shen, Y. Zhai, S. Qu, R. Zbořil and A. L. Rogach, Adv. Mater., 2018, 30, 1705913 CrossRef PubMed
- H. Ding, S.-B. Yu, J.-S. Wei and H.-M. Xiong, ACS Nano, 2016, 10, 484–491 CrossRef CAS PubMed
- D. Gao, Y. Zhang, A. Liu, Y. Zhu, S. Chen, D. Wei, J. Sun, Z. Guo and H. Fan, Chem. Eng. J., 2020, 388, 124199 CrossRef CAS
- K. Hola, A. B. Bourlinos, O. Kozak, K. Berka, K. M. Siskova, M. Havrdova, J. Tucek, K. Safarova, M. Otyepka, E. P. Giannelis and R. Zboril, Carbon, 2014, 70, 279–286 CrossRef CAS
- H. Ding, X.-X. Zhou, Z.-H. Zhang, Y.-P. Zhao, J.-S. Wei and H.-M. Xiong, Nano Res., 2022, 15, 3548–3555 CrossRef CAS
- J. Tong, Y. Wang, J. Mei, J. Wang, A. Qin, J. Z. Sun and B. Z. Tang, Chem. –Eur. J., 2014, 20, 4661–4670 CrossRef CAS PubMed
- A. Marini, A. Muñoz-Losa, A. Biancardi and B. Mennucci, J. Phys. Chem. B, 2010, 114, 17128–17135 CrossRef CAS PubMed
- P. Suppan, J. Photochem. Photobiol., A, 1990, 50, 293–330 CrossRef CAS
- S. Dhar, S. Singha Roy, D. K. Rana, S. Bhattacharya, S. Bhattacharya and S. C. Bhattacharya, J. Phys. Chem. A, 2011, 115, 2216–2224 CrossRef CAS PubMed
- Y. Hu, C. Neumann, L. Scholtz, A. Turchanin, U. Resch-Genger and S. Eigler, Nano Res., 2023, 16, 45–52 CrossRef CAS
- J. Basavaraja, S. R. Inamdar and H. M. Suresh Kumar, Spectrochim. Acta, Part A, 2015, 137, 527–534 CrossRef CAS PubMed
- B. Omogo, J. F. Aldana and C. D. Heyes, J. Phys. Chem. C, 2013, 117, 2317–2327 CrossRef CAS PubMed
- H. Ding, J.-S. Wei, P. Zhang, Z.-Y. Zhou, Q.-Y. Gao and H.-M. Xiong, Small, 2018, 14, 1800612 CrossRef PubMed
- D. Gao, A. Liu, Y. Zhang, Y. Zhu, D. Wei, J. Sun, H. Luo and H. Fan, Chem. Eng. J., 2021, 415, 128984 CrossRef CAS
- S. Lin, C. Lin, M. He, R. Yuan, Y. Zhang, Y. Zhou, W. Xiang and X. Liang, RSC Adv., 2017, 7, 41552–41560 RSC
- M. Ö. Alaş and R. Genç, ACS Appl. Nano Mater., 2021, 4, 7974–7987 CrossRef
- R. Sato, Y. Iso and T. Isobe, Langmuir, 2019, 35, 15257–15266 CrossRef CAS PubMed
- S. Wu, W. Li, Y. Sun, X. Zhang, J. Zhuang, H. Hu, B. Lei, C. Hu and Y. Liu, J. Colloid Interface Sci., 2019, 555, 607–614 CrossRef CAS PubMed
- J. Fan, W. Zhou, J. Chen, R. Liu, Q. Pang, L. Zhou, Z.-c. Wu and X. Zhang, Ceram. Int., 2023, 49, 23197–23205 CrossRef CAS
- C. Hu, D. Liu, Y. Xiao and L. Dai, Prog. Nat. Sci.: Mater. Int., 2018, 28, 121–132 CrossRef CAS
- Q. Xu, T. Kuang, Y. Liu, L. Cai, X. Peng, T. Sreenivasan Sreeprasad, P. Zhao, Z. Yu and N. Li, J. Mater. Chem. B, 2016, 4, 7204–7219 RSC
- G. Yang, C. Wu, X. Luo, X. Liu, Y. Gao, P. Wu, C. Cai and S. S. Saavedra, J. Phys. Chem. C, 2018, 122, 6483–6492 CrossRef CAS
- S. Miao, K. Liang, J. Zhu, B. Yang, D. Zhao and B. Kong, Nano Today, 2020, 33, 100879 CrossRef CAS
- X. Feng, Y. Bai, M. Liu, Y. Li, H. Yang, X. Wang and C. Wu, Energy Environ. Sci., 2021, 14, 2036–2089 RSC
- B. B. Karakoçak, J. Liang, S. Kavadiya, M. Y. Berezin, P. Biswas and N. Ravi, ACS Appl. Nano Mater., 2018, 1, 3682–3692 CrossRef
- F. Du, Z. Cheng, Z. Lai, G. Ruan and C. Zhao, New J. Chem., 2019, 43, 18695–18701 RSC
- Y. Li, H. Lin, C. Luo, Y. Wang, C. Jiang, R. Qi, R. Huang, J. Travas-sejdic and H. Peng, RSC Adv., 2017, 7, 32225–32228 RSC
- M. Jiao, Y. Wang, W. Wang, X. Zhou, J. Xu, Y. Xing, L. Chen, Y. Zhang, M. Chen, K. Xu and S. Zheng, Chem. Eng. J., 2022, 440, 135965 CrossRef CAS
- J. Liu, D. Li, K. Zhang, M. Yang, H. Sun and B. Yang, Small, 2018, 14, 1703919 CrossRef PubMed
- V. Arul, P. Chandrasekaran, G. Sivaraman and M. G. Sethuraman, Mater. Res. Bull., 2023, 162, 112204 CrossRef CAS
- M. Azami, J. Wei, M. Valizadehderakhshan, A. Jayapalan, O. O. Ayodele and K. Nowlin, J. Phys. Chem. C, 2023, 127, 7360–7370 CrossRef CAS PubMed
- Q. Zhang, R. Wang, B. Feng, X. Zhong and K. Ostrikov, Nat. Commun., 2021, 12, 6856 CrossRef CAS PubMed
- W. Yang, H. Zhang, J. Lai, X. Peng, Y. Hu, W. Gu and L. Ye, Carbon, 2018, 128, 78–85 CrossRef CAS
- S. Tao, C. Zhou, C. Kang, S. Zhu, T. Feng, S.-T. Zhang, Z. Ding, C. Zheng, C. Xia and B. Yang, Light: Sci. Appl., 2022, 11, 56 CrossRef CAS PubMed
- W. Wang, Y. Zhang and W. Liu, Prog. Polym. Sci., 2017, 71, 1–25 CrossRef
- H. Wang, B. Aydıner, Z. Seferoglu, F. Bureš and J. Liu, Dyes Pigm., 2022, 205, 110354 CrossRef CAS
- B. Fei, Z. Yang, S. Shao, S. Wan and J. H. Xin, Polymer, 2010, 51, 1845–1852 CrossRef CAS
- H.-T. Feng, J. Zeng, P.-A. Yin, X.-D. Wang, Q. Peng, Z. Zhao, J. W. Y. Lam and B. Z. Tang, Nat. Commun., 2020, 11, 2617 CrossRef CAS PubMed
- Y. Chen, G. Xiong, L. Zhu, J. Huang, X. Chen, Y. Chen and M. Cao, ACS Omega, 2022, 7, 6834–6842 CrossRef CAS PubMed
- R. Wang, Z. Huang, L. Ding, F. Yang and D. Peng, ACS Appl. Nano Mater., 2022, 5, 2214–2221 CrossRef CAS
- P. Li and Z. Sun, Light: Sci. Appl., 2022, 11, 81 CrossRef CAS PubMed
- M. Nieddu, M. Patrian, S. Ferrara, J. P. Fuenzalida Werner, F. Kohler, E. Anaya-Plaza, M. A. Kostiainen, H. Dietz, J. R. Berenguer and R. D. Costa, Adv. Sci., 2023, 10, 2300069 CrossRef CAS PubMed
- A. Selim, S. Kaur, A. H. Dar, S. Sartaliya and G. Jayamurugan, ACS Omega, 2020, 5, 22603–22613 CrossRef CAS PubMed
- H. Faghihi, M. R. Mozafari, A. Bumrungpert, H. Parsaei, S. V. Taheri, P. Mardani, F. M. Dehkharghani, M. Y. Pudza and M. Alavi, Photodiagn. Photodyn. Ther., 2023, 42, 103614 CrossRef CAS PubMed
- A. V. Nomoev, S. P. Bardakhanov, M. Schreiber, D. G. Bazarova, N. A. Romanov, B. B. Baldanov, B. R. Radnaev and V. V. Syzrantsev, Beilstein J. Nanotechnol., 2015, 6, 874–880 CrossRef CAS PubMed
- X. He, Z. Zhao, L.-H. Xiong, P. F. Gao, C. Peng, R. S. Li, Y. Xiong, Z. Li, H. H. Y. Sung, I. D. Williams, R. T. K. Kwok, J. W. Y. Lam, C. Z. Huang, N. Ma and B. Z. Tang, J. Am. Chem. Soc., 2018, 140, 6904–6911 CrossRef CAS PubMed
- C. Wei, J. Li, X. Xiao, T. Yue and D. Zhao, RSC Adv., 2018, 8, 20016–20024 RSC
- X. Wu, F. Yu, Y. Han, L. Jiang, Z. Li, J. Zhu, Q. Xu, A. C. Tedesco, J. Zhang and H. Bi, Nanoscale, 2023, 15, 376–386 RSC
- C. Li, Y. Zhu, X. Zhang, X. Yang and C. Li, RSC Adv., 2012, 2, 1765–1768 RSC
- Y. Lin, C. Wang, L. Li, H. Wang, K. Liu, K. Wang and B. Li, ACS Appl. Mater. Interfaces, 2015, 7, 27262–27270 CrossRef CAS PubMed
- Y.-P. Ho and K. W. Leong, Nanoscale, 2010, 2, 60–68 RSC
- A. B. Cook and P. Decuzzi, ACS Nano, 2021, 15, 2068–2098 CrossRef CAS PubMed
- M. Goldsmith, L. Abramovitz and D. Peer, ACS Nano, 2014, 8, 1958–1965 CrossRef CAS PubMed
-
P. Nayak, R. Nanda and M. Mishra, in Medical Imaging Methods, CRC Press, 2021, pp. 107–144 Search PubMed
- M. Kim, J. Jang and C. Cha, Drug Discovery Today, 2017, 22, 1430–1437 CrossRef CAS PubMed
- B. Wang, H. Cai, G. I. N. Waterhouse, X. Qu, B. Yang and S. Lu, Small Sci., 2022, 2, 2200012 CrossRef CAS
- L. Li, C. Lu, S. Li, S. Liu, L. Wang, W. Cai, W. Xu, X. Yang, Y. Liu and R. Zhang, J. Mater. Chem. B, 2017, 5, 1935–1942 RSC
- S. Wang, B. Li and F. Zhang, ACS Cent. Sci., 2020, 6, 1302–1316 CrossRef CAS PubMed
- J. Wallyn, N. Anton, S. Akram and T. F. Vandamme, Pharm. Res., 2019, 36, 78 CrossRef PubMed
- H. Li, X. Yan, D. Kong, R. Jin, C. Sun, D. Du, Y. Lin and G. Lu, Nanoscale Horiz., 2020, 5, 218–234 RSC
- L. Yue, H. Li, Q. Sun, J. Zhang, X. Luo, F. Wu and X. Zhu, ACS Appl. Nano Mater., 2020, 3, 869–876 CrossRef CAS
- R. Su, H. Yan, X. Jiang, Y. Zhang, P. Li and W. Su, J. Mater. Chem. B, 2022, 10, 1250–1264 RSC
- F. Huo, W. Liang, Y. Tang, W. Zhang, X. Liu, D. Pei, H. Wang, W. Jia, P. Jia and F. Yang, J. Mater. Sci., 2019, 54, 6815–6825 CrossRef CAS
- C. Liu, W. Fan, W.-X. Cheng, Y. Gu, Y. Chen, W. Zhou, X.-F. Yu, M. Chen, M. Zhu, K. Fan and Q.-Y. Luo, Adv. Funct. Mater., 2023, 2213856 CrossRef CAS
- J. Ge, Q. Jia, W. Liu, M. Lan, B. Zhou, L. Guo, H. Zhou, H. Zhang, Y. Wang, Y. Gu, X. Meng and P. Wang, Adv. Healthcare Mater., 2016, 5, 665–675 CrossRef CAS PubMed
- L. Jiang, H. Cai, W. Zhou, Z. Li, L. Zhang and H. Bi, Adv. Mater., 2023, 35, 2210776 CrossRef CAS PubMed
- C. Liu, W. Fan, W.-X. Cheng, Y. Gu, Y. Chen, W. Zhou, X.-F. Yu, M. Chen, M. Zhu, K. Fan and Q.-Y. Luo, Adv. Funct. Mater., 2023, 33, 2213856 CrossRef CAS
- D. Kim, H. G. Ryu and K. H. Ahn, Org. Biomol. Chem., 2014, 12, 4550–4566 RSC
- P. Lesani, A. H. Mohamad Hadi, Z. Lu, S. Palomba, E. J. New and H. Zreiqat, Commun. Mater., 2021, 2, 108 CrossRef CAS
- H. Zhang, G. Wang, Z. Zhang, J. H. Lei, T.-M. Liu, G. Xing, C.-X. Deng, Z. Tang and S. Qu, Light: Sci. Appl., 2022, 11, 113 CrossRef CAS PubMed
- L.-L. Feng, Y.-X. Wu, D.-L. Zhang, X.-X. Hu, J. Zhang, P. Wang, Z.-L. Song, X.-B. Zhang and W. Tan, Anal. Chem., 2017, 89, 4077–4084 CrossRef CAS PubMed
- W.-S. Kuo, X.-C. Shen, C.-Y. Chang, H.-F. Kao, S.-H. Lin, J.-Y. Wang and P.-C. Wu, ACS Nano, 2020, 14, 11502–11509 CrossRef CAS PubMed
- Y. Liu, H. Gou, X. Huang, G. Zhang, K. Xi and X. Jia, Nanoscale, 2020, 12, 1589–1601 RSC
- J. Gröhl, M. Schellenberg, K. Dreher and L. Maier-Hein, Photoacoustics, 2021, 22, 100241 CrossRef PubMed
- C. Yang, H. Lan, F. Gao and F. Gao, Photoacoustics, 2021, 21, 100215 CrossRef PubMed
- J. E. Lemaster and J. V. Jokerst, Wiley Interdiscip. Rev.: Nanomed. Nanobiotechnology, 2017, 9, e1404 CrossRef
- J. Weber, P. C. Beard and S. E. Bohndiek, Nat. Methods, 2016, 13, 639–650 CrossRef CAS PubMed
- A. B. E. Attia, G. Balasundaram, M. Moothanchery, U. S. Dinish, R. Bi, V. Ntziachristos and M. Olivo, Photoacoustics, 2019, 16, 100144 CrossRef PubMed
- M. Erfanzadeh and Q. Zhu, Photoacoustics, 2019, 14, 1–11 CrossRef PubMed
- Y. Liu, P. Bhattarai, Z. Dai and X. Chen, Chem. Soc. Rev., 2019, 48, 2053–2108 RSC
- J. Ge, Q. Jia, W. Liu, L. Guo, Q. Liu, M. Lan, H. Zhang, X. Meng and P. Wang, Adv. Mater., 2015, 27, 4169–4177 CrossRef CAS PubMed
- N. Parvin and T. K. Mandal, Microchim. Acta, 2017, 184, 1117–1125 CrossRef CAS
- Q. Jia, J. Ge, W. Liu, S. Liu, G. Niu, L. Guo, H. Zhang and P. Wang, Nanoscale, 2016, 8, 13067–13077 RSC
- X. Bao, Y. Yuan, J. Chen, B. Zhang, D. Li, D. Zhou, P. Jing, G. Xu, Y. Wang, K. Holá, D. Shen, C. Wu, L. Song, C. Liu, R. Zbořil and S. Qu, Light: Sci. Appl., 2018, 7, 91 CrossRef PubMed
- W. Xu, J. Chen, S. Sun, Z. Tang, K. Jiang, L. Song, Y. Wang, C. Liu and H. Lin, Nanoscale, 2018, 10, 17834–17841 RSC
- H. S. Jung, P. Verwilst, A. Sharma, J. Shin, J. L. Sessler and J. S. Kim, Chem. Soc. Rev., 2018, 47, 2280–2297 RSC
- H. Ma and M. Xue, J. Mater. Chem. A, 2021, 9, 17569–17591 RSC
- F. A. Permatasari, H. Fukazawa, T. Ogi, F. Iskandar and K. Okuyama, ACS Appl. Nano Mater., 2018, 1, 2368–2375 CrossRef CAS
- C. Scialabba, A. Sciortino, F. Messina, G. Buscarino, M. Cannas, G. Roscigno, G. Condorelli, G. Cavallaro, G. Giammona and N. Mauro, ACS Appl. Mater. Interfaces, 2019, 11, 19854–19866 CrossRef CAS PubMed
- M. Lan, S. Zhao, Z. Zhang, L. Yan, L. Guo, G. Niu, J. Zhang, J. Zhao, H. Zhang, P. Wang, G. Zhu, C.-S. Lee and W. Zhang, Nano Res., 2017, 10, 3113–3123 CrossRef CAS
- Y. Weng, S. Guan, H. Lu, X. Meng, A. Y. Kaassis, X. Ren, X. Qu, C. Sun, Z. Xie and S. Zhou, Talanta, 2018, 184, 50–57 CrossRef CAS PubMed
- C. Hou, S. Chen and M. Wang, Dalton Trans., 2018, 47, 1777–1781 RSC
- P. Agostinis, K. Berg, K. A. Cengel, T. H. Foster, A. W. Girotti, S. O. Gollnick, S. M. Hahn, M. R. Hamblin, A. Juzeniene, D. Kessel, M. Korbelik, J. Moan, P. Mroz, D. Nowis, J. Piette, B. C. Wilson and J. Golab, Ca-Cancer J. Clin., 2011, 61, 250–281 CrossRef PubMed
- S. Kwiatkowski, B. Knap, D. Przystupski, J. Saczko, E. Kędzierska, K. Knap-Czop, J. Kotlińska, O. Michel, K. Kotowski and J. Kulbacka, Biomed. Pharmacother., 2018, 106, 1098–1107 CrossRef PubMed
- M. Lan, S. Zhao, W. Liu, C.-S. Lee, W. Zhang and P. Wang, Adv. Healthcare Mater., 2019, 8, 1900132 CrossRef PubMed
- J. Xie, Y. Wang, W. Choi, P. Jangili, Y. Ge, Y. Xu, J. Kang, L. Liu, B. Zhang, Z. Xie, J. He, N. Xie, G. Nie, H. Zhang and J. S. Kim, Chem. Soc. Rev., 2021, 50, 9152–9201 RSC
- J. Dobson, G. F. de Queiroz and J. P. Golding, Vet. J., 2018, 233, 8–18 CrossRef CAS PubMed
- J. M. Dąbrowski and L. G. Arnaut, Photochem. Photobiol. Sci., 2015, 14, 1765–1780 CrossRef PubMed
- U. Chilakamarthi and L. Giribabu, Chem. Rec., 2017, 17, 775–802 CrossRef CAS PubMed
- J. Zhao, F. Li, S. Zhang, Y. An and S. Sun, New J. Chem., 2019, 43, 6332–6342 RSC
- S. Yi, S. Deng, X. Guo, C. Pang, J. Zeng, S. Ji, H. Liang, X.-C. Shen and B.-P. Jiang, Carbon, 2021, 182, 155–166 CrossRef CAS
- Y. Xu, C. Wang, G. Ran, D. Chen, Q. Pang and Q. Song, ACS Appl. Nano Mater., 2021, 4, 4820–4828 CrossRef CAS
- W. Liu, H. Gu, B. Ran, W. Liu, W. Sun, D. Wang, J. Du, J. Fan and X. Peng, Sci. China Mater., 2022, 65, 845–854 CrossRef CAS PubMed
- J. Ge, M. Lan, B. Zhou, W. Liu, L. Guo, H. Wang, Q. Jia, G. Niu, X. Huang, H. Zhou, X. Meng, P. Wang, C.-S. Lee, W. Zhang and X. Han, Nat. Commun., 2014, 5, 4596 CrossRef CAS PubMed
- S. Zhao, K. Yang, L. Jiang, J. Xiao, B. Wang, L. Zeng, X. Song and M. Lan, ACS Appl. Nano Mater., 2021, 4, 10528–10533 CrossRef CAS
- D.-W. Zheng, B. Li, C.-X. Li, J.-X. Fan, Q. Lei, C. Li, Z. Xu and X.-Z. Zhang, ACS Nano, 2016, 10, 8715–8722 CrossRef CAS PubMed
- Y. Yang, H. Ding, Z. Li, A. C. Tedesco and H. Bi, Molecules, 2022, 27, 8627 CrossRef CAS PubMed
- H. Cai, X. Wu, L. Jiang, F. Yu, Y. Yang, Y. Li, X. Zhang, J. Liu, Z. Li and H. Bi, Chin. Chem. Lett., 2023, 108946 CrossRef
- W. Fan, B. Yung, P. Huang and X. Chen, Chem. Rev., 2017, 117, 13566–13638 CrossRef CAS PubMed
- J. Huo, Q. Jia, H. Huang, J. Zhang, P. Li, X. Dong and W. Huang, Chem. Soc. Rev., 2021, 50, 8762–8789 RSC
- Y. Bai, J. Zhao, S. Wang, T. Lin, F. Ye and S. Zhao, ACS Appl. Mater. Interfaces, 2021, 13, 35365–35375 CrossRef CAS PubMed
- V. R. Shinde, S. Khatun, A. M. Thanekar, A. Hak and A. K. Rengan, Photodiagn. Photodyn. Ther., 2023, 41, 103314 CrossRef CAS PubMed
- Q. Jia, X. Zheng, J. Ge, W. Liu, H. Ren, S. Chen, Y. Wen, H. Zhang, J. Wu and P. Wang, J. Colloid Interface Sci., 2018, 526, 302–311 CrossRef CAS PubMed
- S. Sun, J. Chen, K. Jiang, Z. Tang, Y. Wang, Z. Li, C. Liu, A. Wu and H. Lin, ACS Appl. Mater. Interfaces, 2019, 11, 5791–5803 CrossRef CAS PubMed
- L. Song, H. Cheng, Z. Ren, H. Wang, J. Lu, J. Zhang, Q. Zhao and S. Wang, Colloids Surf., A, 2023, 659, 130763 CrossRef CAS
- X. Chu, P. Zhang, Y. Wang, B. Sun, Y. Liu, Q. Zhang, W. Feng, Z. Li, K. Li, N. Zhou and J. Shen, Carbon, 2021, 176, 126–138 CrossRef CAS
- X. Wang, X. Zhong, F. Gong, Y. Chao and L. Cheng, Mater. Horiz., 2020, 7, 2028–2046 RSC
- R. Wang, Q. Liu, A. Gao, N. Tang, Q. Zhang, A. Zhang and D. Cui, Nanoscale, 2022, 14, 12999–13017 RSC
-
A. P. McHale, J. F. Callan, N. Nomikou, C. Fowley and B. Callan, in Therapeutic Ultrasound, ed. J.-M. Escoffre and A. Bouakaz, Springer International Publishing, Cham, 2016, pp. 429–450, DOI:10.1007/978-3-319-22536-4_22
- X. Pan, H. Wang, S. Wang, X. Sun, L. Wang, W. Wang, H. Shen and H. Liu, Sci. China: Life Sci., 2018, 61, 415–426 CrossRef PubMed
- Y. Zhang, X. Zhang, H. Yang, L. Yu, Y. Xu, A. Sharma, P. Yin, X. Li, J. S. Kim and Y. Sun, Chem. Soc. Rev., 2021, 50, 11227–11248 RSC
- L. Rengeng, Z. Qianyu, L. Yuehong, P. Zhongzhong and L. Libo, Photodiagn. Photodyn. Ther., 2017, 19, 159–166 CrossRef PubMed
- Y.-Y. Ju, X.-X. Shi, S.-Y. Xu, X.-H. Ma, R.-J. Wei, H. Hou, C.-C. Chu, D. Sun, G. Liu and Y.-Z. Tan, Adv. Sci., 2022, 9, 2105034 CrossRef CAS PubMed
- B. Geng, J. Hu, Y. Li, S. Feng, D. Pan, L. Feng and L. Shen, Nat. Commun., 2022, 13, 5735 CrossRef CAS PubMed
- B. Wei, F. Dong, W. Yang, C. Luo, Q. Dong, Z. Zhou, Z. Yang and L. Sheng, J. Adv. Res., 2020, 23, 13–23 CrossRef CAS PubMed
- M. J. Mitchell, M. M. Billingsley, R. M. Haley, M. E. Wechsler, N. A. Peppas and R. Langer, Nat. Rev. Drug Discovery, 2021, 20, 101–124 CrossRef CAS PubMed
- A. P. Subramanian, S. K. Jaganathan, A. Manikandan, K. N. Pandiaraj, N. Gomathi and E. Supriyanto, RSC Adv., 2016, 6, 48294–48314 RSC
- J. Ayub, M. U. Saeed, N. Hussain, I. Zulfiqar, T. Mehmood, H. M. N. Iqbal and M. Bilal, Top. Catal., 2023, 66, 625–648 CrossRef CAS
- K. Ulbrich, K. Holá, V. Šubr, A. Bakandritsos, J. Tuček and R. Zbořil, Chem. Rev., 2016, 116, 5338–5431 CrossRef CAS PubMed
- W. Su, R. Guo, F. Yuan, Y. Li, X. Li, Y. Zhang, S. Zhou and L. Fan, J. Phys. Chem. Lett., 2020, 11, 1357–1363 CrossRef CAS PubMed
- W. Ren, F. Nan, S. Li, S. Yang, J. Ge and Z. Zhao, ChemMedChem, 2021, 16, 646–653 CrossRef CAS PubMed
- Z. Chen, T. Liao, L. Wan, Y. Kuang, C. Liu, J. Duan, X. Xu, Z. Xu, B. Jiang and C. Li, Nano Res., 2021, 14, 4264–4273 CrossRef CAS
- H.-L. Cong, M.-Z. Wang, Y.-H. Xu, S. Wang, Y.-Q. Shen and B. Yu, Integr. Ferroelectr., 2020, 206, 151–159 CrossRef CAS
- C. Anichini, W. Czepa, D. Pakulski, A. Aliprandi, A. Ciesielski and P. Samorì, Chem. Soc. Rev., 2018, 47, 4860–4908 RSC
- D. Sarkar, W. Liu, X. Xie, A. C. Anselmo, S. Mitragotri and K. Banerjee, ACS Nano, 2014, 8, 3992–4003 CrossRef CAS PubMed
- Y. Song, F. Chen, Y. Zhang, S. Zhang, F. Liu, P. Sun, X. Yan and G. Lu, Sens. Actuators, B, 2019, 287, 191–198 CrossRef CAS
- D. Wu, A. C. Sedgwick, T. Gunnlaugsson, E. U. Akkaya, J. Yoon and T. D. James, Chem. Soc. Rev., 2017, 46, 7105–7123 RSC
- Z. G. Khan and P. O. Patil, Microchem. J., 2020, 157, 105011 CrossRef CAS
- L. A. Malik, A. Bashir, A. Qureashi and A. H. Pandith, Environ. Chem. Lett., 2019, 17, 1495–1521 CrossRef CAS
- V. Singh and A. K. Mishra, Sens. Actuators, B, 2016, 227, 467–474 CrossRef CAS
- W. Gao, H. Song, X. Wang, X. Liu, X. Pang, Y. Zhou, B. Gao and X. Peng, ACS Appl. Mater. Interfaces, 2018, 10, 1147–1154 CrossRef CAS PubMed
- C. Tan, X. Su, C. Zhou, B. Wang, Q. Zhan and S. He, RSC Adv., 2017, 7, 40952–40956 RSC
- J. Zeng, L. Liao, X. Lin, G. Liu, X. Luo, M. Luo and F. Wu, Int. J. Mol. Sci., 2022, 23, 9213 CrossRef CAS PubMed
- S. Pawar, S. Kaja and A. Nag, ACS Omega, 2020, 5, 8362–8372 CrossRef CAS PubMed
- A. Bhati, S. R. Anand, D. Saini, P. Khare, P. Dubey and S. K. Sonkar, New J. Chem., 2018, 42, 19548–19556 RSC
- A. Mirzaei, S. G. Leonardi and G. Neri, Ceram. Int., 2016, 42, 15119–15141 CrossRef CAS
- C. Sonne, C. Xia, P. Dadvand, A. C. Targino and S. S. Lam, J. Build. Eng., 2022, 62, 105344 CrossRef
- D. Bharathi, B. Siddlingeshwar, R. H. Krishna, V. Singh, N. Kottam, D. D. Divakar and A. A. Alkheraif, J. Fluoresc., 2018, 28, 573–579 CrossRef CAS PubMed
- Y. Hu, Z. Yang, X. Lu, J. Guo, R. Cheng, L. Zhu, C.-F. Wang and S. Chen, Nanoscale, 2020, 12, 5494–5500 RSC
- B. Chen, L. Li, Y. Hu, B. Liu, M. Guo, Q. Zhang, Q. Yang and M. Zhang, Microchem. J., 2022, 178, 107350 CrossRef CAS
- E. Martínez-Periñán, Á. Martínez-Sobrino, I. Bravo, T. García-Mendiola, E. Mateo-Martí, F. Pariente and E. Lorenzo, Anal. Bioanal. Chem., 2022, 414, 5537–5548 CrossRef PubMed
- R. Dai and Y. Hu, Sens. Actuators, B, 2022, 370, 132420 CrossRef CAS
- X. Zhu, X. Yuan, L. Han, H. Liu and B. Sun, Biosens. Bioelectron., 2021, 191, 113460 CrossRef CAS PubMed
- J. Bai, Y. Ma, G. Yuan, X. Chen, J. Mei, L. Zhang and L. Ren, J. Mater. Chem. C, 2019, 7, 9709–9718 RSC
- M. Zhang, R. Su, J. Zhong, L. Fei, W. Cai, Q. Guan, W. Li, N. Li, Y. Chen, L. Cai and Q. Xu, Nano Res., 2019, 12, 815–821 CrossRef CAS
- Y. Chen, C. Wang, Y. Xu, G. Ran and Q. Song, New J. Chem., 2020, 44, 7210–7217 RSC
- J. Guo, W. Lu, Y. Meng, H. Wang, C. Dong and S. Shuang, Dyes Pigm., 2022, 208, 110766 CrossRef CAS
- X. Ye, Y. Xiang, Q. Wang, Z. Li and Z. Liu, Small, 2019, 15, 1901673 CrossRef CAS PubMed
- J. Huang, Y. He, Z. Zhang, B. Lei and W. Wu, J. Lumin., 2019, 215, 116640 CrossRef CAS
- L. Li, L. Shi, J. Jia, O. Eltayeb, W. Lu, Y. Tang, C. Dong and S. Shuang, Sens. Actuators, B, 2021, 332, 129513 CrossRef CAS
- M. Yu, H. Zhang, Y. Liu, Y. Zhang, M. Shang, L. Wang, Y. Zhuang and X. Lv, Food Chem., 2022, 374, 131768 CrossRef CAS PubMed
- X. Wang, X. Teng, X. Sun, W. Pan and J. Wang, Spectrochim. Acta, Part A, 2022, 267, 120547 CrossRef CAS PubMed
- Y. Liu, J. Zhang, X. Zhao, W. Li, J. Wang, Y. Gao, Y. Cui, S. Xu and X. Luo, Chem. Commun., 2020, 56, 4074–4077 RSC
- Y. Chen, X. Sun, X. Wang, W. Pan, G. Yu and J. Wang, Spectrochim. Acta, Part A, 2020, 233, 118230 CrossRef CAS PubMed
- N. Zhao, J. Song, H. Ye and L. Zhao, Colloids Surf., B, 2023, 221, 112985 CrossRef CAS PubMed
- W. He, W. Weng, X. Sun, Y. Pan, X. Chen, B. Liu and J. Shen, ACS Appl. Nano Mater., 2020, 3, 7420–7427 CrossRef CAS
- G. B. Nair and S. J. Dhoble, Luminescence, 2015, 30, 1167–1175 CrossRef PubMed
- J. D. Bergesen, L. Tähkämö, T. Gibon and S. Suh, J. Ind. Ecol., 2016, 20, 263–275 CrossRef CAS
- J. Cho, J. H. Park, J. K. Kim and E. F. Schubert, Laser Photonics Rev., 2017, 11, 1600147 CrossRef
- J. Legendre and P.-O. Chapuis, Sol. Energy Mater. Sol. Cells, 2022, 238, 111594 CrossRef CAS
- H. Xiang, R. Wang, J. Chen, F. Li and H. Zeng, Light: Sci. Appl., 2021, 10, 206 CrossRef CAS PubMed
- L. Jin, L. Zhang, L. Yang, X. Wu, C. Zhang, K. Wei, L. He, X. Han, H. Qiao, A. M. Asiri, K. A. Alamry and K. Zhang, J. Mater. Sci. Technol., 2020, 50, 184–191 CrossRef CAS
- B. Zhao and Z. a. Tan, Adv. Sci., 2021, 8, 2001977 CrossRef CAS PubMed
- V. Singh and A. K. Mishra, J. Mater. Chem. C, 2016, 4, 3131–3137 RSC
- X. Zhang, H. Yang, Z. Wan, T. Su, X. Zhang, J. Zhuang, B. Lei, Y. Liu and C. Hu, Adv. Opt. Mater., 2020, 8, 2000251 CrossRef CAS
- W. Cai, T. Zhang, M. Xu, M. Zhang, Y. Guo, L. Zhang, J. Street, W.-J. Ong and Q. Xu, J. Mater. Chem. C, 2019, 7, 2212–2218 RSC
- J. Zhu, X. Bai, X. Chen, Z. Xie, Y. Zhu, G. Pan, Y. Zhai, H. Zhang, B. Dong and H. Song, Dalton Trans., 2018, 47, 3811–3818 RSC
- Y. Zhai, Y. Wang, D. Li, D. Zhou, P. Jing, D. Shen and S. Qu, J. Colloid Interface Sci., 2018, 528, 281–288 CrossRef CAS PubMed
- Y. An, X. Lin, Z. Guo, Q. Yin, Y. Li, Y. Zheng, Z. Shi, W. Zhang and C. Liu, Materials, 2021, 14, 4716 CrossRef CAS PubMed
- R. Kumari, A. Kumar, K. Negi and S. K. Sahu, ACS Appl. Nano Mater., 2023, 6, 918–929 CrossRef CAS
- X. Yang and D. Wang, ACS Appl. Energy Mater., 2018, 1, 6657–6693 CrossRef CAS
-
M. B. Tahir, M. Sohaib, M. Sagir and M. Rafique, in Encyclopedia of Smart Materials, ed. A.-G. Olabi, Elsevier, Oxford, 2022, pp. 578–589 Search PubMed
- A. J. Bard, Science, 1980, 207, 139–144 CrossRef CAS PubMed
- C. Kerzig and M. Goez, Chem. Sci., 2016, 7, 3862–3868 RSC
- E. Contreras, C. Palacios, I. B. Becerril-Castro and J. M. Romo-Herrera, Micromachines, 2021, 12, 577 CrossRef PubMed
- Z. Zhang, G. Yi, P. Li, X. Zhang, H. Fan, Y. Zhang, X. Wang and C. Zhang, Nanoscale, 2020, 12, 13899–13906 RSC
- R. Aggarwal, D. Saini, B. Singh, J. Kaushik, A. K. Garg and S. K. Sonkar, Sol. Energy, 2020, 197, 326–331 CrossRef CAS
- P. Khare, A. Bhati, S. R. Anand, Gunture and S. K. Sonkar, ACS Omega, 2018, 3, 5187–5194 CrossRef CAS PubMed
- H. Li, R. Liu, S. Lian, Y. Liu, H. Huang and Z. Kang, Nanoscale, 2013, 5, 3289–3297 RSC
- D.-X. Yang, D. Qu, X. Miao, W.-S. Jiang, L. An, Y.-J. Wen, D.-D. Wu and Z.-C. Sun, Rare Met., 2019, 38, 404–412 CrossRef CAS
- N. Kannan and D. Vakeesan, Renewable Sustainable Energy Rev., 2016, 62, 1092–1105 CrossRef
- Z. Fan, Y. Zhao, X. Liu, Y. Shi and D. Jiang, RSC Adv., 2022, 12, 12303–12309 RSC
- M. B. Hayat, D. Ali, K. C. Monyake, L. Alagha and N. Ahmed, Int. J. Energy Res., 2019, 43, 1049–1067 CrossRef
- J. Hu, X. Xiong, W. Guan and H. Long, Mater. Today Energy, 2021, 21, 100769 CrossRef CAS
- M. O. Alas, F. B. Alkas, A. Aktas Sukuroglu, R. Genc Alturk and D. Battal, J. Mater. Sci., 2020, 55, 15074–15105 CrossRef CAS
- M. G. Debije, R. C. Evans and G. Griffini, Energy Environ. Sci., 2021, 14, 293–301 RSC
- G. Liu, M. Zavelani-Rossi, G. Han, H. Zhao and A. Vomiero, J. Mater. Chem. A, 2023, 11, 8950–8960 RSC
- Y. Han, X. Zhao, A. Vomiero, X. Gong and H. Zhao, J. Mater. Chem. C, 2021, 9, 12255–12262 RSC
- K.-B. Cai, H.-Y. Huang, M.-L. Hsieh, P.-W. Chen, S.-E. Chiang, S. H. Chang, J.-L. Shen, W.-R. Liu and C.-T. Yuan, ACS Nano, 2022, 16, 3994–4003 CrossRef CAS PubMed
- J. Li, H. Zhao, X. Zhao and X. Gong, Nanoscale, 2021, 13, 9561–9569 RSC
- M. Ali, A. S. Anjum, R. Riaz, A. Bibi, K. C. Sun and S. H. Jeong, Carbon, 2021, 181, 155–168 CrossRef CAS
- T. Dey, A. Ghorai, S. Das and S. K. Ray, Sol. Energy, 2022, 236, 17–25 CrossRef CAS
- W. Hong, Z. Yuan and X. Chen, Small, 2020, 16, 1907626 CrossRef CAS PubMed
- C. Yang, F. Guo, S. Wang, W. Chen, Y. Zhang, N. Wang, Z. Li and J. Wang, RSC Adv., 2023, 13, 10884–10892 RSC
- K. Y. Jung, RSC Adv., 2020, 10, 16323–16329 RSC
- S. Hussain, S. Haider, W. Al-Masry and S.-Y. Park, RSC Adv., 2021, 11, 37498–37503 RSC
- M. Li, W. Yao, J. Liu, Q. Tian, L. Liu, J. Ding, Q. Xue, Q. Lu and W. Wu, J. Mater. Chem. C, 2017, 5, 6512–6520 RSC
- X. Yu, H. Zhang and J. Yu, Aggregate, 2021, 2, 20–34 CrossRef CAS
- P. Kumar, S. Singh and B. K. Gupta, Nanoscale, 2016, 8, 14297–14340 RSC
- J. Wang, J. Ma, J. Zhang, Y. Fan, W. Wang, J. Sang, Z. Ma and H. Li, ACS Appl. Mater. Interfaces, 2019, 11, 35871–35878 CrossRef CAS PubMed
- A. Mondal and P. Chattopadhyay, New J.
Chem., 2023, 47, 4984–4991 RSC
- X.-f. Li, W. Zhou, Y.-c. Liu, M. Hou, G.-l. Feng, Y.-m. Ji, Y. Zhang and G.-w. Xing, Chem. Commun., 2022, 58, 11547–11550 RSC
- Z. Fatahi, N. Esfandiari and Z. Ranjbar, J. Anal. Test., 2020, 4, 307–315 CrossRef
- J. Guo, H. Li, L. Ling, G. Li, R. Cheng, X. Lu, A.-Q. Xie, Q. Li, C.-F. Wang and S. Chen, ACS Sustain. Chem. Eng., 2020, 8, 1566–1572 CrossRef CAS
- Y. Ni, H. Wan, W. Liang, S. Zhang, X. Xu, L. Li, Y. Shao, S. Ruan and W. Zhang, Nanoscale, 2021, 13, 16872–16878 RSC
- X.-Y. Dong, X.-Q. Niu, Z.-Y. Zhang, J.-S. Wei and H.-M. Xiong, ACS Appl. Mater. Interfaces, 2020, 12, 29549–29555 CAS
- K. Yuan, X. Zhang, X. Li, R. Qin, Y. Cheng, L. Li, X. Yang, X. Yu, Z. Lu and H. Liu, Chem. Eng. J., 2020, 397, 125487 CrossRef CAS
- H. Yang, Y. Liu, Z. Guo, B. Lei, J. Zhuang, X. Zhang, Z. Liu and C. Hu, Nat. Commun., 2019, 10, 1789 CrossRef PubMed
- B. Liao, W. Wang, P. Long, X. Deng, B. He, Q. Liu and S. Yi, Carbon, 2015, 91, 30–37 CrossRef CAS
- H. Wei, Y. Zheng, X. Zhang, P. Liang, X. Xu, C. Hu, X. Zhang, B. Lei, Y. Liu and J. Zhuang, Mater. Adv., 2022, 3, 4542–4547 RSC
- D. Gust, T. A. Moore and A. L. Moore, Faraday Discuss., 2012, 155, 9–26 RSC
- N. Abas, E. Kalair, A. Kalair, Q. u. Hasan and N. Khan, Int. J. Hydrogen Energy, 2020, 45, 20787–20799 CrossRef CAS
- R. L. House, N. Y. M. Iha, R. L. Coppo, L. Alibabaei, B. D. Sherman, P. Kang, M. K. Brennaman, P. G. Hoertz and T. J. Meyer, J. Photochem. Photobiol., C, 2015, 25, 32–45 CrossRef CAS
- J. Su and L. Vayssieres, ACS Energy Lett., 2016, 1, 121–135 CrossRef CAS
- T. Butburee, P. Chakthranont, C. Phawa and K. Faungnawakij, ChemCatChem, 2020, 12, 1873–1890 CrossRef CAS
- D. K. Dogutan and D. G. Nocera, Acc. Chem. Res., 2019, 52, 3143–3148 CrossRef CAS PubMed
- A. J. Simkin, M. Faralli, S. Ramamoorthy and T. Lawson, Plant J., 2020, 101, 1001–1015 CrossRef CAS PubMed
- S. Berardi, S. Drouet, L. Francàs, C. Gimbert-Suriñach, M. Guttentag, C. Richmond, T. Stoll and A. Llobet, Chem. Soc. Rev., 2014, 43, 7501–7519 RSC
- A. C. Benniston and A. Harriman, Mater. Today, 2008, 11, 26–34 CrossRef CAS
- Z. Wang, Y. Hu, S. Zhang and Y. Sun, Chem. Soc. Rev., 2022, 51, 6704–6737 RSC
- B. Guo, G. Liu, H. Wei, J. Qiu, J. Zhuang, X. Zhang, M. Zheng, W. Li, H. Zhang and C. Hu, SmartMat, 2022, 3, 208–225 CrossRef CAS
- Z. Wang, Y. Zhang, S. Zhang, M. Ge, H. Zhang, S. Wang, Z. Chen, S. Li and C. Yang, J. Colloid Interface Sci., 2023, 629, 12–21 CrossRef CAS PubMed
- Z. Hallaji, Z. Bagheri, Z. Tavassoli and B. Ranjbar, Sustainable Mater. Technol., 2022, 34, e00493 CrossRef CAS
- X. Xu, X. Mao, J. Zhuang, B. Lei, Y. Li, W. Li, X. Zhang, C. Hu, Y. Fang and Y. Liu, ACS Sustain. Chem. Eng., 2020, 8, 3938–3949 CrossRef CAS
- C. Wang, H. Yang, F. Chen, L. Yue, Z. Wang and B. Xing, Environ. Sci. Technol., 2021, 55, 12317–12325 CrossRef CAS PubMed
- D. Li, W. Li, H. Zhang, X. Zhang, J. Zhuang, Y. Liu, C. Hu and B. Lei, ACS Appl. Mater. Interfaces, 2020, 12, 21009–21019 CrossRef CAS PubMed
- X. Xu, W. Li, C. Hu, B. Lei, X. Zhang, Y. Li, Q. Zhan, Y. Liu and J. Zhuang, ACS Sustain. Chem. Eng., 2020, 8, 9751–9762 CrossRef CAS
- Y. Wang, Z. Xie, X. Wang, X. Peng and J. Zheng, J. Nanobiotechnol., 2021, 19, 260 CrossRef CAS PubMed
- D. Xiao, M. Jiang, X. Luo, S. Liu, J. Li, Z. Chen and S. Li, ACS Sustain. Chem. Eng., 2021, 9, 4139–4145 CrossRef CAS
- T. Iizuka, H. Sezutsu, K.-i. Tatematsu, I. Kobayashi, N. Yonemura, K. Uchino, K. Nakajima, K. Kojima, C. Takabayashi, H. Machii, K. Yamada, H. Kurihara, T. Asakura, Y. Nakazawa, A. Miyawaki, S. Karasawa, H. Kobayashi, J. Yamaguchi, N. Kuwabara, T. Nakamura, K. Yoshii and T. Tamura, Adv. Funct. Mater., 2013, 23, 5232–5239 CrossRef CAS
- D. W. Kim, O. J. Lee, S.-W. Kim, C. S. Ki, J. R. Chao, H. Yoo, S.-i. Yoon, J. E. Lee, Y. R. Park, H. Kweon, K. G. Lee, D. L. Kaplan and C. H. Park, Biomaterials, 2015, 70, 48–56 CrossRef CAS PubMed
- S. B. Bon, I. Chiesa, M. Degli Esposti, D. Morselli, P. Fabbri, C. De Maria, A. Morabito, R. Coletta, M. Calamai, F. S. Pavone, R. Tonin, A. Morrone, G. Giorgi and L. Valentini, ACS Appl. Mater. Interfaces, 2021, 13, 21007–21017 CrossRef CAS PubMed
- W. Chen, Y. Zhong, G. Fu, W. Lai, Z. Pan, Y. Yang, F. Chen and H. Yan, Coatings, 2023, 13, 31 CrossRef CAS
- S. Fan, X. Zheng, Q. Zhan, H. Zhang, H. Shao, J. Wang, C. Cao, M. Zhu, D. Wang and Y. Zhang, Nano-Micro Lett., 2019, 11, 75 CrossRef CAS PubMed
- Q. Zhan, S. Fan, D. Wang, X. Yao, H. Shao and Y. Zhang, Compos. Commun., 2020, 21, 100414 CrossRef
- X. Zheng, M. Zhao, H. Zhang, S. Fan, H. Shao, X. Hu and Y. Zhang, ACS Biomater. Sci. Eng., 2018, 4, 4021–4027 CrossRef CAS PubMed
- M. J. Haskew, B. Deacon, C. W. Yong, J. G. Hardy and S. T. Murphy, ACS Omega, 2021, 6, 35494–35504 CrossRef CAS PubMed
- N. C. Tansil, L. D. Koh and M.-Y. Han, Adv. Mater., 2012, 24, 1388–1397 CrossRef CAS PubMed
- J. Liu, T. Kong and H.-M. Xiong, Adv. Mater., 2022, 34, 2200152 CrossRef CAS PubMed
- E. S. Maltseva, V. O. Nikolaeva, A. M. Savin, M. Y. Dobryakov, E. I. Koshel, P. V. Krivoshapkin and E. F. Krivoshapkina, ACS Biomater. Sci. Eng., 2022, 8, 3310–3319 CrossRef CAS PubMed
- K. Xue, C. Wang, J. Wang, S. Lv, B. Hao, C. Zhu and B. Z. Tang, J. Am. Chem. Soc., 2021, 143, 14147–14157 CrossRef CAS PubMed
- X. Liu, X. Tang, Y. Hou, Q. Wu and G. Zhang, RSC Adv., 2015, 5, 81713–81722 RSC
- S. Kalytchuk, K. Poláková, Y. Wang, J. P. Froning, K. Cepe, A. L. Rogach and R. Zbořil, ACS Nano, 2017, 11, 1432–1442 CrossRef CAS PubMed
- C.-Y. Chen and C.-T. Chen, Chem. Commun., 2011, 47, 994–996 RSC
- J. Zhou, B. del Rosal, D. Jaque, S. Uchiyama and D. Jin, Nat. Methods, 2020, 17, 967–980 CrossRef CAS PubMed
- H. Gao, C. Kam, T. Y. Chou, M.-Y. Wu, X. Zhao and S. Chen, Nanoscale Horiz., 2020, 5, 488–494 RSC
- V. Kalaparthi, B. Peng, S. A. M. A. Peerzade, S. Palantavida, B. Maloy, M. E. Dokukin and I. Sokolov, Nanoscale Adv., 2021, 3, 5090–5101 RSC
- J.-R. Macairan, D. B. Jaunky, A. Piekny and R. Naccache, Nanoscale Adv., 2019, 1, 105–113 RSC
- C. Wang, T. Hu, T. Thomas, S. Song, Z. Wen, C. Wang, Q. Song and M. Yang, Nanoscale, 2018, 10, 21809–21817 RSC
- Y. Xu, Y. Yang, S. Lin and L. Xiao, Anal. Chem., 2020, 92, 15632–15638 CrossRef CAS PubMed
- Q. Wang, Z. Tang, L. Li, J. Guo, L. Jin, J. Lu, P. Huang, S. Zhang and L. Jiao, Spectrochim. Acta, Part A, 2022, 280, 121538 CrossRef CAS PubMed
- B. H. Lee, R. L. McKinney, M. T. Hasan and A. V. Naumov, Materials, 2021, 14, 616 CrossRef CAS PubMed
- C. Wang, K. Jiang, Q. Wu, J. Wu and C. Zhang, Chem. –Eur. J., 2016, 22, 14475–14479 CrossRef CAS PubMed
| This journal is © The Royal Society of Chemistry 2023 |