
Composite formation of covalent organic framework crystals and sugar alcohols for exploring a new class of heat-storage materials†
Yoichi
Murakami
 *abcd,
Shoma
Mitsui
b,
Shiori
Nakagawa
e,
Xiaohan
Wang
b,
Hiroki
Fujisawa
e,
Meguya
Ryu
efg and
Junko
Morikawa
*eg
*abcd,
Shoma
Mitsui
b,
Shiori
Nakagawa
e,
Xiaohan
Wang
b,
Hiroki
Fujisawa
e,
Meguya
Ryu
efg and
Junko
Morikawa
*eg
aLaboratory for Zero-Carbon Energy, Institute of Innovative Research, Tokyo Institute of Technology, 2-12-1 Ookayama, Meguro-ku, Tokyo 152-8550, Japan. E-mail: murakami.y.af@m.titech.ac.jp
bDepartment of Mechanical Engineering, School of Engineering, Tokyo Institute of Technology, 2-12-1 Ookayama, Meguro-ku, Tokyo 152-8552, Japan
cDepartment of Transdisciplinary Science and Engineering, School of Environment and Society, Tokyo Institute of Technology, 2-12-1 Ookayama, Meguro-ku, Tokyo 152-8552, Japan
dPRESTO, JST, 4-1-8 Honcho, Kawaguchi, Saitama 332-0012, Japan
eDepartment of Organic and Polymeric Materials, School of Materials and Chemical Technology, Tokyo Institute of Technology, 2-12-1, Ookayama, Meguro-ku, Tokyo 152-8550, Japan. E-mail: morikawa.j.aa@m.titech.ac.jp
fNational Metrology Institute of Japan, National Institute of Advanced Industrial Science and Technology (AIST), 1-1-1 Umezono, Tsukuba, Ibaraki, 305-8563, Japan
gCRESTO, JST, 4-1-8 Honcho, Kawaguchi, Saitama 332-0012, Japan
First published on 14th August 2023
Abstract
We impregnated the sugar alcohols (SAs) erythritol and mannitol (Man) in >0.1 mm single crystals of a covalent organic framework, COF-300, to propose new solid-state heat storing materials. The fusion-freezing cycles of the Man–COF composite occur in a narrow range of 130–155 °C without large or random supercooling, which has been a crucial problem of SAs, indicating the significance of this materials concept. The Man–COF composite displayed two endothermic and two exothermic features in the heating/cooling cycles. We measured the heat transmission properties in detail, based on which we discuss and suggest a postulate on the phase change behaviour of Man in the pores of the COF.
 Yoichi Murakami | On behalf of my collaborators, I would like to heartily congratulate Materials Horizons on its 10th anniversary. The journal is now undoubtedly one of the best journals in the field of materials science. It was my great honor to receive the Materials Horizons Outstanding Paper Award (Materials Horizons Outstanding Paper Runner-up 2021) for our last paper published from this journal. I think that the journal's remarkable growth is a reflection of the genuine spirit of the journal's editors and staff to contribute to the development of materials science. I wish Materials Horizons continued success in the next decade. |
New conceptsHerein, the concept of forming composites of covalent organic framework (COF) crystals and sugar alcohols (SAs)—green and low-cost phase change materials—has been demonstrated to solve the long-standing problem of SAs’ strong supercooling, which sizably degrades the stored thermal energy. Our discovery of spontaneous impregnation of melted SA into COF with changes in crystal shape indicates that the deformable framework is the key factor to realize the composite formation, implying strong interaction between impregnated SA and the COF. These aspects differentiate this concept from existing concepts that impregnate SAs mainly into rigid porous materials (e.g., nanoporous silica and alumina), which does not solve the supercooling problem. The mannitol–COF composite exhibited reproducible fusion-freezing cycles in a narrow temperature range, achieving a landmark success for the suppression of supercooling of SA. Our direction-sensitive thermal diffusivity measurements provide insights into the complex phase-change behaviours of the SA–COF composite, the mechanism of which is discussed and postulated based on anisotropic nanoconfinement in the pores of the COF crystals. The obtained findings and insights will pave the way toward a new horizon of organic heat-storage materials, of which the properties can be optimized by exploiting the high design freedom and thermal stability inherently possessed by COFs. |
Sugar alcohols (SAs) such as erythritol (Eri) and D-mannitol (Man) (Fig. 1(b)) are natural carbohydrates that have been proposed as phase-change materials (PCMs) for thermal energy storage (TES) of waste heat below 200 °C,1,2 which is ubiquitous and gigantic in quantity.3,4 SAs have many advantages as PCMs, as they are non-toxic, non-corrosive (unlike salt hydrates), low-cost, and biodegradable.1,2 In addition, their volumetric energy density is much higher than that of commonly used organic PCMs such as paraffins, fatty acids, and esters.2,5
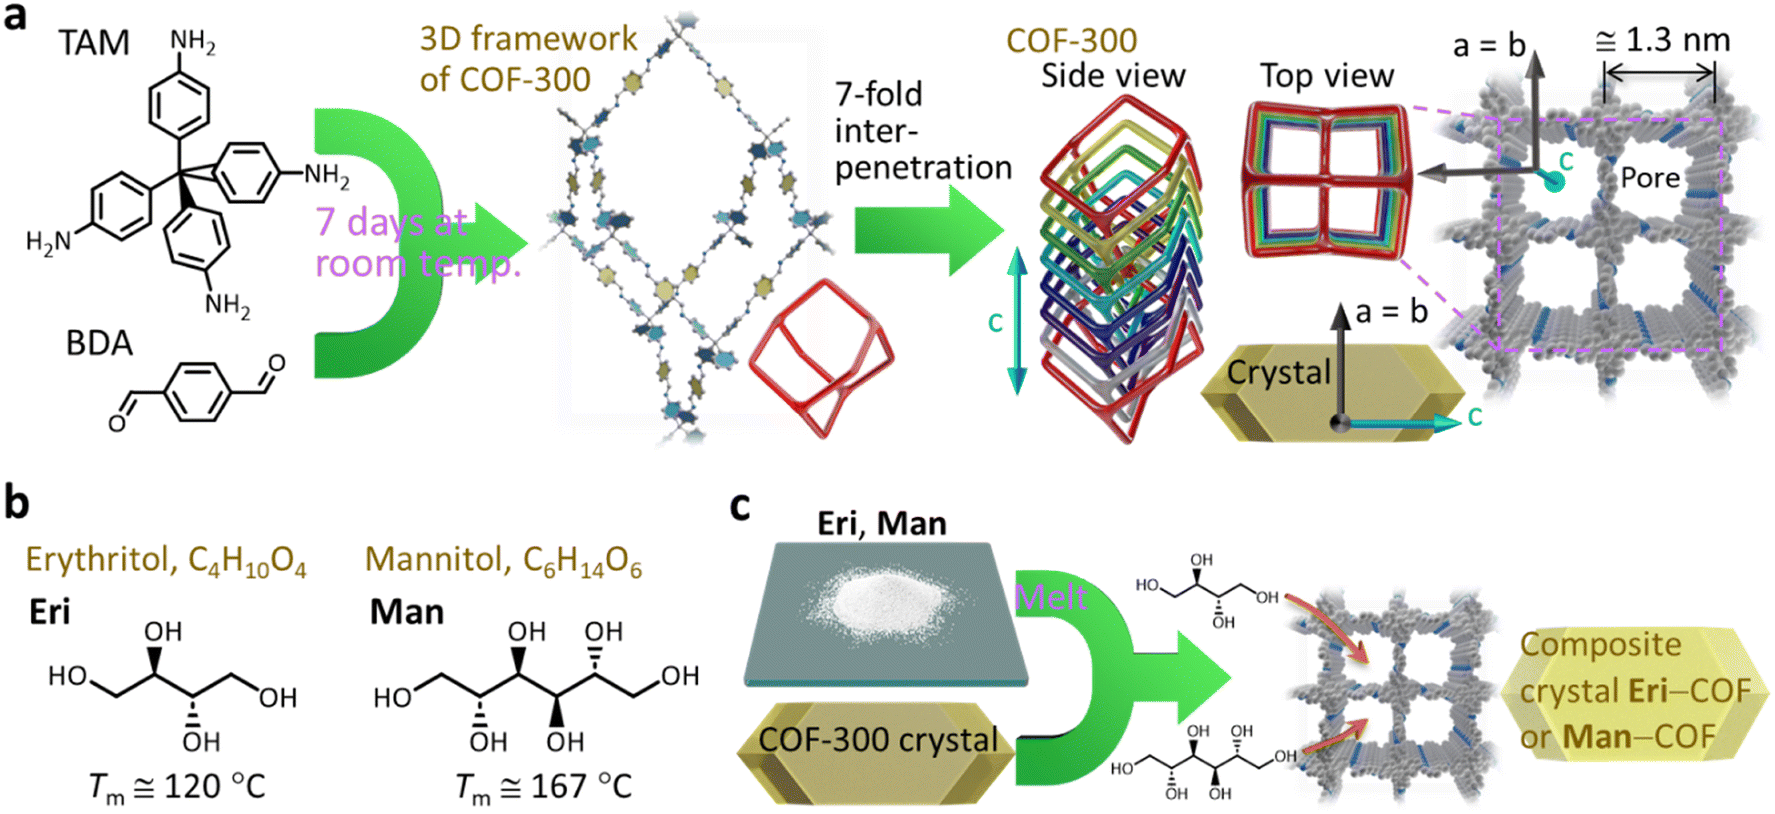 | ||
| Fig. 1 (a) Schematic illustration describing the formation of COF-300, which has a 3D framework with 7-fold interpenetration (Tm: melting temperature). The period along the a- and b-axes indicated in the graphic (≅1.3 nm) is based on the results of SXRD analysis on a COF-300 single crystal reported in ref. 22. (b) Molecular structures of erythritol (Eri) and mannitol (Man). (c) Schematic representation of our concept to form SA–COF composites by impregnating SA as a PCM into a single crystal of COF. | ||
However, on cooling from the liquid above the melting temperature (Tm), SAs suffer from a high degree of supercooling,5–8 which sizably downgrades the thermal energy and hence loses exergy.9,10 SAs can degrade at high temperature by oxidation and dehydration;1,5,8,10–13 to mitigate the degradation, recent proposals include the use of an inert gas environment5,8,12,13 or an anti-oxidant13 and confinement in nanoporous materials.14
To avoid the risk of leakage during operation, solid-state PCMs are desired in which the fluidity of the PCM is suppressed above Tm; this aim was explored using composites of PCM and porous materials.14–17 For example, Nomura et al.14 impregnated Eri into the pores of inorganic materials; they found a slight lowering of Tm and large impacts on the latent heat of fusion (ΔHm); however, they did not report the freezing properties.
Sagara et al.15 impregnated Man into nanoporous SiO2 and found that Tm and ΔHm decreased as the pore size decreased. They also found that the composite formation prolonged the thermal degradation period by 13 times that of the pure Man,15 which indicates that impregnation of SA into nanopores is effective to address the degradation issue. This research also did not address freezing properties.
Xu et al.16 formed composites of Man and expanded graphite; their results indicated weak effects on Tm and ΔHm from Man impregnated in expanded graphite and enhancement of thermal conductivity of the composites; the influences on the solidification properties were not shown. He et al.17 encapsulated Man into silica nanoshells; the solidification of encapsulated Man occurred randomly in the 100–125 °C range and hence their materials did not resolve the issue of the high degree of supercooling of Man. Hackel et al.18 encapsulated Eri and xylitol into zeolitic imidazole frameworks (ZIFs), a subclass of metal–organic frameworks (MOFs), using molten SAs as solvents for ZIF synthesis; the results showed significant suppression of phase-change temperatures down to 19.8 and 23.3 °C for Eri and xylitol, respectively. Thus, none of these previous works14–18 have addressed the problem of supercooling of SA by the formation of composites.
Covalent organic frameworks (COFs) are an emerging class of solids with periodic nanopores of uniform and designable sizes.19–21 COFs have many advantages, including high thermal stability in air up to 300–400 °C (e.g., Fig. S3, ESI†) and non-toxic elemental composition of earth-abundant lightweight atoms (e.g., Fig. 1(a)), and have been proposed for numerous applications.21
However, to our best knowledge, no report has presented the use of COFs as PCMs. Herein, to explore a new class of heat storage materials, we have impregnated two typical SAs, Eri and Man (Fig. 1(b)), into single crystals of COF.
COF-300 is a three-dimensional (3D) COF with 7-fold interpenetration,22 formed from tetrakis(4-aminophenyl)methane (TAM) and terephthaldehyde (BDA) (Fig. 1(a)). COF-300 has one-dimensional (1D) pores along the c-axis (Fig. 1(a)) and a stability against hydrolysis at least around pH 7.22,23
Below, we demonstrate that the supercooling problem is avoided by forming a Man–COF composite. This composite successfully realised reproducible fusion-freezing cycling in the temperature range of 130–155 °C, which is substantially narrower than the wide fusion-freezing range over ∼100–167 °C in the case of bulk Man. Therefore, we propose herein a new materials concept that realises reproducible freezing at a much higher temperature than before, which largely mitigates the degradation of stored thermal energy, opening a new avenue of non-toxic and solid-state PCMs.
Large single crystals of COF-300 were grown using our previous method;24 however, we did not use ionic liquids during the growth in this report, as we did in ref. 24 (Section S1.2, ESI†). The growth for 7 days yielded large (>100 μm along the c-axis) single crystals. They were washed, dried, and stored in a glovebox until use (Section S1.3, ESI†).
Eri or Man (Fig. 1(b)) was introduced into COF-300 crystals (Fig. 1(c)) according to Method 1 or Method 2 (see Sections S1.4 and S1.5 in the ESI,† respectively, for details). In Method 1, each crystal of COF-300 absorbed melted SA on a hotplate under a stereomicroscope. In Method 2, a blended mixture of dried COF-300 crystals and SA powder confined in a tube of paraformaldehyde (PFA; inner diameter: 2 mm) was heated above Tm so that melted SA was absorbed into the COF-300 crystals (Fig. S2, ESI†). In the latter method, a portion of SA was not impregnated into the COF crystals; i.e., samples prepared by Method 2 were a mixture of COF crystals that absorbed Man, those that did not (or almost did not) absorb Man, and Man that remained outside the COF crystals. For both Methods 1 and 2, the removal of residual solvents and moisture from the COF-300 crystals before loading SA is important, because such residual species can hinder the inclusion of SA into the crystals (see Section S1.3, ESI†).
After immersing a COF-300 crystal into a droplet of SA on a glass slide on a hotplate that was set at Tm + 15 °C (Fig. 2(a) and (c) for Eri and Man, respectively), the crystals started to enlarge from the end of the crystal, absorbing the melted SA along the c-axis. As the SA intruded into the COF-300 crystal, the width of the crystal increased, turning the colour from orange (dry COF-300 crystals) to pale yellow (the crystals filled with SA). These observations imply that the interaction between the impregnated SA molecules and COF is strong.
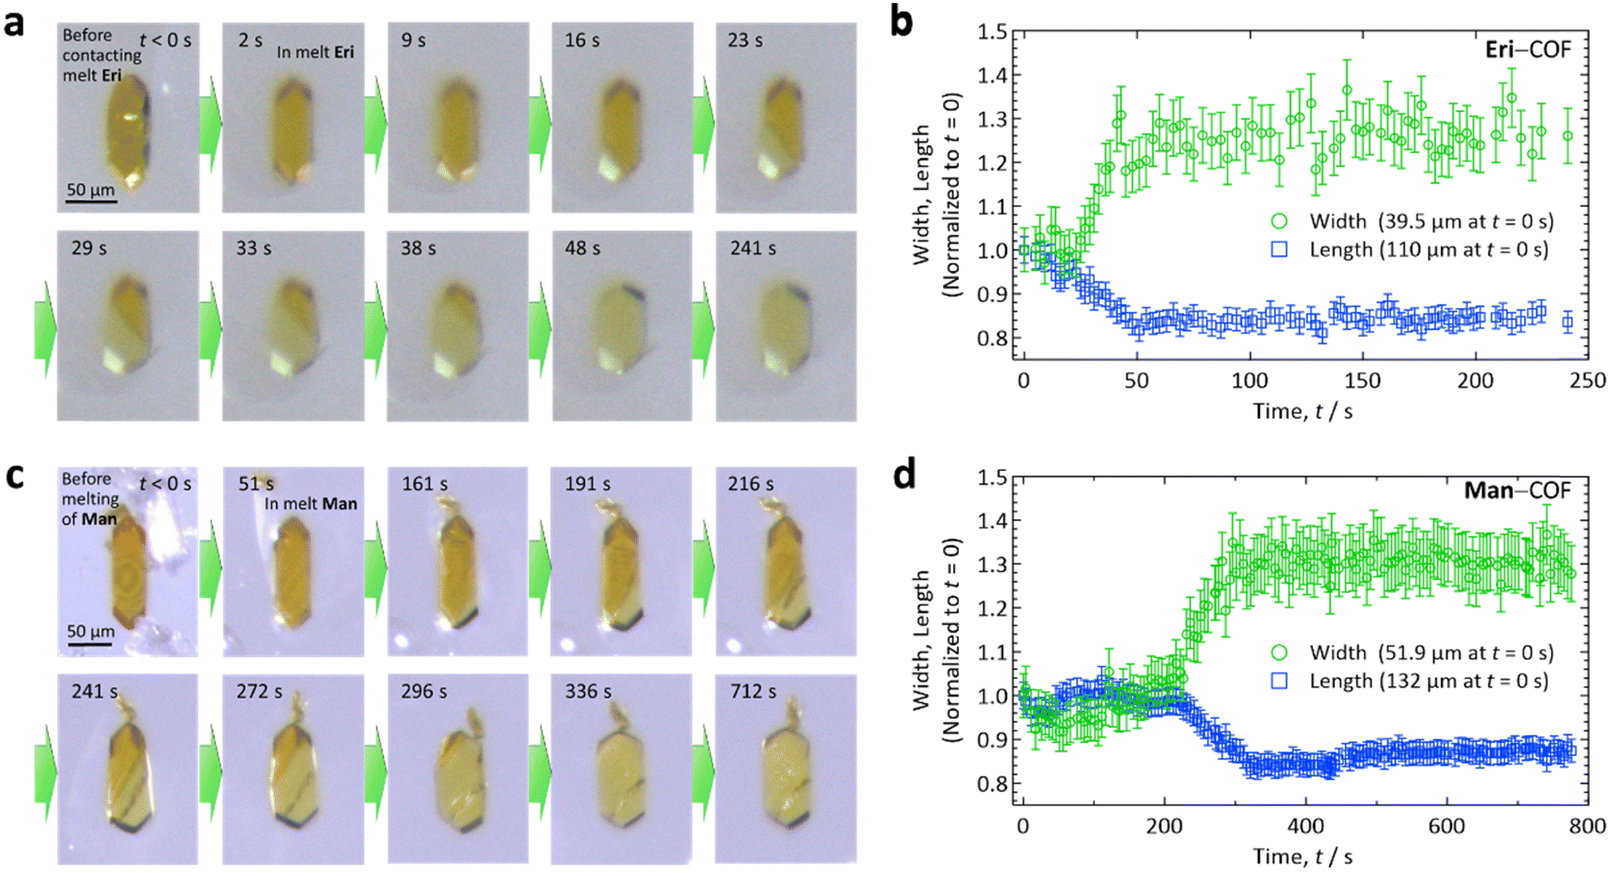 | ||
| Fig. 2 Time-course observations on single COF-300 crystals immersed in droplets of melted (a), (b) erythritol (Eri) and (c), (d) mannitol (Man). The experiments were conducted on a glass slide placed on a hotplate set at the temperatures of 130 and 180 °C for the cases of Eri and Man, respectively. Panels (a) and (c) are photographs taken under a stereomicroscope. Panels (b) and (d) plot changes in the crystal dimensions along and across the c-axis (length and width, respectively) with time, where the error bars for the length and width represent ±3% and ±5% uncertainties, respectively. | ||
Thus, the absorption of melted SA proceeded along the 1D pore of COF-300, as expected. This manner of guest absorption is similar to that recently reported for the absorption of dichloromethane vapor by much smaller (5–10 μm in c-axis) COF-300 crystals.25 To our knowledge, this is the first spatiotemporally resolved observation of guest species being absorbed into COF crystals, which was made possible by the present use of large crystals. As indicated in Fig. 2(b) and (d) for Eri and Man, respectively, the dimension of the crystal along the c-axis (length) decreased by 14–16%, whereas that normal to the c-axis (width) increased by 26–30%. This shape deformation may arise from a joint-link deformation of the framework of COF-300.23 By the inclusion of SA, the surface area of the COF-300 crystal increased by ca. 15 ± 3%, which may affect the heat transfer area when this material is used as a PCM.
From our single-crystal X-ray diffraction (SXRD) analyses on the SA–COF composite crystals, the mass ratios of COF-300![[thin space (1/6-em)]](https://www.rsc.org/images/entities/char_2009.gif) :Eri and COF-300:Man at their maximal impregnations (cf.Fig. 2) were determined to be ca. 1:0.73 and 1:0.77, respectively, from which their densities were determined to be ca. 1.26 and 1.27 g cm−3, respectively (see Section S3 of the ESI† for these determinations); the weight % loadings of Eri and Man in these composites were then found to be ca. 0.73/1.73 ≅ 42% and 0.77/1.77 ≅ 44%, respectively. Consistent with the results of Fig. 2, the size of the COF-300 pores changed significantly before and after the impregnation of SA (Fig. S10, ESI†).
:Eri and COF-300:Man at their maximal impregnations (cf.Fig. 2) were determined to be ca. 1:0.73 and 1:0.77, respectively, from which their densities were determined to be ca. 1.26 and 1.27 g cm−3, respectively (see Section S3 of the ESI† for these determinations); the weight % loadings of Eri and Man in these composites were then found to be ca. 0.73/1.73 ≅ 42% and 0.77/1.77 ≅ 44%, respectively. Consistent with the results of Fig. 2, the size of the COF-300 pores changed significantly before and after the impregnation of SA (Fig. S10, ESI†).
Overall, the results shown in Fig. 2 demonstrated that the envisaged concept of forming an SA–COF composite is viable. Because SA has been embedded in the COF-300, the phase-change behaviours are of interest; we investigated them by differential scanning calorimetry (DSC; Section S4, ESI†) for the samples prepared by Method 2. However, the phase-change behaviours we observed for the Eri–COF composite were highly irregular, which may be ascribed to the strong supercooling of Eri, for which the reported crystallization temperatures are scattered over a wide temperature range (see Fig. 3 of ref. 1), and to the complex phase-change behaviours of Eri under nanospace confinement (see Fig. 7 of ref. 26). As we found that this propensity was difficult to remove, we will show the results only for the Man–COF cases that exhibited reproducibility.
The DSC of Man showed an exothermic peak of Tm at around 167 °C (Fig. 3(a), heating) corresponding to the Tm of the thermodynamically stable β-phase7 (or ‘mod I’ phase27) of Man. The measured ΔHm was 294 kJ kg−1, which agreed well with literature values,6,10,27,28 although the literature values show some scatter.2,7 The solidification of Man occurred after significant supercooling over 50 K (Fig. 3(a), cooling), agreeing with previous reports.6,7
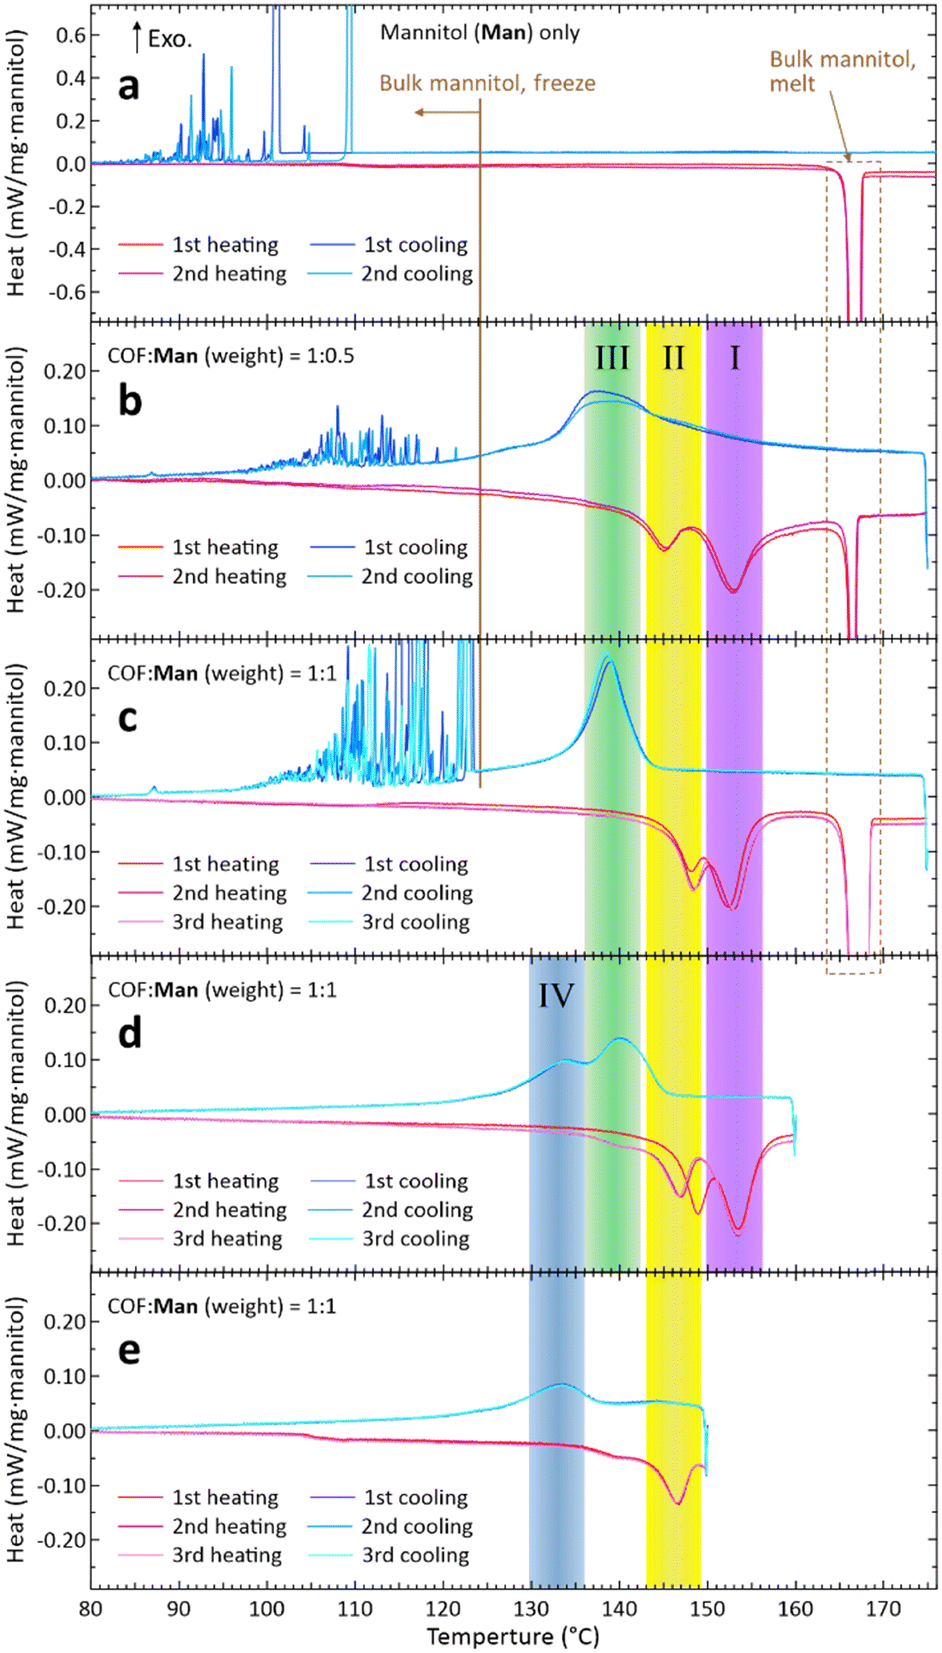 | ||
| Fig. 3 Results of DSC conducted at a scan rate of 2 °C s−1 using aluminum crimp cells to measure (a) Man only, (b) 1:0.5 COF–Man composite, and (c)–(e) 1:1 COF–Man composite in weight ratio. In panels (d) and (e), the heating processes ended and cooling started at 160 and 150 °C, respectively. Roman numerals I to IV indicate features found only in the composite. We have offset the curves so that the heat at 70 °C is zero. Because of the relatively small values of heat, the baselines of the curves in panels (b) to (e) may have not been subtracted completely and hence have some degree of slope. | ||
In contrast, the DSC results of the Man–COF composite, in which some fraction of Man remained outside the COF as mentioned above, exhibited substantially different behaviours. For both mass ratios of COF:Man = 1:0.5 (Fig. 3(b)) and 1:1 (Fig. 3(c)), we discovered the appearance of two additional endothermic features which peaked in the 150–156 °C and 143–149 °C ranges (I and II in Fig. 3, respectively), which are moderately lower than the Tm of 167 °C; we attributed these new features to the melting of Man impregnated in COF-300.
Interestingly, during cooling, a new exothermic feature appeared in the 136–142 °C range (III in Fig. 3(b) and (c)), which we attributed to the freezing of Man impregnated in the COF. This freezing feature appeared reproducibly, indicating that the present composites have achieved fusion-freezing cycles at a prescribed temperature without suffering from pronounced supercooling, which has been the problem of SA-based PCMs.
Increasing the mass ratio of COF:Man from 1:0.5 (Fig. 3(b)) to 1:1 (Fig. 3(c)) made these new features (I, II, and III) more prominent. This supports our attribution of these DSC features to those originating from phase changes of Man in the COF. To further verify this attribution, we performed a reference experiment in which we ended the heating at 160 °C (<Tm) and then started cooling (Fig. 3(d)). The results showed that both melting and freezing features of bulk Man (cf.Fig. 3(a)) disappeared while maintaining the features I–III (Fig. 3(d)). Therefore, by using temperature cycles below 160 °C, one can predictably carry out heat deposition into and withdrawal from this composite PCM without significant supercooling that substantially decreases the exergy of the stored thermal energy.
In the DSC curves of Fig. 3(d), a new exothermic feature IV emerged at 130–136 °C during cooling. To further understand the phase change characteristics of Man in COF-300, we performed an additional reference experiment, in which we ended heating at 150 °C and then started cooling; the results exhibited only two features, II and IV (Fig. 3(e)). Thus, the two endothermic features I and II correspond to, respectively, the two exothermic features III and IV, which may be indicative of at least two qualitatively different modes of phase transition experienced by Man molecules impregnated in the nanopores of COF-300. A previous report26 found two crystalline phases for Eri confined in the nanopores of mesoporous silica in which the pore diameter ranged from 7.5 to 9.2 nm. Presently, we are unable to conduct temperature-dependent powder X-ray diffraction experiments reliably, and the detailed elucidations of the crystalline structures shall be left as future work.
As shown in Fig. 3, a decrease of the melting point of Man in the COF relative to the Tm of bulk Man was found. Such lowering of the Tm seems to be a general consequence of confinement in nanopores; examples include water in silica gel,29 water in nanoporous alumina,30Man in nanoporous SiO2,15 and Eri in mesoporous silica,26 although the pore sizes used in these papers were above 5 nm and had size distributions unlike that of the COF. Confinement of linear liquid crystals into the nanopores decreased both the crystal-to-nematic and nematic-to-isotropic transition temperatures.31
Importantly, we can calculate the ΔHm of Man impregnated in COF-300 using the data of Fig. 3 as follows. The feature at 167 °C in Fig. 3(a) showed a ΔHm of 294 J g−1 as mentioned above. In Fig. 3(c) (COF:Man = 1:1), however, this melting feature showed 194 J per 1 g of Man loaded in the pan of the DSC. Therefore, the mass ratio of Man outside the COF (for which the Tm is 167 °C) to Man in the COF was 194:(294–194) = 194:100. Therefore, per 1 g of Man in the DSC pan, 100/294 ≅ 0.34 g of Man was impregnated into COF-300. Because the weight ratio of COF:Man is 1:1 in Fig. 3(c), the mass ratio of COF-300 to “Man in COF-300” was 1:0.34.‡ The summation of the melting enthalpies of the endothermic features of I and II was ca. 34.2 J per 1 g of Man loaded in the pan. Therefore, the enthalpy of fusion of Man in COF-300 (ΔHm,COF) was found to be 34.2/0.34 ≅ 100 J g−1 (estimated uncertainty: ±10%). This value is substantially smaller than the ΔHm of 294 J g−1.
Next, we discuss the reason that ΔHm,COF is smaller than ΔHm. Previously, Sagara et al.15 observed similar reductions of the fusion enthalpy of Man impregnated in nanoporous SiO2 with various average pore diameters from 11.6 to 50 nm; they explained this reduction in terms of the existence of “a nonfreezing liquid layer” at the pore-wall interface, which does not contribute to the solid–liquid transformation.15 However, we consider that such a viewpoint, which relied on a continuum liquid picture, is not suitable for the present case, where our pore diameter is more than one order of magnitude smaller than those investigated in ref. 15. In the present study, the width of the pore after saturation with Man molecules (cf.Fig. 2(c)) was only ca. 9.6 Å (Fig. S10c, ESI†), according to the SXRD analysis. This width is already close to the narrowest width of one Man molecule (6.03 Å) and smaller than its length (10.3 Å; Fig. S11, ESI†). Thus, we consider that the application of the notion of a nonfreezing liquid layer to the present study is inappropriate.
Instead, by visualizing the crystal structure of β-mannitol32 using Mercury software, we found that one Man molecule interacts via hydrogen bonding with six adjacent Man molecules (Fig. S12, ESI†). However, considering the relative sizes of the pore and the Man molecules (Fig. S11, ESI†), we surmise that one Man molecule in the pore could interact via hydrogen bonds with only a few adjacent Man molecules due to the small (ca. 9.6 Å) pore width. Thus, we explain the large reduction of ΔHm,COF from the discrete molecular-level viewpoint. Therefore, the pore size of the COF should be an important factor that affects the phase-change enthalpy of the guest. For TES applications, the reduction of fusion enthalpy is undesired. Hence, enlargement of the pore would be necessary, at least to some extent; this requirement may be addressed by exploiting design freedoms of the framework type and pore size, which is one of the advantages of COFs.
To realise the thermal applications proposed here, an understanding of the heat transfer properties is indispensable. Below, for the first time, we report thermal diffusivities (α in m2 s−1) of single-crystal COF and SA–COF single-crystal composites, along with the thermal conductivity (k in W m−1 K−1) of the single-crystal COF.
To determine these values, we used microscale temperature wave analysis (μ-TWA)33–36 (see Section S7 of the ESI† for details). Briefly, this method uses a sensor substrate and a heater substrate to sandwich a sample between a micro-thermocouple junction on the former and the ITO heater on the latter (Fig. 4(a) and (b)). We measured α perpendicular to the c-axis of COF-300 via either ‘face-up’ or ‘side-up’ configurations, as illustrated in Fig. 4(c). As the a- and b-axes are equivalent in COF-30022 (cf.Fig. 1(a)), both configurations result in physically equivalent measurements.
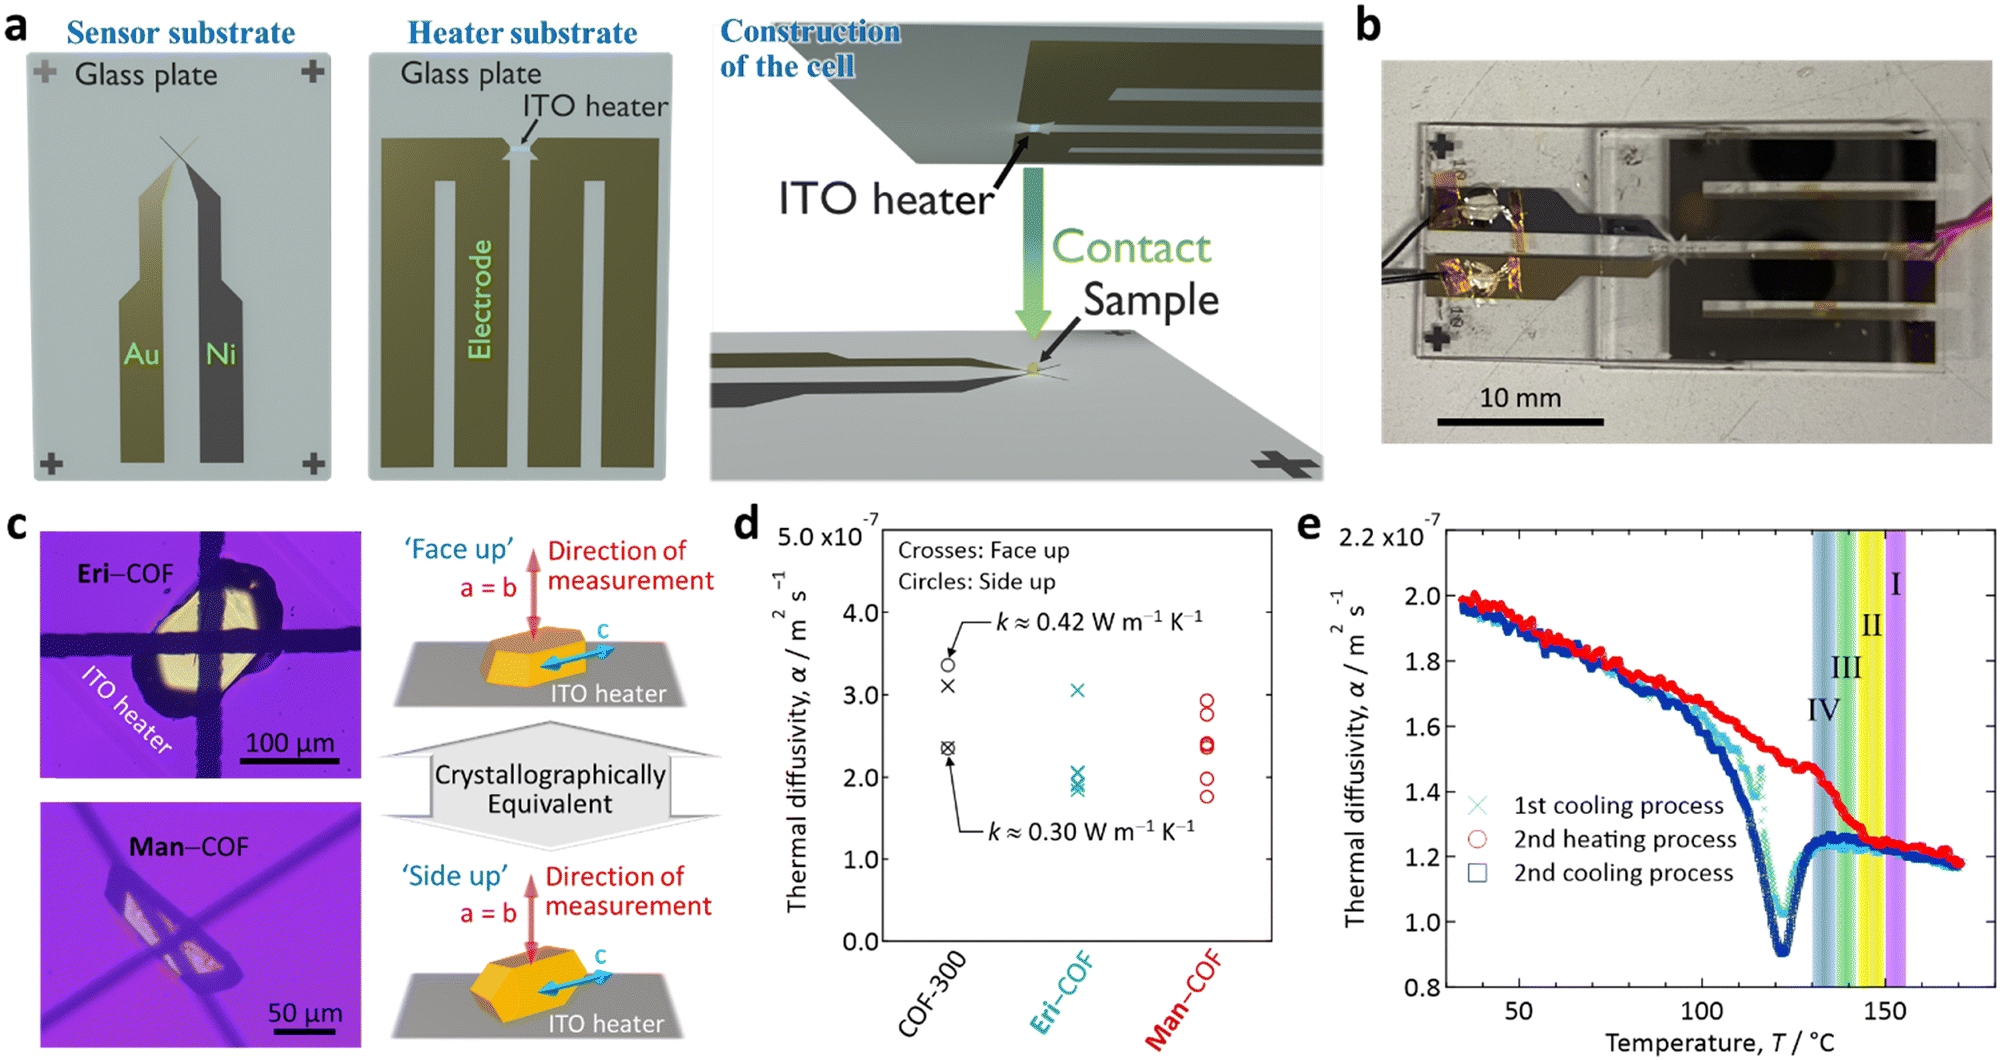 | ||
| Fig. 4 Thermal diffusivity measurements on single-crystal COF and SA–COF composite crystals. (a) Schematic of the cell structure for μ-TWA experiments. On the heater substrate, ITO was sputtered on a glass substrate to form a heater to generate a sinusoidal temperature wave. On the sensor substrate, thin films of gold and nickel were deposited on a glass substrate to form a thermocouple junction to detect the temperature wave that propagated through the sample and to measure the delay in the phase. (b) Photograph of the μ-TWA cell. (c) Example photographs of an Eri–COF composite crystal in ‘face up’ configuration (top) and a Man–COF composite crystal in ‘side up’ configuration (bottom) set in the cell, taken under a colour-sensitive polarizing microscope. (d) Measured α for multiple samples of unimpregnated COF-300 crystals and SA–COF composite crystals. For COF-300 crystals, we calculated k using the specific heat and density of COF-300. (e) Temperature dependence of α for a Man–COF composite crystal (thickness: 67.2 μm) measured with a scan rate of 2 °C min−1. The data for the first heating process is omitted due to the lack of credibility of the data. | ||
As a result, we found the α of unimpregnated COF-300 crystals near room temperature (R.T.) to be ca. 2.3–3.4 × 10⁻⁷ m2 s−1 based on four independent measurements (Fig. 4(d)); these α are about twice as high as those of typical polymers (ca. 1.0–1.7 m2 s−1 at R.T.).37 The values of α for Eri- and Man–COF composite crystals near R.T. were similar but slightly lower (ca. 1.8–3.1 × 10⁻⁷ m2 s−1, Fig. 4(d)). According to the previous literature,38α of Eri at R.T. is ca. 2.5 × 10⁻⁷ m2 s−1, which is similar to α values of the unimpregnated COF-300 and the SA–COF composites. Furthermore, for dried COF-300 powder, we determined the specific heat near R.T. to be ca. 1,200 J kg−1 K−1 (Fig. S4, ESI†). Along with the density of unimpregnated COF-300 (ca. 1,050 kg m−3),22 the thermal conductivity (k) of an unimpregnated COF-300 crystal perpendicular to the c-axis was derived to be ca. 0.3–0.4 W m−1 K−1, as indicated in Fig. 4(d).§
We note that, because of our experimental setup (Fig. 4(a)), we are currently unable to position the crystal so as to measure α along the c-axis; this is the direction along which an enhancement in the heat transfer may occur because this is the direction along which pores, and hence chains of hydrogen-bonded SA molecules, extend. Measurements along the c-axis shall be left for future study.
Finally, we report the heat transmission property of the Man–COF composite crystal up to Tm measuring the temperature (T) dependence of α. We carefully calibrated the temperature at the sample position using two references: see footnote.¶
In the heating process (red curve in Fig. 4(e)), α steadily decreased with T, which is the same behaviour as that reported for SAs38,39 and polymers.33 The melting peak at 143–149 °C in the DSC results (region II, Fig. 3) was found as a discontinuous change in the slope of the α–T curve, whereas no change in the curve was detected corresponding to the second endothermic peak at 150–156 °C found in the DSC results (region I, Fig. 3).
This observation may suggest that, because a COF-300 crystal provides anisotropic nano-confining space (cf.Fig. 1), the melting (i.e., change in the interactions between impregnated Man molecules or between Man and COF) could occur in two steps in the 1D narrow pores of the COF; namely, along the a- and b-axes (perpendicular to the pore), which is the direction of our present measurements (cf.Fig. 4(c)), and along the c-axis (parallel to pore), which is the direction we could not study by our present measurements. We suggest the following postulate: upon heating, the melting (or change in interaction) along the a- and b-axes, which is the direction of the measurement, occurs at 143–149 °C (region II), followed by a melting along the c-axis, which is perpendicular to the measurement, at 150–156 °C (region I).
In the cooling process (blue curves in Fig. 4(e)), a state change was observed as a dip of α around 122 °C, which is lower than the endothermic features observed in the DSC measurements. This transition could correspond to the exothermic peak at the lower temperature (130–136 °C) in the DSC measurement (region IV), although the observed transition temperature (downward dip) in Fig. 4(e) is 8 K lower than that of the feature in the DSC. This difference might be due to the difference in the scale of their measurements; the sample of μ-TWA is a single Man–COF crystal, whereas the DSC was measured for a cluster of Man–COF crystals.
Notably, the above postulate, which requires testing in the future, is consistent with the finding that the DSC features I and III are paired and the features II and IV are paired (Fig. 3(d)vs.Fig. 3(e)). We propose that the former pair may correspond to measurements parallel to the c-axis and hence was unobserved by our direction-sensitive measurements in Fig. 4, whereas the latter pair may correspond to measurements perpendicular to the c-axis and hence was observed by our direction-sensitive measurements in Fig. 4.
Conclusions
We have formed new composite materials by impregnating sugar alcohol (SA) into 1D nanopores of COF single crystals. For the present studies, we used Eri and Man, which are actively being investigated as green and low-cost PCMs, and COF-300. Owing to the unique large size (>100 μm) of our COF-300 crystals, the process of absorption of melted SA into the COF crystal was spatiotemporally revealed under an optical microscope, by which we found that a mechanically flexible framework of the present COF is an important factor for the SA impregnation. The central outcome of this report is the resolution of the problematic supercooling of SAs by our proposed materials concept of an SA–COF composite; the melting-freezing cycles of Man in a narrow temperature range of 130–155 °C have become possible without suffering from serious downgrading of stored thermal energy. However, presumably owing to the decrease in the number of Man molecules to which one Man molecule can interact in such small pores (∼1 nm), the fusion enthalpy is largely decreased as compared to that of bulk Man. This issue may be mitigated by optimizing the type and pore size of COF used.We discovered the unique state changes that take place in two endothermic and two exothermic steps for the SA–COF composite (Fig. 3). This unique characteristic may result from the anisotropic nanoconfinement effect in 1D-pored COFs with much smaller pore size (∼1 nm) than those typically used in preceding reports (larger than or near 10 nm).14–17,26,29–31 We expect that the results presented in this Communication, along with the first reports of heat transfer properties of this type of composite material, will invoke broad technological interest in this class of heat storage materials for which the confining scale is close to the size of the impregnated PCM molecules. We consider that this strategy is extendable to other types of COFs, including two-dimensional COFs, because COFs share some essential common characteristics, such as single nm-order periodic pores and relatively flexible—compared to inorganic porous materials—extended frameworks mainly composed of hydrocarbon or lightweight atoms.
Author contributions
Y. M. conceived the idea, led this research project, designed the methods of SA–COF composite preparation, and wrote this manuscript. S. M. conducted the experiments summarised in Fig. 2 and 3 and analysed the data. S. N. conducted the experiments described in Fig. 4 (μ-TWA experiments for COF-300, Man–COF, and the temperature dependence) and analysed the data. X. W. conducted SXRD measurements, the structural analyses, TGA measurements, and specific heat measurements. H. F. conducted the experiments described in Fig. 4 (μ-TWA experiments for COF-300 and Eri–COF) and analysed the data. M. R. contributed to the development of the experimental system of Fig. 4 and conducted relevant experiments in the early stage of this project. J. M. led and supervised the μ-TWA measurements and analyses for Fig. 4 and wrote the part of the manuscript discussing the experiments depicted in Fig. 4(e).Conflicts of interest
There are no conflicts to declare.Acknowledgements
This work was financially supported by JST PRESTO (grant no. JPMJPR18I9, Y. M.), JSPS KAKENHI (grant no. JP22K18286, Y. M.), JST CREST (grant no. JPMJCR19I3, J. M.), and JSPS KAKENHI (grant no. JP22K14200 and JP22H02137, J. M.).Notes and references
- S. Tomassetti, A. Aquilanti, P. F. Muciaccia, G. Coccia, C. Mankel, E. A. B. Koenders and G. Di Nicola, J. Energy Storage, 2022, 55, 105456 CrossRef.
- E. P. del Barrio, A. Godin, M. Duquesne, J. Daranlot, J. Jolly, W. Alshaer, T. Kouadio and A. Sommier, Sol. Energy Mater. Sol. Cells, 2017, 159, 560 CrossRef CAS.
- M. Papapetrou, G. Kosmadakis, A. Cipollina, U. La Commare and G. Micale, Appl. Therm. Eng., 2018, 138, 207 CrossRef.
- E. Garofalo, M. Bevione, L. Cecchini, F. Mattiussi and A. Chiolerio, Energy Technol., 2020, 8, 2000413 CrossRef CAS.
- A. Solé, H. Neumann, S. Niedermaier, I. Martorell, P. Schossig and L. F. Cabeza, Sol. Energy Mater. Sol. Cells, 2014, 126, 125 CrossRef.
- I. Pitkinen, P. Perkkalainen and H. Rautiainen, Thermochim. Acta, 1993, 214, 157 CrossRef.
- C. Barreneche, A. Gil, F. Sheth, A. I. Fernández and L. F. Cabeza, Sol. Energy, 2013, 94, 344 CrossRef CAS.
- M. P. A. Luna, H. Neumann and S. Gschwander, Appl. Sci., 2021, 11, 5448 CrossRef CAS.
- I. Shamseddine, F. Pennec, P. Biwole and F. Fardoun, Renewable Sustainable Energy Rev., 2022, 158, 112172 CrossRef CAS.
- A. Mojiri, N. Grbaca, B. Bourkeb and G. Rosengarten, Sol. Energy Mater. Sol. Cells, 2018, 176, 150 CrossRef CAS.
- R. Bayón and E. Rojas, AIMS Energy, 2017, 5, 404 Search PubMed.
- H. Neumann, S. Niedermaier, S. Gschwander and P. Schossig, Thermochim. Acta, 2018, 660, 134 CrossRef CAS.
- H. Neumann, D. Burger, Y. Taftanazi, M. P. A. Luna, T. Haussmann, G. Hagelstein and S. Gschwander, Sol. Energy Mater. Sol. Cells, 2019, 200, 109913 CrossRef CAS.
- T. Nomura, N. Okinaka and T. Akiyama, Mater. Chem. Phys., 2009, 115, 846 CrossRef CAS.
- A. Sagara, T. Nomura, M. Tsubota, N. Okinaka and T. Akiyama, Mater. Chem. Phys., 2014, 146, 253 CrossRef CAS.
- T. Xu, Q. Chen, G. Huang, Z. Zhang, X. Gao and S. Lu, Sol. Energy Mater. Sol. Cells, 2016, 155, 141 CrossRef CAS.
- L. He, S. Mo, P. Lin, L. Jia, Y. Chen and Z. Cheng, Sol. Energy Mater. Sol. Cells, 2020, 209, 110473 CrossRef CAS.
- L. Hackl, C.-H. Hsu, M. P. Gordon, K. Chou, C. Ma, M. Kolaczkowski, C. L. Anderson, Y.-S. Liu, J. Guo, P. Ercius and J. J. Urban, J. Mater. Chem. A, 2020, 8, 23795 RSC.
- H. M. El-Kaderi, J. R. Hunt, J. L. Mendoza-Cortés, A. P. Côté, R. E. Taylor, M. O’Keeffe and O. M. Yaghi, Science, 2017, 316, 268 CrossRef PubMed.
- C. S. Diercks and O. M. Yaghi, Science, 2017, 355, 923 CrossRef CAS PubMed.
- X. Chen, K. Geng, R. Liu, K. T. Tan, Y. Gong, Z. Li, S. Tao, Q. Jiang and D. Jiang, Angew. Chem., Int. Ed., 2020, 59, 5050 CrossRef CAS PubMed.
- T. Ma, E. A. Kapustin, S. X. Yin, L. Liang, Z. Zhou, J. Niu, L. H. Li, Y. Wang, J. Su, J. Li, X. Wang, W. D. Wang, W. Wang, J. Sun and O. M. Yaghi, Science, 2018, 361, 48 CrossRef CAS PubMed.
- Y. Chen, Z.-L. Shi, L. Wei, B. Zhou, J. Tan, H.-L. Zhou and Y.-B. Zhang, J. Am. Chem. Soc., 2019, 141, 3298 CrossRef CAS PubMed.
- X. Wang, R. Enomoto and Y. Murakami, Chem. Commun., 2021, 57, 6656 RSC.
- G. Zhang, X. Zou, Q. Wang and Y. He, Angew. Chem., Int. Ed., 2023, 62, e202214569 CrossRef CAS PubMed.
- K. Nakano, Y. Masuda and H. Daiguji, J. Phys. Chem. C, 2015, 119, 4769 CrossRef CAS.
- A. Burger, J. Henck, S. Hetz, J. M. Rollinger, A. A. Weissnicht and H. Stöttner, J. Pharm. Sci., 2000, 89, 457 CrossRef CAS PubMed.
- A. Raemy and T. F. Schweizer, J. Therm. Anal., 1983, 28, 95 CrossRef CAS.
- S. Maruyama, K. Wakabayashi and M. Oguni, AIP Conf. Proc., 2004, 708, 675 CrossRef CAS.
- Y. Suzuki, H. Duran, M. Steinhart, M. Kappl, H.-J. Butt and G. Floudas, Nano Lett., 2015, 15, 1987 CrossRef CAS PubMed.
- C. Grigoriadis, H. Duran, M. Steinhart, M. Kappl, H.-J. Butt and G. Floudas, ACS Nano, 2011, 5, 9208 CrossRef CAS PubMed.
- F. R. Fronczek, H. N. Kamel and M. Slattery, Acta Crystallogr., Sect. C: Cryst. Struct. Commun., 2003, 59, o567 CrossRef PubMed.
- T. Hashimoto, J. Morikawa, T. Kurihara and T. Tsuji, Thermochim. Acta, 1997, 304, 151 CrossRef.
- A. Orie, J. Morikawa and T. Hashimoto, Thermochim. Acta, 2012, 532, 148 CrossRef CAS.
- M. Ryu, S. Takamizawa and J. Morikawa, Appl. Phys. Lett., 2021, 119, 251902 CrossRef CAS.
- ISO 22007-3:2008. URL: https://www.iso.org/standard/41063.html.
- W. N. dos Santos, P. Mummery and A. Wallwork, Polym. Test., 2005, 24, 628 CrossRef.
- M. Zamengo, T. Funada and J. Morikawa, Appl. Therm. Eng., 2017, 117, 376 CrossRef CAS.
- T. Agarwal, J. Therm. Anal. Calorim., 2018, 134, 1183 CrossRef CAS.
Footnotes |
| † Electronic supplementary information (ESI) available. See DOI: https://doi.org/10.1039/d3mh00905j |
| ‡ Because the mass ratio Man:COF at the maximal inclusion of Man in a Man-COF composite crystal (Rmax) has been determined to be ca. 0.77 (see Section S3 of the ESI†), this ratio, 1:0.34, corresponds to ca. 44% filling relative to the maximum impregnation capacity because 0.34/0.77 ≅ 0.44. |
| § Currently, we are unable to determine specific heats of the SA-COF composites due to non-100% filling of SAs into COF-300 when composite samples were prepared by Method 2; see also the footnote marked with ‡. Therefore, our thermal conductivity in the present report is limited to that of an unimpregnated COF-300 crystal. |
| ¶ The first reference was a pair of Man droplets (Tm: 167 °C) put on the sensor and heater substrates for which the fusions were recorded in situ during the experiments presented in Fig. 4(e) under a polarizing microscope (see Section S8 in the ESI†). The average time of their fusions was taken as the time when the sample reached 167 °C. That is, if the fusion of a droplet on the heater substrate occurred at time t1, and subsequently a droplet on the sensor substrate occurred at t2, we regarded tmid = (t1 + t2)/2 as the time when the sample reached 167 °C, because the temperature of the heater substrate was always slightly higher than that of the sensor substrate; see Fig. 4(a). The second reference was the liquid crystal 5CB (Tm: 35 °C), for which the fusion was separately recorded at the sample position in the μ-TWA cell. Using these two temperatures, we linearly calibrated the thermocouple located in the hot stage. |
| This journal is © The Royal Society of Chemistry 2023 |