
3D-printed epidermal sweat microfluidic systems with integrated microcuvettes for precise spectroscopic and fluorometric biochemical assays†
Da Som
Yang‡
 ab,
Yixin
Wu‡
ac,
Evangelos E.
Kanatzidis‡
ad,
Raudel
Avila
ef,
Mingyu
Zhou
ag,
Yun
Bai
ac,
Shulin
Chen
ag,
Yurina
Sekine
h,
Joohee
Kim
ai,
Yujun
Deng
ej,
Hexia
Guo
ac,
Yi
Zhang
kl,
Roozbeh
Ghaffari
agm,
Yonggang
Huang
acen and
John A.
Rogers
*acegmopq
ab,
Yixin
Wu‡
ac,
Evangelos E.
Kanatzidis‡
ad,
Raudel
Avila
ef,
Mingyu
Zhou
ag,
Yun
Bai
ac,
Shulin
Chen
ag,
Yurina
Sekine
h,
Joohee
Kim
ai,
Yujun
Deng
ej,
Hexia
Guo
ac,
Yi
Zhang
kl,
Roozbeh
Ghaffari
agm,
Yonggang
Huang
acen and
John A.
Rogers
*acegmopq
aQuerrey Simpson Institute for Bioelectronics, Northwestern University, Evanston, IL 60208, USA. E-mail: jrogers@northwestern.edu
bPrecision Biology Research Center (PBRC), Sungkyunkwan University, Suwon, 16419, South Korea
cDepartment of Materials Science and Engineering, Northwestern University, Evanston, IL 60208, USA
dDepartment of Molecular Biosciences, Northwestern University, Evanston, IL, USA
eDepartment of Mechanical Engineering, Northwestern University, Evanston, IL 60208, USA
fDepartment of Mechanical Engineering, Rice University, Houston, TX 77005, USA
gDepartment of Biomedical Engineering, Northwestern University, Evanston, IL 60208, USA
hMaterials Sciences Research Center, Japan Atomic Energy Agency, Tokai, Ibaraki 319-1195, Japan
iCenter for Bionics of Biomedical Research Institute, Korea Institute of Science and Technology, Seoul, 02792, Republic of Korea
jState Key Laboratory of Mechanical System and Vibration, Shanghai Jiao Tong University, Shanghai, China
kPolymer Program, Institute of Materials Science, University of Connecticut, Storrs, Connecticut 06269, USA
lDepartment of Biomedical Engineering, University of Connecticut, Storrs, Connecticut 06269, USA
mEpicore Biosystems Inc., Cambridge, MA, USA
nDepartment of Civil and Environmental Engineering, Northwestern University, Evanston, IL 60208, USA
oDepartment of Neurological Surgery, Northwestern University, Evanston, IL 60208, USA
pDepartment of Electrical and Computer Engineering, Northwestern University, Evanston, IL 60208, USA
qDepartment of Chemistry, Northwestern University, Evanston, IL 60208, USA
First published on 21st August 2023
Abstract
Systems for capture, storage and analysis of eccrine sweat can provide insights into physiological health status, quantify losses of water, electrolytes, amino acids and/or other essential species, and identify exposures to adverse environmental species or illicit drugs. Recent advances in materials and device designs serve as the basis for skin-compatible classes of microfluidic platforms and in situ colorimetric assays for precise assessments of sweat rate, sweat loss and concentrations of wide-ranging types of biomarkers in sweat. This paper presents a set of findings that enhances the performance of these systems through the use of microfluidic networks, integrated valves and microscale optical cuvettes formed by three dimensional printing in hard/soft hybrid materials systems, for accurate spectroscopic and fluorometric assays. Field studies demonstrate the capability of these microcuvette systems to evaluate the concentrations of copper, chloride, and glucose in sweat, along with the pH of sweat, with laboratory-grade accuracy and sensitivity.
 John A. Rogers | We send a warm salute to Materials Horizons in recognition of its 10th anniversary. Over this decade, Materials Horizons has served as an essential journal highlighting advances at the forefront of materials science and engineering. We are regular readers of papers published in Materials Horizons and we have served as referees for several submitted manuscripts. We are excited to publish our work on materials for 3D-printed devices designed to allow capture, storage and spectroscopic analysis of eccrine sweat for the 10th anniversary collection. We look forward to future opportunities to publish our best work in Material Horizons. |
New conceptsAnalysis of biochemical content in sweat can provide insights into overall physiological health conditions, yield information for disease diagnostics, produce alerts into environmental exposures and define the loss of essential substances. Recent advances in materials science and device engineering serve as the basis for skin-compatible classes of microfluidic platforms for in situ analysis and continuous monitoring via colorimetric assays. The accuracy of this type of platform can, however, be limited by artifacts of digital imaging processes that are used for colorimetric quantitation and by mechanical deformations of the analysis chambers during on-body tests. This paper reports new materials and 3D printing concepts for microfluidic networks that incorporate microscale optical cuvettes in hard/soft composite constructs. These mechanically stable systems enable precise spectroscopic and fluorometric measurements, without limitations of past approaches. Specifically, this hard/soft hybrid platform not only provides options for in situ analysis, but it is also compatible with laboratory-grade analysis via bench-top spectrometers. This paper systematically explores various polymeric materials for these devices, with quantitative experimental investigations and computational modeling of their capabilities in these wearable microfluidic sensing technologies. Field studies demonstrate applications in evaluating the concentrations of copper, chloride, glucose in sweat and the pH of sweat, with laboratory-grade accuracy and sensitivity. |
Introduction
Sweat contains a rich mixture of electrolytes, metabolites, metals and small molecules. Analysis of these species can reveal physiological health conditions, provide information for disease diagnostics,1 yield insights into environmental exposures and define the loss of essential substances. For example, the concentration of chloride in sweat commonly serves as a screen for cystic fibrosis (CF).2 The level of pH of sweat can indicate hydration status.3 The amount of glucose in sweat can provide information into prediabetic conditions.4 Copper deficiency, perhaps detectable in sweat, can suggest disorders of the liver.5 By comparison to blood and interstitial fluid, sweat is attractive in these and other related contexts due to its potential to be captured in a natural, non-invasive fashion.1Conventional methods for sweat collection rely on absorbent pads taped on the skin, followed by sample transfer, centrifugation and dilution for analysis using benchtop equipment. Drawbacks of this method include contamination from oils and other substances on the skin or in the pads, as well as unavoidable sample loss via evaporation and manual manipulation.6 Recently developed alternative approaches rely on wearable flexible electronic devices and/or microfluidic systems integrated with potentiometric,7–11 colorimetric12–16 or fluorometric17–20 sensors. Systems for electrochemical detection and wireless data communication support capabilities for in situ analysis and continuous monitoring but they require power sources and they are susceptible to biofouling and other effects that can reduce robustness and reliability.21 Colorimetric or fluorometric chemistries, particularly when integrated into soft microfluidic structures, allow for in situ operation without additional components, where digital cameras and color extraction algorithms provide mechanisms for wireless readout.12–17 The accuracy of this type of scheme can be limited, however, by artifacts of the imaging process and by slight mechanical deformations of the analysis chambers.13,21 Recent reports introduce hybrid hard/soft structures to minimize the latter effects while maintaining sufficient flexibility for gentle interfaces to the skin by laser processing13 or 3D printing.14 Cumbersome fabrication schemes13 and remaining challenges in color extraction13,14 represent two key disadvantages.
Techniques in 3D-printing offer potential alternatives, with versatile options in 3D structure geometries and fine features, along with automated operational modes suitable for high throughput production.22,23 Likewise, spectrophotometric methods for colorimetry and fluorometry, as widely used in analytical chemistry,24 could form the basis for improvements over image capture/analysis. A key requirement is in optical cuvettes that have sufficient, consistent path lengths, fixed dimensions, high optical quality and low background fluorescence intensities.25
This paper introduces a set of ideas, materials and processing approaches that exploit these two opportunities. Specifically, 3D-printed hard-core/soft-shell microfluidic systems that integrate microcuvettes offer skin-compatible mechanics with capabilities for removal and insertion into bench-top spectrometers for laboratory-grade evaluations. 3D printing is important as a manufacturing method due to its ability for rapid and low-cost prototyping of microfluidic structures with complex valve features, interconnecting microfluidic channels, and microcuvettes in various optical-grade resins. Serpentine layouts and soft elastomeric encapsulating structures are other essential design features. These mechanically robust constructs ensure fixed, well-defined optical pathways with necessary valving features to ensure controlled filling dynamics. The result enables precise spectroscopic measurements without motion artifacts during usage and removal. Examples of sensors for copper, chloride, and pH of sweat as well as enzymatic glucose assays support precise colorimetric and fluorometric analysis, respectively. Field trials in healthy volunteers validate the performance of the devices in practical examples, with sweat induced by exercise and exposure to high heat and humidity.
Results and discussion
Constituent materials, design layouts and fabrication procedures
The biomarker concentration in the sensing reservoir, i.e. the microcuvette, can be quantified optically through use of the Beer–Lambert law (eqn (1)):| A = εcl | (1) |
Fig. 1a illustrates the procedures for fabrication. As described in detail in the Methods section, a 3D printing process generates a skeletal structure (Fig. S1a, ESI†) in an acrylate polymer selected to ensure mechanical stability and to provide high optical transparency, as described in the following section. This structure defines the microfluidic channels, valves and microcuvettes for routing and storing samples of sweat in geometries that allow for spectrophotometric analysis.26 The microcuvettes contain assays for either colorimetric (Cu2+, Cl−, pH) or fluorometric (glucose) detection of sweat biomarkers. A double-sided adhesive (90![[thin space (1/6-em)]](https://www.rsc.org/images/entities/char_2009.gif) 880, Adhesive Research, Inc., PA, USA) seals the top surface of this printed structure to complete the microfluidic construct (Fig. S1b, ESI†). A silicone elastomer (poly(dimethylsiloxane), PDMS) serves as a soft encapsulating material that defines a composite device, in layouts with effective mechanical properties that facilitate mounting on the soft, curved surfaces of the skin. A thin, medical grade adhesive (PC2723U; ScapaHealthcare, CT, USA) provides strong adhesion to the skin, with minimal dead volume near the inlet region.27 A laser profiling process opens inlets and outlets for collection of sweat and release of air, to complete the fabrication. An exploded view schematic illustration appears in Fig. 1b. After a period of sweat collection, the device can be removed from the skin and directly inserted into a UV-visible spectrometer or fluorescent imager for precise optical analysis (Fig. 1c). Photographs of devices filled using water with fluorescent and ultraviolet dyes are in Fig. 1d–f and Fig. S2 (ESI†). The microcuvettes can be designed with thicknesses that optimize the optical path length for spectroscopic evaluation tailored to specific assays. Photographs of devices with thick (depth: 1 mm) and thin (depth: 200 μm) microcuvettes mounted on the arm are in Fig. 1g and Fig. S3 (ESI†).
880, Adhesive Research, Inc., PA, USA) seals the top surface of this printed structure to complete the microfluidic construct (Fig. S1b, ESI†). A silicone elastomer (poly(dimethylsiloxane), PDMS) serves as a soft encapsulating material that defines a composite device, in layouts with effective mechanical properties that facilitate mounting on the soft, curved surfaces of the skin. A thin, medical grade adhesive (PC2723U; ScapaHealthcare, CT, USA) provides strong adhesion to the skin, with minimal dead volume near the inlet region.27 A laser profiling process opens inlets and outlets for collection of sweat and release of air, to complete the fabrication. An exploded view schematic illustration appears in Fig. 1b. After a period of sweat collection, the device can be removed from the skin and directly inserted into a UV-visible spectrometer or fluorescent imager for precise optical analysis (Fig. 1c). Photographs of devices filled using water with fluorescent and ultraviolet dyes are in Fig. 1d–f and Fig. S2 (ESI†). The microcuvettes can be designed with thicknesses that optimize the optical path length for spectroscopic evaluation tailored to specific assays. Photographs of devices with thick (depth: 1 mm) and thin (depth: 200 μm) microcuvettes mounted on the arm are in Fig. 1g and Fig. S3 (ESI†).
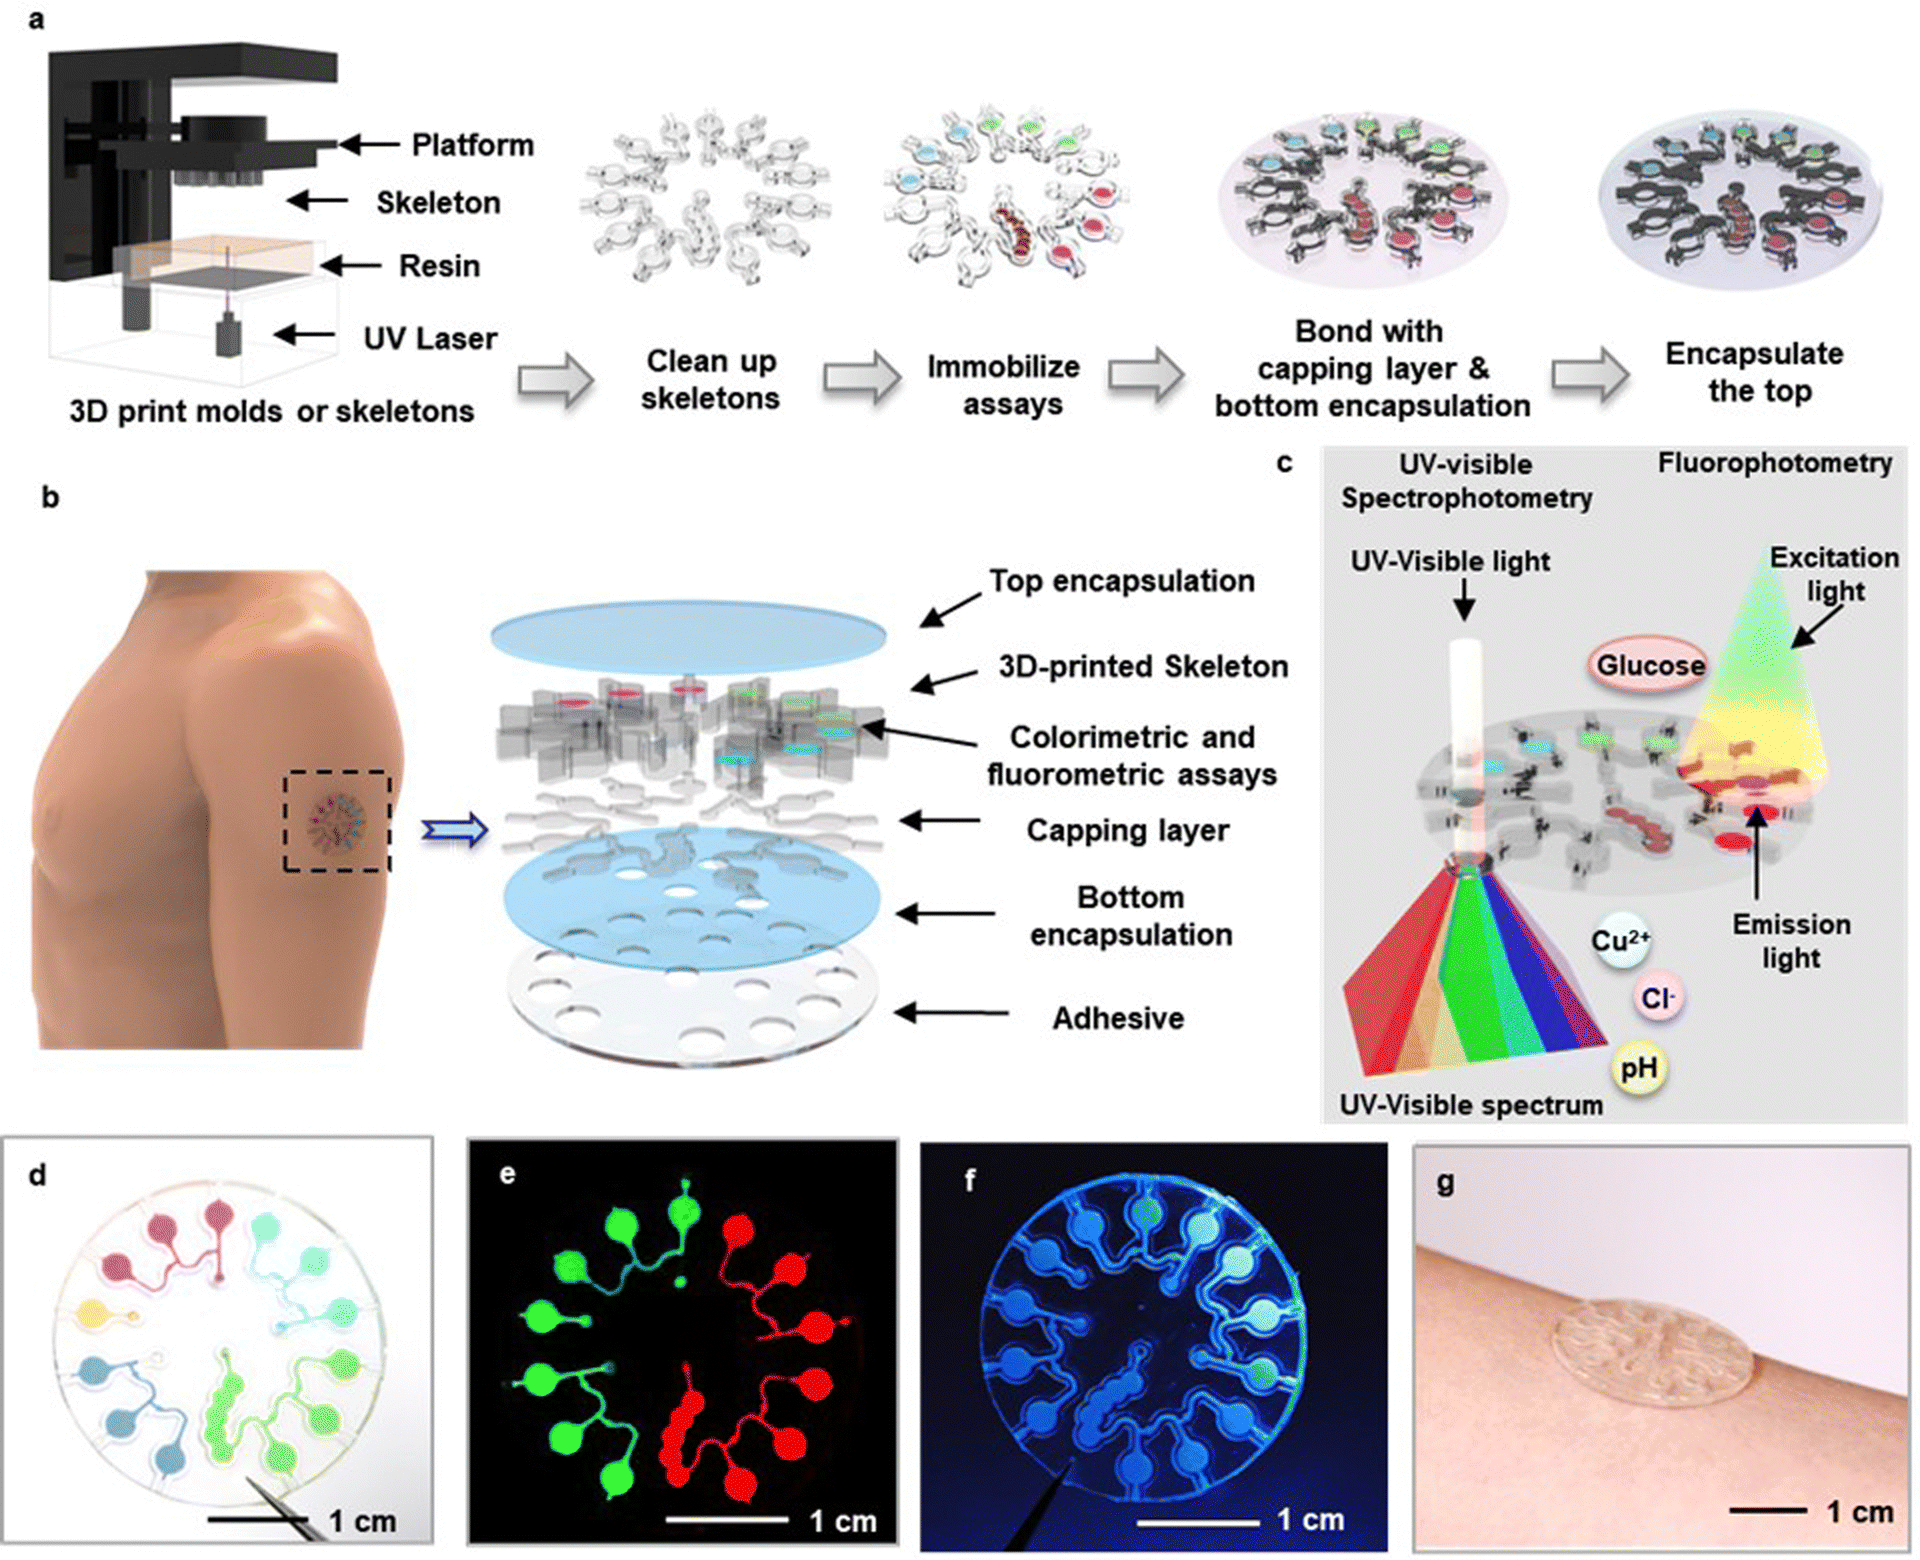 | ||
| Fig. 1 3D-printed, skin-compatible microfluidic system for capture, storage and analysis of sweat using spectrophotometric and fluorophotometric techniques. (a) Sequence of steps for fabricating systems that combine microfluidic systems with integrated microcuvettes (skeletons) in a high modulus polymer, subsequently encapsulated in a soft elastomer. (b) Exploded view illustration of a device, as mounted on the upper arm. (c) Schematic illustration of the process for ultraviolet-visible spectrophotometry and fluorometric measurements for analysis of copper, chloride and glucose in sweat, and for sweat pH. (d)–(f) Photographs of 3D-printed microcuvettes filled with dyed water (d), fluorescent dye (e), and ultraviolet dye (f). (g) Photograph of a device mounted on the skin. | ||
Characterization of 3D-printed sweat microcuvettes made of various resins
The structures can be formed in the full range of materials that are compatible with 3D printing (Fig. 2a). The work here focuses on four types of resins selected for their suitability in spectroscopic evaluations throughout the visible range: methacrylate–methacrylate (MA–MA), acrylate-isobornyl acrylate (Acrylate-IBA), methacrylate-urethane methacrylate (MA-UDMA), and a biocompatible form of MA-UDMA (b-MA-UDMA). Mechanical and chemical data for resins used in this paper are summarized in Table S1 (ESI†). Transmission spectra of 3D-printed microcuvettes show high transparency for wavelengths between 420 nm and 700 nm for all four cases. Specifically, the transmittance values (including reflection losses) averaged across a wavelength range of 500–700 nm for layers of resins with thicknesses of 1 mm, relevant to the application investigated here, are: b-MA-UDMA 92%; MA-UDMA 85%; Acrylate-IBA 83%; and MA–MA 80%. As reference, the value for PDMS is 95.53%, Fig. 2b).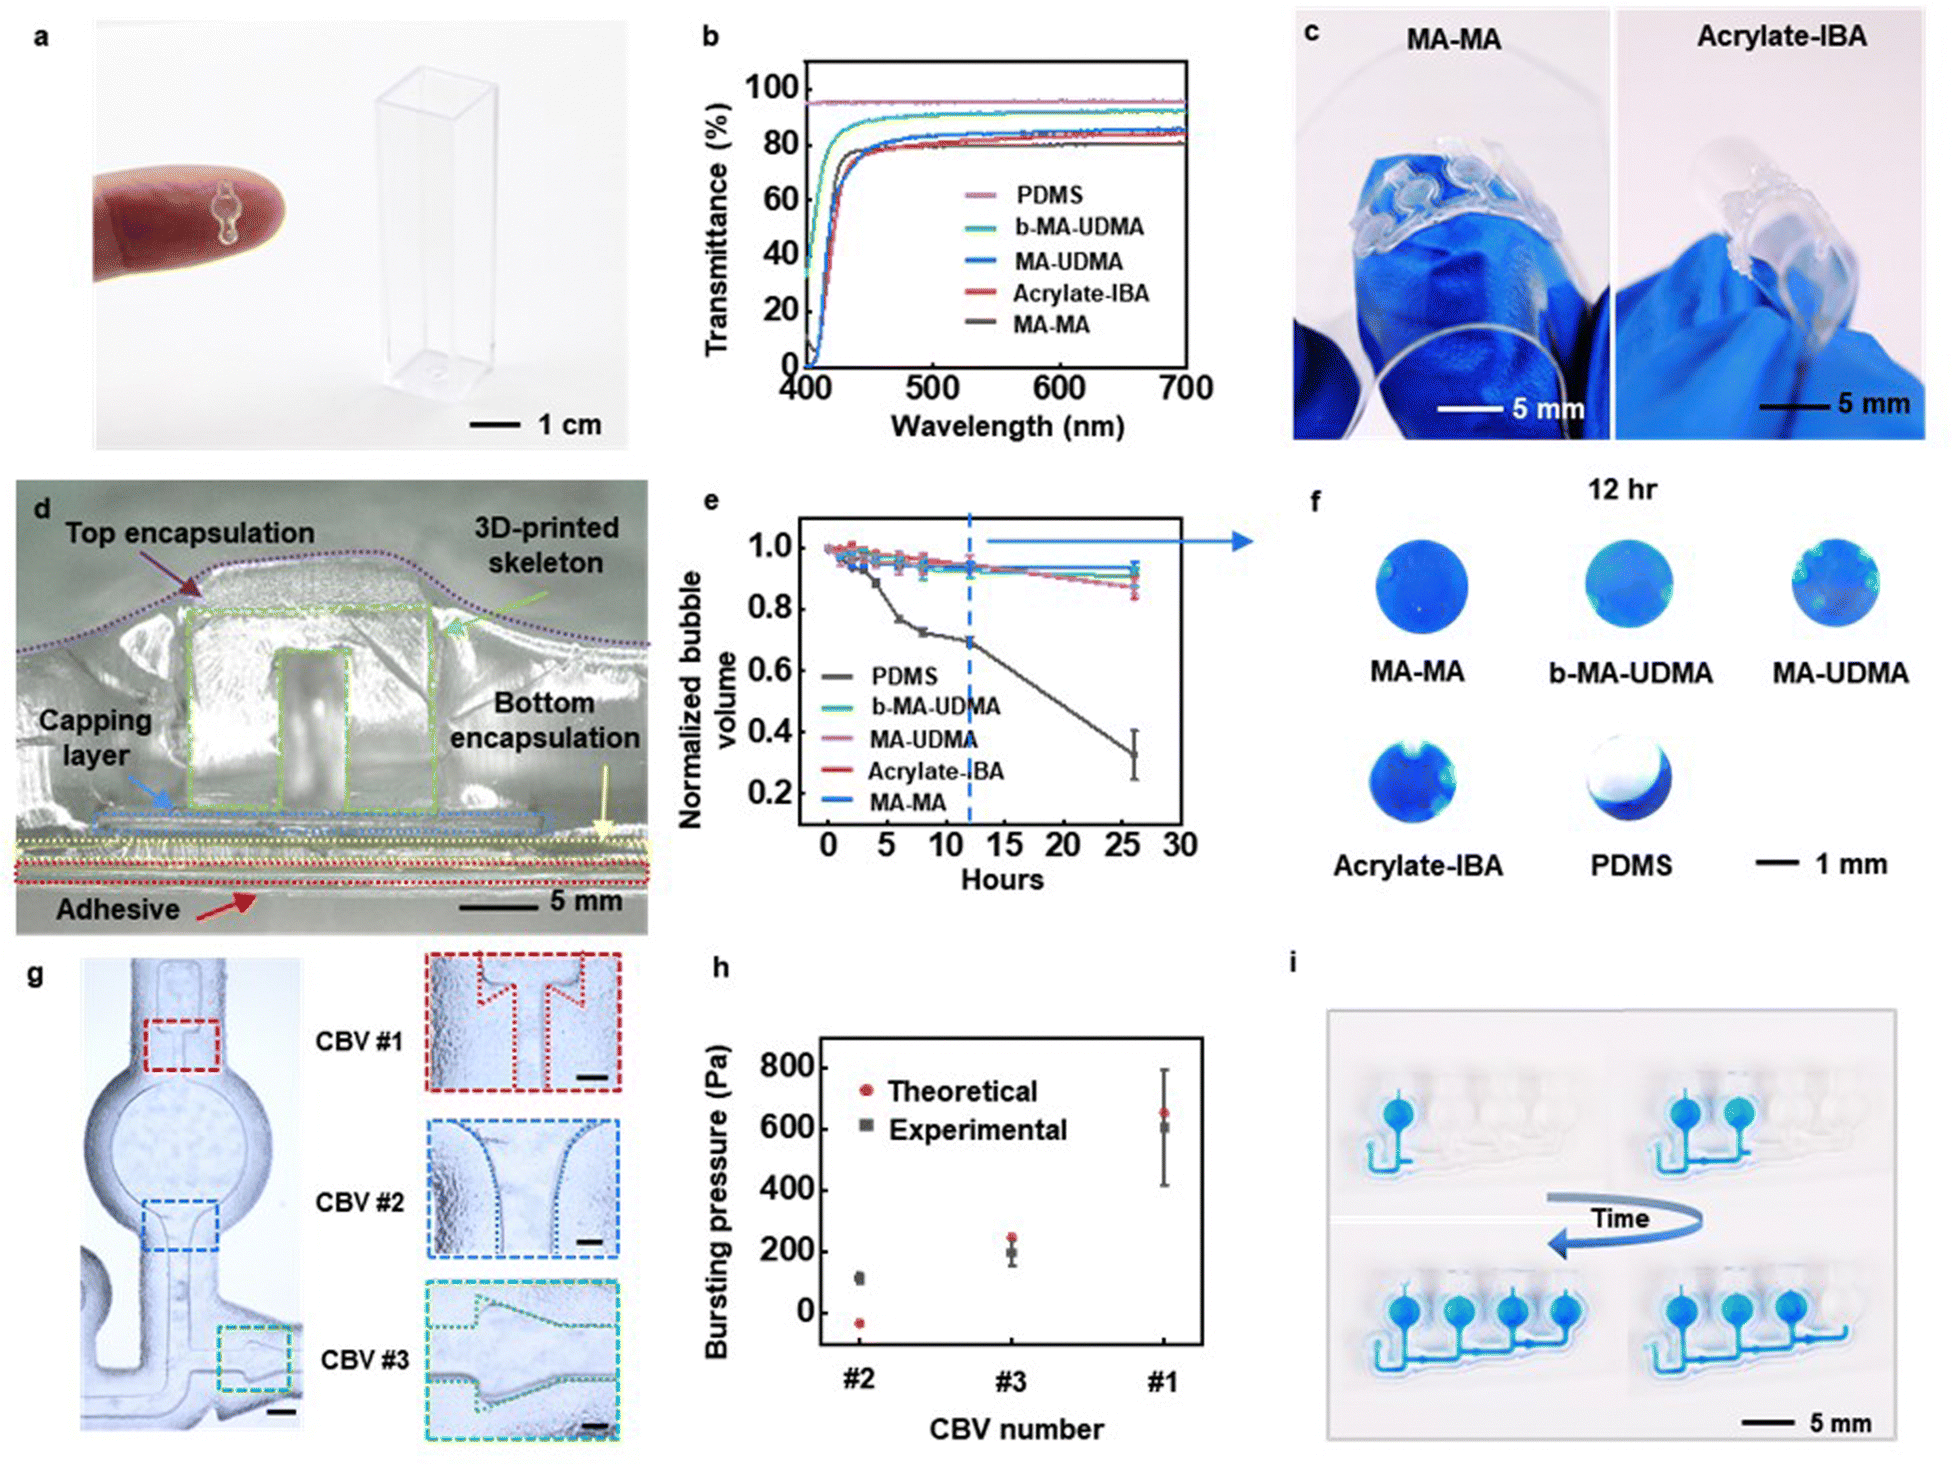 | ||
| Fig. 2 Characteristics of microcuvettes, microchannels and valves formed by 3D printing. (a) Photograph of an isolated optical microcuvette (left) compared with a conventional cuvette (right). (b) The transmittance of microcuvettes formed from different resins. (c) Photographs of microcuvettes made of MA–MA and Acrylate-IBA during bending, to illustrate their different mechanical properties. (d) Cross-sectional optical micrograph of a microcuvette. (e) The water transmission rate of microcuvettes formed with different resins. (f) Photographs of microcuvettes filled with dyed water after 12 h in an ambient laboratory environment. The bubbles arise due to evaporation of water. (g) Optical micrographs of capillary bursting valves integrated with microchannels that connect to microcuvettes of MA–MA. The color contours reflect the shapes of the microchannels, which differ slightly from the targeted shapes due to the resolution limits of the 3D printing process. Scale bar: 0.2 mm. (h) Experimental results and calculated bursting pressures for capillary bursting valves. (i) Sequence of images that shows the sequential filling of microcuvettes. | ||
Other considerations are in the mechanical and water barrier properties, to ensure dimensional stability and minimal evaporative losses, respectively. MA–MA (Young's modulus: 2.2 GPa) and b-MA-UDMA (Young's modulus: 2.9 GPa) are relatively stiff materials that offer high impact resistance and mechanical stability during use on the skin, well-matched to requirements in demanding applications such as those encountered in the military or in contact sports. A disadvantage is in the reduced compliance, with negative implications for user comfort. Acrylate-IBA (Young's modulus: 3.23 MPa) and MA-UDMA (Young's modulus: 8.9 MPa), which have comparatively lower modulus, avoid this drawback (Fig. 2c and Fig. S4, ESI†).
These differences in mechanical properties can be understood based on free-volume theory and the chemical compositions of the resins (ESI† Note 1). As shown in Table S1 (ESI†), rubbery resins with low moduli (MA-UDMA, Acrylate-IBA) consist mainly of acrylate monomer. Substitution of acrylate monomer with urethane methacrylate/methacrylate monomer increases the modulus (MA–MA, b-MA-UDMA) due to the presence of larger side groups. These methyl groups cause steric hindrance for rotary isomerization around bonds in the main chain, thereby reducing the kinetic mobility and free volume, and subsequently increasing the modulus.28
The free volume not only facilitates local segmental mobility of the polymer chain, but it also allows the diffusion of small molecules including water, ions, and gases into the polymer film. As a result, the water-vapor transmission rate (WVTR) depends on the free volume fraction of polymer (ESI† Note 1). As might be expected due to free volume considerations, MA–MA and b-MA-UDMA have lower water permeabilities than Acrylate-IBA and MA-UDMA, thereby reducing their ability to retain sweat without losses.29 The rates for such losses can be evaluated using completed devices, as illustrated in the cross-sectional image of the layered configuration of Fig. 2d. The ability to retain sweat depends primarily on the resin materials, as the sealing adhesive serves as a highly impermeable barrier to water penetration (Fig. S5, ESI†). Experiments to quantify the efficiency in sweat retention involve aqueous solutions of triarylmethane blue dye loaded within the microfluidic structure. Epoxy applied to the inlets and outlets eliminates losses through these regions. Comparisons include structures made of the four materials described above, along with an otherwise similar structure formed using PDMS as a reference. Images captured over 26 h at room temperature (Fig. S6, ESI†) quantify the loss of water as a function of time, as shown in Fig. 2e. The results at 12 h (Fig. 2f) reveal vast improvements in retention for devices formed with all of the resins, compared to those with PDMS. At 26 h, the water loss for the MA–MA, MA-UDMA, b-MA-UDMA, Acrylate-IBA and PDMS cases are 6%, 9%, 12%, 13% and 67%, respectively.
Capillary bursting valves (CBVs) route sweat into microcuvettes in a sequential manner, with negligible mixing of early and late sweat (Fig. 2g), as a passive form of chronometric sampling.26 The bursting pressures depend on the surface tension, the width of the microchannel, and the height and diverging angle of the features that define the valve.30 Measured data and calculated bursting pressures for three different types of CBVs appear in Fig. 2h. The contact angles used in the calculations follow from determinations using a goniometer (VCA Optima XE, ASI Products, Inc), as in Fig. S7 (ESI†). As sweat passes through the inlet, the filling front diverts into two paths. One passes into CBV #2, and another into CBV #3. Because the bursting pressure of CBV #2 is smaller than that of CBV #3, the front passes through CBV #2 first and fills the corresponding microcuvette. Afterward, the front meets CBV #1, which has a higher bursting pressure than CBV #2. As a result, the front at CBV #3 halts while the front at CBV #2 moves forward. This combination of three CBVs allows for a desired sequential filling process with simple 3D printing steps, as demonstrated in Fig. 2i. The critical features in the CBVs must be defined precisely for repeatable, high-performance operation. The resolution of these features depends on the parameters of the printer and the photochemical properties of the resins.31,32 For microchannels with depths of 1 mm defined with the printer used here, the minimum widths of microchannels in structures formed with MA-UDMA, b-MA-UDMA and Acrylate-IBA are 500 μm, while those in MA–MA can be as narrow as 200 μm with enhanced precision in the diverging angles (Fig. S8, ESI†). For comparatively shallow microchannels (depths of 200 μm), the minimum widths with MA–MA, MA-UDMA and b-MA-UDMA are 200 μm, and that for Acrylate-IBA is 500 μm (Fig. S8g–j, ESI†).
Incorporating these CBVs and microchannels allows collection of sweat into the microcuvettes under physiological conditions (Fig. S9, ESI†). Fig. S9 (ESI†) shows a fluid dynamic simulation (CFD) that captures the moving interface between air/sweat to show the sweat collection efficiency under natural sweating conditions. As shown in Fig. S9 (ESI†), the microfluidic structures collect sweat into the entire volumes of the microcuvettes with given boundary conditions without any leakage to the air vent channel or formation of air bubbles (ESI† Note 2). An alternative route to these types of structures relies on 3D printing to form corresponding molds (Fig. S10, ESI†). Fig. S10a (ESI†) shows a mold printed in Acrylate-IBA with a minimum microchannel width of 200 μm. The soft and elastic properties of the Acrylate-IBA facilitates demolding from a UV curable optical adhesive (NOA63, Norland Products Inc., NJ, USA), selected as the skeletal material for its high transparency (Average of 500–700 nm: 90.6%), low fluorescence background intensity (Fig. S11, ESI†), and high modulus (Young's modulus: 1.1 GPa). An ultraviolet laser system (ProtoLaser U4, LPKF, Germany) removes excess materials and defines the overall profile the molded structure. As with the 3D printed examples, these molded parts can be loaded with chemical assays, capped with adhesives and encapsulated in PDMS to yield complete devices.
Another advantage of 3D-printed microcuvettes or NOA compared to PDMS, is their low permeability to diffusion of small molecules. As described in other studies, uncontrolled absorption of small molecule species of interest into PDMS can limit use of this material in platforms for biomarker sensing or drug screening.33 As shown in Fig. S12a and b (ESI†), PDMS substrates not only strongly absorb small hydrophobic molecules such as rhodamine B, but also water-soluble bromothymol blue dye used for pH assays. 3D-printed resins or NOA based microfluidics are, in this sense, attractive alternatives. Incubation of rhodamine B solution in 3D-printed and NOA microcuvettes allows for measurements of the absorption rate by fluorescence imaging (Fig. S12c and S13, ESI†). The results show the molecular absorption rates for MA–MA and NOA much smaller than that of PDMS, such that these effects can be neglected for the timescales for sweat collection and analysis. Table S2 (ESI†) summarizes the optical, chemical, and mechanical properties of resins explored here and their effect on sweat detection accuracy.
Mechanical considerations
For precise spectrophotometric analysis, the optical path length must be well defined and stable against mechanical deformations that may occur during use and manual handling. At the same time, the overall device must offer soft, stretchable properties to enable robust, non-irritating and water-tight interfaces to the surface of the skin. The skeletal architecture described here, and in simpler versions reported previously,34 combines a microfluidic channel and microcuvette structure of relatively hard materials with a surrounding soft matrix, designed in layouts that ensure a low effective modulus for this hard/soft composite system. Serpentine geometries lower the effective modulus of the hard skeleton structures and increase their effective stretchability. Fig. 3a–f presents photographs of a skeletal structure made of MA–MA in states of deformation, highlighting the distributions of strain obtained by finite element analysis (FEA). As shown in Fig. 3d, uniaxially stretching the hard/soft composite system by 15% leads to maximum strains in the MA–MA microcuvettes that remain under 1.5%. The elongation of the MA–MA material is 6% (Table S1, ESI†). The serpentine geometry ensures a stable interface under mechanical deformation with strains in the hard skeleton that are below its elongation limit.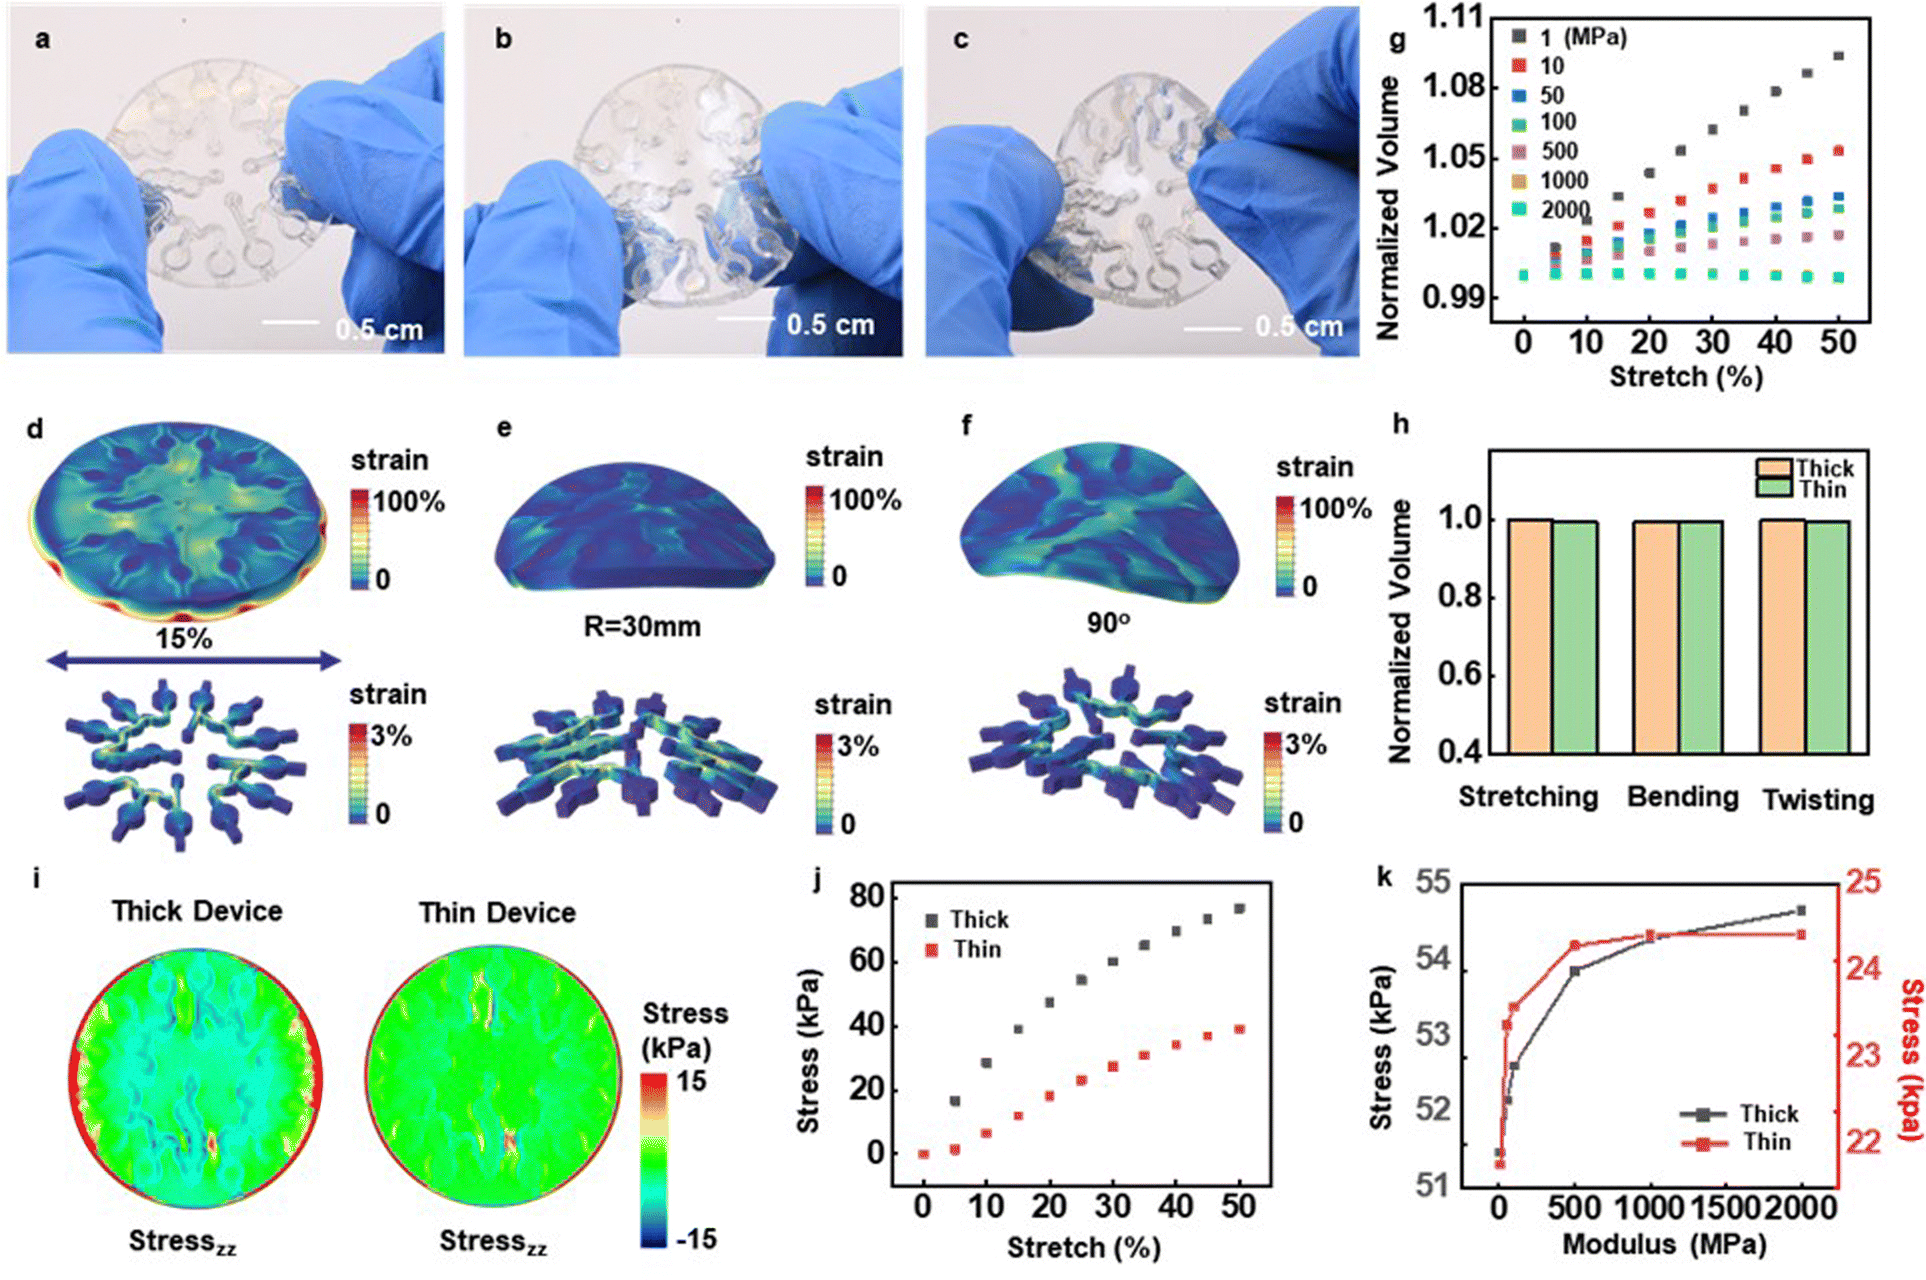 | ||
| Fig. 3 Mechanical simulation of the 3D-printed MA–MA sweat microcuvette system via FEA analysis. (a)–(f) Photographs (a)–(c) and FEA results (d)–(f) for a thick device (1 mm) made of MA–MA under stretching (30%), bending (radius: 30 mm) and twisting (90°). (g) Change in volume of a microfluidic structure formed using materials with various young's modulus as a function of uniaxial stretching. (h) Volume changes due to different deformations. (i) FEA results of interfacial stresses on the skin underneath a thick and thin device for the case of 25% uniaxial stretching of the skin. (j) Maximum interfacial stresses on the skin as a function to uniaxial stretching for the thin (depth: 200 μm) and thick (depth: 1 mm) layout. (k) Maximum interfacial stresses on the skin as a function to the modulus of the microfluidic structure in the thin (microcuvette depth: 200 μm) and thick (microcuvette depth: 1 mm) layout. | ||
Fig. S14a (ESI†) shows the details and key dimensions, including widths of the channel walls and the thickness of the encapsulation used in the FEA analysis. The results correspond to a device that includes a disk-shaped encapsulation structure that has a diameter of 33 mm and a thickness of 400 μm, stretched by 30%, bent to a radius of 30 mm, and twisted by 90° across the opposite edges. For 30% stretching of the skin, the skeleton structure experiences an effective stretch of ∼15%. Strong adhesion to the bottom adhesive prevents leakage under these and related conditions (Fig. S15, ESI†). Photographs of a device with 200 μm microcuvette thicknesses under various deformations are in Fig. S14b–d (ESI†). The strains appear mostly in the soft encapsulation material. Increasing the Young's modulus of the skeleton material decreases the change in optical path length during mechanical manipulation (Fig. 3g and Fig. S14e, ESI†). Specifically, under stretching to strains of 30%, the volume change in the fluid microcuvettes decreases from approximately 7% in a device made only of PDMS compared to less than 0.5% for a corresponding device that uses a skeletal structure of MA–MA. Skeletal structures formed with the other materials show even further reduced changes.
The mechanical responses at the skin interface must be considered as well, as these attributes determine user comfort. The contours of the interfacial stresses on the skin evaluated by FEA appear in Fig. 3i and Fig. S14g (ESI†). The maximum interfacial stresses on the skin occur at the edges, where they reach the threshold for skin sensation (20 kPa) at a stretch of 8%. Thin devices enhance the ability to mount on body locations that involve strong curvature and/or large natural deformations because in such cases, the threshold is exceeded only for a stretch larger than 24%. The interfacial stresses averaged over the bottom surface of the thick and thin devices for stretching of the skin by 30% are 19 and 14 kPa, respectively (Fig. 3j). Decreasing the Young's modulus of the skeleton lead to corresponding decreases in the maximum interfacial stresses, as shown in Fig. 3k. Also of note is that the maximum interfacial stresses within the device occur at the interfaces between the skeletal structures and the surrounding encapsulation. The magnitude of the stresses for thin devices are approximately 2.25 times lower than those for thick devices.
Quantitative analysis of copper, chloride, pH, and glucose in sweat
Quantitative colorimetric measurements involve passage of light through the microcuvette regions after filling with sweat and chemical reaction with colorimetric assays placed at these locations. The spectral absorbance of the products of these reactions correlates quantitatively to the concentration of the analyte. Fluorometric analysis relies on an optical measurement of fluorescence intensities excited by products of reactions with fluorometric assays. In both cases, use of the microcuvettes avoids the need to remove sweat from the device structure prior to analysis.Traditional colorimetric analysis gives simple, intuitive results for concentrations of biomarkers, but often suffers from uncertainties that arise from variabilities in the external lighting conditions, such as light intensity or color temperature. The microcuvette system introduced here is attractive in part because it eliminates the effects of such variabilities. Compared to previously reported strategies based on color intensity extraction from digital images, this spectrophotometric approach improves the linearity, lowers the detection limit, and increases the resolution (Table S3–S5, ESI†).
These features are especially beneficial in detecting analytes that have low concentrations in sweat. Copper, as an example, is of interest due to its relationship to Alzheimer's disease and other forms of neurodegeneration.35 A normal physiological concentration of copper in human sweat is 1.4 ± 0.5 ppm.36 A colorimetric assay for copper relies on the reaction of cuprizone and copper ions in a basic environment (pH ∼8.5). The copper cuprizone complex that results from this reaction presents a blue color with an absorbance peak at ∼600 nm. Fig. 4a and b show the spectra and peak absorbance values measured across concentrations from 0.25 to 3 ppm. The data indicate that the peak absorbance correlates linearly with copper concentration with a Pearson's r of 0.998. The lower detection limit and the resolution are both ∼0.25 ppm. Corresponding limits based on color analysis of digital images are in the range of ∼2.5 ppm under typical conditions (Fig. S16a, ESI†). Experiments show that the absorption properties are unchanged over a range of reaction temperatures relevant to the envisioned application (20–40 °C), with reaction timescales between 5 to 10 minutes (Fig. S16b–d, ESI†). Studies of the dependence of the reaction on pH (from 4 to 9) indicate that the color change is the most pronounced at pH 8.5 (Fig. S16e, ESI†). A HEPES(4-(2-hydroxyethyl)-1-piperazineethanesulfonic acid) buffer added to the assay ensures that the reactions occur at a pH of 8.5. Since the Cu assay depends on pH, a HEPES buffer (buffer capacity, β ∼0.054) maintains the microcuvette pH to a value of 8.5. Measurements indicate that introduction of artificial sweat with a pH of 4.5 in a microcuvette that contains HEPES, leads to a pH of 8.5 (Fig. S16f, ESI†).
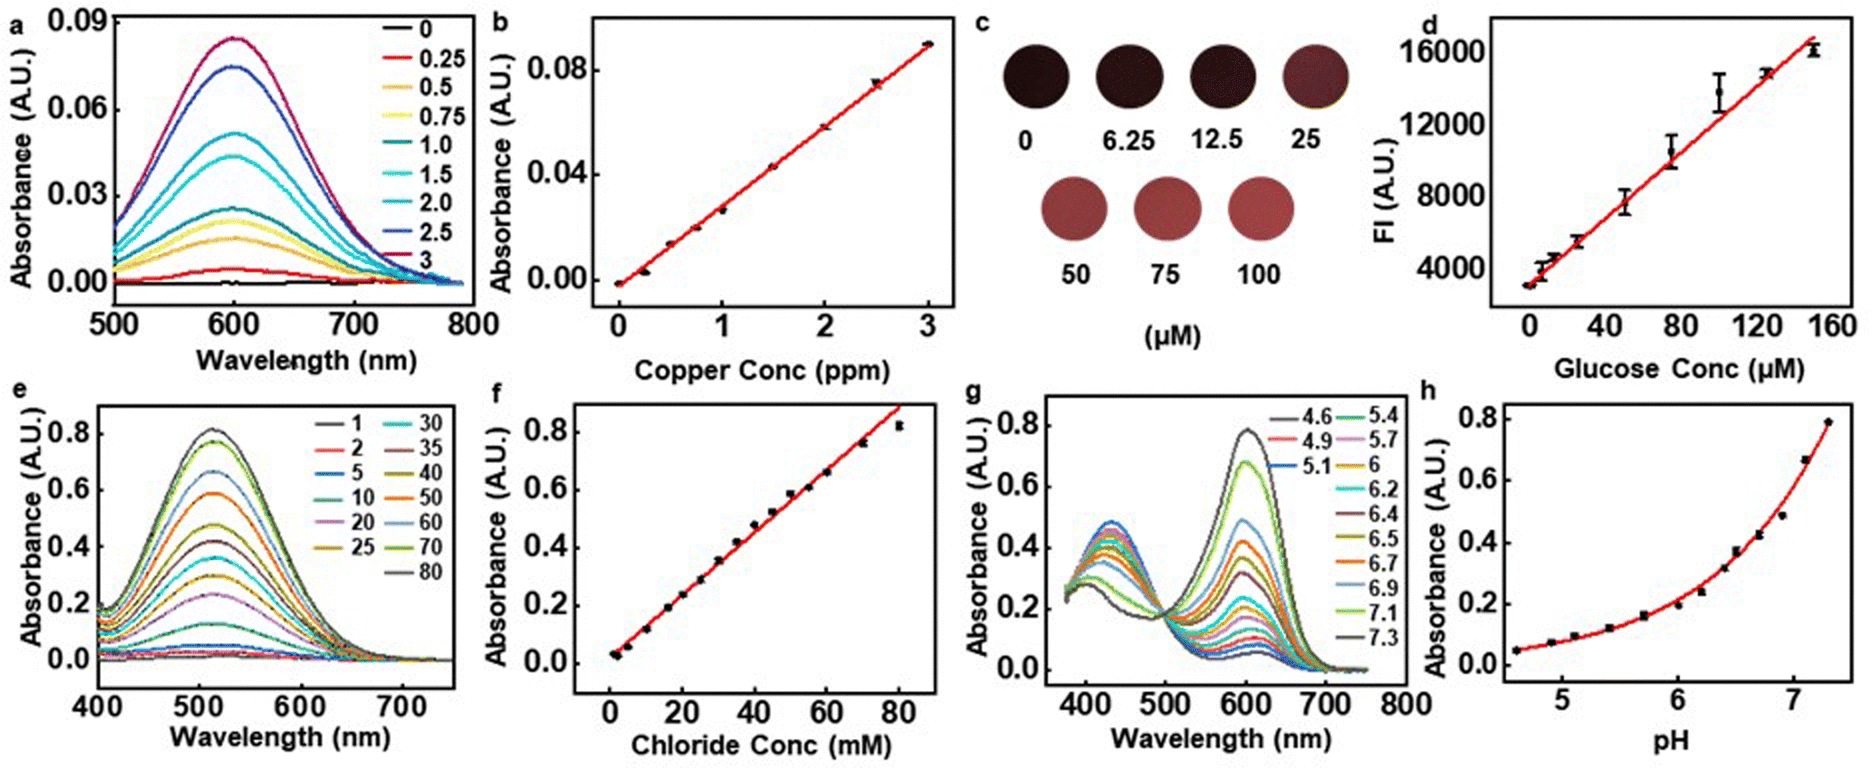 | ||
| Fig. 4 Quantitative analysis of copper, glucose, chloride, and pH by spectrophotometry and fluorometric. (a) and (b) Quantitative spectrophotometric colorimetric copper assay. Spectra (a) and peak absorbance values (600 nm) (b) determined using assays in microcuvettes (depth: 1 mm) filled with aqueous solutions with different concentrations of copper. (c) and (d) Quantitative fluorophotometric analysis of glucose in aqueous solutions. Fluorescent images (c) and associated fluorescent intensity (d) determined using assays in microcuvettes (depth: 1 mm) filled with aqueous solutions with different concentrations of glucose (excitation: 558 nm, emission: 583 nm). (e) and (f) Quantitative spectrophotometric of the concentration of chloride in aqueous solutions. Spectra (e) and peak absorbance values (510 nm) (f) determined using assays in microcuvettes (depth: 1 mm) filled with solutions with different concentrations of chloride. (g) and (h) Quantitative spectrophotometric analysis of pH in aqueous solutions. Spectra (g) and peak absorbance values (550 nm) (h) determined using assays in microcuvettes (depth: 1 mm) filled with different ph buffer solutions. | ||
Another example is in measurements of sweat glucose, known to correlate loosely with blood glucose, with some potential for screening for hyper or hypoglycemic conditions.4 The assay used here exploits glucose oxidase to oxidize glucose into gluconic acid and hydrogen peroxide. The hydrogen peroxide then reacts with a fluorometric probe catalyzed by horseradish peroxidase (HRP), to produce a resorufin fluorophore (excitation: 530–570 nm, emission: 590–600 nm). Across the physiological range of glucose in sweat (6.25–160 μM), the fluorescence intensity (FI) of this assay correlates linearly with concentration with a Pearson's r of 0.99811 (Fig. 4c and d). With a visible color change, this assay can also be used simultaneously for colorimetric glucose sensing. Simple color intensity analysis of digital images of this assay fail, however, to determine glucose concentrations lower than 10 μM (Fig. S17a and b). Compared to previously reported results13 (Table S3, ESI†), the approach reported here improves the detection resolution by nearly two and a half times. Additional experiments show that temperature (20–40 °C) affects the overall reaction timescales (80–100 min), but with consistent final values (Fig. S17c). Variations in pH (pH 5–7), however, affect the stabilization of the fluorometric probe and glucose oxidase, leading to pH dependent fluorescence intensities (Fig. S17d, ESI†). Glucose assay buffers (β ∼0.065) pre-loaded in the microcuvette ensure that the pH remains at 7.5, independent of the pH of the sweat (Fig. S17e, ESI†).
Another important biomarker is sweat chloride, used as a standard for diagnosing cystic fibrosis (CF)2 in clinical practice. The chloride assay presented here uses silver chloranilate immobilized in polyhydroxyethyl methacrylate (pHEMA). Silver chloranilate reacts with chloride ions to generate a purple-colored conjugate with peak absorbance at ∼510 nm.13Fig. 4e and f shows absorbance spectra at different chloride concentrations. The peak absorbance at 510 nm correlates linearly with chloride concentration with a Pearson's r of 0.996. Detection of the chloride concentration reaches a limit of 1 mM and a resolution of 1 mM, roughly a 5–10 times improvement over previous studies based on digital image analysis13 (Table S5, ESI†).
Sweat pH can serve as an indicator of overall hydration status, and this value can also enhance the accuracy of interpreting the responses of assays that depend on pH. The pH indicator presented here involves a mixture of bromocresol purple, bromocresol green and bromothymol blue. These weak acids react with water to form a conjugate base that provides the colorimetric response indicator. Results shows that sweat microcuvette with a mixture of these acids demonstrates pH detection limit of 4.6 and resolution of 0.2 which are comparable to the previous works of 0.513 (Table S4, ESI†) within physiological range of sweat pH from 4.5 to 7.5 (Fig. 4g and h). Additional experiments define the dependence of the assay on temperature and its kinetics. Results from the pH assay across a broad range of temperatures, from 20–40 °C indicates a minimal effect of temperature, in terms of both final color and kinetics. The reaction timescale is ∼3 min, largely independent of temperature over this range (Fig. S18, ESI†).
The colorimetric analysis gives simple, intuitive results of biomarkers, however, it often suffers from uncertainties from the external lighting conditions such as light intensity or color temperature. Under controlled lighting conditions with color references, uncertainties for the colorimetric assays are ∼2 mM for chloride, ∼7 mM for glucose, and 0.1 for pH. As shown in Table S3–S5 (ESI†), use of the microcuvette enables the lowest detection limit with best linearity compared to previously reported colorimetric approaches.
Human trials
Demonstration studies focus on determining the concentrations of copper, chloride and glucose in sweat and the pH of sweat, in collection scenarios that include resting in a sauna and exercising on a stationary bike, both for 30 minutes, across three healthy adult subjects (Subject 1: female, 26 years old. Subject 2: female, 39 years old. Subject 3: male, 48 years old.). As illustrated in Fig. 5a, the devices mount on the back after cleaning the skin with alcohol pads. Removing the devices after sweating and then analyzing the sweat through spectrophotometry yields information on the concentrations of the targeted analytes. Comparisons rely on sweat collected manually at an adjacent location, for analysis by inductively coupled plasma mass spectrometry (ICP-MS), fluorescent spectrophotometry, and pH metrology. As shown in Fig. 5b–e, the copper, chloride and glucose concentrations and the pH values obtained using the devices show good correlation with these standard measurements (n = 5 for Cl, n = 6 for Cu and pH, n = 7 for glucose). The concentrations for sauna and exercise induced sweat appear in Fig. S19 (ESI†). The results suggest that copper, glucose and pH are the same for these two scenarios, while the chloride concentration is slightly higher for exercise compared to sauna induced sweat.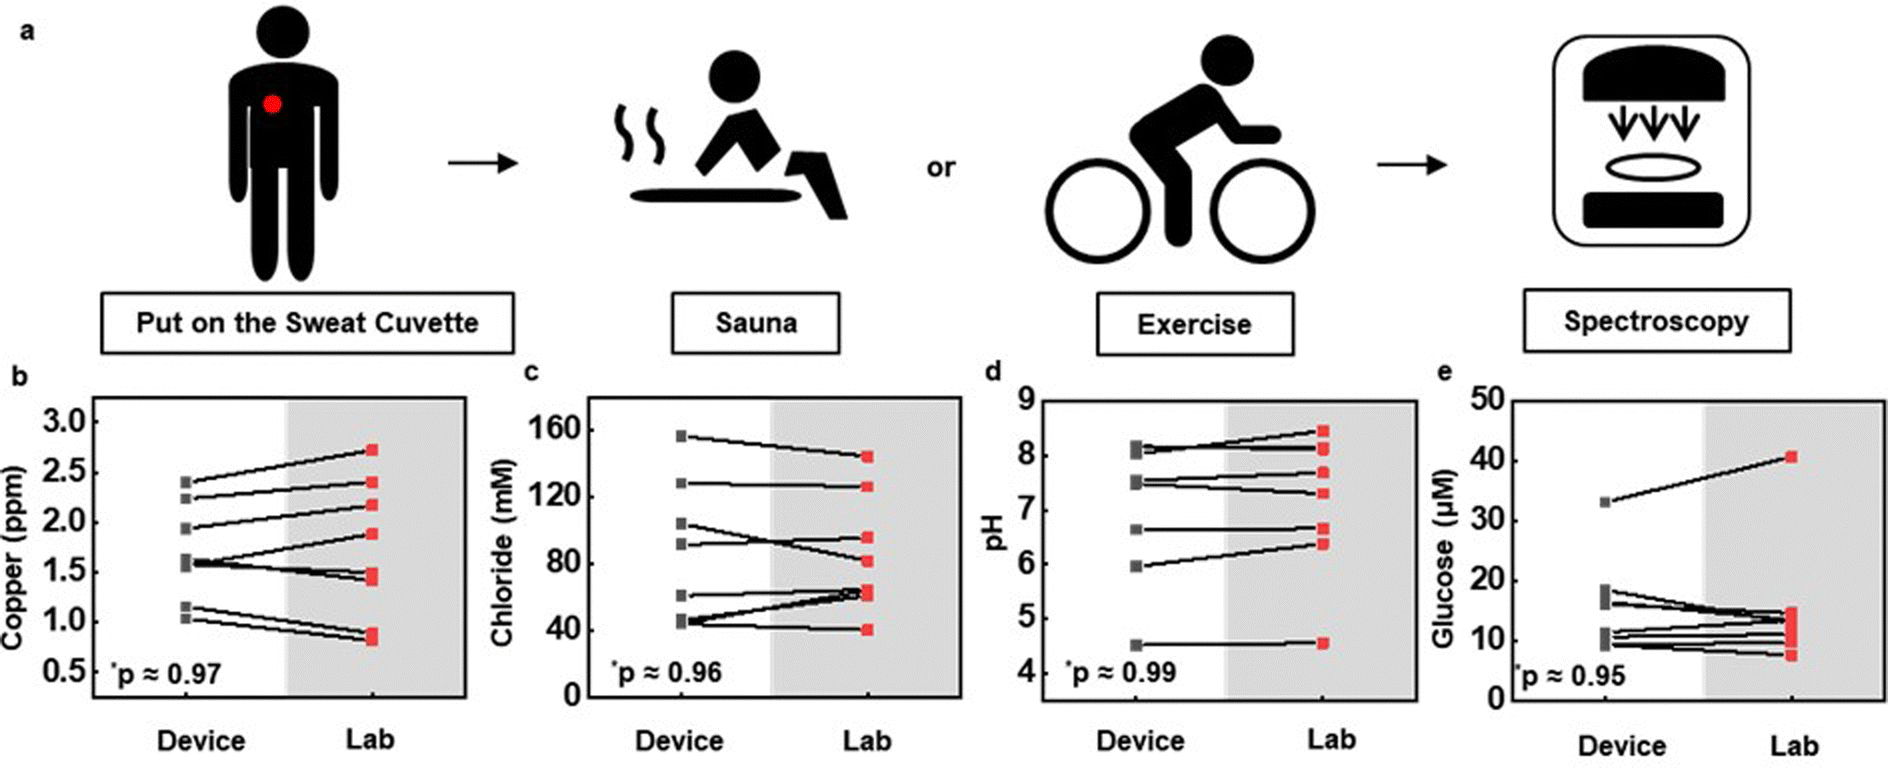 | ||
| Fig. 5 Human trials. (a) Schematic illustration of the approach to collect sweat into skin-mounted microfluidic devices during sauna or exercise and to perform spectroscopic analysis. (b)–(e) Comparison between biomarkers (copper, chloride, pH, glucose) concentrations measured using integrated micro cuvette and using conventional laboratory-based analysis of sweat collected using a pipette (n = 5 for Cl, n = 6 for Cu and pH, n = 7 for glucose). Data points with the same color are from the same trial. *p < 0.5, two-tailed test. | ||
Conclusions
This study introduces a class of sweat microfluidic device that exploits 3D-printed microfluidic constructs with integrated microcuvettes, embedded in a soft elastomeric matrix. Hard, non-deformable 3D-printed microcuvettes enable accurate optical sensing capabilities, where the soft silicone encapsulation layer provides skin-interfaced, water-tight mechanics. This hybrid system provides stable operation with skin-compatible mechanics, designed to enable removal and insertion into spectrophotometry instruments for colorimetric and fluorometric assays. 3D-printing offers an attractive means for fabrication, with materials and with feature sizes that support the demanding requirements associated with this application. Studies of 3D-printed microcuvettes with different resins reveal their capabilities for accurate optical sensing; among the four different resins tested here, the MA–MA polymer shows the best combination of mechanical, material, and optical properties for colorimetric/fluorometric sensing. Examples of colorimetric and fluorometric chemical and enzymatic assays include those for evaluating copper, chloride, pH and glucose in sweat. Human trials with healthy subjects validate the capabilities of the technology against standard collection schemes and laboratory methods. Studies of the concentration of analytes in sweat induced by physical exercise and exposure to a sauna provide insights into the practical operation of these systems.Experimental details
Device fabrication
The skeletons were designed in AutoCAD and converted into STL files. After importing the STL files in the PreForm software (Formlabs), mechanical support structures were manually added to the outside of the microcuvettes to avoid any residue that might affect their optical properties. The software sliced and coded the file into g-code before uploading it into the printer. The minimum sliced layer thickness varied with the type of resin (MA–MA: 0.025 mm, MA-UDMA & b-MA-UDMA: 0.05 mm, Acrylate-IBA: 0.1 mm). Smaller layer thicknesses yielded higher resolution along the z axis. Molds for skeletal structures consisted of Acrylate-IBA resin to facilitate demold. A Form3B printer (Formlabs) defined both the skeletal structures and the molds via exposure using a UV laser. After 3D printing, all printed parts were sonicated in isopropyl alcohol for 6 min, dried in a hood for 1 h, and post-cured in Formlabs UV cure for 15 min at room temperature.Coatings of parylene-C (thickness: 2 μm, Specialty Coating Systems) formed on skeletal structures of Acrylate-IBA and MA-UDMA facilitated curing of to define the encapsulating matrix.37 An alternative involved heating at 80 °C for 8 h, after curing38 for between one to three times. No surface treatments were required for MA–MA and b-MA-UDMA resins.
The molding process used a UV curable optical adhesive (NOA63, Norland Products Inc., NJ, USA) cast on the 3D-printed mold. After curing in a UV flood exposure system (Inpro Technologies F300S, INPRO Technologies, Inc., MD, USA) for 2 min, the part was demolded and profiled by an ultraviolet laser system (ProtoLaser U4, LPKF, Germany) to remove the access materials.
Assays were immobilized on the surfaces of the microcuvettes. Bonding of double-sided adhesives (90880, Adhesive Research, Inc., PA, USA) cut into appropriate shapes using a CO2 laser sealed the top sides of the microfluidic structures. Encapsulation in PDMS (elastomer/curing agent ratio, 15:1; Sylgard 184, Dow Corning) completed the fabrication.
Copper, pH, and chloride sensors were stored at room temperature prior to use. These assays were stable at room temperature for at least up to 3 months. The glucose assay was stored in the freezer since the fluorometric probe is light-sensitive. After loading all sensing assays, the devices were stored in an amber vacuum desiccator to minimize exposure to light and humidity prior to use. The devices were used within a week after preparation.
Colorimetric and fluorometric assay preparation
pH buffer solution preparation
Adding 14.2 g Na2HPO4 powder into 500 mL DI water and shaking thoroughly prepared the 0.2 M Na2HPO4 solution. Adding 4.803 g citrate powder into 250 mL DI water and shaking thoroughly prepared the 0.1 M citrate solution. Adding 2.33 mL, 2.48 mL, 2.57 mL, 2.67 mL, 2.9 mL, 3.03 mL, 3.21 mL, 3.31 mL, 3.64 mL, 4.09 mL and 4.36 mL 0.2 M Na2HPO4 into each vial separately and adding 2.67 mL, 2.52 mL, 2.43 mL, 2.33 mL, 2.1 mL, 1.97 mL, 1.79 mL, 1.69 mL, 1.36 mL, 0.91 mL and 0.65 mL into the previous vials yield a total of 5 mL solution for each vial. Mixing thoroughly completed the preparation of the buffer solutions. Measurements of pH were performed using a PH60S Spear pH Tester (Apera Instruments, OH, USA).Buffer capacity tests
The buffer capacity was calculated using β = Δn/ΔpH, where Δn is the amount of acid added to the buffer, and ΔpH is the pH change in the buffer after adding acid solution. To evaluate the buffer capacity, 0.1 M citric acid was added to the 250 μL buffer solution, and the change in pH was measured with a digital pH meter. To investigate the pH in the microcuvette, a 100 μL volume of pH buffer was mixed with 100 μL of artificial sweat (Pickering Laboratories, CA, USA) at a pH 4.5. Changes in pH were then measured with a pH meter.Spectroscopic measurements, fluorescent imaging, and colorimetric analysis
The absorbance of the samples was determined by ultraviolet-visible-near infrared spectroscopy (PerkinElmer LAMBDA 1050, MA, USA). The fluorescence intensities were measured using a fluorescent imager (Sapphire Biomolecular Imager, Azure Biosystems, CA, USA). For colorimetric analysis, the samples were placed inside of a lightbox, and images were captured with a digital SLR camera (Canon EOS 6D; Canon, Tokyo, Japan). Red, green, blue color intensities were evaluated with ImageJ software. The region of interest (ROI) was selected at the center of each microcuvette to avoid any effects of shadowing. An X-rite color checker (X-rite, MI, USA) served as the reference for color intensities.Human trials
Testing involved healthy adults as volunteers during normal physical activity. The on-body sweat test protocol was approved by the Institutional Review Board (IRB) of Northwestern University (STU00214004). All subjects provided their consent prior to participation. Before sweat collection, the devices were applied to the alcohol-cleaned surface of the skin and pressed tightly to ensure strong adhesion. Each volunteer engaged in 30 min of exposure to the sauna environment and 30 min of cycling. After sauna or exercise, the devices were removed from the skin and analyzed by with either a visible spectrometer or a fluorescent imager. The sweat for laboratory analysis was collected with a pipette from regions of the skin adjacent to the devices. Each sweat sample was centrifuged and filtered before analysis.Conflicts of interest
JAR is a co-founder of a company (Epicore Biosystems) that is commercializing microfluidic devices for sweat analysis.Acknowledgements
This work was supported by the Querrey-Simpson Institute for Bioelectronics at Northwestern University. This work made use of the NUFAB facility of Northwestern University’s NUANCE Center, which has received support from the SHyNE Resource (NSF ECCS-2025633), the IIN, and Northwestern’s MRSEC program (NSF DMR-1720139), and the Keck Biophysics Facility's Sapphire Imager, which had received support from the NIH S10 OD026963 Grant. D. Yang acknowledges additional support by the National Research Foundation of Korea Grant funded by the Korean Government(NRF-2019R1A6A3A03032516).References
- M. Bariya, H. Y. Y. Nyein and A. Javey, Wearable sweat sensors, Nat. Electron., 2018, 1, 160–171 CrossRef.
- L. E. Gibson and R. E. Cooke, A test for concentration of electrolytes in sweat in cystic fibrosis of the pancreas utilizing pilocarpine by iontophoresis, Pediatrics, 1959, 23, 545 CrossRef CAS PubMed.
- S. Wang, G. Zhang, H. Meng and L. Li, Effect of Exercise-induced Sweating on facial sebum, stratum corneum hydration, and skin surface pH in normal population, Ski. Res. Technol., 2013, 19, e312–e317 CrossRef PubMed.
- J. Moyer, D. Wilson, I. Finkelshtein, B. Wong and R. Potts, Correlation between sweat glucose and blood glucose in subjects with diabetes, Diabetes Technol. Ther., 2012, 14, 398–402 CrossRef CAS PubMed.
- L. Yu, et al., Copper Deficiency in Liver Diseases: A Case Series and Pathophysiological Considerations, Hepatol. Commun., 2019, 3, 1159–1165 CrossRef CAS PubMed.
- S. Coyle, et al., BIOTEXBiosensing textiles for personalised healthcare management, IEEE Trans. Inf. Technol. Biomed., 2010, 14, 364–370 Search PubMed.
- M. McCaul, T. Glennon and D. Diamond, Challenges and opportunities in wearable technology for biochemical analysis in sweat, Curr. Opin. Electrochem., 2017, 3, 46–50 CrossRef CAS.
- H. Lee, et al., Wearable/disposable sweat-based glucose monitoring device with multistage transdermal drug delivery module, Sci. Adv., 2017, 3, e1601314 CrossRef PubMed.
- H. Y. Y. Nyein, et al., A Wearable Electrochemical Platform for Noninvasive Simultaneous Monitoring of Ca2+ and pH, ACS Nano, 2016, 10, 7216–7224 CrossRef CAS PubMed.
- W. Gao, et al., Wearable Microsensor Array for Multiplexed Heavy Metal Monitoring of Body Fluids, ACS Sens., 2016, 1, 866–874 CrossRef CAS.
- W. Jia, et al., Electrochemical tattoo biosensors for real-time noninvasive lactate monitoring in human perspiration, Anal. Chem., 2013, 85, 6553–6560 CrossRef PubMed.
- Y. Zhang, et al., Passive sweat collection and colorimetric analysis of biomarkers relevant to kidney disorders using a soft microfluidic system, Lab Chip, 2019, 19, 1545–1555 RSC.
- J. Choi, et al., Soft, skin-integrated multifunctional microfluidic systems for accurate colorimetric analysis of sweat biomarkers and temperature, ACS Sens., 2019, 4, 379–388 CrossRef CAS PubMed.
- C.-H. Wu, et al., Skin-interfaced microfluidic systems with spatially engineered 3D fluidics for sweat capture and analysis, Sci. Adv., 2023, 9, eadg4272 CrossRef CAS PubMed.
- K. Kwon, et al., An on-skin platform for wireless monitoring of flow rate, cumulative loss and temperature of sweat in real time, Nat. Electron., 2021, 4, 302–312 CrossRef.
- A. Koh, et al., A soft, wearable microfluidic device for the capture, storage, and colorimetric sensing of sweat, Sci. Transl. Med., 2016, 8, 366ra165 Search PubMed.
- Y. Sekine, et al., A fluorometric skin-interfaced microfluidic device and smartphone imaging module for in situ quantitative analysis of sweat chemistry, Lab Chip, 2018, 18, 2178–2186 RSC.
- Y. Cui, et al., Ratiometric Fluorescent Nanohybrid for Noninvasive and Visual Monitoring of Sweat Glucose, ACS Sens., 2020, 5, 2096–2105 CrossRef CAS PubMed.
- S. Kim, et al., Soft, skin-interfaced microfluidic systems with integrated immunoassays, fluorometric sensors, and impedance measurement capabilities, Proc. Natl. Acad. Sci. U. S. A., 2020, 117, 27906–27915 CrossRef CAS PubMed.
- S. Ardalan, M. Hosseinifard, M. Vosough and H. Golmohammadi, Towards smart personalized perspiration analysis: An IoT-integrated cellulose-based microfluidic wearable patch for smartphone fluorimetric multi-sensing of sweat biomarkers, Biosens. Bioelectron., 2020, 168, 112450 CrossRef CAS PubMed.
- R. Ghaffari, et al., State of Sweat: Emerging Wearable Systems for Real-Time, Noninvasive Sweat Sensing and Analytics, ACS Sens., 2021, vol. 6, 2787–2801 CrossRef PubMed.
- N. Bhattacharjee, A. Urrios, S. Kang and A. Folch, The upcoming 3D-printing revolution in microfluidics, Lab Chip, 2016, vol. 16, 1720–1742 RSC.
- L. Wei, et al., 3D-printed low-cost fabrication and facile integration of flexible epidermal microfluidics platform, Sens. Actuators, B, 2022, 353, 131085 CrossRef CAS.
- S. Görög, Ultraviolet-visible spectrophotometry in pharmaceutical analysis, Ultraviolet-Visible Spectrophotometry in Pharmaceutical Analysis, CRC Press, 2018, DOI:10.1201/9781351077422.
- W. Mäntele and E. Deniz, UV–VIS absorption spectroscopy: Lambert-Beer reloaded, Spectrochim. Acta, Part A, 2017, 173, 965–968 CrossRef PubMed.
- J. Choi, D. Kang, S. Han, S. B. Kim and J. A. Rogers, Thin, Soft, Skin-Mounted Microfluidic Networks with Capillary Bursting Valves for Chrono-Sampling of Sweat, Adv. Healthcare Mater., 2017, 6, 1601355 CrossRef PubMed.
- S. B. Kim, et al., Soft, skin-interfaced microfluidic systems with integrated enzymatic assays for measuring the concentration of ammonia and ethanol in sweat, Lab Chip, 2019, 20, 84–92 RSC.
- V. A. Shevelev, Study of molecular mobility and interactions in α-methylstyrene-styrene and methylacrylate copolymers using the nmr pulse method, Polym. Sci. USSR, 1975, 17, 460–469 CrossRef.
- J. M. Lagaron, R. Catalá and R. Gavara, Structural characteristics defining high barrier properties in polymeric materials, Mater. Sci. Technol., 2013, 20, 1–7 CrossRef.
- J. Choi, Y. Xue, Y. Xia, T. R. Ray, J. T. Reeder, A. J. Bandodkar, D. Kang, S. Xu, Y. Huang and J. A. Rogers, Soft, skin-mounted microfluidic systems for measuring secretory fluidic pressures generated at the surface of the skin by eccrine sweat glands, Lab Chip, 2017, 17, 2572–2580 RSC.
- N. Bhattacharjee, C. Parra-Cabrera, Y. T. Kim, A. P. Kuo and A. Folch, Desktop-Stereolithography 3D-Printing of a Poly(dimethylsiloxane)-Based Material with Sylgard-184 Properties, Adv. Mater., 2018, 30, 1800001 CrossRef PubMed.
- C. Sun, N. Fang, D. M. Wu and X. Zhang, Projection micro-stereolithography using digital micro-mirror dynamic mask, Sens. Actuators, A, 2005, 121, 113–120 CrossRef CAS.
- M. W. Toepke and J. B. David, PDMS absorption of small molecules and consequences in microfluidic applications, Lab Chip, 2006, 6, 1484–1486 RSC.
- J. Choi, et al., Skin-Interfaced Microfluidic Systems that Combine Hard and Soft Materials for Demanding Applications in Sweat Capture and Analysis, Adv. Healthcare Mater., 2021, 10, 2000722 CrossRef CAS PubMed.
- G. J. Brewen, The risks of free copper in the body and the development of useful anticopper drugs, Curr. Opin. Clin. Nutr. Metab. Care, 2008, 11, 727–732 CrossRef PubMed.
- M. Schaefer, M. Schellenberg, U. Merle, K. H. Weiss and W. Stremmel, Wilson protein expression, copper excretion and sweat production in sweat glands of Wilson disease patients and controls, BMC Gastroenterol., 2008, 8, 1–9 CrossRef PubMed.
- Brian J. O'Grady, et al., Rapid prototyping of cell culture microdevices using parylene-coated 3D prints, Lab Chip, 2021, 21, 4814–4822 RSC.
- B. Venzac, et al., PDMS Curing Inhibition on 3D-Printed Molds: Why? Also, How to Avoid It?, Anal. Chem., 2021, 93, 7180–7187 CrossRef CAS PubMed.
- V. Jancsik, Z. Beleznai and T. Keleti, Enzyme immobilization by poly(vinyl alcohol) gel entrapment, J. Mol. Catal., 1982, 14, 297–306 CrossRef CAS.
- Q. Yang, et al., Enzyme immobilization in cage-like 3D-network PVA-H and GO modified PVA-H (GO@PVA-H) with stable conformation and high activity, Chem. Eng. J., 2019, 372, 946–955 CrossRef CAS.
Footnotes |
| † Electronic supplementary information (ESI) available. See DOI: https://doi.org/10.1039/d3mh00876b |
| ‡ These authors contributed equally to this work. |
| This journal is © The Royal Society of Chemistry 2023 |