 Open Access Article
Enzyme mimetic electrochemical sensor for salivary nitrite detection using copper chlorophyllin and carbon nanotubes-functionalized screen printed electrodes†
Sriraja Subhasri
Paramasivam
ac,
Siva Ananth
Mariappan
 ac,
Niroj Kumar
Sethy
b and
Pandiaraj
Manickam
 *ac
*ac
aElectrodics and Electrocatalysis Division, CSIR-Central Electrochemical Research Institute (CECRI), Karaikudi 630 003, Tamil Nadu, India. E-mail: pandiaraj@cecri.res.in; Tel: +91-9442771880 Tel: +91-4565-241326
bDefence Institute of Physiology and Allied Sciences (DIPAS), Defence Research and Development Organization (DRDO), Delhi, India
cAcademy of Scientific and Innovative Research (AcSIR), Ghaziabad-201 002, India
First published on 2nd November 2023
Abstract
Electrochemical detection of salivary nitrite (NO2−) is gaining importance in establishing screening protocols for identifying people with oral diseases and other clinical conditions associated with nitric oxide biology. This work demonstrates smart sensing of salivary NO2− levels through a point-of-care (POC) electrochemical approach. The electrochemical sensor was prepared using copper chlorophyllin (CuCP) as an enzyme mimic and electrodeposited onto multi-walled carbon nanotubes (MWCNTs)-functionalized screen-printed carbon electrodes. The morphology and composition of the nanocomposite-modified printed sensors were evaluated using field-emission scanning electron microscopy (FE-SEM) and X-ray photoelectron spectroscopy (XPS). Electrochemical techniques such as cyclic voltammetry and linear sweep voltammetry were used to characterize the electrochemical sensor and measure the nitrite levels. The modified CuCP-MWCNTs-SPCE allowed the electrochemical sensing of nitrite over a wide range of concentrations (10 μM to 10 mM) in standard and human saliva samples. The electrochemical activation of CuCP on MWCNTs enabled the sensitive detection of nitrite. The practical applicability of the enzyme mimic-based sensing platform was tested in real human saliva samples (n = 5) to enable POC measurement. The results of the electrochemical sensors are validated with a commercial Griess reagent test.
1. Introduction
Quantitative detection of nitrite ions is considered an essential factor due to its biological impact on human health. Monitoring salivary nitrite levels would give us an understanding of the nitrate-nitrite-nitric oxide (NO) pathway.1 Nitrite levels in humans can be elevated as a result of nitrosative stress2 and through the L-arginine/NO-synthase cascade.3,4 Excessive levels of nitrite in humans can cause adverse effects, such as methemoglobinemia,5–7 weakness, tachycardia (fast heart rate), fatigue/dizziness, and a risk of thyroid,8,9 kidney, stomach and ovarian cancers.9–12 Measurement of nitrite (NO2−) levels in saliva samples offers a non-invasive approach to assess health conditions in humans. Collection and analysis at the point-of-site measurement makes saliva a crucial biofluid in clinical analysis. Many analytical methods have been employed for nitrite quantification in clinical settings, which includes chromatographic,13,14 spectroscopic,15 electrochemical16–20 and electrophoretic techniques.21 However, the applicability of such techniques for point-of-site salivary NO2− testing is limited due to their complex protocol and large instruments. In clinical laboratories, the optical method involving Griess reagent22 is widely used for measuring the salivary nitrite levels. However, the working range of the method for analysing nitrite is between 0.43 and 65 μM, which is not suitable for individual samples above the working range.Recent advancements in materials technology and additive manufacturing have led to the creation of smart sensing strips for salivary nitrite measurement, which are disposable and inexpensive. For example, Berkeley Life NO Test Strip (https://www.berkeleytest.com)23 is a commercially available disposable strip which monitors the nitrite levels in human saliva samples. Similarly, Bartovation NO2− strips (Bartovation.com, New York, USA), and HumanN NO strips (https://humann.com) are currently available in the market for personalized salivary nitrite measurement. Although providing instant results and convenience to users, these methods provide only qualitative to semi-quantitative information. The accuracy and variability of these strips for frequent nitrite monitoring are also challenging. Portable sensors involving electrochemical approaches are advantageous over the above listed methods because of their quantitative measurements, analysis of wide concentration range, low-cost, ease of operation, rapid response and real time analysis.16,24–34
Electrochemical approaches involving enzymes24,35,36 such as nitrite reductase, copper zinc superoxide dismutase, and proteins such as cytochrome c have been explored widely for the quantification of nitrite. Enzymatic approaches for measuring nitrite levels have several advantages such as specificity, good sensitivity and rapid response. However, they also have significant drawbacks including limited pH ranges, temperatures and humidity levels, as well as short-term stability. These drawbacks could lead to non-specific oxidation reactions of nitrite and other contaminants in real samples. In recent years, the development of novel materials mimicking the catalytic reaction of enzymes (artificial enzyme mimics) is being used in the biosensor components to improve the sensitivity and performance of the assay. Chlorophylls are known for their photocatalytic properties and biocompatibility. Chlorophylls are the reaction centres of photosynthesis and have been investigated for applications including photovoltaic devices and electrical energy storage systems. Although the metal chlorophyllin systems have been used in energy storage systems and photovoltaic applications, the focus of these biocompatible materials towards electrochemical sensing has received little attention. Thus, we have attempted to develop a portable point-of-care (POC) electrochemical sensor system for salivary nitrite utilizing copper chlorophyllin (CuCP) as an enzyme mimic. The CuCP molecules were electrodeposited onto a multi-walled carbon nanotube (MWCNTs) functionalized screen-printed carbon electrode (SPCE). MWCNTs also have numerous advantages such as biocompatibility, environmental friendliness, low toxicity, and good conductivity. CNTs have a hollow structure and large specific surface area making them suitable for electrochemical sensors providing high catalytic activity and rapid electron transfer kinetics.37,38 The metal complex has a catalytic effect on the electrochemical redox process with reducing overvoltage and improved current response. The combination of CuCP with MWCNTs improved the unique performance of the sensor by accelerating the electron transfer between nitrite and the electrode surface. The metal porphyrin has an extended π-bonding system, which facilitates electron transfer and faster redox processes.39,40 In this paper, the electro-oxidation of nitrite is preferred over electro-reduction because of the possible reduction of nitrate and molecular oxygen, which could make the measurement of nitrite ions more complex.41
2. Experimental
2.1. Reagents
Sodium nitrite (NaNO2) and sodium copper chlorophyllin, potassium chloride (KCl), sodium hydroxide (NaOH), and hydrocortisone (cortisol) were purchased from TCI chemicals. Griess reagent, dimethylformamide (DMF), multi-walled carbon nanotubes (MWCNTs), potassium ferricyanide K3[Fe(CN)6], ascorbic acid, phosphate buffer saline (PBS) of pH 7.4, and artificial saliva were purchased from Sigma-Aldrich, anhydrous D-(+)-glucose was purchased from Himedia, and cholesterol was purchased from SRL chemicals. All aqueous solutions in this experiment were prepared in deionized (DI) water. Cortisol solution was prepared in ethanol. Cholesterol solution was prepared by adding ethanol and sonicated for 3 min.2.2. Instrumentation
The electrochemical measurements, using cyclic voltammetry (CV), linear sweep voltammetry (LSV), were performed at room temperature on an Emstat3 blue, Sensit Smart electrochemical workstation (PalmSens BV, Netherland). The electrochemical sensing platform used for nitrite sensing is comprised of screen-printed carbon electrodes (SPCEs) prepared on flexible substrates purchased from Zensor R & D and PalmSens. The working and counter electrodes were made up of carbon and the reference electrodes were configured using Ag/AgCl paste. The Griess method was carried out using an absorbance instrument, Biotex PowerWaveX in built with KC junior software. Centrifugation of the saliva samples was carried out using a Sorvall SR 8R from Thermo Fisher Scientific. The field emission scanning electron microscope (FE-SEM) images were recorded using a Supra 55VP from Carl Zeiss. The X-ray photoelectron spectroscopy (XPS) data were collected using a Multilab2000 from Thermo Scientific.2.3. Modification of the SPCE with MWCNTs-CuCP nanocomposites
The SPCE was pre-treated prior to any modification in the working area of the electrode to remove unwanted organic linkers and contaminants as well as to improve the surface functionality of the carbon working electrode. The SPCE is pre-treated electrochemically using the CV technique by dipping the electrode in 0.01 M PBS (pH 7.4) and cycling the potential in the range of −0.6 V to +1.6 V (vs. Ag/AgCl) for 10 complete cycles at a scan rate of 10 mV s−1. After pre-treatment, 1 μL of MWCNTs (1 mg of MWCNTs dispersed in 10 mL of DMF; and sonicated for 2 min) was drop cast on the working electrode surface of the SPCE and heat dried for 3 min. MWCNTs were used to improve the conductivity as well as for the entrapment of CuCP. Direct electrochemical deposition of metallo-chlorophyll derivatives on the bare electrode surface is not stable due to its solubility in water and poor stability on the electrode surface. Therefore, an insoluble catalyst was preferred to keep the CuCP on the electrode surface for an extended period of time while carrying out electrochemical measurements. CV was used for the electrochemical deposition of CuCP on the MWCNTs modified SPCE by drop casting 50 μL of deposition mixture composed of 0.2 M CuCP prepared in water, 0.2 M NaOH, and 0.2 M KCl solution. The CV scans were cycled in the voltage ranges between −1 and +1.2 V (vs. Ag/AgCl) for 30 complete cycles at a scan rate of 50 mV s−1. The CuCP deposited SPCEs were then gently washed with 0.01 M PBS. An electrochemical activation process is then performed on the CuCP-modified electrode to remove any unbound CuCP molecules and to improve the electrocatalytic activity of the CuCP-modified electrodes. The electrochemical activation process of the CuCP-modified electrode involves CV scans with the potential ranging from −1 V to +1.2 V (vs. Ag/AgCl) for 20 cycles at a scan rate of 50 mV s−1 in 0.01 M PBS (pH 7.4). The activated CuCP modified electrode is then used for the electrochemical detection of nitrite in both laboratory standards and saliva samples. The stepwise fabrication of the CuCP modified electrode is illustrated in Scheme 1.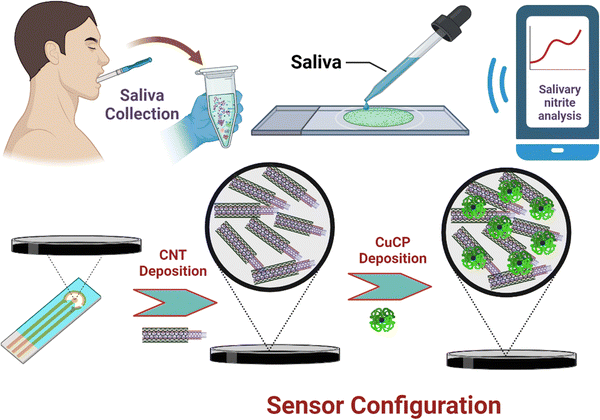 | ||
| Scheme 1 Schematic representation of a smartphone integrated POC sensor for salivary nitrite measurement. | ||
2.4. Saliva sample collection
Saliva samples are collected in two different approaches. The first method is a direct method, which involves the collection of saliva, which is excreted from the mouth's floor directly into a 5 mL sterile sample collection tube at room temperature. The collected samples were then transferred into a centrifuge tube and centrifuged at 5000 rpm at 4 °C for 5 min. The supernatant solution collected was used for the analysis and the samples were stored at −20 °C when not in use. In the second method, saliva collection tubes containing a cotton roll were used for collecting the saliva samples. The cotton roll is placed under the floor of the mouth where sublingual glands are located for about 2 min. The cotton roll is then removed at the end of the collection period and centrifuged at 2000 rpm at 4 °C for 2 min. The volunteers were asked to gargle with water before the sample collection to reduce interference.2.5. Griess method
Using Griess reagent, optical studies were carried out, which are used for validating the results of the electrochemical sensor for monitoring nitrite in human saliva samples. The Griess reagent for analysis is freshly prepared by dissolving 0.6 g of the reagent in 15 mL PBS buffer (pH 7.4) and mixed with human saliva samples (1![[thin space (1/6-em)]](https://www.rsc.org/images/entities/char_2009.gif) :
:![[thin space (1/6-em)]](https://www.rsc.org/images/entities/char_2009.gif) 1 v/v). The samples were incubated for 15 min at room temperature. The final mixture is analyzed using spectrophotometry and the resultant absorbance is measured at 540 nm. The Griess method is also performed on standard nitrite solutions with concentrations ranging from 5–300 μM to create the calibration curve.
1 v/v). The samples were incubated for 15 min at room temperature. The final mixture is analyzed using spectrophotometry and the resultant absorbance is measured at 540 nm. The Griess method is also performed on standard nitrite solutions with concentrations ranging from 5–300 μM to create the calibration curve.
3. Results and discussion
3.1. Morphological characterization using FE-SEM analysis
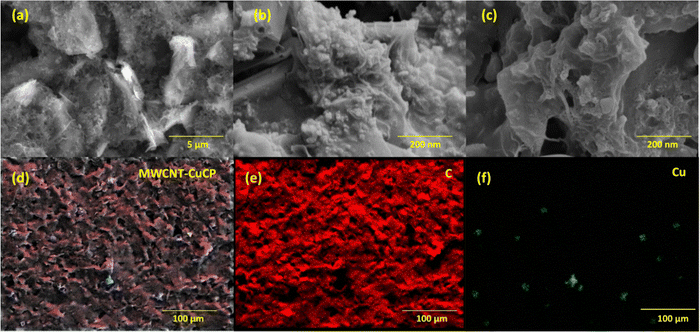
Surface features of the CuCP-MWCNTs modified electrodes were investigated and imaged using the FE-SEM technique (Fig. 1). The bare SPCE after pretreatment exhibits a rough and porous surface architecture (Fig. 1a), which facilitated the attachment of MWCNTs (Fig. 1b). Electrodeposition of CuCP led to the formation of CuCP assemblies on the MWCNT network (Fig. 1c). The elemental colour mapping of the CuCP-MWCNTs-modified electrodes was performed to create a map of the elemental composition (Fig. 1d). The FE-SEM images and distribution of carbon (Fig. 1e) and Cu (Fig. 1f) clearly indicate the formation of the CuCP architecture on the MWCNTs-modified SPCE. The non-covalent interaction (π–π interaction) between the MWCNTs and CuCPs allowed the deposition of a stable sensing layer on the surface of the porous SPCEs.3.2. XPS analysis of the CuCP-modified electrodes
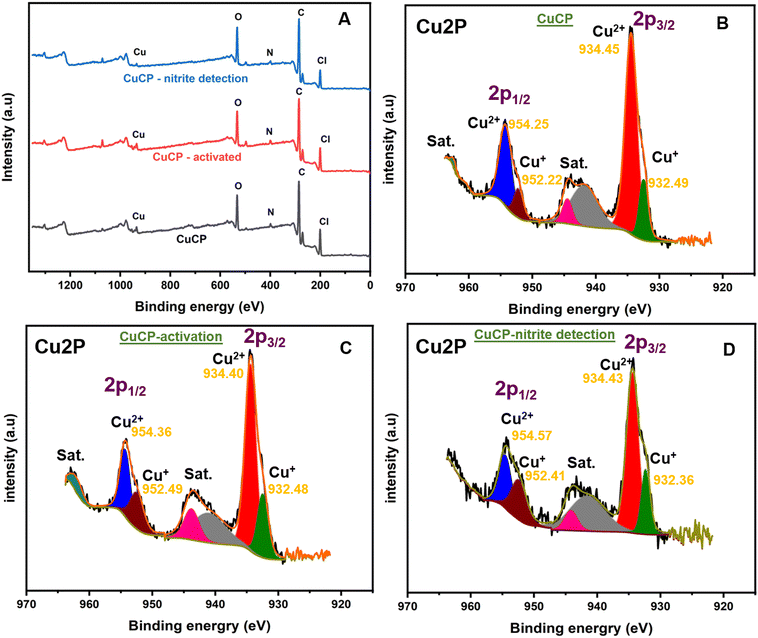
XPS measurements were performed to confirm the elemental composition and oxidation states of copper in the CuCP-modified electrodes. The survey scan spectrum of the CuCP-modified electrode confirmed the presence of elements such as Cu, O, N and Cl (Fig. 2A). High resolution XPS spectra of the Cu 2p core levels of CuCP were recorded to investigate the oxidation states of Cu in the CuCP-modified electrodes (Fig. 2B). The high-resolution Cu 2p core level spectra showed two spin–orbit split peaks corresponding to the 2p1/2 and 2p3/2 electron states, as well as satellite peaks. The deconvoluted XPS spectra of the 2p1/2 electronic state showed peaks at binding energy values of 954.25 and 952.22 eV, confirming the existence of Cu in both Cu+ and Cu2+ environments in the CuCP-modified electrode.42,43 Similarly, the deconvoluted XPS spectra of the 2p3/2 electronic state exhibited peaks at 934.45 and 932.49 eV, further confirming the presence of Cu in both Cu+ and Cu2+ environments. The electrochemical activation of the CuCP modified electrode leads to an alteration in the ratio of the Cu+ and Cu2+ environments in the CuCP-modified electrodes as evidenced from XPS (Fig. 2B and C). However, there are no further significant changes in Cu+/Cu2+ ratio observed for the CuCP-modified electrode after the electrocatalytic oxidation of nitrite (Fig. 2D). The relative percentage of Cu2+ and Cu+ environment present in the CuCP-modified electrode was calculated from the peak areas (Q) and by applying the following mathematical expressions (eqn (1)–(3)).44 The percentage of Cu2+ and Cu+ in the CuCP-modified electrode was calculated to be 81.28% and 18.72%, respectively, for before electrochemical activation. However, the percentage of Cu+1 environment is increased to 31.26% while the percentage of Cu+2 environment is changed to 69.74% after the stabilization. The stabilized environment and synergistic effect between the two oxidation states (Cu+1/2+) makes the activated CuCP modified electrode better towards the electrocatalytic oxidation of nitrite.| QCu2+/1+ = Q1(2p3/2) + Q2(2p1/2) | (1) |
| % Cu2+ = (QCu2+/QCu2+ + QCu1+) × 100 | (2) |
| % Cu1+ = (QCu1+/QCu2+ + QCu1+) × 100 | (3) |
3.3. Electrochemical characterization of the CuCP modified electrode
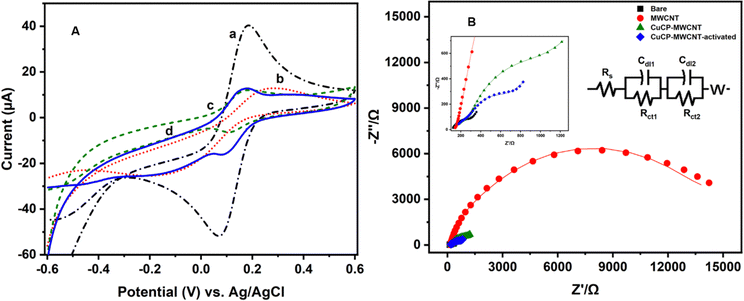
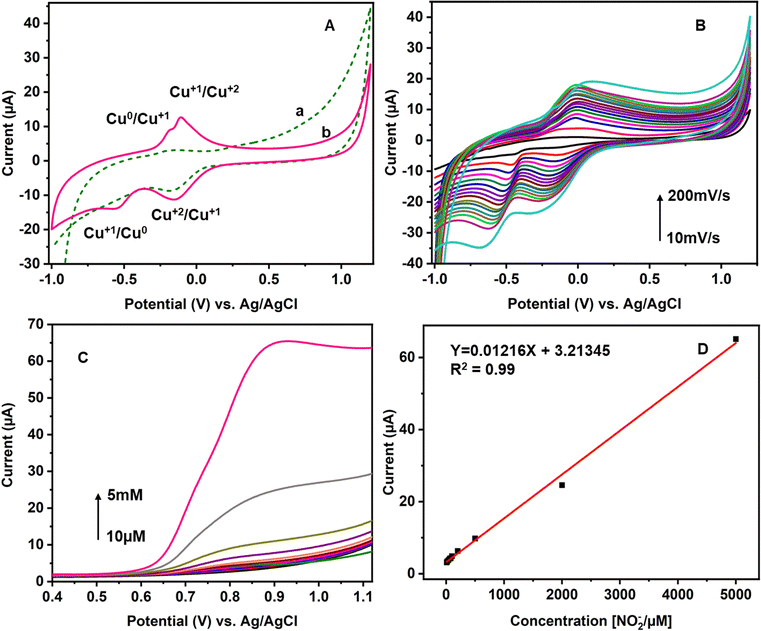
The stepwise fabrication of a screen-printed electrode has been examined with 5 mM K3[Fe (CN)6] containing 0.1 M KCl solution by cyclic voltammetry and electrochemical impedance spectroscopy (EIS) techniques (Fig. 3). The bare electrode shows a peak shape voltammogram due to redox reaction of Fe2+/3+. MWCNTs have been drop cast on the SPCE and kept for drying. The modified MWCNTs-SCPE electrode shows a quasi-reversible peak, which indicates that the modification hinders the charge transfer at the interface. The CuCP was modified onto the MWCNTs-SCPE by electrodeposition by applying a sweeping potential from −1 V to +1.2 V and activated for 20 cycles. The modified activated CuCP-MWCNTs-SPCE shows a better conductivity than the CuCP-MWCNTs-SPCE in the cyclic voltammogram in 5 mM K3[Fe(CN)6] containing 0.1 M KCl solution. This was attributed to the better entrapment of CuCP on the MWCNTs-SCPE. The information about the cyclic voltammogram of each stage of modified electrode was further supported by electrochemical impedance spectroscopy in 5 mM K3[Fe(CN)6] containing 0.1 M KCl solution. The EIS spectrum of the bare electrode shows the minimum charge transfer resistance. After modification, the MWCNTs-SPCE shows high resistance. CuCP-MWCNTs-SCPE and activated CuCP-MWCNTs-SCPE show two charge transfer resistances, which correspond to the MWCNTs and CuCP, respectively, with comparatively low charge transfer resistance. The RCT values (Table S1, ESI†) and cyclic voltammogram of each step modification indicate and confirm the successful surface modification.The CuCP-modified electrode showed a quasi-reversible redox peak located at −0.17 and −0.14 V vs. Ag/AgCl, corresponding to the redox reaction of Cu2+/Cu+ in CuCP. However, after the electrochemical stabilization, the redox peak observed for the Cu2+/Cu+ redox couple is increased with the formation of new redox peaks at −0.18 and −0.53 V, corresponding to the redox reaction of the Cu+/Cu0 couple. The electrochemical stabilization (Fig. S1, ESI†) helped in activation of the CuCP layer, which leads to the formation of Cu+ and Cu2+ environments in the CuCP-modified electrode (Fig. 4A). The surface coverage of the electrodeposited CuCP on the MWCNTs-functionalized SPCE calculated using the Randles-Sevcik equation is given below (eqn (4)),45
 | (4) |
![[thin space (1/6-em)]](https://www.rsc.org/images/entities/char_2009.gif) 485 C mol−1), and T is the absolute temperature (298.15 K). The Γ* was calculated to be 1.12 × 10⁻⁹ mol cm−2.
485 C mol−1), and T is the absolute temperature (298.15 K). The Γ* was calculated to be 1.12 × 10⁻⁹ mol cm−2.
In the effect of scan rate on both the anodic and cathodic peak currents observed for the CuCP-stabilized electrode are increased linearly with an increase in the scan rate ranging from 10 to 200 mV s−1 and its corresponding linear plot given in Fig. S2 (ESI†). This confirms the stable attachment of CuCP onto the MWCNTs-SPCE, which involved an adsorption controlled redox reaction (Fig. 4B). The heterogenous rate constant (ks) of the fabricated electrode was calculated using the Laviron equation as given below (eqn (5)),46,47
 | (5) |
After the stabilization, the CuCP-modified electrode is tested with various concentrations of nitrite prepared in PBS. Linear sweep voltammetry was used to investigate the response of the CuCP-modified electrode towards nitrite measurement because of its linear voltage sweep process with less background charging current.49 The electrochemical response of the CuCP-modified electrode to various concentrations of NO2− recorded in PBS (pH 7.4) LSV is depicted in Fig. 4C. The electrochemical oxidation of nitrite at the CuCP-modified electrode generated a new oxidation peak at a potential of 0.8 V (vs. Ag/AgCl). The electrocatalytic oxidation of nitrite at the CuCP-modified electrode showed a linear increase in current with the increase in the concentration of nitrite ranging from 10 μM to 5 mM. The calibration curve created showed a regression equation of Y (μA) = 0.01216 μM + 3.21345 with a correlation coefficient (R2) of 0.99 for NO2− in buffer solution (Fig. 4D).
3.4. Electrochemical response of CuCP-MWCNTs-SPCE to salivary NO2−
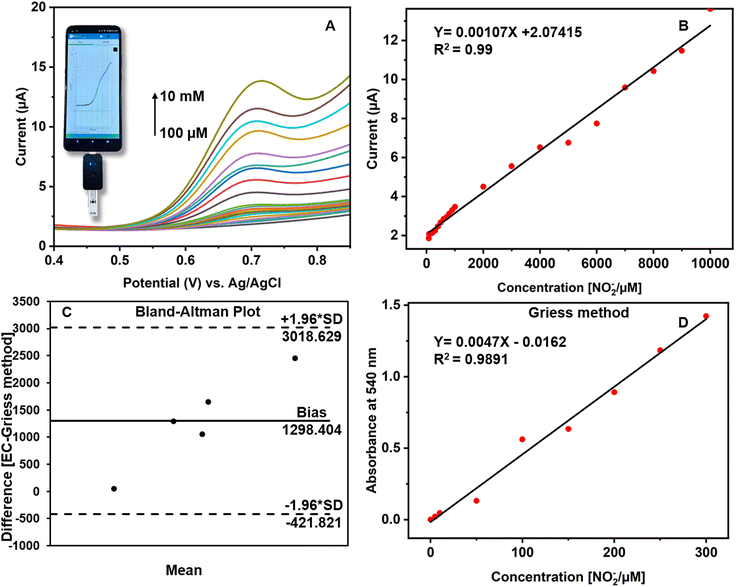
The CuCP-modified electrodes were tested on samples of human saliva using a portable Potentiostat integrated with a smartphone. The concentration of nitrite in saliva usually ranges between 29 and 57 μM and between 1.8 and 2.4 mM after nitrate intake.50 To cover the physiologically known concentrations, human saliva samples were spiked with standard nitrite solutions with various concentrations ranging from 10 μM to 10 mM. The modified CuCP-MWCNTs-SPCE on the electrochemical sensing of nitrite showed a linear range from 100 μM to 10 mM in human saliva (Fig. 5A).The peak current observed at potential 0.7 V (vs. Ag/AgCl) in human saliva. The calibration curve showed a regression equation of Y (μA) = 0.00107X (μM) + 2.07415, with a correlation coefficient (R2) of 0.99 for NO2− in human saliva (Fig. 5B). The slope value used for calculating LOD. An alternative Griess assay performed to validate the results of the CuCP modified electrode response towards nitrite. In the Griess method, human saliva samples are spiked with sodium nitrite at concentrations ranging from 5 to 300 μM. At 540 nm, the absorbance linearly increased with respect to the increase in concentration of NO2−. The calibration regression was Y (μA) = 0.0047X (μM) − 0.0162, with a correlation coefficient (R2) of 0.98 for NO2− in the Griess method (Fig. 5D). The electrochemical results of the CuCP-modified electrodes and the results of the Griess method toward nitrite in various saliva samples were compared by plotting the mean values of the two methods into a Bland–Altman plot (Fig. 5C). It is observed that the data points were aligned near at the mean difference/bias, although there are deviations of a few data points away from the bias still falling between the upper and lower limit of agreement (LoA). The Bland–Altman plots show that there is a good correlation between the two methods and also there is an observance that the CuCP-modified electrodes have a better sensing response towards salivary nitrite assessment.
3.5. Selectivity and reproducibility
An interference study is performed to analyse the selective response of the developed sensor. The CuCP-MWCNTs-SPCE was tested with different analytes such as nitrite, glucose, cholesterol, cortisol, and ascorbic acid at equal concentrations (1 mM). The current response is plotted as a change in signal using the formula given below (eqn (6)), and the corresponding response is plotted in the bar diagram shown in Fig. S5 (ESI†). Furthermore, an experiment using nitrite (100 μM) with a 10-fold concentration of interferents is also performed (Fig. S6, ESI†). A 10-fold concentration of ascorbic acid above the nitrite concentration seems to be an interfering analyte; however, an equal concentration of AA does not affect the developed sensor response towards nitrite.| [(Ctarget − C0)/C0] × 100 | (6) |
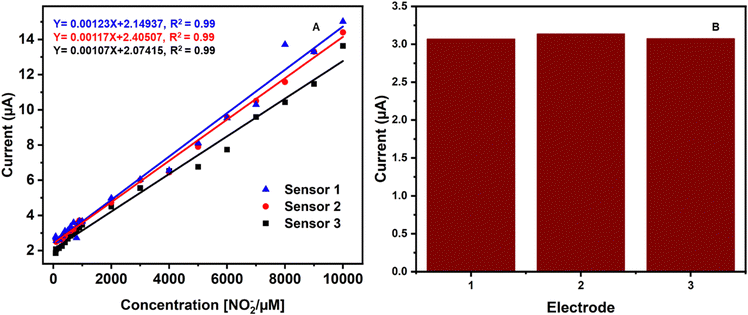
In order to check the reproducibility, three different sensors (CuCP-MWCNTs-SPCE) prepared under the same experimental conditions were tested for electrochemical measurement of nitrite under the same experimental conditions. The calibration curves created for all three different electrochemical sensors are plotted in Fig. 6A. Three different sensors were freshly prepared and used to detect the same concentration of nitrite (500 μM) to investigate the repeatability. Based on the current responses obtained, the relative standard deviation (RSD) was calculated as 1.73%, confirming that the sensor has good reproducibility.
4. Conclusions
An enzyme mimic-based, low-cost and portable electrochemical sensor was developed for the detection of nitrite using CuCP/MWCNTs nanocomposite-functionalized SPCEs. The printed sensor is coupled with a portable potentiostat integrated with a smartphone for POC measurement of nitrite. The developed electrochemical sensor showed a good electrocatalytic activity towards the nitrite levels in human saliva with a linearity ranging from 100 μM to 10 mM with a detection limit (LOD) of 1.5 μM. The developed sensor showed a good reproducibility (1.73%) for detecting nitrite. The sensor was tested for measuring nitrite levels in human saliva samples (n = 5). The electrochemical results of CuCP-MWCNTs-SPCE are evaluated with a standard Griess method. It is observed that the developed CuCP-MWCNTs-SPCE has a good sensitivity towards nitrite in the saliva samples. The portable sensor coupled with cost-effective printed sensor technology has the potential to be deployed in clinical screening of nitrite levels in the human population.Author contributions
Sriraja Subhasri Paramasivam: data curation, formal analysis, investigation, writing original draft. Siva Ananth Mariappan: data curation, formal analysis, investigation, methodology. Niroj Kumar Sethy: validation, funding acquisition, supervision, methodology. Pandiaraj Manickam: conceptualization, funding acquisition, supervision, investigation, writing, reviewing and editing.Conflicts of interest
The authors declare no conflicts of interest.Acknowledgements
This work was supported by the DIPAS-DRDO, New Delhi, India (CARS-04/TD/20-21/DIP-274). Central Instrumentation Facility (CIF), CSIR-Central Electrochemical Research Institute (CECRI) is acknowledged for characterization facilities. CECRI Manuscript number: CECRI/PESVC/Pubs/2023-112.Notes and references
- L. Ma, L. Hu, X. Feng and S. Wang, Aging Dis., 2018, 9, 938–945 CrossRef PubMed.
- M. Karwowska and A. Kononiuk, Antioxidants, 2020, 9, 241 CrossRef CAS PubMed.
- D. J. Stuehr, J. Nutr., 2004, 134, 2748S–2751S CrossRef CAS PubMed.
- M. Kelm, Curr. Hypertens. Rep., 2003, 5, 80–86 CrossRef PubMed.
- K. Katabami, M. Hayakawa and S. Gando, Case reports in emergency medicine, 2016, 2016, 9013816 CrossRef PubMed.
- R. McNulty, N. Kuchi, E. Xu and N. Gunja, J. Food Sci., 2022, 87, 1423–1448 CrossRef CAS.
- S. Fossen Johnson, Current Problems in Pediatric and Adolescent Health Care, 2019, 49, 57–67 CrossRef PubMed.
- A. Temkin, S. Evans, T. Manidis, C. Campbell and O. V. Naidenko, Environ. Res., 2019, 176, 108442 CrossRef CAS PubMed.
- L. Xie, M. Mo, H.-X. Jia, F. Liang, J. Yuan and J. Zhu, Oncotarget, 2016, 7, 56915–56932 CrossRef.
- P. Jakszyn and C.-A. Gonzalez, World J. Gastroenterol., 2006, 12, 4296–4303 CrossRef CAS.
- P. I. Reed, K. Haines, P. L. R. Smith, F. R. House and C. L. Walters, The Lancet, 1981, 318, 550–552 CrossRef.
- M. Inoue-Choi, R. R. Jones, K. E. Anderson, K. P. Cantor, J. R. Cerhan, S. Krasner, K. Robien, P. J. Weyer and M. H. Ward, Int. J. Cancer, 2015, 137, 173–182 CrossRef CAS.
- M. I. H. Helaleh and T. Korenaga, J. Chromatogr. B: Biomed. Sci. Appl., 2000, 744, 433–437 CrossRef CAS PubMed.
- W. S. Jobgen, S. C. Jobgen, H. Li, C. J. Meininger and G. Wu, J. Chromatogr. B: Anal. Technol. Biomed. Life Sci., 2007, 851, 71–82 CrossRef CAS PubMed.
- X. Yao, J. Lin, Q. Zhou, Y. Song, T. Sun, X. Qiu, B. Cao and Y. Li, Environ. Sci.: Nano, 2023, 10, 2374–2386 RSC.
- C. W. Kung, T. H. Chang, L. Y. Chou, J. T. Hupp, O. K. Farha and K. C. Ho, Electrochem. Commun., 2015, 58, 51–56 CrossRef CAS.
- C.-W. Kung, Y.-S. Li, M.-H. Lee, S.-Y. Wang, W.-H. Chiang and K.-C. Ho, J. Mater. Chem. A, 2016, 4, 10673–10682 RSC.
- S. Salagare, P. S. Adarakatti, A. S. A. Almalki and V. Yarradoddappa, Mater. Res. Innovations, 2023, 27, 212–222 CrossRef CAS.
- S. Salagare, P. Shivappa Adarakatti, A. S. A. Almalki and Y. Venkataramanappa, Mater. Res. Innovations, 2023, 27, 33–44 CrossRef CAS.
- S. Salagare, P. S. Adarakatti, Y. Venkataramanappa and A. S. A. Almalki, Ionics, 2022, 28, 927–938 CrossRef CAS.
- S. B. Lucas, L. M. Duarte, K. C. Rezende and W. K. Coltro, Micromachines, 2022, 13 Search PubMed.
- D. Giustarini, R. Rossi, A. Milzani and E. Dalle-Donne, Nitric Oxide, Part F, Academic Press, 2008, vol. 440, pp. 361–380 Search PubMed.
- A.-M. Raducanu, S. Mihai, I. Sandu, A. Anghel, C. Furnica, R. O. Chistol, C. A. Dinu, D. Tutunaru and K. Earar, Appl. Sci., 2022, 12 Search PubMed.
- T. Madasamy, M. Pandiaraj, M. Balamurugan, K. Bhargava, N. K. Sethy and C. Karunakaran, Biosens. Bioelectron., 2014, 52, 209–215 CrossRef CAS PubMed.
- S. Radhakrishnan, K. Krishnamoorthy, C. Sekar, J. Wilson and S. Kim, Appl. Catal., B, 2014, s148–149, 22–28 CrossRef.
- J. Davis, M. J. Moorcroft, S. J. Wilkins, R. G. Compton and M. F. Cardosi, Analyst, 2000, 125, 737–742 RSC.
- F. Manea, A. Remes, C. Radovan, R. Pode, S. Picken and J. Schoonman, Talanta, 2010, 83, 66–71 CrossRef CAS.
- A. D. Ambaye, M. Muchindu, A. Jijana, S. Mishra and E. Nxumalo, Mater. Today Commun., 2023, 35, 105567 CrossRef CAS.
- S. A. Prashanth and M. Pandurangappa, Mater. Lett., 2016, 185, 476–479 CrossRef CAS.
- A. Puspalak, P. Chinnadurai, R. Prathibha, M. P. Kumar, S. G. Manjushree, V. UdayaKumar and P. S. Adarakatti, Mater. Res. Innovations, 2023, 27, 100–109 CrossRef CAS.
- P. Shivappa Adarakatti, C. W. Foster, C. E. Banks, N. S. Arun Kumar and P. Malingappa, Sens. Actuators, A, 2017, 267, 517–525 CrossRef CAS.
- S. G. Manjushree and P. S. Adarakatti, Recent Developments in Green Electrochemical Sensors: Design, Performance, and Applications, American Chemical Society, 2023, vol. 1437, pp. 1–21 Search PubMed.
- P. S. Adarakatti, C. E. Banks and P. Malingappa, Anal. Methods, 2017, 9, 6747–6753 RSC.
- S. B. Patri, P. S. Adarakatti and P. Malingappa, Curr. Anal. Chem., 2018, 15, 56–65 CrossRef.
- V. Hooda, V. Sachdeva and N. Chauhan, Rev. Anal. Chem., 2016, 35, 99–114 CrossRef CAS.
- J. L. Wray and R. J. Fido, in Enzymes of Primary Metabolism, ed. P. J. Lea, Academic Press, 1990, vol. 3, pp. 241–256 Search PubMed.
- R. K. A. Amali, H. N. Lim, I. Ibrahim, N. M. Huang, Z. Zainal and S. A. A. Ahmad, Trends Environ. Anal. Chem., 2021, 31, e00135 CrossRef CAS.
- P. S. Adarakatti, K. Sureshkumar and T. Ramakrishnappa, in Carbon Nanomaterials-Based Sensors, ed. J. G. Manjunatha and C. M. Hussain, Elsevier, 2022, pp. 149–165 Search PubMed.
- M. Balamurugan, T. Madasamy, M. Pandiaraj, K. Bhargava, N. K. Sethy and C. Karunakaran, Anal. Biochem., 2015, 478, 121–127 CrossRef CAS PubMed.
- D. Klyamer, R. Shutilov and T. Basova, Sensors, 2022, 22, 895 CrossRef CAS PubMed.
- Y. Wang, E. Laborda and R. G. Compton, J. Electroanal. Chem., 2012, 670, 56–61 CrossRef CAS.
- X. Huang, X. Zhang, H. Wenhui, S. Lv and Y. Huang, J. Mater. Sci., 2020, 55, 10773–10784 CrossRef CAS.
- Z. Y. Zhang, Y. L. An, X. S. Wang, L. Y. Cui, S. Q. Li, C. B. Liu, Y. H. Zou, F. Zhang and R. C. Zeng, Bioactive Mater., 2022, 18, 284–299 CrossRef CAS PubMed.
- P. Sri Bala Jeya Krishna Sri, K. Muthusundar, A. Peer Mohammed and S. Ananthakumar, Ceram. Int., 2022, 48, 29502–29513 CrossRef CAS.
- N. Elgrishi, K. J. Rountree, B. D. McCarthy, E. S. Rountree, T. T. Eisenhart and J. L. Dempsey, J. Chem. Educ., 2018, 95, 197–206 CrossRef CAS.
- D. Thomas, Z. Rasheed, J. S. Jagan and K. G. Kumar, J. Food Sci. Technol., 2015, 52, 6719–6726 CrossRef CAS.
- V. Krishnan, E. Gunasekaran, C. Prabhakaran, P. Kanagavalli, V. Ananth and M. Veerapandian, Mater. Chem. Phys., 2023, 295, 127071 CrossRef CAS.
- S. Sornambikai, M. R. Abdul Kadir, A. S. Kumar, N. Ponpandian and C. Viswanathan, Anal. Methods, 2017, 9, 6791–6800 RSC.
- G. Hussain and D. S. Silvester, Electroanalysis, 2018, 30, 75–83 CrossRef CAS.
- H. Björne H, J. Petersson, M. Phillipson, E. Weitzberg, L. Holm and J. O. Lundberg, J. Clin. Invest., 2004, 113, 106–114 CrossRef.
Footnote |
| † Electronic supplementary information (ESI) available. See DOI: https://doi.org/10.1039/d3ma00634d |
| This journal is © The Royal Society of Chemistry 2023 |

