
 Open Access Article
 This Open Access Article is licensed under a Creative Commons Attribution-Non Commercial 3.0 Unported Licence
Photodegradation of emerging contaminant tetracycline using a zinc titanate nanocellulose composite as an efficient photocatalyst†
Jahnabi
Gogoi
and
Devasish
Chowdhury
 *
*
Material Nanochemistry Laboratory Physical Sciences Division, Institute of Advanced Study in Science and Technology, Paschim Boragaon, Garchuk, Guwahati 781035, India. E-mail: devasish@iasst.gov.in
First published on 31st March 2023
Abstract
There is an urgent need to mitigate emerging contaminants, viz. pharmaceuticals, etc. In this work, efforts have been made to develop zinc titanate (ZnTiO3)-based efficient photocatalysts to photodegrade tetracycline. Zinc titanates (ZnTiO3) were synthesized by a simple sol–gel method. ZnTiO3 was subjected to different calcination temperatures. In addition, a composite of carbon dot-doped zinc titanate and zinc titanate-cotton nanocellulose was also synthesized. The prepared samples were then characterized using UV-Vis spectroscopy, FTIR spectroscopy, X-ray diffraction (XRD), field-emission scanning electron microscopy (SEM), Raman spectrometry etc. The calcinated ZnTiO3 at temperatures of 600 °C, 700 °C, 800 °C and 900 °C, carbon dot-doped calcinated ZnTiO3 and ZnTiO3-nanocellulose composites were examined for their photocatalytic activity in the degradation of tetracycline hydrochloride under light illumination. The photocatalytic studies demonstrated that ZnTiO3 calcinated at 600 °C, carbon dot-doped ZnTiO3 calcinated at 600 °C and the ZnTiO3-nanocellulose composite show the highest photocatalytic activity of degradation of tetracycline hydrochloride under light illumination with degradation rates of 98.27%, 99.14%, and 99.81%, respectively. A pH-dependence study (pH 2–11) reveals that the photodegradation process does not depend on pH and the catalytic efficiency is not affected by different pH values. The study also involved investigating the active species that play crucial roles in the degradation process of tetracycline hydrochloride under light illumination. It was observed that holes and superoxide ions play pivotal roles in the degradation of tetracycline hydrochloride. Such studies help in finding solutions for mitigation of emerging contaminants.
Introduction
Hundreds of antibiotics have been synthesized since their discovery in 1929.1 Antibiotics are extensively used for the treatment of different types of infectious diseases. Antibiotics are inexpensive but effective in treating different types of diseases. These antibiotics are released from the human/animal body through urine and excreta, eventually contaminating the environment. Most antibiotics are released in their active forms leading to the contamination of soil, water, plants, and animal life.2 This leads to pharmaceutical pollution. Therefore, there is a need to mineralize these pharmaceuticals to non-toxic and low molecular weight molecules.3 Considered as emerging contaminants, pharmaceuticals represent a challenge in the field of environmental remediation. There are various technologies that are continuously being developed to mitigate their impact and reduce their effects on the environment and human health. Photocatalytic degradation of organic pollutants is a convenient method that is rapid, low cost, and repeatable that has been explored recently. Oxide-based semiconductor materials have found substantial applications in the photocatalytic degradation area. ZnO and TiO2 are two widely used materials showing excellent photocatalytic activity against various environmental pollutants. But they generally operate in the UV region, limiting their activity. Hence, mixed oxides, such as the system of ZnO–TiO2, have been explored as prospective photocatalysts.4–6In the past few years, zinc titanates have proved to be interesting materials and they have been studied for various applications, such as the degradation of dyes,7 gas sensors,8 humidity sensors,9 antibacterial agents,10 paint pigments,11 and photocatalysts.12 However, the structural phases of zinc titanates are not well identified.13 Various literature reports on zinc titanates report that zinc titanates have three forms: hexagonal ZnTiO3 (zinc metatitanate), cubic Zn2TiO4 (zinc orthotitanate), and cubic Zn2Ti3O8.14 Zinc titanates have different structural phases and also have favourable light–matter interactions. The efficiency of photocatalytic materials depends on various factors: the band gap, defects, charge carrier recombination, and surface area.15
Moreover, incorporating nano-dimensional entities into the morphology enhances the photocatalytic activity of the materials. There are different methods available for the synthesis of nanoparticulate zinc titanates. The different physical and chemical synthesis methods are sol–gel,16,17 hydrothermal,18 laser deposition,19 solid-state reaction,20 and electrospinning.21 Out of all these methods, the sol–gel method is simple, resulting in the formation of components in the nanoscale. In this work, we have synthesized zinc titanates via a surfactant-assisted sol–gel method. Using surfactants results in the formation of smaller-sized uniform nanoparticles as the surfactant forms micelles that act as templates in the synthesis process. Furthermore, the calcination of the synthesized materials improves the photocatalytic activity of the final products by simply enhancing the surface area.
Moreover, by incorporating defects, the material's band gap can be tuned and the photocatalytic activity can also be improved.22 In this case, the zinc titanates were doped with polyethylene glycol and their photocatalytic efficacy was measured. To promote photocatalytic activity, the fabrication of composites is an effective technique.
Besides photocatalytic degradation, adsorption is widely used to mitigate environmental issues like organic pollutants.23 Cellulose is a commonly available material that meets all the requirements of a suitable adsorbent. The cellulose derivative, nanocellulose, also possesses some desirable characteristics like high surface area, good thermal stability, high mechanical strength, and reduced size, making it a good candidate for such applications.24 Cotton is a cheap, abundantly available resource that can act as a suitable substrate material with high mechanical strength and the nanocellulose was derived from cotton.25 In the present work, a composite was made of zinc titanate with cotton nanocellulose. The synthesis process was simple and followed a one-pot process by mixing the zinc titanate and an aqueous solution of nanocellulose. The photocatalytic behaviour of the composite was found to be better in this case. The improved activity may arise because of the enhanced surface areas of the individual components.
The photocatalytic efficiency of the synthesized materials was examined for the degradation of antibiotic tetracycline hydrochloride, an organic pollutant resistant to degradation under light illumination. Its presence in the environment is harmful to aquatic organisms and also to plants and animals. Researchers have reported the photocatalytic activity of zinc titanates in the degradation of various organic pollutant dyes such as rhodamine B, methyl orange (MO), methylene blue (MB), and Congo red under UV light irradiation.26 The photodegradation of antibiotics such as tetracycline has been achieved by a number of materials and techniques. As already known, photocatalysis of organic molecules proceeds by the generation of hydroxyl and superoxide radicals by the catalyst upon interaction with light. Abdi et al. used heterogeneous metal–organic frameworks as photocatalysts for the photodegradation of tetracycline.27 Ho et al. studied the photodegradation of tetracycline and sulfathiazole using UV light.28 Another method developed for catalytic photodegradation of tetracycline is using mesoporous phosphated TiO2 as shown by the group of Jiang Li.29 Oluwole et al. demonstrated photocatalytic degradation of tetracycline in aqueous systems under visible light irradiation using needle-like SnO2 nanoparticles anchored on exfoliated g-C3N4.30 Hemmi et al. studied the photodegradation of tetracycline using synthesized spinel ZnAl2O4.31 In addition, the photodegradation of tetracycline antibiotics in aqueous solution by ZnO is also reported.32 In addition, sonocatalytic degradation of tetracycline antibiotics using zinc oxide nanostructures loaded on nano-cellulose is also demonstrated by Soltani et al.33 Very recently, Shijie Li's group used organic/inorganic heterostructures of TCPP/Bi12O17Cl2 and MIL-101(Fe)/Bi2WO6 in the photodegradation of tetracycline hydrochloride.34,35 They have also shown the use of different S-scheme heterojunctions for the degradation of different antibiotics like tetracycline and enrofloxacin with remarkable photocatalytic performances.36–38 However, there is no report of the use of zinc titanate as a photocatalyst in the photodegradation of tetracycline antibiotics.
In this work, zinc titanates (ZnTiO3) were synthesized by a simple sol–gel method. The ZnTiO3 was subjected to different calcination temperatures. In the second step, a composite of zinc titanate and cotton nanocellulose was synthesized. The calcinated ZnTiO3 at temperatures 600 °C, 700 °C, 800 °C and 900 °C and ZnTiO3-nanocellulose composite were examined for their photocatalytic activity in the degradation of tetracycline hydrochloride under light illumination. The study revealed enhanced photocatalytic activity for the zinc titanate (ZnTiO3) catalyst system calcined at 600 °C and its corresponding nanocellulose composite suggesting a critical role of temperature in their photocatalytic activity.
Experimental
Materials and methods
Synthesis of zinc titanate (ZnTiO3)
In this surfactant-assisted synthesis of ZnTiO3, an ionic surfactant, cetyltrimethylammonium ammonium bromide (CTAB), was used. In a typical protocol, 0.2 g of CTAB was dissolved in 10 ml of deionized water and was heated at 500 °C for 2 hours with constant stirring. Zinc and titanium were taken in a mole ratio of 1![[thin space (1/6-em)]](https://www.rsc.org/images/entities/char_2009.gif) :0.9 for the synthesis. 2.25 g of zinc acetate dihydrate and 3.14 ml of titanium isopropoxide were dissolved separately in 3.33 ml of acetic acid. These separate solutions were mixed under continuous magnetic stirring and heating at 50 °C. To this, the premixed surfactant solution in deionized water was added. This resulted in the formation of a transparent sol that later transformed into a gel after heating for several hours. The gel was further heated at a higher temperature to remove excess acetic acid. The product was washed with water several times using a centrifuge to remove excess solvent. The resultant product was then calcined for 2 hours at 600–900 °C to obtain ZnTiO3 in a powder form. The final ZnTiO3 powders were denoted as ZNTC_600, ZNTC_700, ZNTC_800, and ZNTC_900 corresponding to different calcination temperatures ranging from 600 °C to 900 °C.
:0.9 for the synthesis. 2.25 g of zinc acetate dihydrate and 3.14 ml of titanium isopropoxide were dissolved separately in 3.33 ml of acetic acid. These separate solutions were mixed under continuous magnetic stirring and heating at 50 °C. To this, the premixed surfactant solution in deionized water was added. This resulted in the formation of a transparent sol that later transformed into a gel after heating for several hours. The gel was further heated at a higher temperature to remove excess acetic acid. The product was washed with water several times using a centrifuge to remove excess solvent. The resultant product was then calcined for 2 hours at 600–900 °C to obtain ZnTiO3 in a powder form. The final ZnTiO3 powders were denoted as ZNTC_600, ZNTC_700, ZNTC_800, and ZNTC_900 corresponding to different calcination temperatures ranging from 600 °C to 900 °C.
Synthesis of cotton nanocellulose
Synthesis of cotton nanocellulose (CNC) involves two steps, alkali hydrolysis followed by acid hydrolysis. Commercially available cotton was ground to a fine powder. The ground powder was mixed with a 5% NaOH solution at room temperature with constant stirring for 4 hours to obtain a homogeneous mixture. The mixture was then washed and filtered with distilled water for lignin and hemicellulose removal. The filtrate was then dried at 80 °C for 24 h. After the alkali hydrolysis, the product was mixed in a 1:2 solution of concentrated sulphuric acid and distilled water. The mixture was heated at 40 °C for an hour to obtain a well-mixed solution. It was then washed repeatedly with distilled water to remove the excess acid and get a neutral pH solution. The mixture was then centrifuged at 10000 rpm for 20 minutes. The obtained product was dried at 80 °C to obtain the nanocrystalline powder.
Synthesis of the zinc titanate–cotton nanocellulose composite
The cotton nanocrystalline nanocellulose powder as prepared by following the procedure described above was dispersed in distilled water and sonicated to obtain a well-dispersed solution. Zinc titanate powder (ZNTC_600) was added to this solution in a ratio of 2:1 with constant stirring for several hours. It was then centrifuged and the filtrate was collected and dried to obtain the zinc titanate–cotton nanocellulose composite. The composite is denoted as ZNTC_600_CNC for further reference.
Synthesis of polyethylene glycol carbon dot-doped zinc titanate nano powders
For synthesizing polyethylene glycol-doped zinc titanate nano-powders, the same procedure was followed as for synthesizing zinc titanate powders as described earlier. A transparent sol was obtained after adding the surfactant solution to the mixture of zinc dihydrate in acetic acid and titanium isopropoxide in acetic acid. To this clear solution, freshly synthesized polyethylene glycol carbon dots were added under constant stirring. Over several hours, the sol transformed into a gel after constant heating and stirring. The obtained product was washed and centrifuged several times to remove the excess solvent. The resultant product was then calcined for 2 hours at temperatures of 600–800 °C to obtain the final products. The products were denoted as ZNTP_600, ZNTP_700, and ZNTP_800 for further reference.Characterization
The crystalline phases of the as-prepared zinc titanate (ZnTiO3) catalyst systems calcined at different temperatures viz. 600 °C to 900 °C and their corresponding nanocellulose composite were analyzed using X-ray diffraction (XRD) measurements on a Bruker D8 Advance diffractometer. The morphologies of the samples were determined by field electron scanning electron microscopy (FESEM) using a ZEISS SIGMA VP instrument. The Fourier transform infrared (FT-IR) spectra were collected on a PerkinElmer Spectrum II instrument. Solid UV-Vis diffuse reflectance spectrometry (DRS) was conducted on a Shimadzu 2600 UV-Vis Spectrophotometer. XPS analysis was performed using a ESCALAB250Xi Kα X-ray photoelectron spectrometer. A Horiba Labram Evolution instrument measured the Raman spectra in the scanning range of 50–1000 nm excited by using a 532 nm laser. Surface area and pore volume were analysed using an Autosorb iQ BET surface area analyser. Mass spectrometry (MS) was conducted by using a Thermo Scientific Dionex Ultimate 3000 for LC and a Triple Quadruple Mass spectrometer for MS.Photocatalytic degradation experiments
The photocatalytic degradation efficiency of the calcinated zinc titanates (ZnTiO3) at different temperatures viz. 600 °C to 900 °C and their corresponding nanocellulose composite was studied by tetracycline hydrochloride (TC-HC) degradation under light illumination (Xe lamp). Firstly, 50 mg of the samples was added to a 100 ml solution of TC-HC of concentration 10 mg l−1. The solution was ultrasonicated for 5 minutes to disperse the sample homogeneously. Then the sample mixture was kept in the dark for 30 minutes with constant stirring for the sample and TC-HC to reach adsorption–desorption equilibrium. The sample was then exposed to light illumination for 2 hours with constant stirring, and 4 ml of the sample was withdrawn and centrifuged every 20 min. The centrifuged supernatant was analyzed using a Shimadzu UV-2600 spectrophotometer for maximum absorption at 357 nm.Trapping experiments of active species
During the degradation of TC-HC different types of active species may be produced viz. hydroxyl radicals (˙OH), superoxide radicals (˙O2−), and holes (h+). In the trapping experiment, three scavengers were used, namely isopropanol, ascorbic acid, and EDTA-2Na for scavenging hydroxyl radicals (˙OH), superoxide radicals (˙O2−), and holes (h+), respectively. So, the photocatalytic degradation efficiency of the calcinated zinc titanate (ZnTiO3) at 600 °C was studied similarly as described before, but in the presence of different scavengers.Results and discussion
The as synthesized zinc titanates (ZnTiO3) calcined at different temperatures viz. 600 °C to 900 °C, the zinc titanate-doped carbon dots and their corresponding nanocellulose composite were characterized using various techniques as discussed in this section. The UV-Vis diffuse reflectance (DRS) spectra were studied to investigate the optical properties of calcinated zinc titanates (ZnTiO3) at different temperatures viz. 600 °C to 900 °C. Fig. 1(A) displays the stacked UV-Vis DRS data in terms of absorbance for ZNTC_600, ZNTC_700, ZNTC_800, and ZNTC_900. Similar stacked UV-Vis DRS data of the zinc titanate-doped carbon dot samples viz. ZTP_600, ZNTP_700, and ZNTP_800 are shown in ESI,† Fig. S1B. It can be observed from Fig. 1(A) that ZNTC_600 has an absorption maximum at 330 nm and a broad low-intensity peak at around 445 nm. It can also be observed from the figure that as the calcination temperature increased from 600 to 900 °C through 700 and 800 °C, the UV absorption peak showed a red shift from 330 nm to 345 nm. This indicates that the calcinated zinc titanates (ZnTiO3s) have absorbance in the UV region.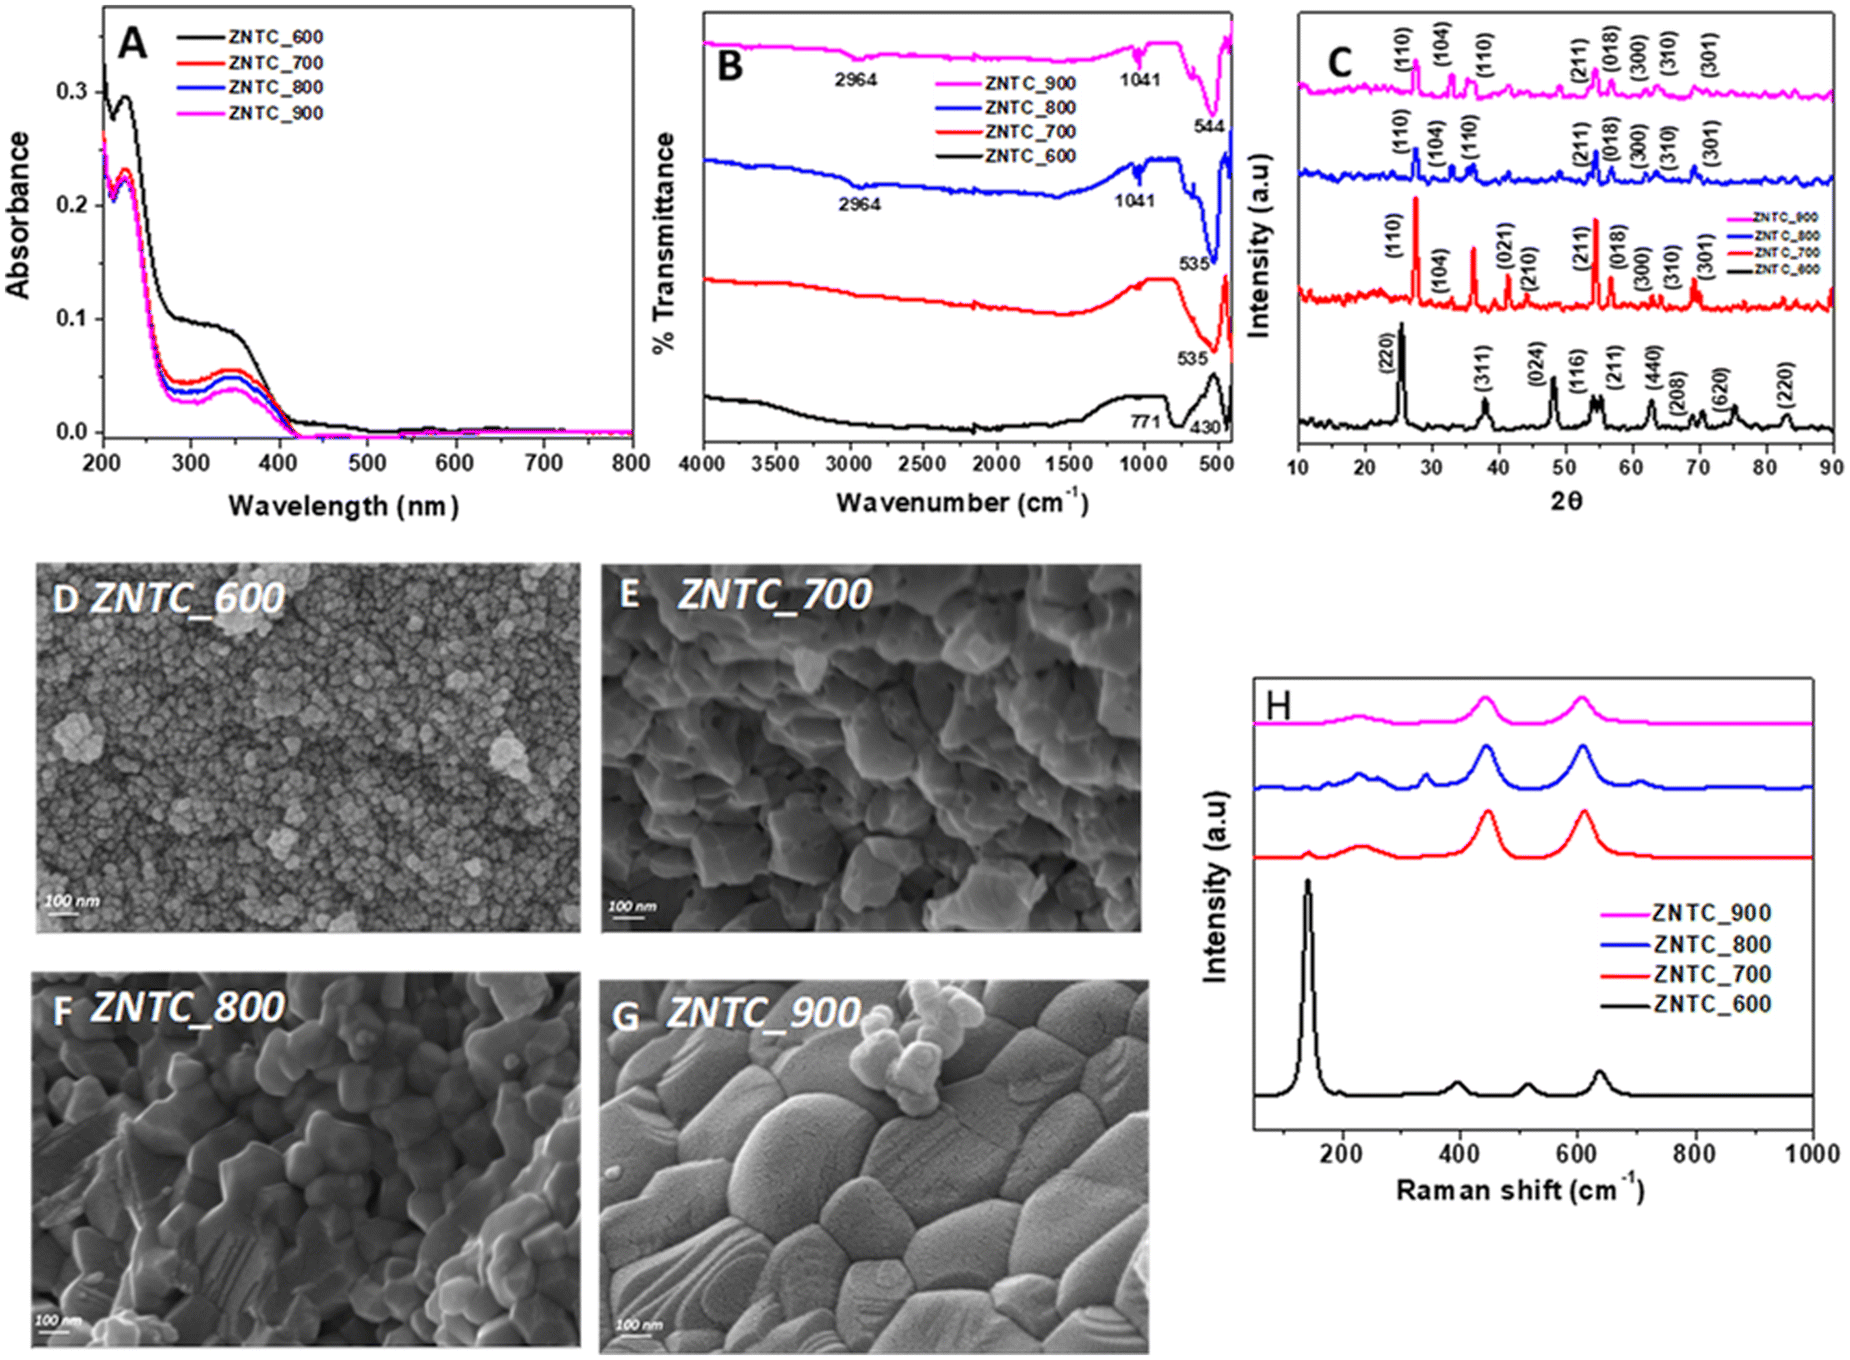 | ||
| Fig. 1 (A) Stacked UV-Vis spectra, (B) stacked FTIR spectra, and (C) stacked XRD diffractograms of the zinc titanates calcined at different temperatures; scanning electron microscopy images of the zinc titanates calcined at (D) 600 °C, (E) 700 °C, (F) 800 °C and (G) 900 °C; and stacked Raman spectra of the zinc titanates calcined at different temperatures. | ||
The Fourier transformed infrared spectroscopy (FTIR) data of the synthesized systems were recorded and analyzed. In Fig. 1(B), the stacked FTIR spectra of ZNTC_600, ZNTC_700, ZNTC_800, and ZNTC_900 are shown. The IR characteristics of zinc titanates are generally observed at 400–800 cm−1. ZNTC_600 has two distinct peaks, at 430 cm−1, and 771 cm−1. These peaks merge to become a broad stronger peak when the sample temperatures are increased. The peaks were observed at 535 cm−1, 535 cm−1, and 544 cm−1, respectively, for ZNTC_700, ZNTC_800, and ZNTC_900. A large absorption band at 450–770 cm−1 corresponds to the characteristic vibration frequencies of ZnO and TiO in the TiO6 octahedra. Thus, the FTIR spectra indicate the successful formation of zinc titanates. Similar spectra were observed for the doped systems, as shown in ESI,† S1C.
To determine the purity, the crystallinity, and different phases of the calcinated zinc titanates (ZnTiO3) at different temperatures were assessed by powder XRD. Fig. 1(C) shows the stacked XRD diffractograms of ZNTC_600, ZNTC_700, ZNTC_800, and ZNTC_900. It can be observed from the figure that crystal planes (220), (311), (024), (116), (211), (440), (208), (620), and (220) are present for the ZNTC_600 diffractogram. The crystal planes of (220), (311), (440), and (620) can be indexed to the Zn2TiO4 phase (JCPDS card no. 73-0578). The remaining crystal planes (024), (116), (211), (208), and (220) can be indexed to hexagonal ZnTiO3 (JCPDS card no. 25-0671). The diffractograms of ZNTC_700, ZNTC_800, and ZNTC_900 have similar crystal planes corresponding to ZnTiO3 and some crystal planes corresponding to the phases of TiO2. This may be due to the presence of residual impurities in the synthesized systems. The diffractograms show that with the increase in temperature from 600 to 900 °C, impurity phases became fewer and the crystal planes corresponding to ZnTiO3 dominated. This can be attributed to the fact that at 600 °C, the formation of metastable zinc metatitanate (ZnTiO3) starts, which later, with increasing temperature, dominates at higher temperatures. A similar diffractogram was taken for ZnTiO3 doped with carbon dots. It can be observed from the stacked diffractograms of the doped systems as well, that ZNTP_600, ZNTP_700, and ZNTP_800 (ESI,† Fig. S1A) have similar 2θ values and, therefore, crystal planes as the parent system ZNTC. But it was observed that the catalyst system calcined at 600 °C had some additional planes of (104), (110), and (015) of the ZnTiO3 phase.
The ZnTiO3-nanocellulose composite (ZNTC_600_CNC) prepared was also characterized. In ESI,† Fig. S2(A), the UV-Vis absorption spectrum of CNC is shown. The CNC did not show any distinctive peak. However, the composite of CNC and ZNTC_600 (ZNTC_600_CNC) shows a distinctive peak at 345 nm, as shown in Fig. 2(A). The optical band gaps of zinc titanates (ZnTiO3) calcined at different temperatures viz. 600 °C to 900 °C, zinc titanate-doped carbon dots and their corresponding nanocellulose composite were calculated from their corresponding absorption data using the Tauc plots. The band gap (Eg) is obtained by plotting according to the equation (αhν)2vs. hν, where α is the absorption coefficient and hν is the photon's energy. The band gaps can be obtained from the Tauc plots by extrapolating the linear portions of the plots at (αhν)2 = 0. Therefore, the corresponding band gaps for the samples ZNTC_600, ZNTC_700, ZNTC_800, and ZNTC_900 are determined to be 3.14 eV, 3.01 eV, 2.92 eV, and 2.86 eV, respectively, as shown in ESI,† Fig. S4.
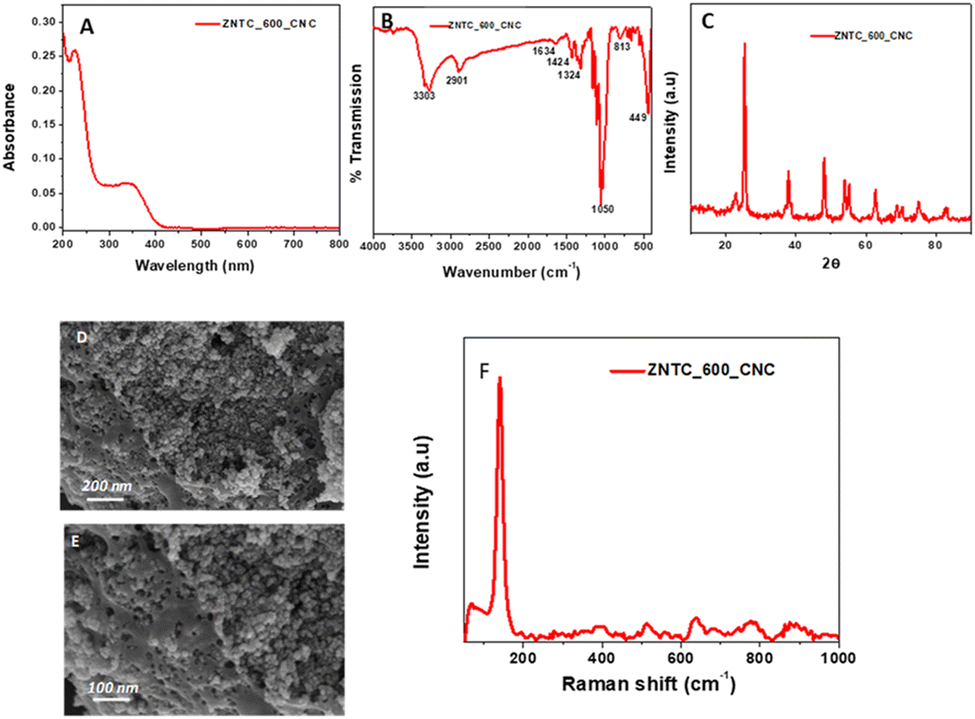 | ||
| Fig. 2 Characterization of the cotton nanocellulose (CNC) and ZNTC_600 composite. (A) UV-Vis spectrum. (B) FTIR spectrum. (C) XRD diffractogram. (D) and (E) Scanning electron microscope images. (F) Raman spectrum. | ||
The diffractograms of CNC and the composite of CNC and ZNTC_600 were recorded and are shown in ESI,† Fig. S2(C) and Fig. 3(C), respectively. The CNC diffractogram has characteristic peaks at 2θ = 16° and 2θ = 22.8°, which correspond to the characteristic diffractogram of the cellulose I structure. The diffractogram of ZNTC_600_CNC has a similar pattern to ZNTC_600 with an additional peak at 2θ = 22.8°, which corresponds to the characteristic of CNC, indicating the successful composition of CNC and ZNTC_600.
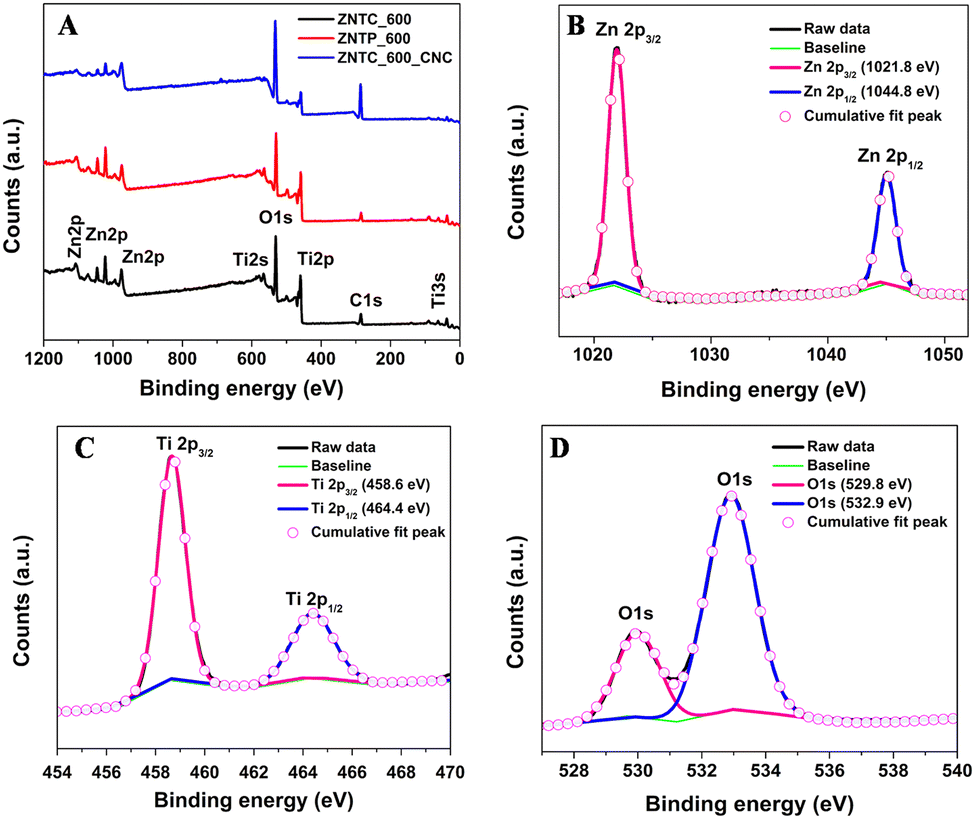 | ||
| Fig. 3 (A) Stacked XPS survey spectra of ZNTC_600, ZNTP_600, and ZNTC_600_CNC; high-resolution scans of (B) Zn 2p, (C) Ti 2p, and (D) O1s core level spectra of ZNTC_600_CNC. | ||
The band gaps of the carbon dot-doped systems, ZNTP_600, ZNTP_700, and ZNTP_800, were determined to be 2.92 eV, 2.90 eV, and 2.88 eV, respectively, as shown in ESI,† Fig. S5. The band gap for the composite ZNTC_600_CNC was determined to be 3.16 eV, similar to ZNTC_600. The decrease in the band gap of the systems with the increase in the calcination temperatures may be due to the gradual phase transition from cubic ZnTiO3 to hexagonal ZnTiO3. Hexagonal ZnTiO3 and cubic Zn2TiO4 have lower band gaps than cubic ZnTiO3. Thus, the direct band gap of 3.14 eV and indirect band gap of 2.75 eV for ZNTC_600 can be attributed to the presence of a mixture of Zn2TiO4 and Zn2Ti3O8, and hexagonal ZnTiO3, as supported by the XRD data.
FTIR spectroscopy was also studied for CNC and its composite with ZNTC_600. The FTIR spectrum of CNC is shown in ESI,† Fig. S2(B). The IR spectrum displays peaks at 3312 cm−1, which may be due to O–H stretching; a vibrational frequency is observed at 2901 cm−1 for C–H stretching. The peak at 1643 cm−1 might be due to the O–H vibration of absorbed water. The peak at around 1032 cm−1 may correspond to the C–O–C vibration of the pyranose ring of cellulose. Also, spectral evidence of cellulose is provided by the vibration frequency at 1433 cm−1. FTIR spectroscopy was also studied for composite ZNTC_600_CNC and the spectrum can be observed in Fig. 2(B). The spectrum of ZNTC_600_CNC contains both the characteristic peaks of CNC and ZNTC_600, indicating the successful synthesis of the composite.
The morphology of the zinc titanates (ZnTiO3) calcined at different temperatures, carbon dot-doped ZnTiO3 and composite ZNTC_600_CNC was investigated by FESEM, as shown in Fig. 1(D)–(G), and it can be observed that all the systems have visibly different surface morphology. The change in the calcination temperature of the samples has impacted their surface morphology. All the samples show the formation of aggregates, but the structure of the aggregates varied from spheres and flakes to hexagons as the calcination temperature was varied. We can observe that when the sample was calcined at a temperature of 600 °C, spherical aggregates in the form of a dense forest can be seen, as shown in Fig. 1(D). In the case of the catalyst calcined at 700 °C, the surface morphology is observed to be flaky in Fig. 1(E). Similarly, for the samples calcined at 800 °C and 900 °C, slightly hexagonal structures can be observed in Fig. 1(F) and (G). Also, the nanocrystalline agglomerates’ sizes increased with the calcination temperature increase. The packing is also evidently tighter in the samples calcined at higher temperatures. Similar morphology for the carbon dot-doped systems ZNTP_600, ZNTP_700, and ZNTP_800 was also observed, as shown in ESI,† Fig. S3.
Raman spectroscopy provides essential information regarding the surface modes of solids and therefore, the as prepared systems were also analyzed by Raman spectroscopy. Fig. 1(H) shows the stacked Raman spectra of ZNTC_600, ZNTC_700, ZNTC_800, and ZNTC_900. ESI,† Fig. S2(D) shows the stacked Raman spectra of the carbon dot-doped ZNTP_600, ZNTP_700, and ZNTP_800. The Raman spectra were similar for these systems with Raman shifts at 140 cm−1, 145 cm−1, 230 cm−1, 225 cm−1, 227.5 cm−1, 341 cm−1, 396 cm−1, 441 cm−1, 443 cm−1, 448 cm−1, 510 cm−1, 607 cm−1, 612 cm−1, 637 cm−1, which correspond to different peaks of TiO2 and hexagonal ZnTiO3 with small peak shifts. All these peaks appear in the region of 0–1000 cm−1, representing the molecule's M–O stretches. The high-intensity peak at 140 cm−1 observed in the samples calcined at 600 °C, ZNTC_600 and ZNTP_600, may be due to the dominating Ti–O structures in the framework. However, the intensity of this peak decreases as the calcination temperature is increased. The Raman spectrum of CNC was also recorded and can be observed in ESI,† Fig. S2(D). Several peaks of various intensities are observed in the spectrum. A major high-intensity band is observed at around 1451 cm−1, indicating the cellulose's crystalline and amorphous nature and in this case, CNC has a higher resemblance to amorphous cellulose. Another band at 1327 cm−1 might be due to CH2 stretching and that at 1093 cm−1 is for C–O–C glycosidic linkage. The Raman spectrum of the composite ZNTC_600_CNC illustrated in Fig. 2(F) shows a closer resemblance of the system to ZNTC_600 with the characteristic high-intensity band at 140 cm−1, indicating the M–O framework.
Following the calcination step in the synthesis process, XPS analysis was performed to understand the chemical state of the surface. Using an ESCALAB250Xi Kα X-ray photoelectron spectrometer, operated at 200 eV and individual high resolution measurement at 50 eV, elemental analysis of the zinc titanate nanocellulose composite calcined at a temperature of 600 °C for 2 h was performed. The XPS measurements of the zinc titanates calcined at 700 °C, 800 °C and 900 °C, and the doped zinc titanate calcined at 600 °C were also performed. XPS measurements have an average penetration depth of approximately 10 nm, making it a near surface characterization technique in comparison to EDX and XRD. The XPS general survey spectra shown in Fig. 3(A) show the presence of peaks corresponding to Zn, Ti, O, and C, in all the samples of ZNTC_600, ZNTP_600, and ZNTC_600_CNC. These peaks correspond to the expected elements in the substrates.
The XPS core level analysis of the zinc titanate nanocellulose composite calcined at 600 °C was carried out for O 1s, C 1s, Zn 2p, and Ti 2p as shown in Fig. 3(A). The core level analyses of the zinc titanate samples and the doped sample calcined at 600 °C, ZNTC_600 and ZNTP_600 were also carried out and are shown in ESI,† Fig. S6. Fig. 3(B) shows the two photoelectron peaks at binding energies of 1021.8 eV and 1044.8 eV corresponding to Zn 2p3/2 and Zn 2p1/2 states, which demonstrated that the main chemical state of Zn was bivalent.8,39–41 The two peaks for the Ti 2p state located at binding energies of 458.6 eV and 464.4 eV as observed in the narrow scan spectrum shown in Fig. 3(C) can be assigned to the Ti 2p3/2 and the Ti 2p1/2 states and it agrees well with the previously reported literature, which corresponds to the tetravalent ions of titanium. These peak positions when compared with the Ti 2p peaks of TiO2 (Ti 2p3/2 = 459.4 eV and Ti 2p1/2 = 464.7 eV) show a shift towards a lower binding energy in the zinc titanate, which can be attributed to the strong electronic interaction between the Zn and Ti atoms.37 The Zn 2p3/2 and Ti 2p3/2 have similar peak features that are narrow and are highly symmetrical. This indicates the dominance of the bivalent and tetravalent states of Zn and Ti. The deconvoluted spectrum of O 1s shown in Fig. 3(D) at a binding energy of 529.8 eV is attributed to oxygen in the Zn–O–Ti bond on the surface, while O 1s at 532.9 eV is attributed to OH radicals absorbed on the surface.42
The ZNTC_600 and the doped ZNTP_600 samples also have similar binding energy values to that of the nanocomposite, as shown in Fig. S6 (ESI†). From Fig. S6(A) (ESI†), we observe two photoelectron peaks at binding energies of 1023.1 eV and 1046.4 eV corresponding to Zn 2p3/2 and Zn 2p1/2 states, which are in good agreement with the literature. These peaks are observed at binding energies of 1022.4 eV and 1045.5 eV for the sample ZNTP_600, as shown in Fig. S6(D) (ESI†). For Ti, the two peaks for the Ti 2p state are located at binding energies of 460.0 eV and 465.8 eV for the sample ZNTC_600, as observed in the narrow scan spectrum shown in Fig. S6(B) (ESI†). Similarly, for the sample ZNTP_600, from the narrow scan spectrum of the Ti 2p state as observed in Fig. S6(E) (ESI†), the two photoelectron peaks are observed at the binding energies of 459.1 eV and 464.7 eV, which correspond to the Ti 2p3/2 and the Ti 2p1/2 states, respectively. The narrow scan spectrum of O 1s, as shown in Fig. S6(C) and (F) (ESI†), shows the presence of two O1s peaks at binding energies of 529.6 eV and 531.5 eV for ZNTC_600 and at the binding energies of 529.9 eV and 531.4 eV for ZNTP_600, respectively. All these peaks correlate well with each other and agree well with the literature. However, unlike the symmetrical XPS peaks of the Zn 2p and Ti 2p states, we observe asymmetrical XPS O1s, probably due to oxygen in different forms on the surface.
Photocatalytic studies
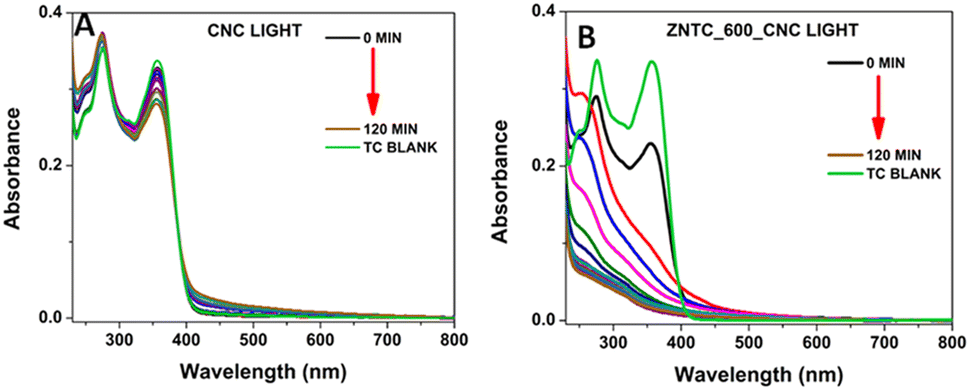
The photocatalytic efficiency of the samples ZNTC_600–900, CNC, and the ZNTC_600_CNC composite were studied for the degradation of TC-HC under light illumination and under dark conditions. Fig. 4 shows the UV-visible absorption studies of TC-HC in the presence of the as prepared ZnTiO3 catalysts calcined at different temperatures viz. 600 °C to 900 °C and their corresponding nanocellulose composite. The absorption maximum at 357 nm of TC-HC was monitored to calculate the photodegradation of TC-HC. It is evident from Fig. 4(A) that in the absence of the catalyst, the degradation of TC-HC was prolonged. However, the degradation of the TC-HC became very fast in the presence of different samples of ZNTC_600, ZNTC_700, ZNTC_800, and ZNTC_900, as evident from the decrease in absorption values as shown in Fig. 4(B)–(E). The photocatalytic activity of the ZNTC_600 was the highest, with a degradation efficiency of 98.27%. It was observed that as the calcination temperature increased, the photocatalytic activity of the samples decreased. The photocatalytic activity of ZNTC_600 for TC-HC in the dark was also investigated and the sample's degradation efficiency was determined to be 76.23%.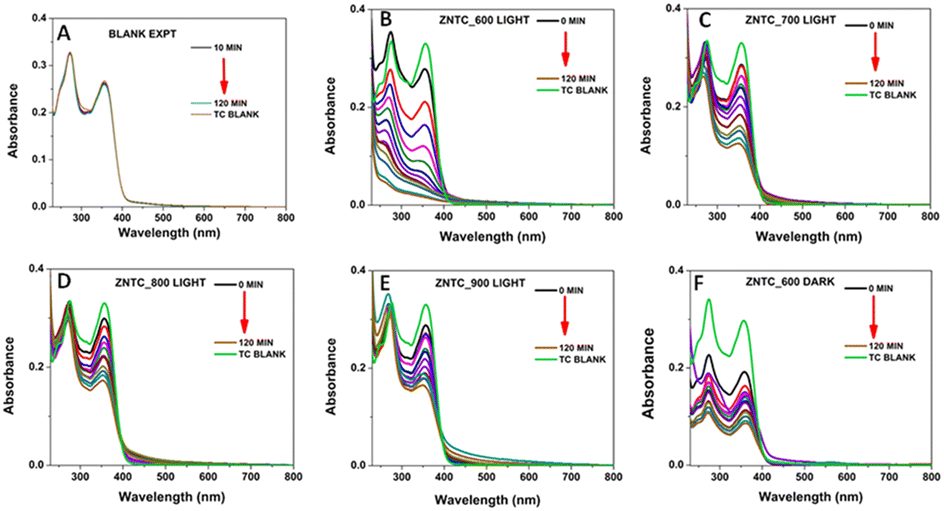 | ||
| Fig. 4 UV-Vis absorbance variations of TC-HC for 120 minutes in (A) the absence of catalyst and the presence of light and (B) ZNTC_600. (C) ZNTC_700, (D) ZNTC_800 and (E) ZNTC_900, and (F) in the dark in the presence of ZNTC_600. | ||
Similarly, the degradation of TC-HC was also studied for the carbon dot-doped zinc titanate samples. For the doped samples, it was found that the photocatalytic activity of the ZNTP_600 sample was the highest, with a degradation rate of 99.14%. The photocatalytic activity gradually decreased for the samples ZNTP_700 and ZNTP_800. In general, nano cellulosic materials are very good adsorbents; therefore, a composite of ZNTC_600 was made with nanocellulose derived from cotton to increase the degradation activity of the bare ZNTC system. Since the highest degradation rate was observed for the sample synthesized at 600 °C, the composite was made with the aforementioned sample. The photocatalytic efficiency of CNC and its composite with ZNTC_600, ZNTC_600_CNC, was also analyzed for the degradation of TC-HC.
From Fig. 5(A), it can be clearly deduced that the photocatalytic activity of CNC is low, with a degradation efficiency of 16.81%. However, the activity increased for the composite ZNTC_600_CNC, which has a degradation rate of 99.81%. It needs to be mentioned here that photodegradation of TC-HC was also studied in normal (tap) water and the results are shown in ESI,† Fig. S7. The ZNTC_600_CNC catalyst showed good degradation efficiency in this case also following the previous patterns with a degradation efficiency of 78.9%.
 | ||
| Fig. 5 UV-Vis absorbance variations of TC-HC for 120 minutes in the presence of light and (A) CNC and (B) ZNTC600CNC. | ||
The kinetics studies of photodegradation of TC-HC were performed in detail. Fig. 6(A) shows the comparative plot of C/C0vs. time for the as prepared samples. The plot shows the effect of the different samples in the degradation of TC-HC over time. It is quite evident that photodegradation of TC-HC is quite a bit faster in the presence of ZNTC_600, ZNTP_600, and ZNTC_600_CNC. Notably, in the presence of ZNTP_600 and ZNTC_600_CNC, TC-HC degrades faster in the first 60 minutes. Similarly, Fig. 6(B) corresponds to the kinetic curves of the as prepared samples and, as it can be calculated from the ln C0/C curves vs. t, the rate constants k for the as prepared samples. The rate constants of ZNTC_600–900, ZNTP_600–800, CNC, and ZNTC_600_CNC were determined to be 0.03 min−1, 0.008 min−1, 0.004 min−1, 0.005 min−1, 0.03 min−1, 0.003 min−1, 0.004 min−1, 0.001 min−1, and 0.05 min−1, respectively.
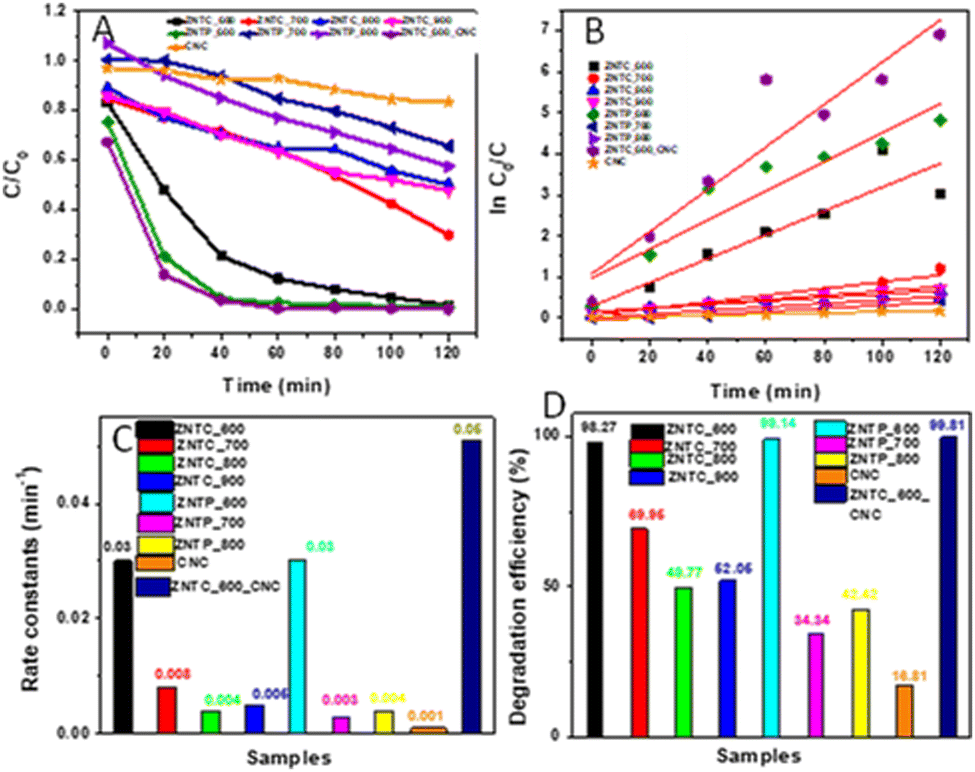 | ||
| Fig. 6 (A) Dynamic curves, (B) plots of ln(C0/C) versus time, (C) rate constants, and (D) degradation rates of TC-HC over different samples. | ||
The histogram plot of the rate constant determined was plotted and shown in Fig. 6(C). The plot clearly shows that in the presence the ZNTC_600_CNC composite the photodegradation of TC-HC is the fastest. Fig. 6(D) shows the histogram plot of the photodegradation efficiency in the presence of the as-prepared samples after 120 minutes of light illumination. The comparative plot clearly shows ZNTC_600, ZNTP_600, and ZNTC_600_CNC with the highest photocatalytic activity with degradation rates of 98.27%, 99.14%, and 99.81%, respectively.
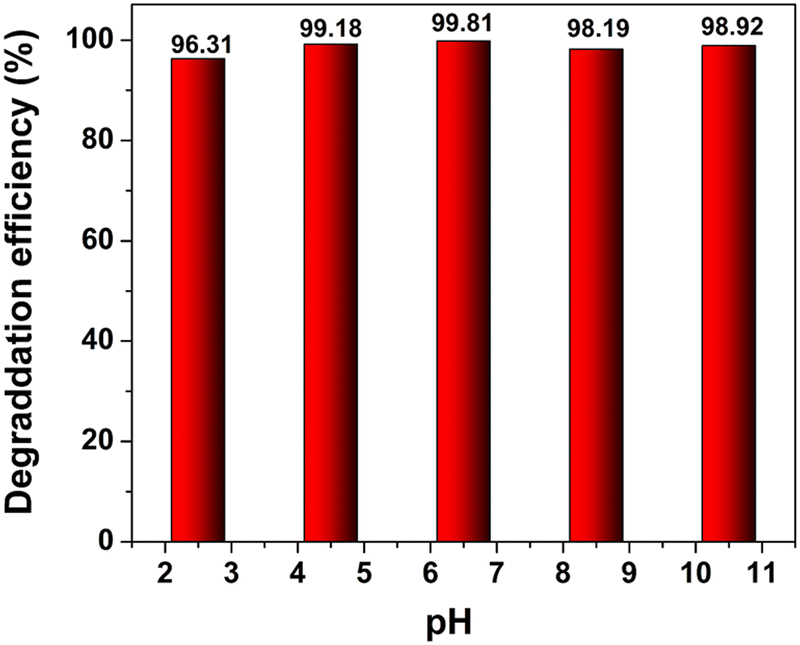
Generally, the pH of a solution confers a marked effect on the photocatalytic efficiency of a catalyst system towards the degradation of organic pollutants. To observe the effect of pH on the degradation of TC-HC, reaction solutions with pH values varying from 2 to 11 were prepared by adding HCl and NaOH. These reaction systems with various pH values did not show any significant variation in the degradation of TC-HC over the composite catalyst system as shown in Fig. 7. The unchanged degradation efficiency of the TC-HC at different pH values indicates the stability of the catalyst system.
 | ||
| Fig. 7 Effects of solution pH values on TC-HC degradation with sample ZNTC_600_CNC. | ||
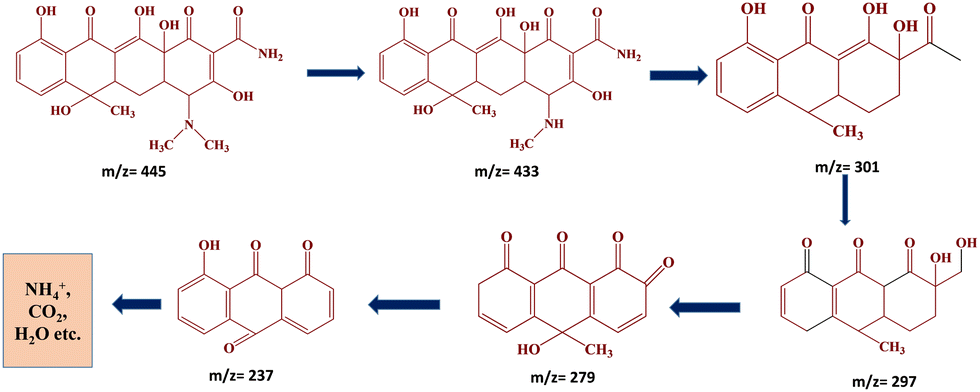
The degradation pathway of the tetracycline hydrochloride (TC-HC) was studied using the LC–MS technique. The MS spectra help in detecting and analysing the different degradation intermediates by analysing the variation in the characteristic peaks. The degradation product of tetracycline hydrochloride (TC-HC) in the presence of the ZNTC_600 photocatalyst was studied. ESI,† Fig. S8 shows the MS spectra of TC-HC solution over the ZNTC_600 photocatalyst after a degradation time of 120 min. Tetracycline hydrochloride has an intense peak at m/z = 445.42,43 This intense prominent peak at m/z = 445 of TC-HC gradually decreases over time as the reaction time proceeds. After 120 min of light irradiation, the TC-HC peak almost decreased and disappeared and other peaks with lower m/z values were generated. From the MS spectra in Fig. S8 (ESI†), we observe peaks of many intermediates in the chromatograms as shown in the figure (m/z = 301, 297, 279, 237, and 223). This demonstrates that TC-HC molecules are broken down gradually and the intermediates generated were also gradually degraded in succession, finally resulting in the formation of small molecules like NH4+, CO2, H2O, etc. during the reaction after a photodegradation time of 120 min. The possible degradation pathway of TC-HC and the intermediate products are displayed in Fig. 8.
 | ||
| Fig. 8 The possible degradation pathway and intermediate products of TC-HC degradation. | ||
BET analysis
The specific surface area and pore structure of photocatalysts also play a role in the photocatalytic activity. Hence, BET analysis was carried out on the three best samples demonstrating efficient photocatalytic performance. Fig. 9 shows the N2 adsorption–desorption isotherms and pore radius distributions of ZNTC_600, ZNTP_600, and ZNTC_600_CNC. All the three photocatalyst systems show comparable degradation efficiency and their specific surface areas are also similar. The adsorption–desorption isotherms of ZNTC_600, ZNTP_600, and ZNTC_600_CNC possess hysteresis loops in the range of 0.4–1.0 (P/P0), and the pore radius distributions range from 4 nm to 10 nm. The specific surface areas of ZNTC_600, ZNTP_600, and ZNTC_600_CNC are 35.462 m2 g−1, 23.873 m2 g−1, and 28.033 m2 g−1, respectively. From our studies the highest degradation efficiency of TC-HC was obtained for the composite ZNTC_600_CNC. However, the ZNTC_600_CNC composite possesses relatively lower specific surface area (28.033 m2 g−1) and small pore volume (0.092 cm3 g−1) in comparison to ZNTC_600 (surface area of 35.462 m2 g−1 and total pore volume of 0.128 cm3 g−1).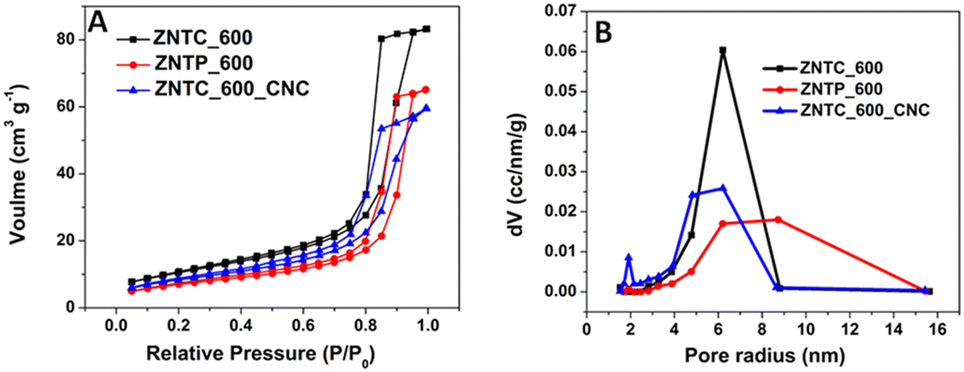 | ||
| Fig. 9 (A) N2 adsorption–desorption isotherms, and (B) pore radius distributions of ZNTC_600, ZNTP_600, and ZNTC_600_CNC. | ||
Considering the practical applications of the catalysts, the stability and reusability of the catalysts are crucial for accessing the performance of the catalysts. One of the aspects that is very important is the separation of the catalyst from the reaction mixture and the possibility to recover and reuse it. First the recyclability of the sample ZNTC_600 was analyzed by repeating the measurements for five cycles under light illumination. After each cycle, the sample was collected by centrifugation, washed, and dried for use in the next cycle. As shown in Fig. 10(A), the sample's degradation efficacy was unaffected even after 5 cycles and more than 90% degradation efficiency was achieved after each cycle under light illumination for 2 h. Here we want to mention that there is no observed leaching from the catalyst demonstrating its stability.
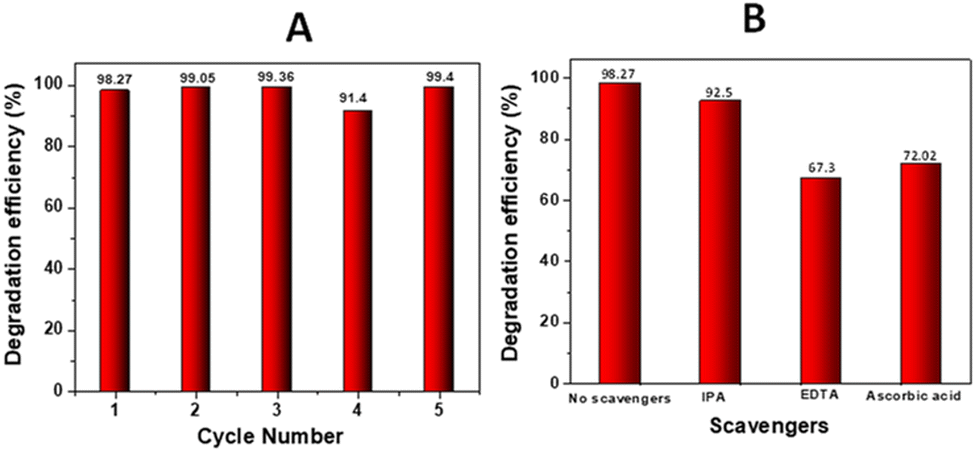 | ||
| Fig. 10 (A) Degradation efficiency after 5 cycles of TC-HC degradation in the presence of ZNTC_600. (B) Degradation efficiency of TC-HC in the presence of ZNTC_600 with different scavengers. | ||
Photocatalytic reactions produce active species that play a crucial role in the degradation process of organic pollutants. The active species produced in the photocatalytic reaction are hydroxyl radicals, holes (h+), superoxide ions (˙O2−) etc. Therefore, a radical scavenging experiment was carried out during TC-HC by ZNTC_600 as ZNTC_600 was demonstrated to have one of the best catalytic efficiencies in the present work. So, the photocatalytic efficiency of degradation of TC-HC was tested on ZNTC_600 in the presence of the hydroxyl radical scavenger isopropanol. Fig. 10(B) clearly shows that the degradation efficacy is only slightly reduced to 92.5% when compared to when no scavenger is added (98.27%). This indicates that hydroxyl radicals play no major impact in the degradation of TC-HC under light illumination. However, when the photocatalytic efficiency of degradation of TC-HC was tested on ZNTC_600 in the presence of hole (h+) and superoxide ion (˙O2−) scavengers, EDTA-2Na and ascorbic acid, respectively, the photocatalytic activity of ZNTC_600 drops from 98.27% to 67.3% and 72.02%, respectively, indicating that both holes and superoxide ions play pivotal roles in the degradation of TC-HC. Hence, it can be deduced that holes and superoxide ions have a more significant impact than hydroxyl radicals in the degradation process and holes have a slightly more significant impact than superoxide ions. The influence of the scavengers on the photocatalytic degradation of TC-HC in the presence of ZNTC_600 can be arranged in the descending order h+ > ˙O2− > ˙OH.
So, based on the experimental findings it can be gauged that preferentially, the TC-HC molecules at first get adsorbed on the surface of the catalyst. Under light irradiation, the electrons in the VB of the catalyst sample are transferred to the conduction band generating holes in the VB. Meanwhile, the electrons in the conduction band can reduce the O2 in the solution to produce ˙O2−. Light irradiation boosts the reaction between the photo-induced species, e− and h+ and the actives species of ˙O2−, H2O and ˙OH. Finally, the active species h+ and ˙O2− molecules interact with the pre-adsorbed TC-HC molecules on the surface and oxidize the TC-HC to produce CO2, H2O, and other smaller molecules, which can be observed from the MS spectra indicating the absence of larger m/z intermediates, which proves that the TC-HC molecules are degraded. A schematic of the photocatalytic activity of the composite is shown in Fig. 11.
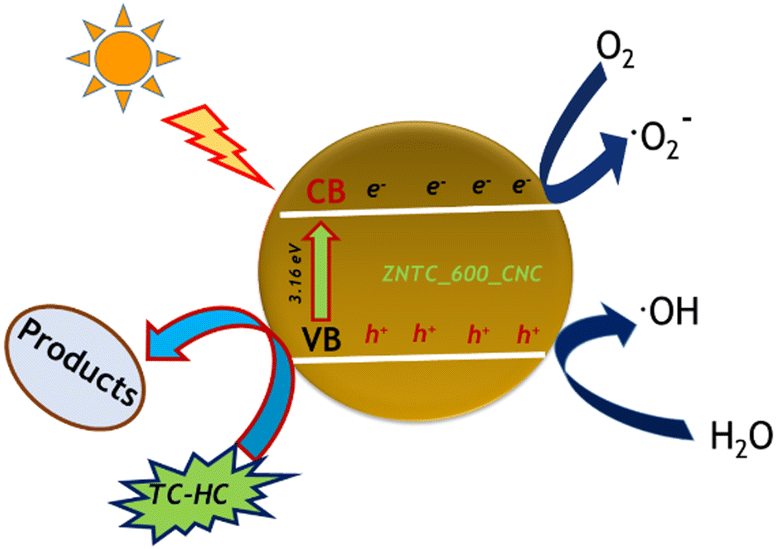 | ||
| Fig. 11 Schematic representation of the photocatalytic activity of the ZNTC_600_CNC nanocomposite. | ||
Along with the reusability of the catalyst, the stability of the catalyst is also important. The catalyst should exhibit a stable activity during use and when regenerated it should demonstrate similar activity level during several cycles. The XRD diffractogram and the SEM image of ZNTC_600_CNC after TC-HC degradation were also recorded, as shown in ESI,† Fig. S9. The diffractogram shows that the peaks are intact suggesting that the catalyst has superior stability and no organic impurities were adsorbed on the catalyst surface. This is supported by the SEM image that showed similar morphology with that of the catalyst sample before degradation.
Conclusions
In summary, this study successfully demonstrated synthesis of zinc titanate calcined at various temperatures in the range of 600–900 °C via a simple sol–gel technique. The bare zinc titanate was doped with polyethylene glycol carbon dots to form carbon dot-doped zinc titanate (ZNTP). A composite of zinc titanate and cotton nanocellulose was also synthesized and calcined at 600 °C to obtain the composite ZNTC_600_CNC. The synthesized materials were studied for their photocatalytic activity in the degradation of tetracycline hydrochloride under light illumination. The obtained ZNTC_600_CNC composite exhibits the highest degradation efficiency of 99.81% in the removal of tetracycline hydrochloride in the presence of light after 120 min. All the zinc titanate samples calcined at 600 °C including the bare zinc titanate (ZNTC_600) and the polyethylene glycol-doped zinc titanate (ZNTP_600) showed good degradation efficiency of tetracycline hydrochloride in the presence of light. The degradation rate constant of TC-HC over the ZNTC_600_CNC composite was 0.05 min−1. It was very interesting to note that the degradation efficiency of ZNTC_600_CNC is the same at pHs in the range of 2–11, thus demonstrating the stability of the catalyst system at all the pH range. Also, the zinc titanate catalyst showed good reusability with above 90% degradation efficiency after 5 cycles of usage. The insight into the photocatalytic reaction mechanism reveals that the active species influence in the descending order of h+ > ˙O2− > ˙OH−. Therefore, the present work shows promising results in the photocatalytic degradation efficiency of zinc titanate nanocellulose composites. The cost estimation of the catalyst is beyond the scope of this work; however use of cotton nanocellulose to prepare zinc titanate nanocellulose composites will help in reducing the cost of the catalyst.Author contributions
Jahnabi Gogoi: conceptualization, methodology, investigation, and writing original draft; Devasish Chowdhury: conceptualization, supervision, and writing original draft.Conflicts of interest
There are no conflicts to declare.Acknowledgements
J. G. thanks IASST for the fellowship. The authors thank Sophisticated Analytical Instrumentation Centre (SAIC), Institute of Advanced Study in Science and Technology (IASST), Guwahati (under the Department of Science & Technology, Government of India) for characterization techniques.References
- C. Liu, L. Tan, L. Zhang, W. Tian and L. Ma, Front. Environ. Sci., 2021, 9, 692298 CrossRef.
- S. I. Polianciuc, A. E. Gurzău, B. Kiss, M. G. Ştefan and F. Loghin, Med. Pharm. Rep., 2020, 231–240 Search PubMed.
- Y. Liu, J. Kong, J. Yuan, W. Zhao, X. Zhu, C. Sun and J. Xie, Chem. Eng. J., 2018, 331, 242–254 CrossRef CAS.
- S. Perween and A. Ranjan, Improved Visible-Light Photocatalytic Activity in ZnTiO3 Nanopowder Prepared by Sol-Electrospinning, Sol. Energy Mater. Sol. Cells, 2017, 163, 148–156 CrossRef CAS.
- G.-Y. Yao and Z.-Yn Zhao, J. Mater. Chem. C, 2020, 8, 8567 RSC.
- C. Feng, Z. Chen, J. Jing and J. Hou, J. Mater. Chem. C, 2020, 8, 3000 RSC.
- W.-Y. Chen, C.-P. Wang, P.-C. Chen, K.-Y. A. Lin, S. Ghosh, C.-W. Huang and V.-H. Nguyen, Catalysts, 2021, 11(7), 854 CrossRef CAS.
- S. S. A. Abdul Haroon Rashid, Y. M. Sabri, A. E. Kandjani, C. J. Harrison, R. K. Canjeevaram Balasubramanyam, E. Della Gaspera, M. R. Field, S. K. Bhargava, A. Tricoli, W. Wlodarski and S. J. Ippolito, ACS Appl. Mater. Interfaces, 2019, 11(32), 29255–29267 CrossRef CAS PubMed.
- N. K. Pandey, K. Tiwari and A. Roy, Bull. Mater. Sci., 2012, 35(3), 347–352 CrossRef CAS.
- M. G. Albu, T. G. Vladkova, I. A. Ivanova, A. S. A. Shalaby, V. S. Staneva, A. D. Moskova-Doumanova, Y. B. Dimitriev, A. S. Kostadinova and T. I. Topouzova-Hristova, Appl. Biochem. Biotechnol., 2016, 180(1), 177–193 CrossRef CAS PubMed.
- V. Ageh, H. Mohseni and T. W. Scharf, Surf. Coat. Technol., 2013, 237, 241–247 CrossRef CAS.
- R. Abirami, T. S. Senthil, S. P. Keerthana, R. Yuvakkumar, G. Ravi, M. Pannipara and A. G. Al-Sehemi, Ceram. Int., 2021, 47(13), 18122–18131 CrossRef CAS.
- L. Budigi, M. R. Nasina, K. Shaik and S. Amaravadi, J. Chem. Sci., 2015, 127(3), 509–518 CrossRef CAS.
- N. T. Nolan, M. K. Seery and S. C. Pillai, Chem. Mater., 2011, 23(6), 1496–1504 CrossRef CAS.
- S. Banerjee, S. C. Pillai, P. Falaras, K. E. O’Shea, J. A. Byrne and D. D. Dionysiou, J. Phys. Chem. Lett., 2014, 5(15), 2543–2554 CrossRef CAS PubMed.
- M. R. Mohammadi and D. J. Fray, J. Eur. Ceram. Soc., 2010, 30(4), 947–961 CrossRef CAS.
- S. Janitabar-Darzi and A. R. Mahjoub, J. Alloys Compd., 2009, 486(1–2), 805–808 CrossRef CAS.
- J. Arin, S. Thongtem, A. Phuruangrat and T. Thongtem, Res. Chem. Intermed., 2016, 43(5), 3183–3195 CrossRef.
- P. K. Jain, M. Salim and D. Kaur, Superlattices Microstruct., 2016, 92, 308–315 CrossRef CAS.
- S. Ayed, H. Abdelkefi, H. Khemakhem and A. Matoussi, J. Alloys Compd., 2016, 677, 185–189 CrossRef CAS.
- Z. Cai, J. Li and Y. Wang, J. Alloys Compd., 2010, 489(1), 167–169 CrossRef CAS.
- J.-C. Wang, C.-X. Cui, Q.-Q. Kong, C.-Y. Ren, Z. Li, L. Qu, Y. Zhang and K. Jiang, ACS Sustainable Chem. Eng., 2018, 6(7), 8754–8761 CrossRef CAS.
- R. T. Olsson, M. A. S. Azizi Samir, G. Salazar-Alvarez, L. Belova, V. Ström, L. A. Berglund, O. Ikkala, J. Nogués and U. W. Gedde, Nat. Nanotechnol., 2010, 5(8), 584–588 CrossRef CAS PubMed.
- Y. Habibi, Chem. Soc. Rev., 2014, 43(5), 1519–1542 RSC.
- T. Theivasanthi, F. L. Anne Christma, A. J. Toyin, S. C. B. Gopinath and R. Ravichandran, Int. J. Biol. Macromol., 2018, 109, 832–836 CrossRef CAS PubMed.
- X. Jaramillo-Fierro, S. González, H. A. Jaramillo and F. Medina, Nanomaterials, 2020, 10(9), 1891 CrossRef CAS PubMed.
- J. Abdi, M. Hadipoor, F. Hadavimoghaddam and A. Hemmati-Sarapardeh, Chemosphere, 2022, 287, 132135 CrossRef CAS PubMed.
- S. Ho, Y. Eun, H. Jho, S. Jeong, S. Choi, Y. Kal and S. Cha, Food Chem. Toxicol., 2018, 116, 108–113 CrossRef PubMed.
- H. Yuan, Q. Su, Y. Wang, J. Li, B. Liu, Y. Lia and P. Wu, RSC Adv., 2021, 11, 10975 RSC.
- A. O. Oluwole and O. S. Olatunji, Environ. Sci. Eur., 2022, 34, 5 CrossRef CAS.
- A. Hemmi, M. Belmedani, E. Mekatel, R. Brahimi and M. Trari, React. Kinet., Mech. Catal., 2021, 134, 1039–1054 CrossRef CAS.
- H. Wang, H. Yao, J. Pei, F. Liu and D. Li, Desalin. Water Treat., 2016, 57, 19981–19987 CrossRef CAS.
- R. D. C. Soltani, M. Mashayekhi, M. Naderi, G. Boczkaj, S. Jorfi and M. Safari, Ultrason. Sonochem., 2019, 55, 117–124 CrossRef CAS PubMed.
- A. R. Phani, M. Passacantando and S. Santucci, J. Phys. Chem. Solids, 2007, 68(3), 317–323 CrossRef CAS.
- C. Wang, R. Yan, M. Cai, Y. Liu and S. Li, Appl. Surf. Sci., 2023, 610, 155346.6 Search PubMed.
- M. Cai, C. Wang, Y. Liu, R. Yan and S. Li, Sep. Purif. Technol., 2022, 300, 121892 CrossRef CAS.
- M. Cai, Y. Liu, C. Wang, W. Lin and S. Li, Sep. Purif. Technol., 2023, 304, 122401 CrossRef CAS.
- S. Li, M. Cai, Y. Liu, C. Wang, K. Lv and X. Chen, Chin. J. Catal., 2022, 43, 2652–2664 CrossRef CAS.
- S. Li, C. Wang, Y. Liu, Y. Liu, M. Cai, W. Zhao and X. Duan, Chem. Eng. J., 2023, 455, 140943 CrossRef CAS; B. Ozturk and G. S. P. Soylu, Ceram. Int., 2016, 42(9), 11184–11192 CrossRef.
- Y. Cai, Y. Ye, Z. Tian, J. Liu, Y. Liu and C. Liang, Phys. Chem. Chem. Phys., 2013, 15(46), 20203 RSC.
- D.-C. He, Q.-M. Fu, Z.-B. Ma, H.-Y. Zhao, Y.-F. Tu, Y. Tian, D. Zhou, G. Zheng and H.-B. Lu, Mater. Res. Express, 2018, 5(2), 025006 CrossRef.
- D. Jiang, T. Wang, Q. Xu, D. Li, S. Meng and M. Chen, Appl. Catal., B, 2017, 201, 617–628 CrossRef CAS.
- S. Li, M. Cai, C. Wang and Y. Liu, Adv. Fiber Mater., 2023, 1–14 Search PubMed.
Footnote |
| † Electronic supplementary information (ESI) available. See DOI: https://doi.org/10.1039/d3ma00118k |
| This journal is © The Royal Society of Chemistry 2023 |