 Open Access Article
Metal deposition and electrocatalysis for elucidating structural changes of gold electrodes during cathodic corrosion†
Mohamed M.
Elnagar
 ,
Ludwig A.
Kibler
 * and
Timo
Jacob
 *
*
Institute of Electrochemistry, Ulm University, 89069 Ulm, Germany. E-mail: ludwig.kibler@uni-ulm.de; timo.jacob@uni-ulm.de
First published on 20th June 2023
Abstract
Several electrochemical conversion reactions occur under high cathodic currents, where electrocatalysts can experience substantial alterations in their surface structure through cathodic corrosion, influencing their electrocatalytic performance. Thus, understanding the structural changes of metal surfaces upon cathodic polarization is crucial for the rational design of active and stable electrocatalysts in the context of a transition towards green technologies. In this work, we probe the structural changes of Au surfaces after cathodic corrosion in 10 M NaOH and 10 M KOH at different potentials, using metal deposition and electrocatalytic surface-sensitive reactions. Cathodic polarization increases the electrochemically active surface area and alters the distribution of crystal facets, as evidenced by underpotential deposition of Pb and the electrochemical behaviour in 0.1 M H2SO4. The Au electrode surfaces obtained in NaOH and KOH exhibit different distributions and sizes of (111)-facets. The electrocatalytic activity of the restructured Au electrodes towards the formic acid oxidation reaction (FAOR) and the hydrogen evolution reaction (HER) is evaluated. The nanostructured Au electrodes obtained after polarization in NaOH show superior HER activity compared to those obtained in KOH, which is related to the formed nanostructures and the influence of low-coordination sites. Furthermore, the FAOR activity of the Au electrodes with higher (111)-contribution, achieved through polarization in 10 M KOH, is comparable to well-ordered Au(111) single crystals, emphasizing the key role of terraces in FAOR rather than surface steps as active sites responsible for the extraordinary HER activity. To further explore the electrocatalytic performance, we demonstrate the electrochemical fabrication of Pd–Au bimetallic nanostructures with varying contributions of (111)-facets, obtained through a combination of cathodic corrosion and electrodeposition. Remarkably, the electrocatalytic activity of Pd films on nanostructured Au electrodes towards FAOR in HClO4 and H2SO4 solutions is significantly enhanced compared to as-polished Au electrodes and is dependent on the contribution of (111)-facets. The present findings are relevant to the stability and long-term performance of cathodes in a variety of applications including electrosynthesis.
1. Introduction
Electrochemical energy conversion systems, including alkaline water electrolysis for H2 production, electroreduction of CO2 (CO2RR) to hydrocarbons, N2 reduction reaction (NRR), oxygen reduction reaction (ORR), and cathodic electro-conversion in organic electrosynthesis, and many more, are gaining momentum as a sustainable route for the production of “green” fuels and industrially relevant chemicals.1–12Indeed, the development of active, selective, and affordable electrocatalysts with high stability and long-term performance is the key element for the future progress and application of these electrochemistry-related technologies.13,14 Typically, the aforementioned electrocatalytic reactions take place in the presence of alkali metal or organic cations at high cathodic current densities. Under these conditions, the electrocatalyst can undergo substantial changes in its surface structure, i.e. roughness, surface morphology, grain boundaries, crystallographic orientation, and surface defects through a phenomenon known as cathodic corrosion.15–23 Despite cathodic corrosion being a degradation pathway that might be relevant for electrocatalyst stability and long-term performance, they remain primarily empirical observations in research communities dealing with energy conversion reactions that occur under reductive reaction conditions.
Cathodic corrosion is an electrochemical etching process that restructures and possibly dissolves metal surfaces upon polarization at sufficiently negative potentials in the presence of non-reducible cations.18,24–27 It is demonstrated that metal corrosion under cathodic polarization can arise in a range of conditions, from mild (at pH 7 and E = −1 V vs. SHE) to extremely harsh conditions (such as in a 10 M NaOH or KOH electrolyte and E < −5 V vs. SHE).19,28–32 For instance, Pt dissolution at moderate negative potentials during ORR in water and organic media was observed.29,30 In highly-concentrated electrolytes such as 10 M NaOH, the cathodic corrosion of Pt starts already at −1.3 V vs. SHE, resulting in highly anisotropic etching.32 In this context, the final surface structure and etching features of the metal electrodes upon cathodic polarization are governed by the electrolyte properties (i.e., nature and concentration of the cation, temperature, conductivity, viscosity, etc.), the polarization time, the applied electrode potential, and the electrochemical properties of the metal itself.16,18,19,26,33 Normally, the restructuring of metal surfaces can have a significant impact on its kinetics, intrinsic activity and selectivity, stability, and reaction mechanisms in (electro)catalysis.20,25,34,35 Thus, cathodic corrosion can also be beneficially applied to tailor the surface structure of an electrocatalyst, thereby unveiling sites with favorable catalytic properties.25,35 As such, cathodic corrosion holds promise as a powerful, affordable, and green electrochemical technique for the synthesis of catalytically active low-dimensional materials.24,35–39
Therefore, an in-depth understanding of cathodic corrosion and the subsequent structural changes of metal surfaces/electrodes is of central importance for research, development, and technological applications. This knowledge is necessary to obtain a consistent picture of the structural evolution of electrocatalysts during various electrochemical conversion reactions under highly reducing conditions, thus ultimately facilitating the rational design of active and corrosion-resistant electrocatalysts.
To understand the overall electrocatalytic behavior of metal electrodes, it is essential to correlate surface structure and activity over a wide range of length scales.34,40 From this perspective, electrocatalytic properties of simple electrochemical reactions can unambiguously resolve and characterize the surface structure of metal electrodes at a macroscopic scale in addition to approaches using anion adsorption or electrodeposition of foreign metals, e.g. by underpotential deposition (UPD).41,42
In this regard, both the formic acid oxidation reaction (FAOR) and the hydrogen evolution reaction (HER) are prominent structure-sensitive model reactions that allow for investigating the structure and dynamics of electrode surfaces. For example, the electrocatalytic HER has been employed to probe the kinetics of potential-induced surface reconstruction of Au(111) in contact with either 0.1 M H2SO4 or 0.1 M HClO4.43 Similarly, FAOR has been used to examine the alterations upon adsorption and self-assembly of the 4-mercaptopyridine on Au(111), as well as to monitor the kinetics of surface oxidation of Au(111).44,45 Furthermore, hydrogen and formic acid are ideal energy carriers, that have garnered considerable attention as prototype reactions in the advancement of sustainable energy technologies.46
Thin metal overlayers on well-defined substrates have emerged as promising model systems in electrocatalysis, showcasing remarkable influences of the substrate's chemical nature and crystallographic orientation, as well as the overlayer thickness, on electrocatalytic activity.47–50 For instance, Pd electrodeposition onto Au electrodes leads to the formation of pseudomorphic overlayers with single-crystalline features aligned to the substrate's crystallographic orientation, providing exciting prospects for fine-tuning electrocatalytic properties, while preventing the absorption of hydrogen into the Pd bulk.47,49,50
Moreover, Pd electrodeposited onto Au or Pt single crystals are well-established model systems that have been investigated for their electrocatalytic activity in the oxidation reactions of methanol, formic acid, and carbon monoxide.51–53 However, the investigation of Pd electrodeposition on cathodically-corroded Au electrodes remains unexplored. By leveraging the fundamental knowledge gained from studies of single-crystal electrodes, we may elucidate the structural changes occurring in metal electrodes during cathodic corrosion, a more complex system, and correlate them with electrocatalytic activity.
In this contribution, the electrodeposition of Pd overlayers is combined with electrocatalytic HER and FAOR for explicating the structural changes that occur on the electrode surface during the cathodic corrosion process. To achieve this objective, Au surfaces were polarized at different negative potentials vs. RHE for 60 s in 10 M of KOH or NaOH. Previously, we demonstrated that the cathodic polarization of polycrystalline Au electrodes in KOH and NaOH alters substantially the crystallographic orientation of surface facets, in which the (111)-facets are enriched but to a different extent.25,31 Furthermore, well-defined octahedral Au nanocrystals and triangular pits are formed by using NaOH and KOH solutions, respectively.25,31 Here, we examined the electrocatalytic behavior of these nanostructured Au electrodes towards HER and FAOR, aiming to understand the impacts of cathodic corrosion on the surface structure and catalytic activity of metal electrodes. Moreover, we employed cathodic corrosion and electrodeposition of Pd overlayers to modify the structure and composition of Au electrodes and demonstrated to which extent this strategy can enhance their electrocatalytic activity towards FAOR. This work not only advances our understanding of the structural changes in metal electrodes during cathodic corrosion, probed by electrocatalytic reactions but also provides a promising strategy for developing highly active electrocatalysts for various technological applications.
2. Experimental
2.1 Chemicals and solutions
Ultrahigh-purity water (18.2 MΩ cm, TOC ≤ 3 ppb) was used for the electrolytes, and for cleaning cells and glassware. The electrolyte solutions were prepared using H2SO4 (suprapur, Merck), HCl (suprapur, Merck), PdCl2 (99.999%, Sigma-Aldrich), Pb(NO3)2 (99.5%, Merck) NaOH (99.99%, Semiconductor grade, trace metals basis, Sigma-Aldrich), and KOH (99.99%, Semiconductor grade, trace metals basis, Sigma-Aldrich). The electrolytes were deaerated by bubbling with N2, before and during the experiments.2.2. Electrochemical experiments
Underpotential deposition (UPD) of Pb for characterization of the Au surface was performed with 0.1 M NaOH + 1.0 mM Pb(NO3)2 solution between −0.6 V and 0.05 V vs. Hg/HgO.
2.3. Instruments
All electrochemical measurements were conducted using a HEKA PG510 potentiostat. The morphological changes of the Au wires after cathodic polarization were observed using a ZEISS LEO 1550 VP scanning electron microscope (SEM) at an acceleration voltage of 10 kV.3. Results and discussion
3.1. Electrochemical characterization
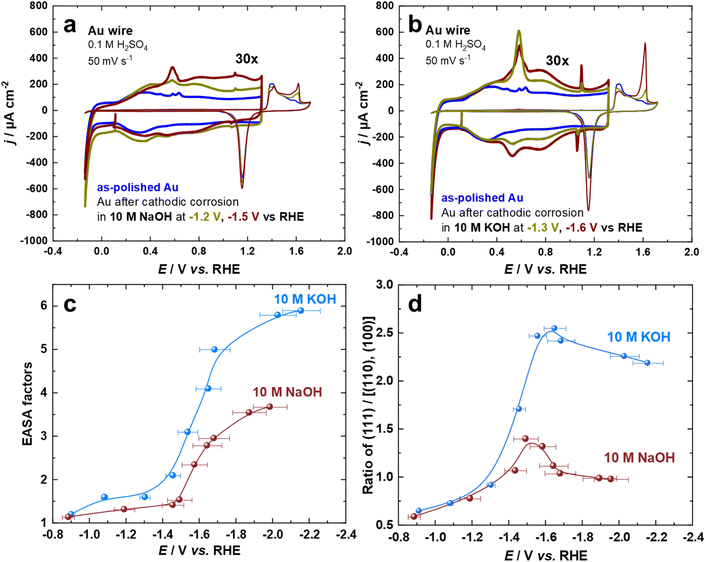
The cyclic voltammogram of Au surfaces in aqueous H2SO4 is extremely sensitive toward the coordination of the atoms on the electrode surface.54,55 Thus, the voltammograms of Au electrodes in 0.1 M aqueous H2SO4 were recorded for the so-called double-layer and the surface oxide regions at a scan rate of s = 50 mV s−1. Fig. 1a and b depict two sets of the first cycle of current–potential curves for Au electrodes before (black curve) and after cathodic corrosion in 10 M NaOH (at −1.2 V and −1.5 V) and 10 M KOH (at −1.3 V and −1.6 V vs. RHE) for 60 s. By identifying the distinct features in both regions, which correspond to different surface sites, we can obtain detailed information about the changes in the surface structure of the Au electrodes upon cathodic corrosion.55 In particular, several fingerprint reactions including anion adsorption and adlayer phase transitions are considered for the characterization of the polarized Au surfaces.55 The current in the voltammetric profiles is normalized to the electrochemically active surface area (EASA).The cathodically-polarized electrodes preferentially exhibit the characteristics of Au(111) surfaces but to a varying extent depending on the chemical nature of the cation and applied potentials, as can be observed in Fig. 1a and b. In the double-layer regime, the cyclic voltammograms demonstrate an enhancement in the anodic peak at around 0.60 V vs. RHE, which is attributed to the lifting of the (111) or (100) surface reconstruction by specific adsorption of sulfate anions.55 More specifically, an anodic spike at 1.10 V and a cathodic spike at 1.06 V vs. RHE, which are attributed to a two-dimensional phase transition within the sulfate adlayer on Au(111)-domains, appear after cathodic polarization.55 The sulfate spikes observed after polarization of Au electrodes in KOH are significantly sharper and have a higher charge density compared to those in NaOH, indicating the formation of larger Au(111) terraces. The broadening observed in the voltammograms of Au electrodes in the range between 0.8 V and 1.2 V vs. RHE after polarization in NaOH at E ≤ −1.5 V vs. RHE might be a sign of an increased defect density. In the oxide formation regime, the anodic current peaks at 1.61 V, 1.41 V, and 1.38 V vs. RHE are assigned to the oxidation of (111), (110), and (100)-oriented domains of the Au surface, respectively.54,55 The relative charge density of these anodic peaks directly reflects the distribution of the facets present on the surface of the Au electrodes. The increase in the number of (111)-sites upon cathodic polarization is also reflected by the significant enhancement of the surface oxidation peak at 1.61 V vs. RHE. Interestingly, the charge density of this peak is larger for Au electrodes polarized in KOH compared to those polarized in NaOH, revealing a larger amount of (111)-sites. Accordingly, the sharpness of the sulfate spike and the intensity of the surface oxidation peak are correlated.
The increase in EASA and alterations in facet distribution after cathodic polarization in 10 M NaOH and 10 M KOH at a wide array of applied potentials were analyzed by cyclic voltammograms (Fig. 1c and d). The EASA is calculated by matching the double-layer capacity of the cathodically-corroded and as-polished Au electrodes at 0.11 V vs. RHE. At this potential, there is neither a Faraday reaction nor an adsorption process, allowing for the determination of the EASA.18,25 The facet distribution of the Au electrodes is assessed by dividing the charge density of the peak associated with (111)-facets by the charge density of the peaks related to (100) and (110)-facets in the oxidation region of the cyclic voltammograms. Polarization of Au electrodes in KOH results in a considerably larger EASA and increased abundance of (111)-facets compared to NaOH, especially at highly negative potentials. The EASA is increasing by lowering the applied potential during cathodic corrosion in both electrolytes. The maximum EASA factors are about 3.7 and 5.9 after the cathodic polarization of Au electrodes in 10 M NaOH and 10 M KOH at −2.0 V and −2.1 V vs. RHE, respectively. Furthermore, the ratio of (111)-facets compared to (110)- and (100)-facets is enhanced by polarizing the Au electrodes at more negative potentials until E = –1.5 V for NaOH and E = –1.6 V vs. RHE for KOH before it decreases by further lowering the applied potentials. The maximum ratio of (111)-facets compared to other facets are 1.4 and 2.5 after the cathodic polarization of Au electrodes in 10 M NaOH and 10 M KOH, respectively. While the EASA monotonically increases with the applied voltage, there seems to be a potential region, where (111) facets are preferentially formed. The specific adsorption of alkali metal cations and/or the stability of Au facets at highly negative surface excess charge might play an important role in such behavior.
Underpotential deposition (UPD) of Pb has been extensively used to probe the surface structure of various Au electrodes, including bulk poly and single crystals, as well as nanostructures, as it provides unique fingerprints of the surfaces.56–59 Different crystal facets can display characteristic peaks linked to various orientations in both acidic and alkaline media. Therefore, we utilized Pb UPD to examine changes in the surface structure of Au electrodes upon cathodic corrosion in NaOH and KOH.
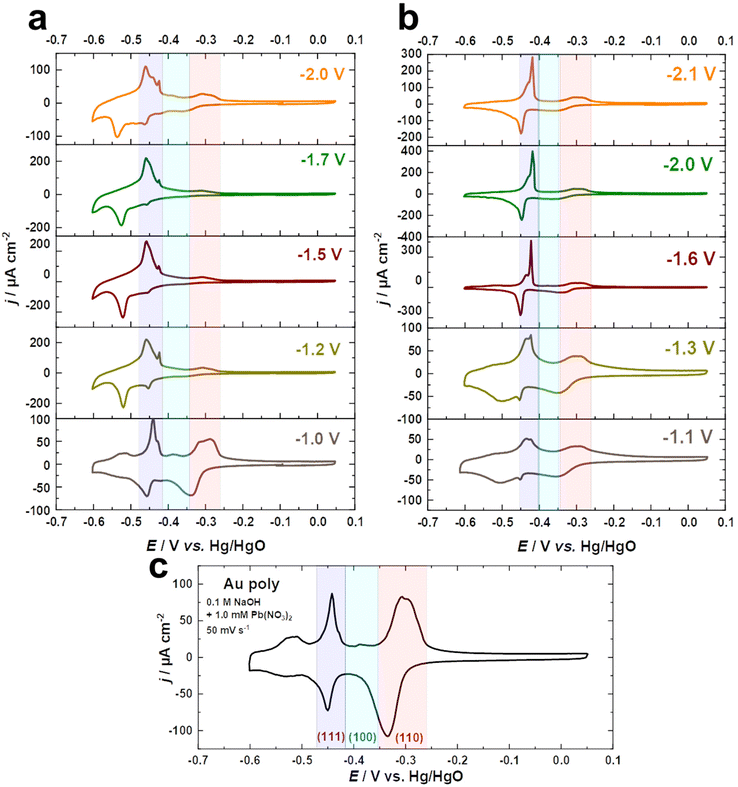
Fig. 2a–c compare the Pb UPD voltammograms of Au electrodes in 0.1 M NaOH + 1.0 mM Pb(NO3)2 at a scan rate of s = 50 mV s−1 before and after cathodic corrosion. The Pb UPD curve for the as-polished Au electrode shows two stripping peaks at around −0.52 V and −0.31 V vs. Hg/HgO, corresponding to terraces (<4-atom width) and steps of Au(110), respectively.57,59 Furthermore, the peak at −0.44 V is related to Au(111) facets, while the small peak at −0.39 V vs. Hg/HgO is attributed to Au(100) facets.57,59 After cathodic polarization in NaOH and KOH, significant changes in the facet distribution and EASA are observed. The peak associated with (111)-facets is markedly enhanced, accompanied by a decrease in the (110)-facets, but to varying degrees depending on the nature of the cation and the applied potential. The contribution of (111)-facets significantly increases after polarization in both electrolytes by polarizing Au electrodes at more negative potentials, reaching a maximum at around −1.5 V for NaOH and −1.6 V vs. RHE for KOH, before slightly decreasing with further lowering of the applied potential. Interestingly, the splitting of the peak corresponding to (111)-facets after cathodic corrosion indicates the formation of different sizes of (111)-domains.57,59 The narrower (111)-domains produce a peak at −0.44 V for the lead dissolution, whereas the peak at −0.42 V vs. Hg/HgO is linked with wider (111)-domains, as revealed by the investigation of Pb UPD on an Au(775) electrode.57,59 For a clear overview, the ratio between both peaks was calculated by dividing the charge density of the wider (111)-domains peak by the charge density of the narrower (111)-domains peak (Fig. S2†).
Fig. 2a–c and Fig. S2a† demonstrate that the cathodic polarization of Au electrodes in KOH generates Au electrodes with much wider (111)-domains and having higher crystallinity than those obtained in NaOH. Moreover, the shape of the peak associated with (111)-facets following polarization in KOH at E ≤ −1.6 V is comparable to that observed for Au(111) single crystals, whereas this peak is considerably broader after polarization in NaOH at E ≤ −1.2 V vs. RHE (Fig. 2a and b). Notably, the trends obtained for the ratio between (111)-domains after polarization in NaOH and KOH (Fig. S2†) are in line with the systematic series of sulfate spikes and the ratio of the (111)-facets for Au in H2SO4 (Fig. 1a, b and d).
Additionally, Pb UPD can be used to estimate the real surface area of an electrode.59 The EASA factors were determined by dividing the charge density of the anodic peaks of the UPD process between −0.6 and 0.05 V vs. Hg/HgO for the cathodically-corroded Au electrodes by that of the as-polished Au electrode (178.3 μC cm−2). Remarkably, the EASA values obtained from the Pb UPD (Fig. S2b†) are comparable to those obtained for Au in H2SO4 (Fig. 1c).
3.2. SEM analysis
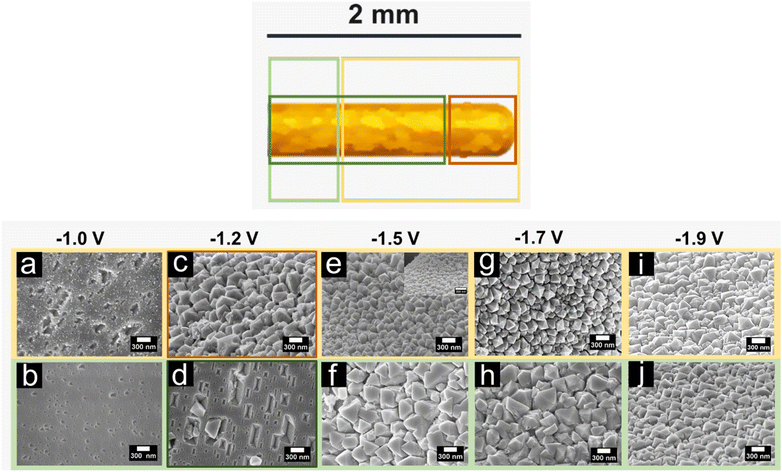
The SEM micrographs demonstrate that the cathodic corrosion of the Au surfaces generates etch pits and octahedral nanocrystals when treated in NaOH, while the use of KOH results in the formation of spherical nanoparticles and triangular pits. The extent of these cathodic corrosion features varies depending on the applied electrode potential. Thus, we conducted a systematic investigation to monitor the changes in the surface morphology of the Au electrodes after polarization at different applied potentials.Fig. 3a–j demonstrate changes in the local structure of Au surfaces after cathodic corrosion in 10 M NaOH for 60 s at different electrode potentials ranging from −1.0 V to −1.9 V vs. RHE. The corresponding SEM images are accompanied by a schematic illustration on the top, which highlights the different regions of the Au wire. Upon applying a potential of −1.0 V vs. RHE in 10 M NaOH, the entire surface being in contact with the electrolyte shows etch pits indicating Au dissolution (see Fig. 3a and b). The density of etch pits is higher at the tip than for the rest of the wire. Subsequently, by lowering the applied potential (E < −1.0 V vs. RHE), octahedral nanocrystals are formed. The growth of these nanocrystals occurs through dissolution and metal redeposition, as we previously demonstrated.31 The expansion of the area covered by the octahedral nanocrystals becomes more prominent as the applied potentials become more negative. When Au surfaces are polarized at −1.2 V vs. RHE, octahedral nanocrystals grow at the tip of the wire (about 170 μm in length), while rectangular etch pits are detected at the rest of the wire, as shown in Fig. 3c and d. On the other hand, octahedral nanocrystals of different ordering and sizes are primarily formed on the entire corroded area after polarizing the Au wires at potentials ranging from −1.5 V to −1.9 V vs. RHE, as illustrated in Fig. 3e–i. Smaller and more well-defined octahedral nanocrystals are noticed at most of the corroded wire (around 1.6–1.8 mm in length), whereas bigger octahedral nanocrystals with shape imperfections are visible at the rest of the wire. The size of the nanocrystals formed at the majority of the corroded wire (yellow-highlighted) decreases as the applied potential is lowered. Furthermore, the octahedral nanocrystals are more well-defined after polarization at −1.5 V compared to those obtained at −1.2, −1.7, and −1.9 V vs. RHE.
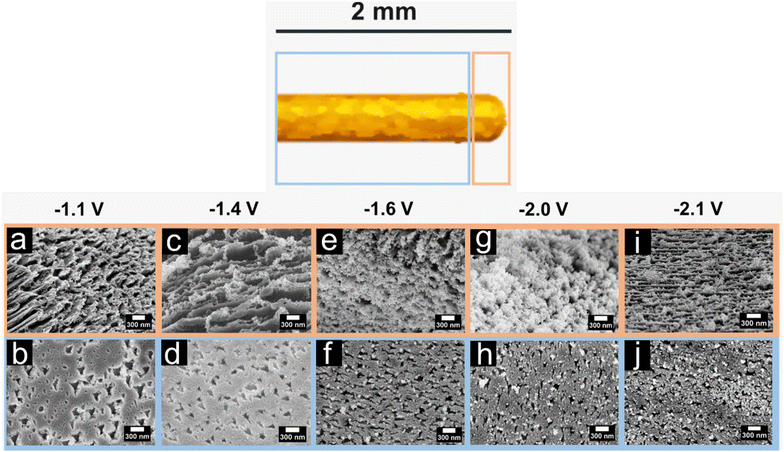
For comparison, we show the SEM images of Au surfaces after polarization in 10 M KOH at electrode potentials between −1.1 V and −2.1 V vs. RHE for 60 s (Fig. 4a–j). The corroded length of the wire exposed to the electrolyte increases at more negative potentials. After polarization at −1.1 V vs. RHE, only around half of the immersed wire (0.9 mm) is corroded, while complete corrosion occurs at E ≤ −1.4 V vs. RHE. The extent and severity of corrosion features are more pronounced at more negative potentials. After polarization at −1.1 V vs. RHE, a corrugated surface is observed at the tip, while triangular pits appear at a distance from the tip (Fig. 4a and b). The surface becomes rougher, and small clusters of irregular nanoparticles form at the tip upon lowering the applied potential to −1.4 V vs. RHE (Fig. 4c and d). Furthermore, the density of the triangular pits away from the tip increases. Further decrease of the applied potential to values negative of −1.4 V vs. RHE results in the formation of denser and preferentially-oriented nanoparticles at the tip (Fig. 4e–j). The area which is covered with these nanoparticles increases, where one can observe nanoparticles on the entire wire, but still, the number of nanoparticles is significantly lower on the rest of the wire than at the tip region. Additionally, the quantity of the triangular pits rises after polarization at potentials up to −1.6 V vs. RHE. Nevertheless, the number of well-ordered triangular pits is substantially lower for electrodes polarized at lower potentials (E < −1.6 V vs. RHE).
The differences in surface morphology between the tip region and the rest of the wire after cathodic corrosion in NaOH and KOH may be attributed to variations in the electric field due to the geometric effects. From a crystallographic standpoint, both octahedral nanoparticles and triangular pits reveal the presence of (111)-facets.60,61 Examination of cyclic voltammograms and SEM micrographs reveals that following polarization in 10 M NaOH, the EASA of Au electrodes is larger, particularly after polarization at potentials E ≤ −1.5 V vs. RHE (refer to Fig. 1c), where the formation of the octahedral nanocrystals is the prevailing feature. Further increase in the EASA is anticipated at more negative potentials, attributable to the smaller particle size and higher nanocrystal density within the corroded region. Moreover, Au electrodes with more well-defined octahedral nanocrystals exhibit a higher contribution from the (111) facets. In the case of Au electrodes polarized in 10 M KOH, the EASA demonstrates an increasing trend with more negative applied potentials (Fig. 1c), which might be due to the formation of additional nanoparticles and the partial dissolution of the surface, as indicated by the appearance of etch pits. Furthermore, as the applied potentials are lowered, a significant increase in the contribution of (111)-facets is observed, which can be linked to the higher density of triangular pits and nanoparticles. Comparing the Au electrodes after cathodic polarization in NaOH and KOH indicates that the formation of triangular pits leads to a significant enrichment of the (111)-facets, surpassing the contribution of octahedral nanocrystals. Additionally, the formation of small nanoparticles and etch pits is responsible for the greater EASA observed after polarization in KOH as opposed to NaOH. Theoretical calculations have proposed that during cathodic polarization, alkali metal cations might be specifically adsorbed and directly interact with the metal surface upon shedding part of their solvation shells.19 Therefore, the diverse surface morphologies observed and the ratio of (111)-facets as a function of the employed alkali metal cations may be due to their distinct adsorption tendencies and chemical properties.
3.3. The electrocatalytic behavior of cathodically-corroded Au electrodes towards FAOR and HER
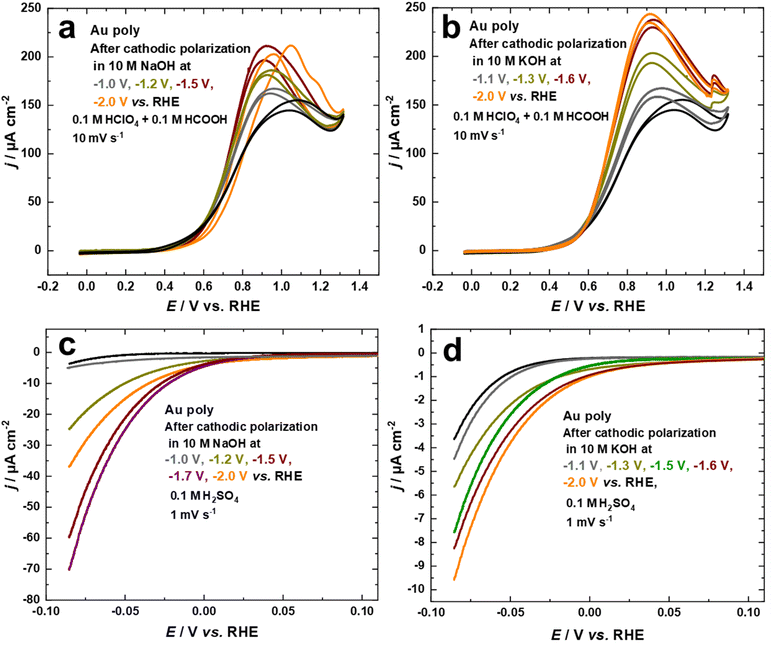
Studying the electrocatalytic response of an electrode surface is a useful tool to understand its surface structure. This is particularly relevant for structure-sensitive reactions, which can be employed to investigate the dynamics of structural changes.34,43 From this perspective, the electrocatalytic activity of the nanostructured Au electrodes, obtained through cathodic corrosion in 10 M NaOH and 10 M KOH at various applied potentials, was evaluated with the FAOR and HER.The electrocatalytic behavior towards the FAOR is investigated by comparing the current–potential curves for the Au electrodes in 0.1 M HClO4 + 0.1 M HCOOH at a scan rate of 10 mV s−1, as shown in Fig. 5a and b. To obtain the specific activity of the Au electrodes for FAOR after cathodic polarization in 10 M NaOH and 10 M KOH as a function of applied potentials, data from Fig. 1c and d were used to normalize the current density to the EASA. While the electrocatalytic activity of the Au electrodes differed according to the polarization conditions, the onset potential of FAOR is comparable for all Au electrodes, with FAOR starting at around 0.36 V vs. RHE, as depicted in Fig. 5a and b. The bell-shaped curve, a characteristic feature of FAOR on Au(111), is observed for Au electrodes after cathodic corrosion in 10 M NaOH and 10 M KOH. As the contribution of (111)-facets rises, the maximum current density of the bell-shaped oxidation peak increases. More importantly, the cyclic voltammograms of Au electrodes polarized in 10 M KOH show a step-up (kink) in current at 1.23 V vs. RHE, which corresponds to a phase transition within the strongly bound formate on well-ordered Au(111) surfaces (Fig. 5b).45,62 Interestingly, this kink is sharper as more (111)-facets are present on the electrode surface. The formation of wide Au(111)-terraces is evident from the appearance of this kink, which is characteristic of large and well-ordered Au(111) single crystal surfaces.45,62 These results demonstrate that cathodic corrosion of Au in KOH leads to the formation of much wider Au(111)-terraces compared to NaOH. Moreover, the trend observed for this kink is in excellent agreement with the systematic series of sulfate spikes for Au in H2SO4 (Fig. 3b) and the peaks related to Au(111)-domains in Pb UPD curves (Fig. 2 and Fig. S2†).
The electrocatalytic activity of the nanostructured Au electrodes obtained through cathodic corrosion in 10 M NaOH and 10 M KOH at various applied potentials is also studied for HER in 0.1 M H2SO4 solution at a scan rate of 1 mV s−1. We evaluated the HER activity of the Au electrodes in the potential regime where the IR drop is neglectable. Fig. 5c and d indicate that the cathodically-corroded Au electrodes exhibit higher HER activity compared to the as-polished Au electrode. However, the HER activity varies depending on the polarization conditions. The onset of HER for the as-polished Au electrode is ca. −0.03 V vs. RHE, which is comparable to the behavior of Au(111) single crystals. In comparison, the HER starts at lower overpotentials at ca. 0.05 V vs. RHE for Au electrodes obtained after cathodic corrosion in 10 M NaOH and 10 M KOH, which is comparable with that of polycrystalline platinum (ca. 0.08 V vs. RHE).63 The Au electrodes polarized in 10 M NaOH demonstrate much higher HER activity than those obtained after polarization in 10 M KOH. Furthermore, the HER activity of the Au electrodes increases after polarization in both electrolytes by lowering the applied potential, reaching a maximum at around −1.7 V for NaOH and −2.1 V vs. RHE for KOH. Further lowering of the applied potential to −2.0 V during polarization in 10 M NaOH results in a significant decrease in the HER activity. The unique electrocatalytic activity of Au electrodes towards HER, observed after cathodic polarization in 10 M NaOH, is attributed to the formation of octahedral nanocrystals. These nanocrystals are known to possess a variety of low-coordination sites such as steps, kinks, defects, edges, corners, and open (111) surfaces, which provide more active sites for HER.64 The SEM micrographs presented in Fig. 3 reveal that the size of the nanocrystals formed on the majority of the corroded wire decreases as the applied potential is lowered to −1.7 V vs. RHE. This leads to an increase in the density of nanocrystals, providing more active sites for HER. In contrast, the Au electrode polarized at −2.0 V vs. RHE has more flat facets and fewer edges and corners, as seen in Fig. 3i and j. Consequently, it exhibits lower HER activity compared to the other Au electrodes polarized at −1.5 V and −1.7 V vs. RHE.
Notably, the nanostructured Au electrode with the highest (111)-contribution, obtained after cathodic corrosion in 10 M KOH at −1.6 V vs. RHE, exhibits a higher HER activity than Au(111) and other planar Au single crystal surfaces. Hence, the role of low-coordination sites and the influence of nanostructures that are stable under reaction conditions must be considered.
The FAOR activity of the cathodically-corroded Au electrode with the maximum (111)-contribution, is remarkably comparable to that of Au(111) single crystals.62 This suggests that low-coordination sites, despite their enhanced HER activity, are not very active for FAOR. The active centers for HER and FAOR appear to be related to different atomic ensembles. In other words, FAOR is most active on (111)-terraces, while HER is extremely sensitive to low-coordination sites. These findings demonstrate that FAOR and HER are not only structure-sensitive reactions but also emphasize the importance of terraces, steps, and defect sites in the reaction mechanisms. Therefore, investigating electrocatalytic reactions with such cathodically-corroded Au electrodes helps in the identification of active sites that are absent for extended single crystal surfaces.
3.4. Electrochemical characterization of Pd overlayers on cathodically corroded Au electrodes
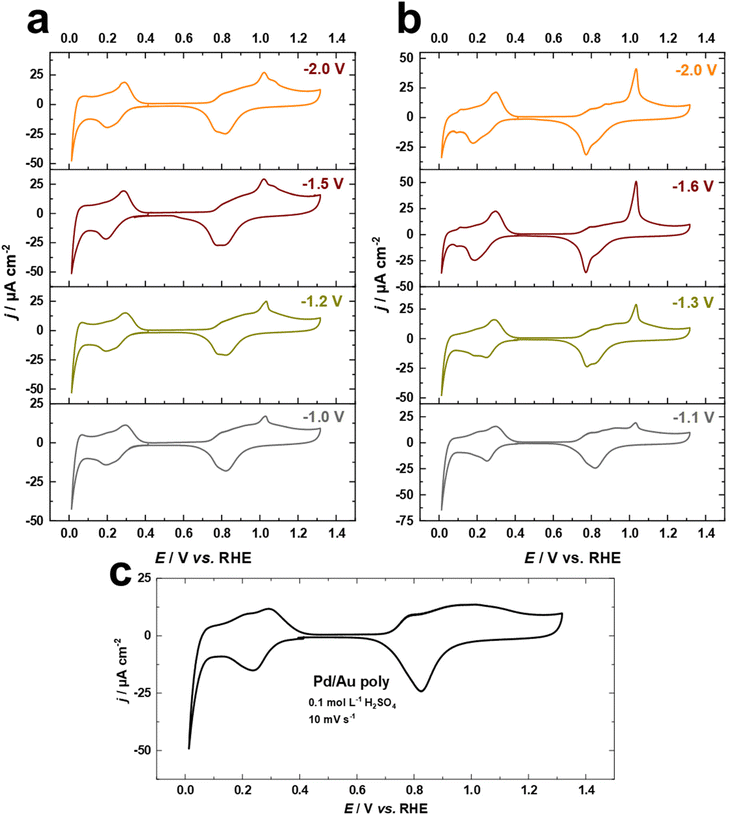
The electrodeposition of Pd overlayers on Au single crystals has been extensively studied.47,50,65 In this work, we utilize this knowledge to demonstrate the electrochemical behavior of Pd overlayers on cathodically-corroded Au electrodes, which exhibit varying facet distributions, roughness, and surface morphology. Cyclic voltammograms for Pd overlayers on Au electrodes in 0.1 M H2SO4 at a scan rate of s = 10 mV s−1, deposited from chloride-containing solution are shown in Fig. 6a–c. The equilibrium potential for Pd deposition in 0.1 M HCl + 0.1 mM PdCl2 was measured with a flame-annealed polycrystalline wire to be 0.4 V vs. Ag/AgCl (designated by the vertical line in Fig. S3†). There are no characteristic peaks for the Au surface anymore, indicating complete coverage of the substrate by Pd. In Fig. 6a–c, the voltammetric peaks observed between 0.2 V and 0.4 V are attributed to hydrogen adsorption.50,65 Notably, the absence of the hydrogen absorption peak, which typically appears between the onset potential of HER and around 0.1 V vs. RHE, indicates that the thickness of Pd overlayers is not larger than two or three monolayers.50,65 In addition, we observe systematic changes in the oxide formation regime at around 1.05 V vs. RHE, which are connected to the contribution of (111)-facets of Au surfaces (Fig. 6a and b). These observations imply that Pd electrodeposited onto cathodically-corroded Au electrodes grows epitaxially or even pseudomorphically, as in the case of Pd on Au single crystal electrodes, and thus adopts the crystallographic orientation of the substrate.47,65 Interestingly, the development of the peak at 1.05 V vs. RHE is consistent with the electrochemical behavior of Au electrodes in H2SO4 and the Pb UPD measurements. These findings suggest that the (111)-facets of the cathodically-corroded Au electrodes play a crucial role in the electrochemical behavior of Pd overlayers.3.5. Formic acid oxidation on Pd overlayers on Au electrodes
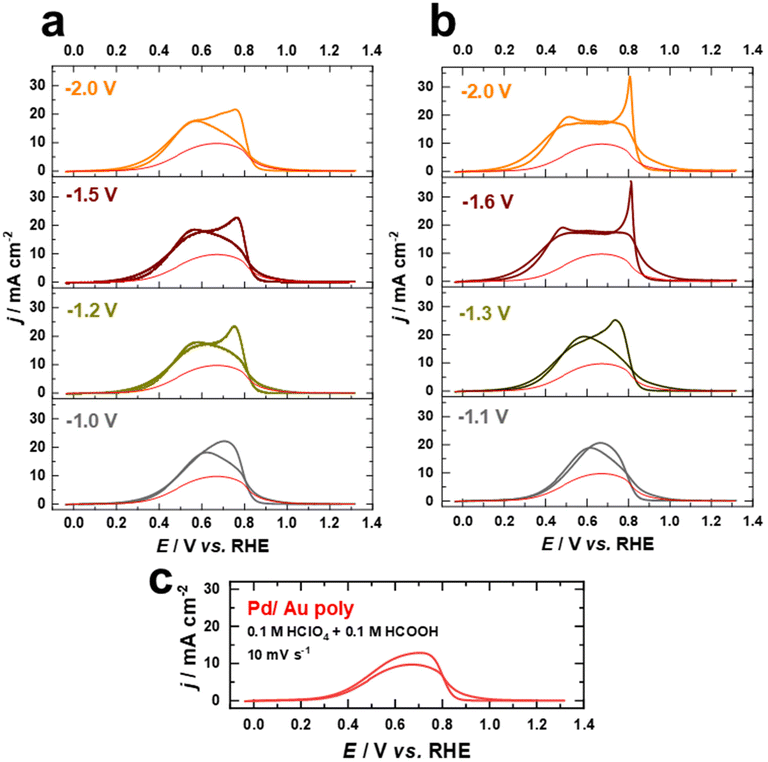
In the following, we present the electrochemical fabrication of Pd–Au bimetallic nanostructures with varying the contribution of (111)-facets by combining cathodic corrosion and electrodeposition for the first time. To demonstrate the sustainability and versatility of this strategy to obtain clean and active Pd–Au bimetallic nanostructures with tailored surface structures and compositions, we investigate the electrocatalytic activity of these bimetallic nanostructures for the FAOR in HClO4 and H2SO4 solutions. We selected these two electrolytes in order to explore the competitive adsorption between intermediate formate species and (bi)sulfate, compared to perchlorate.Fig. 7a and b illustrate the cyclic current–potential curves for formic acid oxidation on Pd overlayers deposited on nanostructured Au electrodes polarized at various potentials in 10 M NaOH and 10 M KOH, respectively. The oxidation of formic acid on these Pd overlayers in 0.1 M HClO4 + 0.1 M HCOOH electrolyte at a scan rate of s = 10 mV s−1 starts around 0.30 V vs. RHE and shows a clear dependence on the contribution of (111)-facets. The current in the voltammetric profiles is normalized to the EASA. The red curves represent the positive scan for FAOR on the Pd film on the as-polished Au electrode for comparison.
The current values increase as the applied potential in the positive direction is increased until reaching a maximum value of approximately 18 mA cm−2 at 0.56 V vs. RHE for the Pd films on the nanostructured Au electrodes polarized in NaOH (Fig. 7a), which is almost double the maximum activity of the Pd film on the as-polished Au electrode (9 mA cm−2 at 0.61 V vs. RHE). In comparison, the Pd films on Au electrodes polarized in 10 M KOH exhibit slightly higher electrocatalytic activity towards FAOR, reaching a maximum value of approximately 20 mA cm−2. Besides, the maximum current for FAOR occurs already at 0.46 V vs. RHE for electrodes with a higher contribution of (111)-facets (Fig. 7b). As the applied potential is further increased, the activity decreases due to surface deactivation caused by the formation of surface oxide species.53 After reversing the scan direction, a voltammetric peak with a maximum at around 0.75 V vs. RHE appears for Pd overlayers on both as-polished and nanostructured Au electrodes polarized in 10 M NaOH (Fig. 7a and c). This peak appears at a higher potential (0.81 V vs. RHE) in the reverse scan and is more pronounced for electrodes with a higher contribution of (111)-facets on which Au electrodes were polarized in 10 M KOH (Fig. 7b). This feature has been previously attributed to the fast activation of the FAOR after the reduction of the Pd or Pd–Au oxides.53,66 Notably, the currents from the negative and positive scans overlap, suggesting that the reaction proceeds essentially via direct HCOOH oxidation to CO2 as supported by previous studies.53,66,67
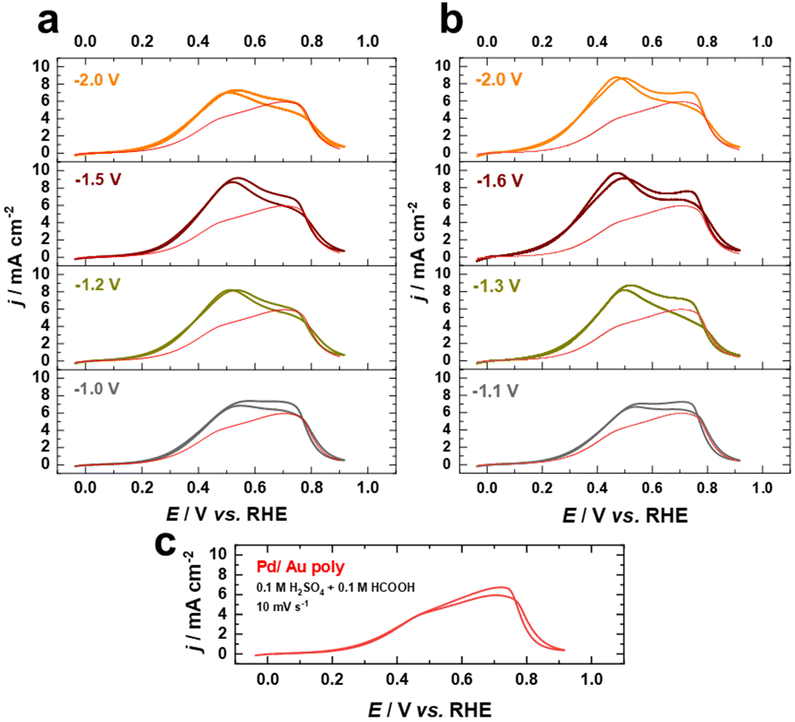
Fig. 8a–c display cyclic current–potential curves for the oxidation of formic acid on Pd films on nanostructured and as-polished Au electrodes in 0.1 M H2SO4 + 0.1 HCOOH electrolyte at 10 mV s−1 after normalization to the EASA. Cyclic voltammetric profiles reveal that the current for formic acid oxidation is significantly lower in the presence of sulfate, with the current at 0.5 V vs. RHE being lower by a factor of more than 2, indicating that the (bi)sulfate adsorption is a competitive process hindering formic acid oxidation. However, the FAOR starts on the fabricated electrodes at about 0.3 V vs. RHE in the presence of sulfate ions, which is similar to what is observed in the case of HClO4, revealing that the surface is not blocked by (bi)sulfate adsorption at this potential. The FAOR activity of the Pd overlayers on nanostructured Au electrodes increases upon increasing the applied potential in the positive direction up to ca. 0.5 V vs. RHE, where the activity is substantially higher than that of Pd on as-polished Au electrode (Fig. 8a–c). Furthermore, the Pd–Au nanostructures with a higher contribution of (111)-facets show higher FAOR activity. Interestingly, Pd–Au nanostructured electrodes have superior electrocatalytic performance for FAOR in HClO4 compared to bulk Pd single crystals, even after normalizing to the EASA. Moreover, the Pd overlayers on cathodically-corroded Au electrodes are much more active than on as-polished Au electrodes for FAOR due to the different surface structures. These findings demonstrate that cathodic corrosion of Au electrodes can not only increase the EASA, but also provide new catalytically active sites, thus enhancing the intrinsic activity of these electrodes. Consequently, our work sheds light on the design and fabrication of high-performance Pd–Au bimetallic electrocatalysts by tailoring the surface structure and composition and provides a valuable foundation for future studies in this respect.
4. Conclusions
Extensive investigations have been conducted on the structural stability of polycrystalline Au cathodes in concentrated alkali metal hydroxide solutions, covering a broad range of applied potentials. Substantial changes in the Au electrode surface structure are systematically elucidated using structure-sensitive electrocatalytic reactions (FAOR and HER), and metal underpotential deposition (Pb and Pd), which provide unique fingerprints and significant characterization of the surfaces before and after cathodic polarization. The results demonstrate that cathodic polarization may induce drastic changes in the surface morphology, the crystallographic orientation of surface facets, and the electrochemically active surface area (EASA) of Au electrodes, thereby exerting a profound influence on their electrochemical behavior and electrocatalytic performance. The cathodic polarization of Au electrodes in concentrated NaOH and KOH electrolytes leads to a distinct enrichment of (111)-facets, albeit to varying extents. Notably, Pb UPD indicates that cathodic polarization of Au electrodes in KOH results in Au electrodes with much wider (111)-domains and more single-crystalline nature than those polarized in NaOH. By studying FAOR and HER, distinctly different active sites formed during cathodic corrosion have been identified. The FAOR activity of the cathodically-corroded Au electrode with the maximum contribution of (111)-facets is remarkably similar to that of well-defined Au(111) single crystals. However, the HER activity of cathodically-corroded Au electrodes is substantially enhanced compared to both as-polished and single-crystal Au electrodes. Particularly, the nanostructured Au electrodes acquired in NaOH exhibit superior HER activity, highlighting the pivotal role of low-coordination sites. To further boost the electrocatalytic performance, we demonstrated the electrochemical fabrication of Pd–Au bimetallic nanostructures, which are engineered by varying the contributions of (111)-facets through a combination of cathodic corrosion and Pd electrodeposition techniques. Strikingly, the electrocatalytic activity of Pd films on the nanostructured Au electrodes towards FAOR in HClO4 and H2SO4 solutions is substantially enhanced in comparison to Pd films on as-polished Au electrodes. The findings presented in this work provide deep insights into the structural changes likely to occur at cathodes under highly reducing conditions, such as HER, CO2 and N2 reduction, as well as cathodic electro-conversion in various (organic) electrosynthesis reactions. In addition, cathodic corrosion holds promise as a powerful, affordable, and green electrochemical technique for the synthesis of catalytically active low-dimensional materials for various technological applications.Conflicts of interest
There are no conflicts to declare.Acknowledgements
This work was funded by the DFG (German Research Foundation) through project 501805371 as well as the SFB-CRC1316 and the priority program SPP 2248 Polymer-based Batteries (Project ID 441209207). Further, support by the BMBF (Bundesministerium fur Bildung und Forschung) through the project CASINO (FKZ: 03XP0487G) and the state of Baden-Wurttemberg and the DFG through grant no INST 40/574-1 FUGG is gratefully acknowledged.References
- J. C. Ehlers, A. A. Feidenhans'l, K. T. Therkildsen and G. O. Larrazábal, ACS Energy Lett., 2023, 8, 1502–1509 CrossRef CAS.
- Y.-G. Kim, A. Javier, J. H. Baricuatro, D. Torelli, K. D. Cummins, C. F. Tsang, J. C. Hemminger and M. P. Soriaga, J. Electroanal. Chem., 2016, 780, 290–295 CrossRef CAS.
- Y. Yang, C. R. Peltier, R. Zeng, R. Schimmenti, Q. Li, X. Huang, Z. Yan, G. Potsi, R. Selhorst, X. Lu, W. Xu, M. Tader, A. V. Soudackov, H. Zhang, M. Krumov, E. Murray, P. Xu, J. Hitt, L. Xu, H.-Y. Ko, B. G. Ernst, C. Bundschu, A. Luo, D. Markovich, M. Hu, C. He, H. Wang, J. Fang, R. A. DiStasio, L. F. Kourkoutis, A. Singer, K. J. T. Noonan, L. Xiao, L. Zhuang, B. S. Pivovar, P. Zelenay, E. Herrero, J. M. Feliu, J. Suntivich, E. P. Giannelis, S. Hammes-Schiffer, T. Arias, M. Mavrikakis, T. E. Mallouk, J. D. Brock, D. A. Muller, F. J. DiSalvo, G. W. Coates and H. D. Abruña, Chem. Rev., 2022, 122, 6117–6321 CrossRef CAS PubMed.
- S. L. Foster, S. I. P. Bakovic, R. D. Duda, S. Maheshwari, R. D. Milton, S. D. Minteer, M. J. Janik, J. N. Renner and L. F. Greenlee, Nat. Catal., 2018, 1, 490–500 CrossRef.
- X. Ge, A. Sumboja, D. Wuu, T. An, B. Li, F. W. T. Goh, T. S. A. Hor, Y. Zong and Z. Liu, ACS Catal., 2015, 5, 4643–4667 CrossRef CAS.
- E. Nishikawa, S. Islam, S. Sleep, V. Birss and J. Bergerson, Green Chem., 2023, 25, 229–244 RSC.
- S. Möhle, M. Zirbes, E. Rodrigo, T. Gieshoff, A. Wiebe and S. R. Waldvogel, Angew. Chem., Int. Ed., 2018, 57, 6018–6041 CrossRef PubMed.
- A. J. Martín, G. O. Larrazábal and J. Pérez-Ramírez, Green Chem., 2015, 17, 5114–5130 RSC.
- M. A. Mushtaq, M. Arif, G. Yasin, M. Tabish, A. Kumar, S. Ibraheem, W. Ye, S. Ajmal, J. Zhao, P. Li, J. Liu, A. Saad, X. Fang, X. Cai, S. Ji and D. Yan, Renewable Sustainable Energy Rev., 2023, 176, 113197 CrossRef CAS.
- S. Ibraheem, G. Yasin, A. Kumar, M. A. Mushtaq, S. Ibrahim, R. Iqbal, M. Tabish, S. Ali and A. Saad, Appl. Catal., B, 2022, 304, 120987 CrossRef CAS.
- R. Gao, J. Zhu and D. Yan, Nanoscale, 2021, 13, 13593–13603 RSC.
- P. Li, T. Zhang, M. A. Mushtaq, S. Wu, X. Xiang and D. Yan, Chem. Rec., 2021, 21, 841–857 CrossRef CAS PubMed.
- D. Hochfilzer, I. Chorkendorff and J. Kibsgaard, ACS Energy Lett., 2023, 8, 1607–1612 CrossRef CAS PubMed.
- Z. W. Seh, J. Kibsgaard, C. F. Dickens, I. Chorkendorff, J. K. Nørskov and T. F. Jaramillo, Science, 2017, 355, eaad4998 CrossRef PubMed.
- T. Wirtanen, T. Prenzel, J. P. Tessonnier and S. R. Waldvogel, Chem. Rev., 2021, 10241–10270 CrossRef CAS PubMed.
- S. J. Raaijman, N. Arulmozhi and M. T. M. Koper, J. Phys. Chem. C, 2020, 124, 28539–28554 CrossRef CAS.
- N. Arulmozhi, T. J. P. Hersbach and M. T. M. Koper, Proc. Natl. Acad. Sci. U. S. A., 2017, 117, 32267–32277 CrossRef PubMed.
- M. M. Elnagar, J. M. Hermann, T. Jacob and L. A. Kibler, Curr. Opin. Electrochem., 2021, 27, 100696 CrossRef CAS.
- T. J. P. Hersbach, I. T. McCrum, D. Anastasiadou, R. Wever, F. Calle-Vallejo and M. T. M. Koper, ACS Appl. Mater. Interfaces, 2018, 10, 39363–39379 CrossRef CAS PubMed.
- Q. Wei, P. Wang, Y. Ma, K. Du, H. Yin, H. Zhu and D. Wang, J. Electroanal. Chem., 2022, 923, 116833 CrossRef CAS.
- Y. G. Kim, J. H. Baricuatro, A. Javier, J. M. Gregoire and M. P. Soriaga, Langmuir, 2014, 30, 15053–15056 CrossRef CAS PubMed.
- J. Medina-Ramos, W. Zhang, K. Yoon, P. Bai, A. Chemburkar, W. Tang, A. Atifi, S. S. Lee, T. T. Fister, B. J. Ingram, J. Rosenthal, M. Neurock, A. C. T. Van Duin and P. Fenter, Chem. Mater., 2018, 30, 2362–2373 CrossRef CAS.
- S. Popović, M. Smiljanić, P. Jovanovič, J. Vavra, R. Buonsanti and N. Hodnik, Angew. Chem., Int. Ed., 2020, 59, 14736–14746 CrossRef PubMed.
- A. I. Yanson, P. Rodriguez, N. Garcia-Araez, R. V. Mom, F. D. Tichelaar and M. T. M. Koper, Angew. Chem., Int. Ed., 2011, 50, 6346–6350 CrossRef CAS PubMed.
- M. M. Elnagar, J. M. Hermann, T. Jacob and L. A. Kibler, Electrochim. Acta, 2021, 372, 137867 CrossRef CAS.
- M. M. Elnagar, T. Jacob and L. A. Kibler, Electrochem. Sci. Adv., 2022, 2, e2100175, DOI:10.1002/elsa.202100175.
- T. J. P. Hersbach and M. T. M. Koper, Curr. Opin. Electrochem., 2021, 26, 100653 CrossRef CAS.
- I. Evazzade, A. Zagalskaya and V. Alexandrov, J. Phys. Chem. Lett., 2022, 13, 3047–3052 CrossRef CAS PubMed.
- J.-M. Noël, Y. Yu and M. V. Mirkin, Langmuir, 2013, 29, 1346–1350 CrossRef PubMed.
- J. H. Bae, R. F. Brocenschi, K. Kisslinger, H. L. Xin and M. V. Mirkin, Anal. Chem., 2017, 89, 12618–12621 CrossRef CAS PubMed.
- M. M. Elnagar, L. A. Kibler and T. Jacob, J. Electrochem. Soc., 2022, 169, 102509 CrossRef CAS.
- T. J. P. Hersbach, A. I. Yanson and M. T. M. Koper, Nat. Commun., 2016, 7, 12653 CrossRef CAS PubMed.
- J. Simonet, E. Labaume and J. Rault-Berthelot, Electrochem. Commun., 1999, 1, 252–256 CrossRef CAS.
- C. L. Bentley, M. Kang and P. R. Unwin, J. Am. Chem. Soc., 2019, 141, 2179–2193 CrossRef CAS PubMed.
- T. J. P. Hersbach, C. Ye, A. C. Garcia and M. T. M. Koper, ACS Catal., 2020, 10, 15104–15113 CrossRef CAS.
- J. Feng, D. Chen, A. S. Sediq, S. Romeijn, F. D. Tichelaar, W. Jiskoot, J. Yang and M. T. M. Koper, ACS Appl. Mater. Interfaces, 2018, 10, 9532–9540 CrossRef CAS PubMed.
- P. Rodriguez, F. D. Tichelaar, M. T. M. Koper and A. I. Yanson, J. Am. Chem. Soc., 2011, 133, 17626–17629 CrossRef CAS PubMed.
- F. Lu, X. Ji, Y. Yang, W. Deng and C. E. Banks, RSC Adv., 2013, 3, 18791–18793 RSC.
- M. L. Kromer, J. Monzó, M. J. Lawrence, A. Kolodziej, Z. T. Gossage, B. H. Simpson, S. Morandi, A. Yanson, J. Rodríguez-López and P. Rodríguez, Langmuir, 2017, 33, 13296–13302 CrossRef PubMed.
- O. J. Wahab, M. Kang, E. Daviddi, M. Walker and P. R. Unwin, ACS Catal., 2022, 12, 6578–6578 CrossRef CAS PubMed.
- P. Sebastián-Pascual and M. Escudero-Escribano, J. Electroanal. Chem., 2021, 896, 115446 CrossRef.
- O. M. Magnussen, Chem. Rev., 2002, 102, 679–726 CrossRef CAS PubMed.
- J. M. Hermann, A. Abdelrahman, T. Jacob and L. A. Kibler, Electrochim. Acta, 2020, 347, 136287 CrossRef CAS.
- J. M. Hermann, H. Müller, L. Daccache, C. Adler, S. Keller, M. Metzler, T. Jacob and L. A. Kibler, Electrochim. Acta, 2021, 388, 138547 CrossRef CAS.
- F. M. Matzik, J. M. Hermann, L. A. Kibler and T. Jacob, J. Electrochem. Soc., 2022, 169, 116513 CrossRef CAS.
- D. Mellmann, P. Sponholz, H. Junge and M. Beller, Chem. Soc. Rev., 2016, 45, 3954–3988 RSC.
- L. A. Kibler, M. Kleinert, R. Randler and D. M. Kolb, Surf. Sci., 1999, 443, 19–30 CrossRef CAS.
- X. Chen, L. P. Granda-Marulanda, I. T. McCrum and M. T. M. Koper, Chem. Sci., 2020, 11, 1703–1713 RSC.
- L. A. Kibler, A. M. El-Aziz, R. Hoyer and D. M. Kolb, Angew. Chem., Int. Ed., 2005, 44, 2080–2084 CrossRef CAS PubMed.
- L. A. Kibler, A. M. El-Aziz and D. M. Kolb, J. Mol. Catal. A: Chem., 2003, 199, 57–63 CrossRef CAS.
- X. Chen, L. P. Granda-Marulanda, I. T. McCrum and M. T. M. Koper, Nat. Commun., 2022, 13, 38 CrossRef CAS PubMed.
- A. M. El-Aziz and L. A. Kibler, J. Electroanal. Chem., 2002, 534, 107–114 CrossRef CAS.
- M. Baldauf and D. M. Kolb, J. Phys. Chem., 1996, 100, 11375–11381 CrossRef CAS.
- S. Štrbac, R. R. Adžć and A. Hamelin, J. Electroanal. Chem. Interfacial Electrochem., 1988, 249, 291–310 CrossRef.
- A. Hamelin, J. Electroanal. Chem., 1996, 407, 1–11 CrossRef.
- J. Hernández, J. Solla-Gullón, E. Herrero, A. Aldaz and J. M. Feliu, J. Phys. Chem. C, 2007, 111, 14078–14083 CrossRef.
- C. Jeyabharathi, M. Zander and F. Scholz, J. Electroanal. Chem., 2018, 819, 159–162 CrossRef CAS.
- Y. Chen, S. Milenkovic and A. W. Hassel, ChemElectroChem, 2017, 4, 557–564 CrossRef CAS.
- J. Hernández, J. Solla-Gullón and E. Herrero, J. Electroanal. Chem., 2004, 574, 185–196 CrossRef.
- Y. Li, H. Lin, W. Zhou, L. Sun, D. Samanta and C. A. Mirkin, Sci. Adv., 2021, 7, eabf1410 CrossRef CAS PubMed.
- A. Speidel, R. Su, J. Mitchell-Smith, P. Dryburgh, I. Bisterov, D. Pieris, W. Li, R. Patel, M. Clark and A. T. Clare, Acta Mater., 2018, 159, 89–101 CrossRef CAS.
- L. A. Kibler and M. Al-Shakran, J. Phys. Chem. C, 2016, 120, 16238–16245 CrossRef CAS.
- H. Xu, J. Wan, H. Zhang, L. Fang, L. Liu, Z. Huang, J. Li, X. Gu and Y. Wang, Adv. Energy Mater., 2018, 8, 1800575 CrossRef.
- Y. Luo, W. Lou, H. Feng, Z. Liu, Q. Chen, G. Liao, X. Huang, P. Tsiakaras and P. Shen, Catalysts, 2023, 13, 97 CrossRef CAS.
- J. Tang, M. Petri, L. A. Kibler and D. M. Kolb, Electrochim. Acta, 2005, 51, 125–132 CrossRef CAS.
- E. Plaza-Mayoral, I. J. Pereira, K. N. Dalby, K. D. Jensen, I. Chorkendorff, H. Falsig, P. Sebastián-Pascual and M. Escudero-Escribano, ACS Appl. Energy Mater., 2022, 5, 10632–10644 CrossRef CAS.
- J.-Y. Wang, H.-X. Zhang, K. Jiang and W.-B. Cai, J. Am. Chem. Soc., 2011, 133, 14876–14879 CrossRef CAS PubMed.
Footnote |
| † Electronic supplementary information (ESI) available. See DOI: https://doi.org/10.1039/d3gc01614e |
| This journal is © The Royal Society of Chemistry 2023 |

