DOI:
10.1039/D3EY00174A
(Review Article)
EES. Catal., 2023,
1, 794-809
Atomically imaging single atom catalysts and their behaviors by scanning tunneling microscopy
Received
19th July 2023
, Accepted 30th August 2023
First published on 5th September 2023
Abstract
Understanding the mechanism of single-atom catalysis is essential to design and refine systems for improved catalytic performance. However, given the complex structure and large variety of single-atom catalysts (SACs), characterizing the single-atom catalytically active sites is extremely tricky and challenging. Over the past decade, although still far from satisfactory, scanning tunneling microscopy (STM) has helped provide numerous fundamental insights to understand single-atom catalysis. In this review, we summarize how STM enables atomically precise imaging of SACs including their geometric and electronic structures and their behaviors in the activation of absorbed small molecules, and how the combination of STM and other techniques helps to reveal charge states, charge transfers, dynamic reaction processes, and reaction mechanisms in single-atom catalysis. Finally, the future expectations on STM in three-dimensional, spatial and temporal imaging, and operando characterization are proposed. We believe that the combination of STM and single-atom catalysis is attractive and will further flourish heterogeneous catalysis research.
Broader context
Single atom catalyst (SAC) is an emerging star in the field of energy and environmental catalysis. However, given the complex structure and large variety of SACs, precisely identifying the single-atom catalytically active sites as well as understanding their catalytic origins have been very challenging. This review emphasizes the recent studies on atomically imaging the geometric and electronic structures of SACs by scanning tunneling microscopy (STM), and how STM combined with other techniques helps to recognize their charge states, charge transfers, and catalytic behaviors in the activation of absorbed small molecules, which could contribute to well-establish the structure–performance relationship of SACs. Finally, a perspective on STM in three-dimensional, spatial and temporal imaging, and operando characterization of SACs is presented.
|
Introduction
The desire for precise understanding of heterogeneous catalytic mechanisms has stimulated the invention and continuous development of many special characterization techniques, including X-ray photoelectron spectroscopy (XPS, since 1907), transmission electron microscopy (TEM, since 1931), scanning electron microscopy (SEM, since 1937), X-ray absorption spectroscopy (XAS, since 1947), infrared spectroscopy (IR, since 1957), etc. Based on the insights gained into the catalysts’ geometric and electronic structures by the aforementioned techniques, the understanding of reaction mechanisms (active sites, reaction pathways, adsorption/desorption modes, etc.) has gradually improved and deepened. However, most of the above-mentioned characterization techniques are still far from atomic resolution, and the spectroscopic techniques generally only offer averaged information, resulting in unsatisfactory identification of the catalyst's structure and the underlying catalytic behavior. In 1981, Rohrer, Binnig and Gerber at IBM Zürich invented scanning tunneling microscopy (STM), realizing the dream of visualizing a single atom.1 STM applies an atomically sharp metal tip as a sensitive probe to collect a tiny current between the metal tip and the sample surface, based on the quantum mechanical effect termed tunneling. For the tip-sample junction, when the tip-sample distance is less than 1 nm, the tunneling current decreases by a factor of ten as the distance increases by 0.1 nm. By keeping the tunneling current constant via the feedback loop, the height of each atom over the sample surface can be raster-scanned, which gives the atomically resolved surface morphology. Thus, STM can enable real-space imaging at an atomic scale. With tunneling electrons, STM imaging can be regarded as a non-destructive imaging technique, offering a powerful supplement to the destructive TEM imaging based on high-energy electron beams.
Recently, single-atom catalysts (SACs), referred to as the catalysts with atomically dispersed catalytic sites on support, have emerged as a new class of state-of-the-art catalysts with high atom utilization efficiency. As compared to nanoparticle-based catalysts, SACs possess much simplified and close to homogeneous structures of catalytically active sites, not only facilitating a comprehensive understanding of the catalyst's structure and catalytic performance relationship, but also assisting in unravelling the underlying catalytic mechanism. However, the local coordination environment of single atomic sites in SACs is complex and vulnerable, making it challenging to obtain a precise structure of the catalyst. STM offers a promising technique to characterize the precise structural information of SACs at the atomic scale. Thus, the combination of STM and single-atom catalysis can help to tackle the bottleneck problem of unclear catalysts’ structures in SACs, which is the current cornerstone in understanding the catalyst's structure and catalytic performance relationship as well as the reaction mechanism. Besides, the ability of STM to image and manipulate individual atoms2 offers another means to construct well-defined SACs. Although there have already been some excellent reviews that explain the power of STM as a tool to characterize SACs, a comprehensive summary of the functions of STM in the structural probing of SACs and mechanistic understanding of single-atom catalysis is still highly desirable. In this review, we first explain how STM can enable atomically precise imaging of SACs including their geometric and electronic structures and their behavior in the activation of small molecules, and then present how the combination of STM and other complementary techniques help to reveal charge states, charge transfers, dynamic reaction processes, and reaction mechanisms in single-atom catalysis. Finally, we close the review with future expectations of STM in three-dimensional, spatial and temporal imaging, operando characterization, etc.
Single atom imaging
The core of STM imaging is electron tunneling. Different from classical mechanics, an electron has a nonzero probability of tunneling through a potential barrier in quantum mechanics. Therefore, even though a barrier exists between two conducting electrodes, if the separation distance is small enough to overlap their wave functions, with applying a small bias voltage, electrons are capable of overcoming the barrier via the tunneling process to form a tunneling current. Based on this quantum mechanical effect, as shown in Fig. 1A, a set-up composed of an atomically sharp biased metal tip and a conducting surface was built as the heart of STM, which can be used to record a tiny tunneling current.3 The tunneling current is highly localized and exponentially dependent on the tip-surface distance, ensuring atomic-scale vertical and lateral spatial resolution. According to quantum mechanics, the tunneling current between the tip and the substrate sample can be conveniently written in terms of the local density of states (LDOS) of the sample.4| |  | (2) |
where κ is the decay constant, with a typical value of ∼1 Å−1 when the work function ϕ is ≈4 eV; V is the bias voltage; ρs(0, αEF) is the local density of states of the sample at the Fermi level; ΔZ is the tip-sample distance.
 |
| | Fig. 1 (A) Simplified basic set-up for STM. Reproduced with permission.3 Copyright © 2021, Springer Nature Limited. (B) Estimation of the lateral resolution in STM. Reproduced with permission.4 Copyright © 1993, Oxford University Press. | |
Further simplifying the equation, it can be found that the tunneling current is proportional to e−2ΔZ. Thus, the tunneling current is extremely sensitive to a minute variance of the tip-sample distance. The current decay is approximately e2 ≈ 7.4 times per Å, ensuring atomic-level vertical spatial resolution. Besides, the simplified spherical-tip model in Fig. 1B explains how atomic-scale lateral spatial resolution can be realized by tuning of the atomically sharp metal tip. To be specific, when the distance (less than 1 nm) between the tip and surface is much smaller than the tip radius (R), the current lines are almost perpendicular to the surface, and the lateral current distribution can be evaluated according to eqn (1).
| |  | (3) |
where
κ is typically ∼1 Å
−1, and Δ
x is the region deviated from the origin. Thus, for each tip radius (
R), the current distribution and the boundary (Δ
x) at which the current drops by an order of magnitude (
e−2) can be estimated.
e.g., for
R is approx. 100 Å, Δ
x is approx. 14 Å, meaning that the majority of the tunneling currents are concentrated within a distance of 14 Å from the origin. This is why STM can provide atomic-scale lateral spatial resolution. The actual achievements of STM have greatly exceeded the above expectations, and a spatial resolution of 2 Å has been routinely obtained after years of development.
Single atom catalyst imaging
STM invention allowed scientists to directly perceive individual atoms and molecules. The first demonstration of the atomic resolution capabilities of STM was realized on a Si (111)-7 × 7 surface by the team of inventors two years (in 1983) after the invention of STM.11 Since then, imaging of individual atoms and molecules in real space has become a tangible reality. With the subsequent rapid development, today's STM can easily achieve a lateral resolution of 200 pm and a vertical resolution of 1 pm, causing single-atom-based research to flourish. The important roles of single-site heterogeneous catalysts have been recognized in the field of heterogeneous catalysis for decades.12 In 2011, Zhang and co-workers proposed the concept of “single-atom catalysts (SACs)”, and realized 100% atomic dispersion of Pt on FeOx, which displayed outstanding stability and activity for the oxidation of CO.13 Inspired by this work, various types of SACs were developed and researched in the field of heterogenous catalysis.14–20 These pioneering landmark works not only draw attention to SACs, but also further highlight the importance of identifying individual metal atoms in SACs.
Being one of the techniques capable of realizing atomic-resolution imaging in real space, STM offers various advantages for the research on SACs. For single-atom catalysis, the unambiguous identification of individual catalytic sites in real catalysts is the first prerequisite for understanding the catalytic mechanism. STM was used to image individual metal atoms and study their impacts on catalytic behaviors long before the concept of single-atom catalysis was formed.5,21 For example, early in 2001, by means of STM, Besenbacher and coworkers observed the morphology change of MoS2 from triangular to hexagonally truncated, due to the preference of Co atoms at the S-edge, which provided insights into understanding the catalytically important edge structures of hydrodesulfurization catalysts.22 The clear formation of the concept of single-atom catalysis and their extensive follow-up research further made the combination of STM and single-atom catalysis science more fascinating. Various model SACs, such as Au–MgO, Pd–Fe3O4, Pt–CuO, Au–Fe3O4, Pt–CeO2, and Ir–Fe3O4, etc., were synthesized in an ultrahigh vacuum chamber and in situ observed via STM. The single metal atoms can be clearly distinguished from the support and generally observed as bright protrusions in STM. This is mainly because, under certain tip conditions, different metals exhibit different corrugations due to topographical and electronic differences, which can be discerned by STM, allowing them to be successfully distinguished.5,23 For example, when Au and CO were co-deposited on the surface of MgO under low temperatures in an ultrahigh vacuum chamber, as shown in Fig. 2A, the single Auδ− atoms were identified as isolated protrusions on the surface of MgO, obviously different from the surface and the dark depressions of CO. The commonly observed negative contrast of CO was ascribed to the absence of molecular orbitals that support electron transport around the Fermi level.5Fig. 2B presents the atomic-resolution image of Au-deposited Fe3O4(001), where the Au atoms are atomically dispersed and located exclusively at the narrow hollow sites between the Fe rows.6 Following a similar approach, Parkinson et al. successfully photographed via STM the atomically dispersed Pd and Ir atoms on Fe3O4(001), providing good platforms to investigate sintering induced by CO (Fig. 2C),7 and to figure out how the local coordination environment could affect CO adsorption.24 Apart from metal oxide supported SACs, Sykes's group conducted a large number of research studies on bimetallic alloy systems based on STM, where one type of metal was atomically dispersed on another metal single crystal, denoted as single-atom alloys (SAAs).8–10,25–35 Benefitting from STM, various model SAAs, including Pd-Cu, Pd–Au, Pt–Cu, Ni–Cu, Rh–Cu, etc., were constructed, characterized and investigated. For example, Pd–Cu SAAs were fabricated by evaporating trace amount of Pd adatoms (∼0.01 monolayer) onto the substrate Cu(111) by controlling the temperature of the substrate at 380 K. As shown in the STM image (Fig. 2D), the dopant Pd atoms display significantly brighter chemical contrasts than the host Cu metal atoms, indicating the successful alloying of the Pd atoms into the Cu lattice in an atomic manner.8 Similarly, isolated Pd atoms substituted into the Au(111) surface were also evidently revealed by STM (Fig. 2E), where Pd atoms possessed a slightly topographically higher appearance than the Au host. In combination with TPD and DFT calculation, this alloy provided an atomically precise platform to study differences in the energy landscapes of H2 adsorption, activation, and desorption on Au(111), Pd(111), and Pd–Au(111).9 Likewise, STM enabled the characterization of the atomic scale surface structure of Pt–Cu(111) alloys, and disclosed that the Pt atoms could be alloyed not only into the terraces of the surface but also the step edges (Fig. 2F).10 The construction of atomically resolved Pt–Cu(111) alloys guaranteed the follow-up research on their potential as the coke-resistant catalysts for efficient C–H activation.27
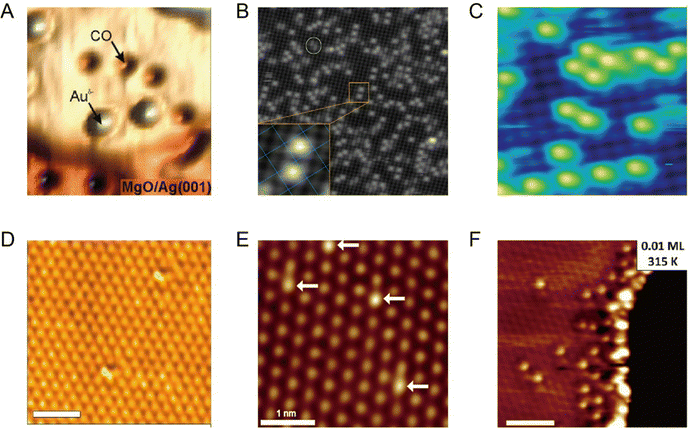 |
| | Fig. 2 (A) STM image of Au atoms and CO molecules on the MgO surface. Reproduced with permission.5 Copyright © 2010, American Chemical Society. (B) Atomic-resolution STM image of Au-deposited Fe3O4(001). Reproduced with permission.6 Copyright © 2012 American Physical Society. (C) STM image acquired after deposition of 0.2 monolayer Pd on the Fe3O4(001) surface at room temperature. Reproduced with permission.7 Copyright © 2013, Springer Nature Limited. (D) High-resolution STM image of a region above a step edge where individual Pd surface atoms reside. Reproduced with permission.8 Copyright © 2012, American Association for the Advancement of Science. (E) Isolated Pd atoms (highlighted by arrows) substituted into the Au(111) surface that appear slightly topographically higher than the Au host. Reproduced with permission.9 Copyright © 2016, American Chemical Society. (F) Atomic resolution STM image revealing Pt alloys in the surface at the ascending step edges. Reproduced with permission.10 Copyright © 2014, American Chemical Society. | |
Although the STM single-atom imaging technique is attractive, it remains challenging for a long time to distinguish different metal single atoms if more than one type of metal single atom is present in the system. Recently, Ajayi et al. reported that, the combination of STM and synchrotron X-rays, known as synchrotron X-ray scanning tunnelling microscopy (SX-STM), can help to differentiate different metal single atoms, disclosing their elemental type and chemical state simultaneously.36 There are two measurement regimes in SX-STM: tunnelling regime and far-field regime. For the far-field regime (Fig. 3A), the tip is positioned out of tunnelling range, at about 5 nm from the sample, and only X-ray-ejected electrons contribute to the measurements. For the tunnelling regime (Fig. 3D), the tip is positioned about 0.5 nm above the sample, where the tip-sample distance is within the tunnelling range (less than 1 nm). During the SX-STM measurement, both the sample and tip currents are simultaneously recorded as the X-ray absorption spectroscopy (STM-XAS) data. Taking Fe as an example, in the far-field regime test mode, both the sample current (Fig. 3B) and tip current (Fig. 3C) revealed the L3 and L2 absorption edges of Fe at 708.9 eV and 722.1 eV, which were produced by the 2p3/2 and 2p1/2 transitions of Fe to the unoccupied d orbitals, respectively. The sample current was about two orders of magnitude higher than that of the tip current; this was mainly because the sample current was generated by the entire X-ray-illuminated area, whereas the tip captured <1% of the ejected electrons in the far field. Thus, the far-field regime test mode establishes the general detection of the element type. As for the detection of single Fe atoms, it could be achieved via the tunneling regime test mode. When the tip was not located above Fe, such as position A in Fig. 3E, only the sample channel (Fig. 3F) exhibited Fe L2,3 edge signals similar to those in the far-field test mode, because the sample current in the tunneling regime was still mainly contributed by the entire X-ray-illuminated area. However, the tip channel did not show any Fe edge signals (Fig. 3G), which was because at a very close tip-sample distance, the solid angle for photo-ejected electrons being captured by the tip was greatly reduced and the Fe edge signal from the entire X-ray-illuminated sample area was no longer detectable. Only when the tip was positioned directly above the Fe atom (position B in Fig. 3E), the tip current displayed cogent L3 and L2 absorption edge signals of Fe (Fig. 3I). Thus, the X-ray-excited tunneling process was dominant in the tunneling regime in the tip channel (Fig. 3J). Because the quantum tunneling process is extremely sensitive to the atomic positions, the Fe signal in the tip channel is observed only when the tip is located directly above Fe in the tunneling distance. Besides, the chemical states of single metal atoms can be determined by using the near-edge X-ray absorption fine structure (NEXAFS) method. With STM-NEXAFS, both the sample channel and tip channel will show fine details of the satellite peaks that can be utilized to determine the valence state. Thus, with the combination of the far-field test mode and tunneling test mode, the characterization of a single metal atom and its chemical state can be realized.
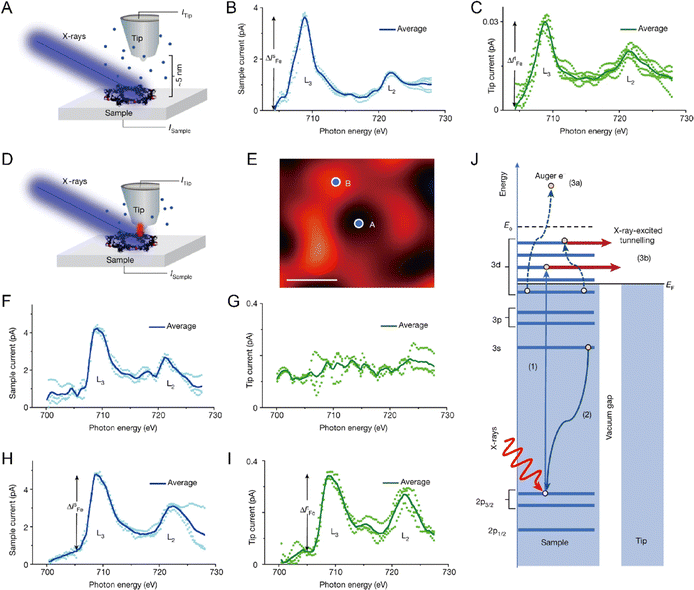 |
| | Fig. 3 (A) Schematic of SX-STM in the far-field regime. (B) STM-XAS spectra of the sample current. (C) STM-XAS spectra of the tip current. (D) Schematic of SX-STM in the tunnelling regime. (E) STM image of a single supramolecular ring measured with the SX-STM setup. (F–I) Simultaneously recorded STM-XAS spectra of the sample and tip channels in the tunnelling regime when the tip is on position A (F) and (G) and when the tip is on position B (H,I). (J) X-Ray-excited electron tunnelling process. Reproduced with permission.36 Copyright © 2023, Springer Nature. | |
To sum up, after decades of development, STM has been well-established and proven to be a powerful tool for characterizing SACs, as mentioned in numerous excellent reviews related to SACs37–57 and will definitely further evolve into a more intelligent platform for mechanistic studies with atomic-level precision.
Imaging to resolve the geometric and coordination structures of SACs
In SACs, atomically dispersed metal atoms are chemically coordinated onto the catalyst's support in the form of M-Ax (M, A, and x refer to the single metal center, the surrounding coordination element, and coordination number, respectively). The mutual interactions between the isolated metal and the host support are highly related to the coordination structures, where the electronic states can be tailored by changing M, A, x, etc.
In 2010, Zheng et al. theoretically proved that STM could image the changes of localized electronic states in both graphene and single-walled carbon nanotubes induced by heteroatom doping. Based on simulation, the substitutional single atomic nitrogen doping would induce a triangular bright-spot cluster pattern, and this distinct STM fingerprint was highly ascribed to the charge transfer from doping defects to the neighboring carbon atoms.58 In the same year, Bao et al. first experimentally resolved the electronic structure of N-doped graphene at the sub-nm scale by adopting low-temperature STM. The N doping caused an apparent perturbance on the electronic structure of graphene, as revealed by the increased brightness around the substitution site. STM simulation suggested that the bright spots were C atoms adjacent to N atoms rather than the heteroatoms themselves and were due to the increase in electron density of states (DOS) near the Fermi level.59 Shortly thereafter, Pasupathy et al. succeeded in visualizing individual graphitic N dopants in monolayer graphene by measuring the DOS in its vicinity. As seen in the nondestructive STM images at the nanoscale (Fig. 4A), the N atom confined in the graphene lattice resulted in the formation of three bright spots connected in a triangle. In combination with DFT simulation (Fig. 4B), each spot of this triangle could be determined to situate exactly at the nearest neighbor C atoms. This was because a friction of electron on the N dopant was delocalized to the neighboring C atoms, causing brighter contrasts on these C atoms. And this electronic perturbance was only constrained within a few lattice spacings from the dopant site. Besides, an out-of-plane height of ∼0.6 Å was revealed by the line scan through the dopant (Fig. 4A, inset), which was also consistent with the N atom substituting for a C atom in the plane of the graphene.60 Deng et al. further resolved the atomic and electronic structure of the Fe–N4 center embedded in an organic graphene matrix by low-temperature STM, where the single iron site was imaged as a bright spot, and the surrounding atoms were observed brighter than those C atoms far away from Fe (Fig. 4C and D).61 This strikingly different contrast from the pristine graphene lattice originated from the fact that the introduction of a single Fe atom significantly modified the DOS of adjacent C or N atoms. The modification by Fe was further confirmed by the appearance of a new electronic state near the Fermi level; a sharp resonance state at −0.63 eV in the scanning tunneling spectroscopy (STS, Fig. 4E) measurement indicated the strong mutual interaction between Fe and graphene lattice. Such observation provided direct visual proof that, in SACs, the incorporation of single metal atoms into the catalyst support would definitely cause a non-negligible modification to the DOS and form a promising active center.61,62
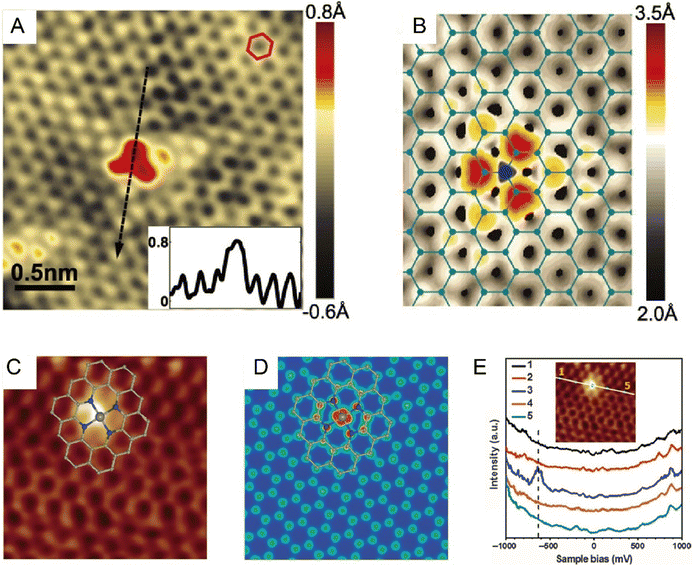 |
| | Fig. 4 (A) STM image of the most common doping form observed on N-doped graphene on copper foil, corresponding to a single graphitic N dopant. (Inset) Line profile across the dopant shows atomic corrugation and apparent height of the dopant. (B) Simulated STM image of graphitic N dopant based on DFT calculation. Reproduced with permission.60 Copyright © 2011, American Association for the Advancement of Science. (C) Low-temperature STM image of the Fe–N4 center embedded in an organic graphene matrix. (D) Simulated STM image. (E) dI/dV spectra acquired along the white line in the inset image. Reproduced with permission.61 Copyright © 2015, The Authors. | |
STM can help to resolve differences in the coordination structure of individual metal atoms in SACs. For example, in 2019, Parkinson et al. thermally evaporated 0.13 monolayers Ir onto Fe3O4(001) at room temperature, forming a model Ir–Fe3O4 single-atom catalyst.24 Based on this model catalyst, how the atomic and coordination structures of individual Ir sites affected CO adsorption was investigated. As shown in Fig. 5A and B, at 300 K, Ir adatoms located between the five-fold coordinated Fe rows possessed a two-fold-coordinated structure. In contrast, when heated at 623 K, the Ir atoms appeared as bright protrusions within Fe rows and possessed a five-fold-coordinated structure (Fig. 5C and D). And at 723 K, the bright protrusions turned a little bit hazy, as the Ir atoms were incorporated into the subsurface layer and possessed a six-fold-coordinated structure (Fig. 5E and F). The construction of Ir SACs with different coordination structures made it possible to distinguish the adsorption modes of CO, where CO binds more strongly with two- and five-fold-coordinated Ir atoms than metallic Ir, and the incorporation of Ir atoms in the subsurface would deactivate Ir for CO adsorption.
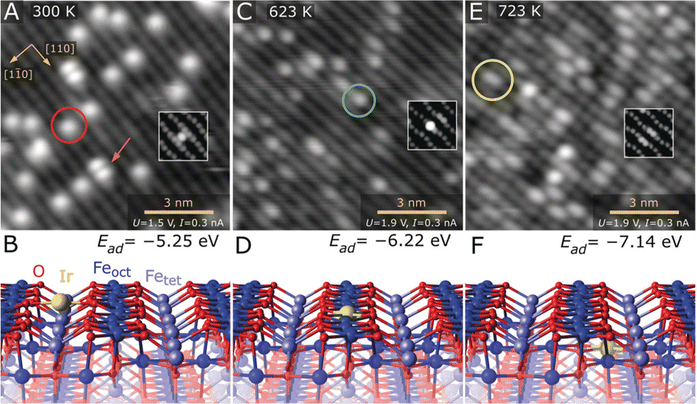 |
| | Fig. 5 (A) Ir1 atoms evaporated directly onto the Fe3O4(001) surface at 300 K, which are imaged as bright protrusions between the Fe rows of the support (red circle in STM image). (B) DFT-derived minimum-energy structure of the two-fold-coordinated Ir adatom on Fe3O4(001). (C) After annealing at 623 K, Ir atoms appear as bright protrusions within the Fe row in the STM image (green circle). (D) DFT-derived minimum-energy structure of the five-fold-coordinated Ir atom incorporated within the Fe3O4(001) surface. (E) At 723 K, some of the bright protrusions within the row are replaced by extended bright protrusions in STM (yellow circle). (F) DFT-derived minimum-energy structure of the six-fold-coordinated Ir adatom incorporated in the subsurface layer of Fe3O4(001). Reproduced with permission.24 Copyright © 2019 The Authors. Published by Wiley-VCH Verlag GmbH & Co. KGaA. | |
Compared to other surface characterization techniques, the most prominent feature of STM is that it not only can help to determine the binding and coordination information of adatoms, but also provide information on electronic states with atomic precision. Therefore, STM will play a pivotal role in constructing the structure–activity relationship in single atom catalysis.
Imaging to resolve the charge states of SACs
The charge state (CS) of the single metal atom center and the charge transfer (CT) across the metal-support interface significantly influence the catalytic performance of SACs. How to accurately ascertain CS and determine the amount of CT in SACs is still challenging. The advanced X-ray absorption spectroscopy (XAS) technique can be informative, but it is an area-averaging method. With atomically precise structural data provided by STM, in combination with other characterization data, analyzing the CT and CS of SACs at the atomic level could be possible, and would further shed light on single-atom catalysis.
In fact, the exploration on CS and CT of single metal atoms can be dated back to the early stage of the 21st century, but they were rarely linked to catalytic performance at that time. For example, in around 2010, Nilius et al. revealed that alumina thin film-supported Au adatoms were negatively charged and the Au chains contained three to seven Au atoms host up to three excess electrons.63,64 Based on STM/STS, Flynn and coworkers found that the Fe3O4(111) supported Au atoms were positively charged, while Au nanoparticles were metallic.21 In 2016, Libuda et al. systematically studied the CT process between Pt nanoparticles and the CeO2 support, and counted out that the charge per Pt atom showed a maximum of about 0.11 electrons at particle sizes between 30 and 70 Pt atoms. Firstly, the researchers investigated the particle density, size, and shape of Pt via STM, determining that the Pt particle size could be varied from 20 to 800 atoms per particle, corresponding to particle diameters between ∼1 and 3.5 nm, which are frequently observed dimensions in heterogeneous catalysis. Then using sensitive resonant photoemission spectroscopy, the researchers derived the surface concentration of Ce3+, thereby succeeding in counting the number of electrons that were transferred between the interfaces. As shown in Fig. 6, the number of electrons transferred per Pt particle, per Pt atom, and per surface area can be calculated, where the maximum CT per Pt atom is ∼0.11 electrons, and the counterpart per surface aera is 1.2 × 10¹⁸ electrons m−2.65 Although this work mainly dealt with nanoparticles, the same strategy can be applied to the supported SACs for counting CT and determining CS.
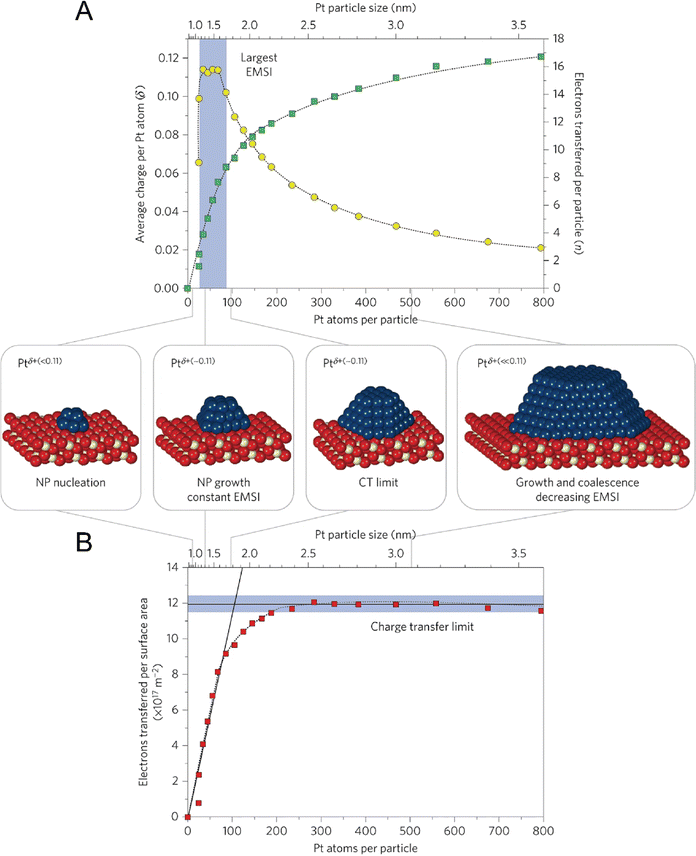 |
| | Fig. 6 Counting the electrons transferred due to the electronic metal-support interaction (EMSI). (A) The number of electrons transferred per Pt particle to the ceria support increases with increasing particle size (green squares). The partial charge per Pt atom reaches a maximum for particles with 30 to 70 atoms (yellow circles). (B) At higher Pt coverage, the total amount of transferred charge approaches a limit, which we denote as the ‘charge transfer limit’ (red squares). The atomic models show schematically the average particle sizes in different regions. Nanoparticle, NP. Reproduced with permission.65 Copyright © 2015, Springer Nature Limited. | |
In recent years, relying on STM, more and more studies linked the charge state of supported single metal atoms with the catalytic performance. For example, Wu et al. found that the CT from the CuO support to single Au atoms played a significant role in tailoring the CO oxidation activity. Benefitting from the presence of suitable potential wells, Au atoms were successfully trapped in an isolated form on the monolayered CuO film on Cu(110), as indicated by the isolated orange protrusions with uniform shape and size as displayed in Fig. 7A. It can be seen from the XPS data (Fig. 7B) that, as compared to the Au layers with neutral chemical state, the Au 4f of single Au atoms presented a downward shift in binding energy. In combination with the upward shift of O 1s, it can be concluded that, due to the charge transfer from the O of CuO to Au, the single Au atoms were negatively charged. Exposing CO at room temperature to this model SAC would induce the appearance of large amounts of dark vacancy features with about 0.3 Å in depth in the vicinity of Au atoms. The zoomed-in STM image (Fig. 7C and D) shows that these dark vacancy features are located exactly at the position of the lattice O, so these vacancy sites were ascribed to O vacancies, which were highly possibly created by the reaction between CO and the adjacent lattice O anions. Interestingly, exposure to O2 at 400 K would heal most of these oxygen vacancy sites (Fig. 7E), and the accompanying changes in Au 4f and O 1s during CO and O2 exposure further supported these hypotheses. Finally, the researchers proposed that the CO oxidation at Au single-atoms on CuO followed a typical Mars–van Krevelen mechanism (Fig. 7F), where the negatively charged Au single-atoms would be beneficial for the formation of CO2 by reacting CO with neighboring lattice O anions, accompanied by the generation of O vacancy and the neutralization of Au, and the O vacancy sites could be healed by oxygen exposure at high temperature, reactivating the activity of the Au-based SACs.66
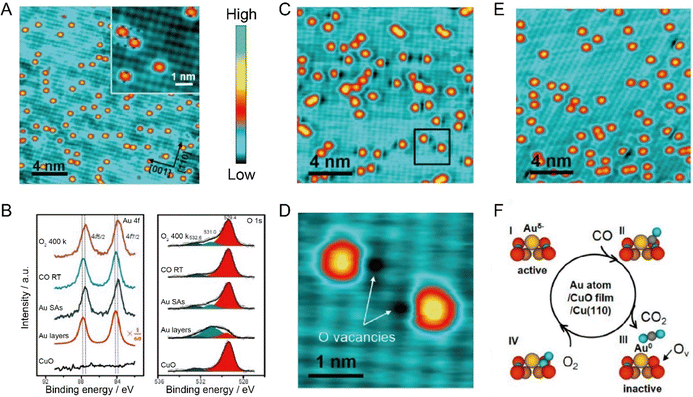 |
| | Fig. 7 (A) Au single-atoms on the CuO monolayer by depositing 0.05 monolayer Au at room temperature. Inset: Enlarged image of the Au single atoms. White and blue cycles represent the Cu and O ions, respectively. (B) XPS spectra of Au 4f and O 1s. (C) STM image of Au single atoms exposed to 18 L CO. (D) Enlarged STM image of the square area marked in panel C. (E) STM image of the sample re-exposed to 60 L O2 at 400 K. (F) Schematic illustration of the CO oxidation process activated by Au single-atoms on a CuO monolayer. Reproduced with permission.66 Copyright © 2018, American Chemical Society. | |
Imaging to resolve the dynamic reaction process in single atom catalysis
One of the most essential requirements for comprehensive understanding of single atom catalysis is the precise understanding of the catalytic process. However, chemical reactions are dynamic, meaning that resolving such a dynamic process requires the ability of characterization tools to achieve spatial and temporal resolution simultaneously. Besides, the single-atom catalytic process is a complex multifactorial process, where minor changes in the factors would possibly change the reaction pathway, which further challenges the related research. Although real-time imaging can be hardly achieved by standard STM with a typical image acquisition rate of ∼0.02 frames s−1, joyfully, it can be achieved by time-lapse STM or high-speed STM, guaranteeing direct observation of the dynamic reaction process at the atomic scale. Moreover, the atomically resolved images of SACs provided by STM can ensure the site-specific investigation. For example, the CO-induced movement of Pd adatom was clearly traced via STM imaging, explaining how single Pd atoms sintered into Pd nanoparticles and how surface hydroxy protected Pd atoms from sintering.7 By comparing the differences (Fig. 8A–D), it could be found that Pd(1) disappeared and Pd(2) increased brightness with an apparent higher height, while other Pd adatoms remained unchanged. Given this was the only change, the newly observed bright protrusion was considered to contain both Pd(1) and Pd(2). And the fuzzy appearance was a result of the adsorption of a CO molecule on Pd(1), forming a mobile Pd carbonyl complex (Pd1–CO). Later, the fuzzy feature jumped to Pd(3) and further hopped from Pd(3) to Pd(4), finally leaving Pd(2) and Pd(3) behind. This mobile feature of Pd adatoms was initiated by the adsorption of CO, which was in contrast to the stability of the Pd adatom on a surface hydroxyl. So, when Pd adatoms were exposed to CO (5 × 10⁻¹⁰ mbar) for a long time (15 min), sintering of Pd adatoms into large Pd nanoparticles could be observed, due to the formation of mobile Pd carbonyl species (Fig. 8E–H). Via time-lapse STM, Parkinson et al. also observed CO-induced sintering of Pt adatoms through the formation of Pt carbonyls (Pt1–CO), leading to their agglomeration into clusters. Besides, they also found that the presence of CO could also stabilize the smallest clusters against decay at room temperature.67 These visualizations of the coarsening process ascertained the acceleration effect by CO on the coarsening of catalytically active metal clusters. In 2018, Patera et al. realized real-time imaging of the growth process of a graphene flake on a single Ni atom by high-speed STM with frame rates of tens of hertz (Fig. 9), revealing the catalytic roles of single Ni atoms on the edge growth of graphene.68 The dynamic changes in the two kinds of edges of epitaxial graphene, zigzag (z) and Klein (k) edges, were acquired through a series of consecutive images, of which the bright features at the edges were attributed to mobile Ni adatoms. The Ni adatoms moved randomly until they reached the graphene edge, where they diffused parallel to the graphene edge with considerably longer residence time in the kink sites. Moreover, the Ni adatoms were imaged almost exclusively at the kinks, and the attached C dimers could be observed nearby in most cases, suggesting a catalytic role for individual Ni atoms.
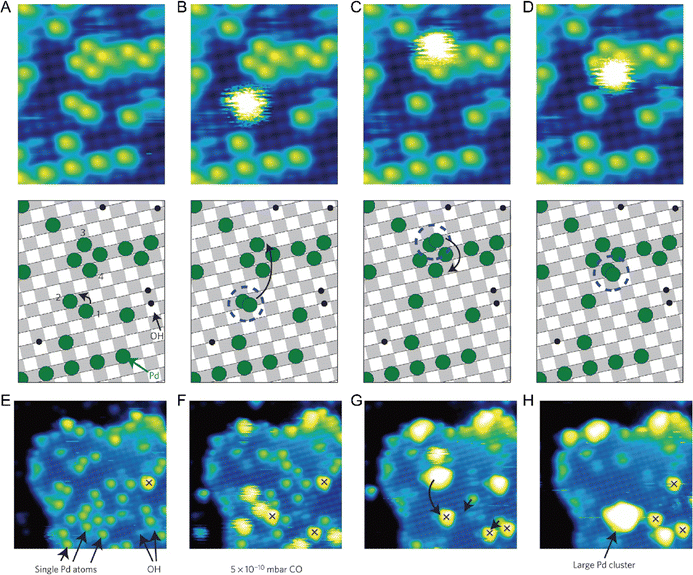 |
| | Fig. 8 CO-induced mobility of one Pd adatom. The four images (A)–(D) are selected from a longer STM movie acquired over the same sample area. The schematic model below each image shows the motion of the atom. (A) Initially, only isolated Pd adatoms and OH groups are observed. Between (A) and (B) adatom 1 adsorbs a CO molecule, forming a Pd carbonyl. The Pd carbonyl can diffuse easily on the bare surface, but is immobilized at Pd(2), forming a bright fuzzy feature. (B)–(D) The Pd carbonyl hops to atom 3 and then to 4, leaving behind its host Pd adatom in each case. (E)–(H) The CO-induced formation of a large Pd cluster. Four STM images were selected from a 36-frame STM movie following the deposition of the 0.2 monolayer Pd at room temperature. (E) Initially, isolated Pd atoms are present, together with hydroxyl groups and one OH–Pd (red cross). (F) After the background pressure of CO is raised to 5 × 10⁻¹⁰ mbar for thirty minutes, several mobile ‘fuzzy’ Pd carbonyl species, trapped at other Pd atoms, have formed. (G) Shortly afterwards, three Pd carbonyls and four adatoms have formed a large cluster. (H) Twenty-five minutes later, the cluster has captured another Pd carbonyl, and diffused to merge with an OH–Pd species. Reproduced with permission.7 Copyright © 2013, Springer Nature Limited. | |
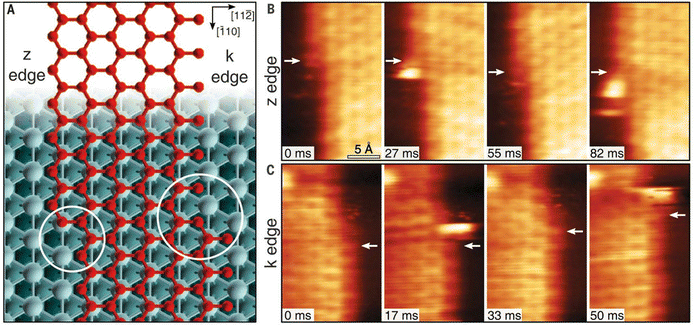 |
| | Fig. 9 (A) Zigzag and Klein edges of a top-fcc epitaxial graphene layer on Ni (111). (B) High-speed STM sequence acquired at 710 K in quasi-constant height mode at the z edge. White arrows indicate the position of C atoms in fcc-hollow sites near the kink. (C) Same as in (B) but for the k edge. Reproduced with permission.68 Copyright © 2018, The Authors. | |
Imaging to resolve the reaction mechanism
From an academic and economical perspective, a constant pursuit is to design high-performance catalysts to maximize catalytic performance. The prerequisite for rational design of catalysts is to precisely understand the reaction mechanism. The same holds true for SACs. Understanding the fundamental mechanism in single-atom catalysis is beneficial for the rule-based design of SACs. Over the last decades, with superb spatial resolution (x/y resolution: ∼0.1 nm, z resolution: ∼1 pm), STM has provided fundamental insights into CO oxidation, hydrogen activation, oxygen activation, etc. based on many well-defined SACs models. For example, Parkinson et al. investigated the differences in the reaction pathways of CO, H2, and O2 over a model Pt1–6/Fe3O4 catalyst, and found that CO could extract lattice oxygen at the periphery of the Pt clusters to form CO2, while H2 and O2 dissociated on the Pt clusters and spilled over onto the Fe3O4 support.69 As shown in Fig. 10, exposure of Pt1–6/Fe3O4 to CO, O2, and H2 at 550 K, respectively, resulted in significantly different morphological changes of the support. Exposure to CO (10−7 mbar, 60 min) induced the formation of large holes, covering 3.7% of the Fe3O4(001) terrace. And each hole was associated with (at least) one Pt cluster, which was typically located at the step edge. When exposed to H2 (10−7 mbar, 20 min), a higher number of pores were generated, covering 8.7% of the surface, but most Pt clusters appeared inside the pores. Exposure to an oxidizing O2 atmosphere (10−7 mbar, 20 min) caused the appearance of many small islands. Apart from bright Pt clusters, the characteristic rows of Fe3O4(001) could be clearly observed on these islands, indicating that the Pt clusters could catalyze the growth of a new stoichiometric Fe3O4(001) surface. Besides, the density of Pt clusters decreased, suggesting the gas-assisted sintering process. In the presence of CO, the Pt clusters could efficiently adsorb CO and deliver it to the Pt-support interface where CO extracted lattice O atoms to form CO2 (Mars–van Krevelen mechanism). The undercoordinated O atoms at step edges were more easily removed by CO than the terrace oxygen atoms. The left undercoordinated Fe atoms diffused into the bulk, forming interstitials at elevated temperatures, and the Pt cluster most likely diffused along the step once a hole was nucleated. These were the reasons why the Pt clusters were located at the step edge. In the case of H2, H2 first dissociated on Pt clusters, followed by spillover onto the support terrace, creating surface OH groups to react with lattice O atoms. The diffusion over the terrace made O-lattice extraction possible away from the Pt cluster. This way, once the hole was nucleated, the step edge gradually receded from the cluster over time, leaving the cluster at the bottom of the hole. In an O2 environment, the Pt clusters catalyzed the dissociation of O2, and the formed highly reactive atomic O species diffused onto the support to react with Fe supplied from the bulk at 550 K, inducing growth of small Fe3O4(001) islands. Following further research, multiple research groups directly observed the oxygen vacancies caused by the Mars–van Krevelen mechanism through STM measurements.28,66,70 For example, the Sykes's group observed dynamic structural changes around the active Pt sites during reaction via STM.28 As shown in Fig. 11, at 160 K, the isolated Pt sites with CO adsorbed (Pt-CO) were imaged as bright protrusions on vacancy-free surfaces. When the same surface was annealed to 250 K, two newly emerged defects adjacent to Pt atoms (labeled by white arrows) were observed. In the meantime, TPD measurements indicated that CO2 desorption started, and these defects resulted from the removal of lattice oxygen. STM measurements clearly revealed that the vacancy sites emerged at the sites adjacent to the active Pt, of which the heights were ∼20 pm lower than the initial Pt–CO species, indicating that these active Pt sites were post-reaction Pt sites. Further heating the surface to 350 K induced the emergence of more vacancy sites, due to the abstraction of more lattice oxygens by CO. Such direct observations were further demonstrated by simulation via DFT. Therefore, with the aid of STM measurements, a Mars–van Krevelen mechanism on the reducible oxide surface, in which lattice oxygen in close vicinity to the active Pt sites participated in the oxidation process, was solidly confirmed.
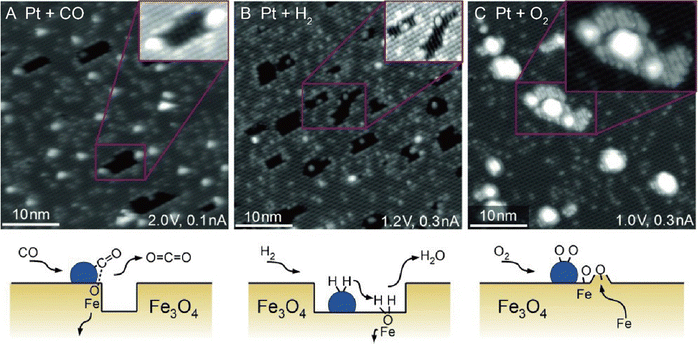 |
| | Fig. 10 STM images acquired following exposure of the Pt/Fe3O4(001) model catalyst to 1 × 10⁻⁷ mbar (A) CO, (B) H2, and (C) O2 at 550 K. Reproduced with permission.69 Copyright © 2015 WILEY-VCH Verlag GmbH & Co. KGaA, Weinheim. | |
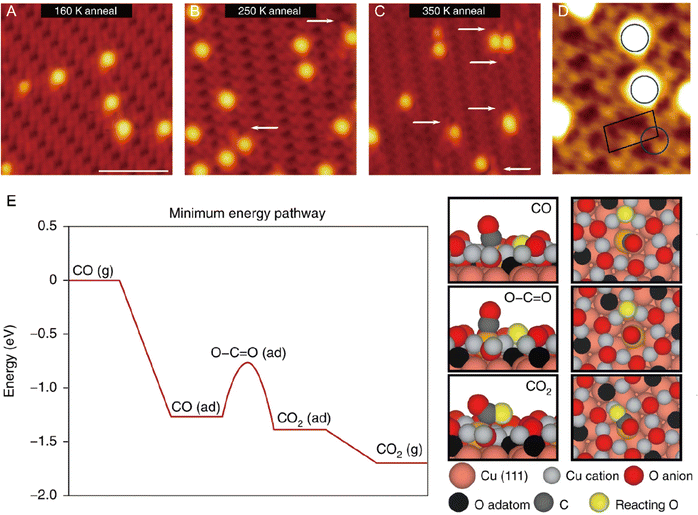 |
| | Fig. 11 Visualization of the CO oxidation mechanism by STM and rationalization by DFT. High-resolution STM image of CO-exposed Pt atoms supported on the oxide surface after annealing at (A) 160 K, (B) 250 K and (C) 350 K. White arrows highlight defects arising from the removal of lattice oxygen in the reaction. (D) High-resolution STM image of CO–Pt annealed at 250 K. The blue circle highlights the preferred CO–Pt site. The black outline shows the unit cell of the support. (E) DFT-calculated minimum energy pathway for the oxidation of CO, where ‘(g)’ indicates that the molecule is in the gas phase and ‘(ad)’ indicates that it is adsorbed. Reproduced with permission.28 Copyright © 2018, The Authors. | |
Combining STM with other techniques (e.g., TPD), the same group also conducted extensive research on SAA-catalyzed hydrogen activation, spillover, desorption, and hydrogenation. Based on the revealed mechanism, novel strategies could be explored to design efficient catalysts to address the existing problems in organic hydrogenation reactions, such as product selectivity, CO poisoning, coke formation, etc. According to the Sabatier's principle, it is difficult for a metal to have both a low reaction energy barrier and weak binding at the same time. Sykes and coworkers solved this problem by dispersing active metal atoms into a more inert host metal to form bifunctional catalysts. They confirmed that the linear scaling relationship between the binding energy of the reaction intermediates and the activation barrier could be broken by forming SAAs. For example, as shown in Fig. 12, even though Cu had weak binding to H atoms (H(ads)), the whole reaction on Cu was hampered by a rather large activation barrier of 0.4 eV for H2 dissociative adsorption. In the case of Pd, with a strong binding energy of H(ads), the barrierless activation of Pd seemed helpless for tuning the desorption temperature. In contrast, for Pd–Cu SAAs, H2 would first dissociate on Pd to form H atoms, which would diffuse onto Cu with a weaker binding energy that required a lower desorption temperature.8 These optimized energy diagrams were also achieved for Pd–Cu, Pd–Au, Pt–Cu SAAs, etc., for efficient hydrogenation reactions9,25–27,29,31 The same research group also tackled CO poisoning using this strategy.30,33 To be specific, the researchers successively deposited H and CO onto Pt–Cu(111) SAA to figure out their interaction with the Pt catalytic sites at the atomic scale. Both stationary dark spots and streaky features could be observed (Fig. 13A), where the former were the CO on the Pt sites, and the latter were mobile H atoms on the Cu surface.33 The scanning at 200 mV could sweep away the mobile H, leaving behind the CO molecules (Fig. 13B), which could also be removed via 5 V pulses (Fig. 13C). Then, the isolated Pt atoms beneath every CO adsorption site were revealed. In such bifunctional system, Had atoms could diffuse onto other active sites away from the dissociation sites. With this knowledge, for the hydrogenation reaction of butadiene, the same product distribution revealed by TPD spectra (Fig. 13D and E) could be understood for gases with or without CO, as H2 would preferentially bind and dissociate on Pt, and then overflow to the Cu(111) surface for hydrogenation.25 It should be noted that if the Pt sites have been blocked by CO prior to the addition of H2, no reactivity will be observed.
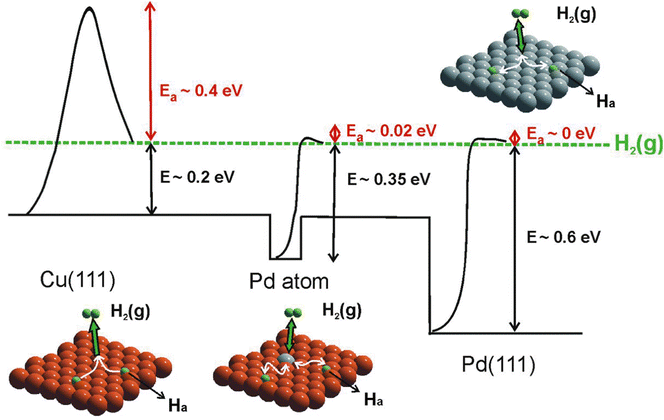 |
| | Fig. 12 Potential energy diagram depicting the mode of action of a Pd SAA surface compared with those of pure Cu(111) and Pd(111). Dissociative adsorption of H2 on Cu(111) (orange) is a highly activated process. On Pd(111) (gray), H2 dissociation is practically barrierless, but the adsorbed atoms are bound strongly. In the case of an isolated Pd atom, the dissociation barrier is low, hydrogen is weakly bound, and it can spill over onto the Cu(111) surface. Reproduced with permission.8 Copyright © 2012, American Association for the Advancement of Science. | |
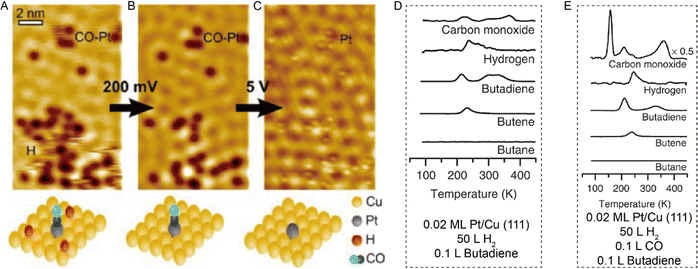 |
| | Fig. 13 (A) STM image of H atoms and CO molecules on Pt/Cu(111) SAA. (B) Same area after H removal. (C) Same area after CO removal. Reproduced with permission.33 Copyright © 2016, American Chemical Society. TPD traces for the co-adsorption of H2 and butadiene (D) without and (E) with CO on 0.02 ML Pt/Cu(111). H2 was adsorbed on the surface before adsorption of CO. Reproduced with permission.25 Copyright © 2015, The Authors. | |
To sum up, STM could help to resolve the catalytic mechanism at the atomic scale, which would provide valuable guidance for designing advanced SACs.
Perspectives
STM has been very useful in imaging the geometric and electronic structures of SACs and resolving the catalytic mechanisms in single atom catalysis. Numerous insights have been obtained for better perception of single atom catalysis. However, given the complex structures of SACs, possible dynamic structure changes during the catalytic process, the gap between characterization and real-time reaction, etc., there is still a long way to go.
1. One of the stringent requirements for successful STM measurements is that the sample surface needs to be atomically flat to ensure high resolution and stable imaging. The imaging resolution and quality are limited by the atomic-level flatness of the catalyst. However, for some SACs, the single metal atoms are confined in 3D frameworks. Visualization of the geometric and electronic structures of such 3D SACs is imperative yet challenging.
2. The ultimate goal of imaging is to simultaneously achieve high spatial and temporal resolution. High spatial resolution is the most notable feature of STM imaging, with a spatial resolution of 2 Å being routinely obtained. But STM imaging with high temporal resolution is still in infant development, although there have been some successful trials, there are many challenges to overcome. As the bandwidth of the preamplifier and other electronics of STM is limited to megahertz, ultra-fast dynamics within picoseconds and femtoseconds should be captured by incorporating pump–probe techniques into STM, leading to femtosecond laser STM and terahertz STM.3
3. To date, the combination of STM and single-atom catalysis mainly concentrated on simple reaction models, for example, CO oxidation, hydrogen desorption, oxygen oxidation, etc. Compared with the great progress in the catalytic field where the SACs have been widely used in various catalytic reactions, STM's research on single-atom catalysis lags somewhat behind. Characterization of more complex reaction models with the aid of STM measurements is highly desired. Besides, the huge temperature and pressure gap between STM characterization and practical reactions also presents key challenges. Operando STM characterization is an important technical challenge to overcome.
Conflicts of interest
There are no conflicts to declare.
Acknowledgements
This work was supported by The National Key Research and Development Program of China (2021YFA1600800), the National Natural Science Foundation of China (21972094, 22102102), the Educational Commission of Guangdong Province (839-0000013131), the Shenzhen Science and Technology Program (RCJC20200714114434086, JCYJ20200812160737002, 827-000421), and the City University of Hong Kong start up fund.
References
- G. Binnig, H. Rohrer, C. Gerber and E. Weibel, Phys. Rev. Lett., 1982, 49, 57 CrossRef.
- D. M. Eigler and E. K. Schweizer, Nature, 1990, 344, 524–526 CrossRef CAS.
- K. Bian, C. Gerber, A. J. Heinrich, D. J. Muller, S. Scheuring and Y. Jiang, Nat. Rev. Method Prime, 2021, 1, 36 CrossRef CAS.
-
C. J. Chen, Introduction to Scanning Tunneling Microscopy, Oxford University Press, New York, 1993 Search PubMed.
- B. Yang, X. Lin, H. J. Gao, N. Nilius and H. J. Freund, J. Phys. Chem. C, 2010, 114, 8997–9001 CrossRef CAS.
- Z. Novotny, G. Argentero, Z. M. Wang, M. Schmid, U. Diebold and G. S. Parkinson, Phys. Rev. Lett., 2012, 108, 216103 CrossRef PubMed.
- G. S. Parkinson, Z. Novotny, G. Argentero, M. Schmid, J. Pavelec, R. Kosak, P. Blaha and U. Diebold, Nat. Mater., 2013, 12, 724–728 CrossRef CAS PubMed.
- G. Kyriakou, M. B. Boucher, A. D. Jewell, E. A. Lewis, T. J. Lawton, A. E. Baber, H. L. Tierney, M. Flytzani-Stephanopoulos and E. C. H. Sykes, Science, 2012, 335, 1209–1212 CrossRef CAS PubMed.
- F. R. Lucci, M. T. Darby, M. F. G. Mattera, C. J. Ivimey, A. J. Therrien, A. Michaelides, M. Stamatakis and E. C. H. Sykes, J. Phys. Chem. Lett., 2016, 7, 480–485 CrossRef CAS PubMed.
- F. R. Lucci, T. J. Lawton, A. Pronschinske and E. C. H. Sykes, J. Phys. Chem. C, 2014, 118, 3015–3022 CrossRef CAS.
- G. Binnig, H. Rohrer, C. Gerber and E. Weibel, Phys. Rev. Lett., 1983, 50, 120–123 CrossRef CAS.
- J. M. Thomas, R. Raja and D. W. Lewis, Angew. Chem. Int. Ed. Engl., 2005, 44, 6456–6482 CrossRef CAS PubMed.
- B. T. Qiao, A. Q. Wang, X. F. Yang, L. F. Allard, Z. Jiang, Y. T. Cui, J. Y. Liu, J. Li and T. Zhang, Nat. Chem., 2011, 3, 634–641 CrossRef CAS PubMed.
- X. Li, Y. Fang, J. Wang, H. Fang, S. Xi, X. Zhao, D. Xu, H. Xu, W. Yu, X. Hai, C. Chen, C. Yao, H. B. Tao, A. G. R. Howe, S. J. Pennycook, B. Liu, J. Lu and C. Su, Nat. Commun., 2021, 12, 2351 CrossRef CAS PubMed.
- H. Sun, Y. Ma, Q. Zhang and C. Su, Trans. Tianjin Univ., 2021, 27, 313–330 CrossRef CAS.
- Z. Teng, Q. Zhang, H. Yang, K. Kato, W. Yang, Y. Lu, S. Liu, C. Wang, A. Yamakata, C. Su, B. Liu and T. Ohno, Nat. Catal., 2021, 4, 374–384 CrossRef CAS.
- S. Ji, Y. Chen, X. Wang, Z. Zhang, D. Wang and Y. Li, Chem. Rev., 2020, 120, 11900–11955 CrossRef CAS PubMed.
- Y. Cheng, H. Wang, H. Song, K. Zhang, G. I. N. Waterhouse, J. Chang, Z. Tang and S. Lu, Nano Res. Energ., 2023, 2, e9120082 CrossRef.
- J. Zhang, C. Asokan, G. Zakem, P. Christopher and J. W. Medlin, Green Energy Environ., 2022, 7, 1263–1269 CrossRef CAS.
- Z. Liu, L. Sun, Q. Zhang, Z. Teng, H. Sun and C. Su, Chem. Res. Chinese Univ., 2022, 38, 1123–1138 CrossRef CAS.
- K. T. Rim, D. Eom, L. Liu, E. Stolyarova, J. M. Raitano, S. W. Chan, M. Flytzani-Stephanopoulos and G. W. Flynn, J. Phys. Chem. C, 2009, 113, 10198–10205 CrossRef CAS.
- J. V. Lauritsen, S. Helveg, E. Laegsgaard, I. Stensgaard, B. S. Clausen, H. Topsoe and E. Besenbacher, J. Catal., 2001, 197, 1–5 CrossRef CAS.
- M. Sterrer, T. Risse, U. M. Pozzoni, L. Giordano, M. Heyde, H. P. Rust, G. Pacchioni and H. J. Freund, Phys. Rev. Lett., 2007, 98, 096107 CrossRef PubMed.
- Z. Jakub, J. Hulva, M. Meier, R. Bliem, F. Kraushofer, M. Setvin, M. Schmid, U. Diebold, C. Franchini and G. S. Parkinson, Angew. Chem., Int. Ed., 2019, 58, 13961–13968 CrossRef CAS PubMed.
- F. R. Lucci, J. L. Liu, M. D. Marcinkowski, M. Yang, L. F. Allard, M. Flytzani-Stephanopoulos and E. C. H. Sykes, Nat. Commun., 2015, 6, 8550 CrossRef PubMed.
- J. L. Liu, J. J. Shan, F. R. Lucci, S. F. Cao, E. C. H. Sykes and M. Flytzani-Stephanopoulos, Catal. Sci. Technol., 2017, 7, 4276–4284 RSC.
- M. D. Marcinkowski, M. T. Darby, J. L. Liu, J. M. Wimble, F. R. Lucci, S. Lee, A. Michaelides, M. Flytzani-Stephanopoulos, M. Stamatakis and E. C. H. Sykes, Nat. Chem., 2018, 10, 325–332 CrossRef CAS PubMed.
- A. J. Therrien, A. J. R. Hensley, M. D. Marcinkowski, R. Q. Zhang, F. R. Lucci, B. Coughlin, A. C. Schilling, J. S. McEwen and E. C. H. Sykes, Nat. Catal., 2018, 1, 192–198 CrossRef CAS.
- F. R. Lucci, M. D. Marcinkowski, T. J. Lawton and E. C. H. Sykes, J. Phys. Chem. C, 2015, 119, 24351–24357 CrossRef CAS.
- G. Giannakakis, M. Flytzani-Stephanopoulos and E. C. H. Sykes, Accounts Chem. Res., 2019, 52, 237–247 CrossRef CAS PubMed.
- M. B. Boucher, B. Zugic, G. Cladaras, J. Kammert, M. D. Marcinkowski, T. J. Lawton, E. C. H. Sykes and M. Flytzani-Stephanopoulos, Phys. Chem. Chem. Phys., 2013, 15, 12187–12196 RSC.
- R. T. Hannagan, G. Giannakakis, R. Reocreux, J. Schumann, J. Finzel, Y. C. Wang, A. Michaelides, P. Deshlahra, P. Christopher, M. Flytzani-Stephanopoulos, M. Stamatakis and E. C. H. Sykes, Science, 2021, 372, 1444–1447 CrossRef CAS.
- J. L. Liu, F. R. Lucci, M. Yang, S. Lee, M. D. Marcinkowski, A. J. Therrien, C. T. Williams, E. C. H. Sykes and M. Flytzani-Stephanopoulos, J. Am. Chem. Soc., 2016, 138, 6396–6399 CrossRef CAS PubMed.
- J. L. Liu, M. B. Uhlman, M. M. Montemore, A. Trimpalis, G. Giannakakis, J. J. Shan, S. F. Cao, R. T. Hannagan, E. C. H. Sykes and M. Flytzani-Stephanopoulos, ACS Catal., 2019, 9, 8757–8765 CrossRef CAS.
- D. A. Patel, R. T. Hannagan, P. L. Kress, A. C. Schilling, V. Cinar and E. C. H. Sykes, J. Phys. Chem. C, 2019, 123, 28142–28147 CrossRef CAS.
- N. S. Tolulope, M. Ajayi, T. Rojas, S. Wieghold, X. Cheng, K. Z. Latt, D. J. Trainer, N. K. Dandu, Y. Li, S. Premarathna, D. R. Sanjoy Sarkar, Y. Liu, N. Kyritsakas, S. Wang, V. R. Eric Masson, X. Li, A. T. Ngo and S.-W. Hla, Nature, 2023, 618, 69–73 CrossRef PubMed.
- R. T. Hannagan, G. Giannakakis, M. Flytzani-Stephanopoulos and E. C. H. Sykes, Chem. Rev., 2020, 120, 12044–12088 CrossRef CAS PubMed.
- Y. Wang, J. Mao, X. G. Meng, L. Yu, D. H. Deng and X. H. Bao, Chem. Rev., 2019, 119, 1806–1854 CrossRef CAS PubMed.
- J. Li, M. F. Yue, Y. M. Wei and J. F. Li, Electrochim. Acta, 2022, 409, 139835 CrossRef CAS.
- S. S. Qin, J. Will, H. Kim, N. Denisov, S. Carl, E. Spiecker and P. Schmuki, ACS Energy Lett., 2023, 8, 1209–1214 CrossRef CAS.
- P. Xia, C. H. Wang, Q. He, Z. H. Ye and I. Sires, Chem. Eng. J., 2023, 452, 139446 CrossRef CAS.
- Y. N. Shang, X. G. Duan, S. B. Wang, Q. Y. Yue, B. Y. Gao and X. Xu, Chin. Chem. Lett., 2022, 33, 663–673 CrossRef CAS.
- M. Flytzani-Stephanopoulos, Chinese J. Catal., 2017, 38, 1432–1442 CrossRef CAS.
- W. Zhang and W. T. Zheng, Adv. Funct. Mater., 2016, 26, 2988–2993 CrossRef CAS.
- X. Liang, N. H. Fu, S. C. Yao, Z. Li and Y. D. Li, J. Am. Chem. Soc., 2022, 144, 18155–18174 CrossRef CAS PubMed.
- Q. Liu and Z. L. Zhang, Catal. Sci. Technol., 2019, 9, 4821–4834 RSC.
- Y. X. Chen, Z. W. Huang, Z. Ma, J. M. Chen and X. F. Tang, Catal. Sci. Technol., 2017, 7, 4250–4258 RSC.
- X. Wan, W. Q. Chen, J. R. Yang, M. C. Liu, X. F. Liu and J. L. Shui, ChemElectroChem, 2019, 6, 304–315 CrossRef CAS.
- J. R. Yang, D. S. Wang and Y. D. Li, Chem. Phys. Chem., 2020, 21, 2486–2496 CrossRef CAS PubMed.
- Y. N. Shang, X. Xu, B. Y. Gao, S. B. Wang and X. G. Duan, Chem. Soc. Rev., 2021, 50, 5281–5322 RSC.
- F. F. Zhang, Y. L. Zhu, Q. Lin, L. Zhang, X. W. Zhang and H. T. Wang, Energ. Environ. Sci., 2021, 14, 2954–3009 RSC.
- C. Gao, J. X. Low, R. Long, T. T. Kong, J. F. Zhu and Y. J. Xiong, Chem. Rev., 2020, 120, 12175–12216 CrossRef CAS PubMed.
- D. Zhao, Z. W. Zhuang, X. Cao, C. Zhang, Q. Peng, C. Chen and Y. D. Li, Chem. Soc. Rev., 2020, 49, 2215–2264 RSC.
- Z. Liang, L. L. Yin, H. Yin, Z. Y. Yin and Y. P. Du, Nanoscale Horiz., 2022, 7, 31–40 RSC.
- P. Qi, J. Wang, X. Djitcheu, D. H. He, H. M. Liu and Q. J. Zhang, RSC Adv., 2021, 12, 1216–1227 RSC.
- N. C. Cheng, L. Zhang, K. Doyle-Davis and X. L. Sun, Electrochem. Energy Rev., 2019, 2, 539–573 CrossRef.
- J. V. Lauritsen, R. T. Vang and F. Besenbacher, Catal. Today, 2006, 111, 34–43 CrossRef CAS.
- B. Zheng, P. Hermet and L. Henrard, ACS Nano, 2010, 4, 4165–4173 CrossRef CAS PubMed.
- D. H. Deng, X. L. Pan, L. A. Yu, Y. Cui, Y. P. Jiang, J. Qi, W. X. Li, Q. A. Fu, X. C. Ma, Q. K. Xue, G. Q. Sun and X. H. Bao, Chem. Mater., 2011, 23, 1188–1193 CrossRef CAS.
- L. Y. Zhao, R. He, K. T. Rim, T. Schiros, K. S. Kim, H. Zhou, C. Gutierrez, S. P. Chockalingam, C. J. Arguello, L. Palova, D. Nordlund, M. S. Hybertsen, D. R. Reichman, T. F. Heinz, P. Kim, A. Pinczuk, G. W. Flynn and A. N. Pasupathy, Science, 2011, 333, 999–1003 CrossRef CAS PubMed.
- D. H. Deng, X. Q. Chen, L. Yu, X. Wu, Q. F. Liu, Y. Liu, H. X. Yang, H. F. Tian, Y. F. Hu, P. P. Du, R. Si, J. H. Wang, X. J. Cui, H. B. Li, J. P. Xiao, T. Xu, J. Deng, F. Yang, P. N. Duchesne, P. Zhang, J. G. Zhou, L. T. Sun, J. Q. Li, X. L. Pan and X. H. Bao, Sci. Adv., 2015, 1, e1500462 CrossRef PubMed.
- Q. F. Liu, Y. Liu, H. B. Li, L. L. Li, D. H. Deng, F. Yang and X. H. Bao, Appl. Surf. Sci., 2017, 410, 111–116 CrossRef CAS.
- N. Nilius, M. V. Ganduglia-Pirovano, V. Brazdova, M. Kulawik, J. Sauer and H. J. Freund, Phys. Rev. Lett., 2008, 100, 096802 CrossRef CAS PubMed.
- N. Nilius, M. V. Ganduglia-Pirovano, V. Brazdova, M. Kulawik, J. Sauer and H. J. Freund, Phys. Rev. B: Condens. Matter Mater. Phys., 2010, 81, 045422 CrossRef.
- Y. Lykhach, S. M. Kozlov, T. Skala, A. Tovt, V. Stetsovych, N. Tsud, F. Dvorak, V. Johanek, A. Neitzel, J. Myslivecek, S. Fabris, V. Matolin, K. M. Neyman and J. Libuda, Nat. Mater., 2016, 15, 284–288 CrossRef CAS PubMed.
- X. Zhou, Q. Shen, K. D. Yuan, W. S. Yang, Q. W. Chen, Z. H. Geng, J. L. Zhang, X. Shao, W. Chen, G. Q. Xu, X. M. Yang and K. Wu, J. Am. Chem. Soc., 2018, 140, 554–557 CrossRef CAS PubMed.
- R. Bliem, J. E. S. van der Hoeven, J. Hulva, J. Pavelec, O. Gamba, P. E. de Jongh, M. Schmid, P. Blaha, U. Diebold and G. S. Parkinson, Proc. Natl. Acad. Sci. U. S. A., 2016, 113, 8921–8926 CrossRef CAS PubMed.
- L. L. Patera, F. Bianchini, C. Africh, C. Dri, G. Soldano, M. M. Mariscal, M. Peressi and G. Comelli, Science, 2018, 359, 1243–1246 CrossRef CAS PubMed.
- R. Bliem, J. van der Hoeven, A. Zavodny, O. Gamba, J. Pavelec, P. E. de Jongh, M. Schmid, U. Diebold and G. S. Parkinson, Angew. Chem., Int. Ed., 2015, 54, 13999–14002 CrossRef CAS PubMed.
- X. Zhou, W. S. Yang, Q. W. Chen, Z. H. Geng, X. Shao, J. L. Li, Y. F. Wang, D. X. Dai, W. Chen, G. Q. Xu, X. M. Yang and K. Wu, J. Phys. Chem. C, 2016, 120, 1709–1715 CrossRef CAS.
Footnote |
| † These authors contributed equally. |
|
| This journal is © The Royal Society of Chemistry 2023 |
 Open Access Article
 *d,
Bin
Liu
 *c and
Chenliang
Su
 *ab
*ab


