
Hybrid thermo-electrochemical conversion of plastic wastes commingled with marine biomass to value-added products using renewable energy†
Jonah M.
Williams
 a,
Michael P.
Nitzsche
b,
Lev
Bromberg
b,
Zifeng
Qu
c,
Aaron J.
Moment
c,
T. Alan
Hatton
b and
Ah-Hyung Alissa
Park
*acd
a,
Michael P.
Nitzsche
b,
Lev
Bromberg
b,
Zifeng
Qu
c,
Aaron J.
Moment
c,
T. Alan
Hatton
b and
Ah-Hyung Alissa
Park
*acd
aDepartment of Earth and Environmental Engineering, Columbia University, New York, New York 10027, USA. E-mail: ap2622@columbia.edu
bDepartment of Chemical Engineering, Massachusetts Institute of Technology, Cambridge, Massachusetts 02138, USA
cDepartment of Chemical Engineering, Columbia University, New York, New York 10027, USA
dLenfest Center for Sustainable Energy, Columbia University, New York, New York 10027, USA
First published on 8th November 2023
Abstract
Surface plastics and microplastics commingled with biomass are emerging pollutants in the marine environment. With the projected demand for plastics sharply increasing, innovative methods of abating these end-of-life (EOL) marine plastic wastes are necessary. Thermochemical methods to convert plastics and biomass are potential candidates for this task, although anthropogenic CO2 emissions are often inevitable. Alkaline thermal treatment (ATT) is a promising thermochemical conversion technology, running at moderate conditions (<600 °C, 1 atm) and fixing carbon in the form of stable carbonate salts (e.g., Li2CO3 and K2CO3). Carbonate salts can be electrochemically converted to high purity carbon nanotubes (CNTs) using renewable energy (e.g., offshore wind energy). Herein, the integration of these two technologies is studied in the context of a novel tandem thermo-electrochemical (elecATT) process to treat and upcycle marine wastes. This study shows that our novel elecATT of polyethylene and salty brown seaweed performed at 500–600 °C can produce hydrogen at high purity (85%), and these reactions can be enhanced by the presence of both heterogeneous in situ and ex situ y-zeolite and Ni/ZrO2 catalysts. The majority of carbon from seaweed and plastics was converted to carbonate ions in a molten electrolyte composed of Li2CO3/K2CO3/LiOH and converted to carbon nanotubes via electrosplitting of carbonate ions with near 100% Coulombic efficiency. Carbon analysis was performed to analyze the fate of carbon throughout the elecATT reactions, and to evaluate the recyclability of LiOH/KOH electrolytes for the ATT reaction. Overall, this study presents an innovative method for the treatment and upgrading of marine plastic pollutants by producing high purity H2 and purified polymer intermediates for upcycling, and capturing carbon via a molten salt which can then be electrochemically converted to produce high-value CNTs using renewable energy.
Broader contextEnd-of-life (EOL) mismanaged plastic waste streams entering the marine environment are a ubiquitous, large-scale problem requiring innovative solutions. With plastic production projected to increase in the next quarter century, especially in industrializing regions with poor waste management infrastructures, marine surface plastic pollution will continue to increase. These wastes are often infeasible to trace their places of origin to discourage emission. Marine plastic wastes cannot be recycled directly because of their heterogeneity in compositions and commingling with wet and salty marine biomass. Therefore, there are often no economic incentives to collect and treat these wastes. However, if left untreated the issue of marine plastic pollution could cause catastrophic consequences for the global marine biome and will directly impact human life through the collapse of fishing ecosystems. Herein, we propose and demonstrate a method to treat marine plastic wastes commingled with biomass via a novel thermo-electrochemical conversion technology with molten salts. This process produces high-purity hydrogen and carbon nanotubes (CNTs) from the wastes, while fixing and sequestering carbon. This technology can be installed offshore utilizing solar heat and wind electricity. This novel approach adds economic incentive to facilitate clean-up efforts via the creation of high-value products while also affording a volumetric reduction of wastes to be transported to the shore. |
Introduction
Plastic products are widely used in contemporary human life, ranging from plastic bags and food containers to cloth fragments, tires, and shipping containers. Through convenience, low cost and high durability, plastics have become extremely omnipresent.1,2 Research suggests that human-manufactured plastics have touched almost all places on Earth.3,4 Since the end of World War II, there has been an exponential growth in plastic production. Current forecasts predict that the production of plastics will only increase due to the urbanization and industrialization of many developing economies. This is reflected in demand by plastic manufacturers for commodity chemicals such as ethylene, propylene, and styrene, especially in countries such as China and Korea.5 Additionally, refining industries are shifting away from transportation fuels and moving towards producing naphtha and upgrading residues which can be used as feedstocks for naphtha reformers (aromatics) and steam crackers (ethylene, propylene); such processes are already being commercialized, such as Crude-Oil-to-Chemicals (COTC, Aramco/SABIC).5,6In an effort to standardize the organization of plastics and facilitate recycling efforts to curb single-use plastic pollution, the U.S. Society of the Plastics Industry introduced the Resin Identification Code (RIC).7 These codes correspond to the eight most common plastics, including polyethylene terephthalate (PETE), high-density polyethylene (HDPE), polyvinyl chloride (PVC), low-density polyethylene (LDPE), polypropylene (PP), polystyrene (PS), and others (which includes acrylics, nylons, polycarbonates, etc.), as showcased in Fig. 1, which also shows their share of the overall production landscape. Notably, LDPE and PP are the dominant plastics.8 The large percentage of LDPE and PP, produced over the period of 2002 to 2014 at 20% and 21%, respectively, is attributed to their significant presence as single-use packaging materials. This is further corroborated by the fact that the largest use of plastic by industry is the packaging market, at about 45%.8 Unfortunately, most of the plastic that is produced will never be recycled as it exits the supply chain, destined to end in a landfill or as pollution. Such single-use plastics are both some of the most useful and affordable materials, but are extremely dangerous in terms of their longevity and low degradation potential.3
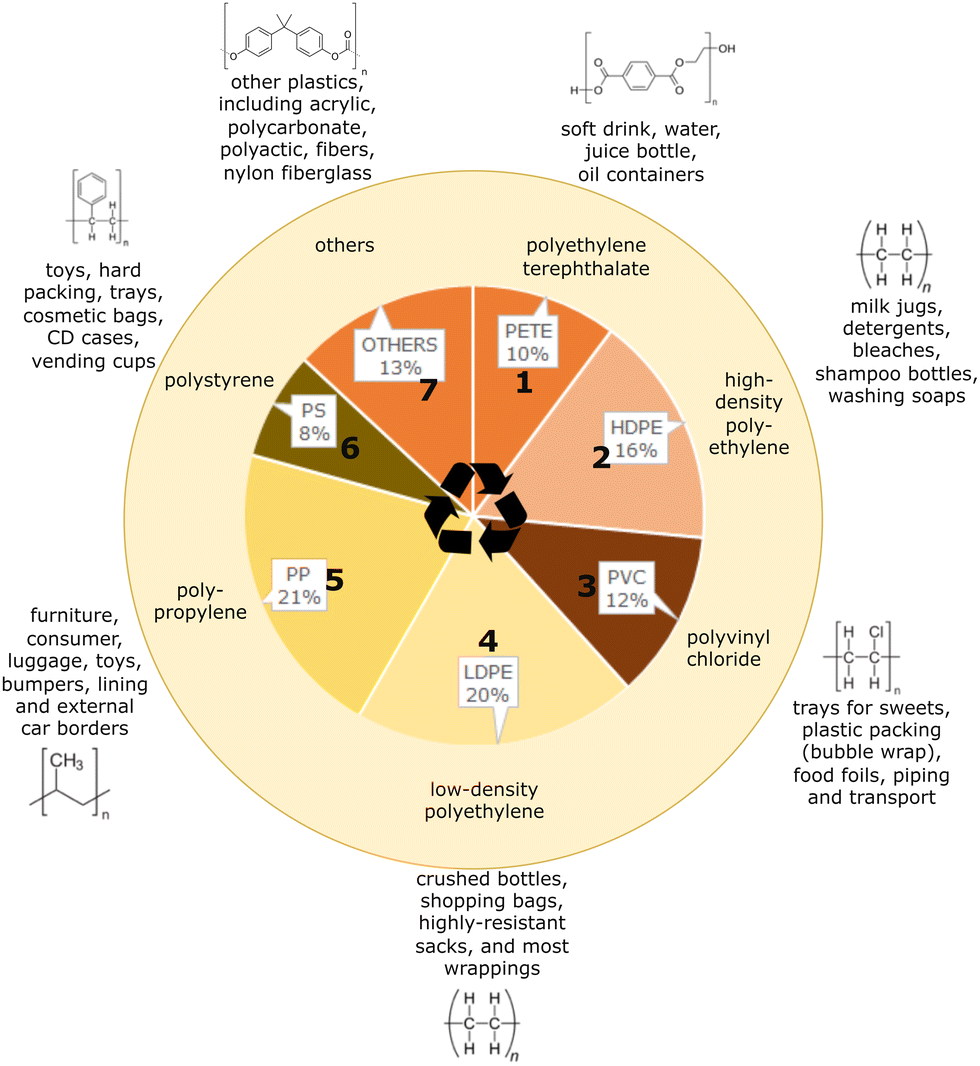 | ||
| Fig. 1 The eight major plastic polymer types, their corresponding resin identification code (RIC), and their relative share of the global industrial plastic production landscape. Data adapted from Geyer et al.8 | ||
Mismanaged plastic waste poses a threat to marine environments
The annual global polymer resin and fiber production has increased from around 2 million metric tonnes in 1950 to 381 million metric tonnes in 2015.8 The sheer amount of plastic mass produced has led to a number of environmental concerns across the globe, especially in regards to ecosystem degradation. Plastics are highly desired materials due to their resistivity and durability; however, this is also a bane as their hydrocarbon nature results in natural degradation times of hundreds or thousands of years.9 A large percentage of plastics in the global supply chain are mismanaged, meaning they are either littered as refuse or inadequately disposed.10 More than 8 million tonnes of plastic end up in the marine environment each year, with more than 10![[thin space (1/6-em)]](https://www.rsc.org/images/entities/char_2009.gif) 000 tonnes becoming surface water plastics (Fig. 2).10,11
000 tonnes becoming surface water plastics (Fig. 2).10,11
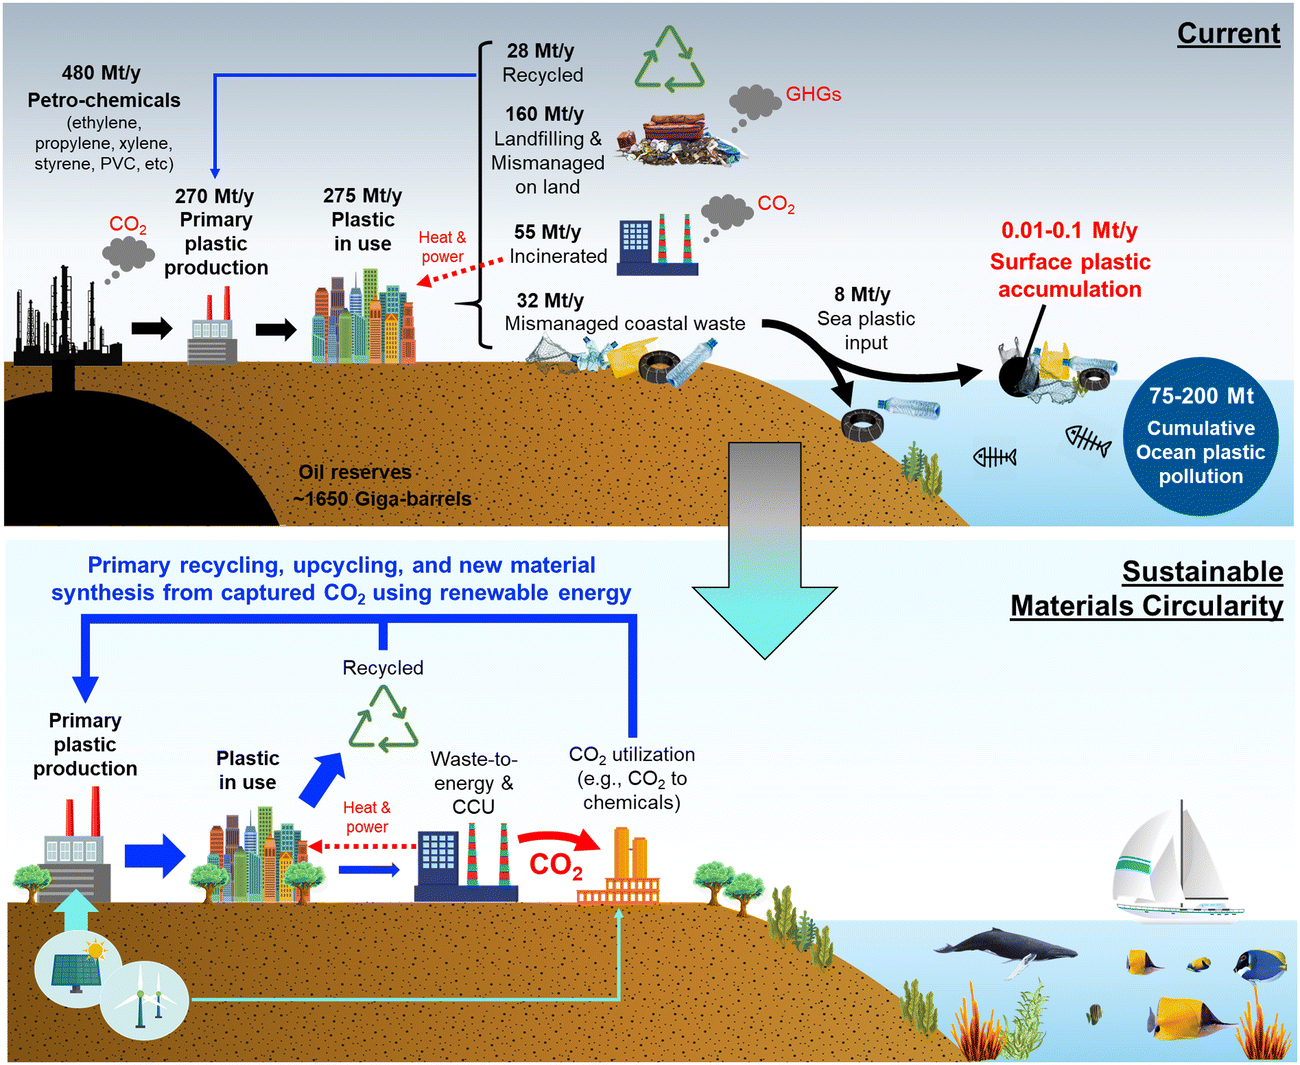 | ||
| Fig. 2 Global plastic production, current methods of disposal, and accumulation pathways of coastal wastes in today's world with a future vision for sustainable material circularity combined with carbon capture and utilization (CCU). A large percentage of coastal waste ends up as mismanaged coastal waste which can eventually wash into the ocean. Certain data sourced from Ritche and Roser (2015).14 | ||
This surface and subsurface plastic is quite harmful to various marine trophic levels, and accumulates in large quantities in certain ocean areas due to currents (e.g., the Pacific Ocean Gyres: colloquially “The Great Pacific Garbage Patch”).4,12,13 Nets, bags, and storage containers can entangle and trap larger sea creatures. Colorful items are often mistaken for food by birds and fish. Smaller pieces, oftentimes microscopic (e.g., “microplastics”), are a result of the harsh ultraviolet (UV) radiation and highly saline water, which can lead to oxidative degradation, decreasing plastic size over time.14 These microplastics can be consumed and assimilated by organisms such as plankton and krill, which can then undergo biomagnification up the food chain. Microplastics are a concerning issue not only for natural marine ecosystems but also for human activities in marine environments; they could physically harm humans and collapse fishing economies.15
The proliferation of mismanaged plastic wastes is projected to grow significantly in the next 30 years, fueled by industrialization and population growth.10 According to extrapolated projections based on the methodologies established by Jambeck et al., it is theorized that most major coastal countries could produce on the order of 500000 tonnes of mismanaged plastic waste per year by 2040 (Fig. S1, ESI†).10 Efforts to mitigate marine plastic pollution are currently lacking. Curbing production and managing coastal waste streams would aid in reducing the flow of wastes to the ocean.16 However, addressing the vast amounts of marine waste already present in the ocean will require removal and clean-up technologies. Clearly the scale and magnitude of this issue, potential continued catastrophic ecosystem damage, and impact on human global food supply chains warrants increased attention and action.
Contamination and commingling of plastic wastes with marine biomass
The deposition of plastic at various ocean strata is a function of plastic density, buoyancy, and the changing water density, which is a result of salinity fluctuations. In regards to surface plastics, the largest fractions are composed of LDPE, PS, and PP fishing gear, plastic bottles, and containers due to their relative densities which are less than that of seawater (Fig. S2, ESI†).17,18 However, there may be additional types of plastic present on the surface due to the entanglement and commingling of marine species (e.g., biomass) with these waste plastics. It is theorized that this can modulate their buoyancy, in some cases causing a greater fraction to precipitate on the surface. Agglomeration of marine plastics can also be facilitated by biomass commingling. Coupled with marine currents, this can lead to the creation of massive “patches” of plastic wastes.12 Commingling of marine biomass and plastics happens naturally as the surface plastic provides a medium for tethering and growth. The types of biomass can range from microscopic algal biofilms to large swaths of kelp mingled amongst the plastic. These commingled plastic and biomass deposits are not easily managed due to the harsh conditions of the ocean environment. The presence of high salt concentrations and a variety of contaminants make it infeasible to recover and recycle the plastics in these mixes. Thus, the collected wastes need to be either landfilled or thermochemically processed, conventionally via incineration.Energetically, the marine plastic and biomass flocs could be promising feedstocks for thermochemical conversion pathways due to their calorific values. The heating value of plastics can vary significantly based on their composition; PVC has an average low heating value (LHV) of 17 MJ kg−1 whereas PE has one of 40 MJ kg−1.19 Brown seaweeds, due to their high water and heteroatom content have a lower carbon content of about 15–40% depending on the species with a predicted LHV of about 16 MJ kg−1.20 Previous studies have elucidated the primary sugar makeup of these brown seaweeds to be 10–40 wt% alginates (C6H8O6), 2–34 wt% laminarin (C6H10O5), 5–25 wt% mannitol (C6H14O6), and 5–20 wt% fucoidan (C7H14O7S).21,22 Due to the high carbon content of marine plastic wastes, they could be ideal candidates for advanced thermochemical conversion pathways whereas they would ordinarily be landfilled or left in the environment.
Novel thermochemical conversion pathway of wet and salty marine biomass
For the thermochemical conversion of commingled marine plastic wastes and biomasses, conventional waste-to-energy (WtE) technologies are not ideal since the feedstock needs to be dried prior to combustion and will lead to large CO2 emissions unless a carbon capture process is integrated.23 A few studies have reported on the thermochemical gasification of dried seaweeds and algae, which showed rapid kinetics and the ability to produce synthesis gas rich in H2/CO which can be used as a fuel itself or for commodity downstream chemicals (e.g., Fischer–Tropsch drop-in fuels).22,24,25 However, the need for dry feedstock is a challenge of these thermal conversion methods due to the high energy intensity of drying and high moisture content of marine seaweeds (>80%). Hydrothermal liquefaction (HTL) of algal biomass can produce bio-crude from a wide variety of oleaginous marine biomasses at moderate temperature (250–400 °C) and elevated pressures (5–20 MPa).26 The robustness of HTL comes from its ability to process algae with water content as high as 92% wt%, which saves energy on pretreatment drying.26 However, the pressure requirement and production of bio-crude might not be advantageous in situations where direct conversion to gaseous products is desired.Plastic gasification presents its own set of challenges, usually requiring moderate pressures (2–4 MPa) and temperatures (>800 °C) to achieve any appreciable hydrogen production.27 The formation of waxes as well as primary and tertiary tars also occurs due to the viscosity and olefinic/aromatic nature of the plastic feedstocks.27 This can lead to issues with low conversion rates, reactor fouling, and downstream equipment failure.
Supercritical water gasification has been studied in the context of both wet biomass and plastics and presents advantages in terms of conversion, hydrogen yield, and reduction of tar, wax, and coke formation.27–29 However, high energy consumption, salt scaling, and special reactor metallurgies due to pressure can lead to challenging investment costs.27 Sorption-enhanced gasification methods, utilizing an active gasifier bed material such as carbonate salts of alkali metals (K, Na, etc.) or naturally occurring dolomites or calcium/magnesium silicates (e.g., olivine, serpentine) have been shown to produce higher gas yields with low tar and wax yields.30–34 Although tar cracking can be enhanced via the use of sorption-enhanced gasification, this process still requires high reaction temperatures (e.g., >600 °C) and lower H2 purity (30–50 mol%).22,35,36
A novel thermochemical conversion technique which could be quite promising in the disposal of waste plastics commingled with biomass is alkaline thermal treatment (ATT), which uses alkali hydroxides (e.g., NaOH, KOH, LiOH, etc.) as active materials to enhance the biomass conversion process.22,37 Previous research has shown that via this ATT reaction pathway, high purity H2 (>90% v/v) can be generated from brown seaweeds at mild moderate temperature and pressures (<500 °C, 1 atm) while capturing evolved CO2 in the form of alkali or alkali earth carbonate salts (e.g., M2CO3, MCO3).22,38–41 These salts offer deep capture potential of carbon dioxide due to their thermodynamic stability and ease of storage. Herein, alkaline thermal treatment (ATT) is studied in the context of converting a mix of plastic and brown seaweed in the presence of alkali earth hydroxides (i.e., KOH and LiOH) and both pyrolysis and gas reforming catalysts (zeolitic materials and nickel-based catalysts, supported on ZrO2).27,39 The main simplified reactions governing hydrogen production during the ATT reaction are given for an ethylene monomer of LDPE (eqn (1)) and a cellulosic monomer of brown seaweed (eqn (2)) below:22
| (C2H4) + 4(Li,K)OH + 2H2O → 2(Li,K)2CO3 + 6H2 | (1) |
| C6H10O5 + 12(Li,K)OH + H2O → 6(Li,K)2CO3 + 12H2 | (2) |
Electrochemical conversion of carbonate ions to high value carbon in molten salts
Previous studies have shown that regenerable molten salts can be used as liquid absorbents to facilitate both CO2 and acid gas capture in a wide variety of modalities. The following electrochemical reactions generally proceed during electrolysis in molten lithium carbonate as the electrolytic material:42–45| Li2CO3(molten) ↔ 2Li+ + CO32− | (3) |
| CO32− + 4e− → C + 3O2− | (4) |
| 2O2− → O2 + 4e− | (5) |
| Li2CO3(liquid) → C(CNT) + Li2O(dissolved) + O2(gas) | (6) |
Li2CO3 is consumed by the electrolysis and is continuously replenished by reaction of excess Li2O (formed electrolysis product) with the CO2 absorbed:
| Li2O(dissolved) + CO2(atmospheric, dissolved) → Li2CO3(molten) | (7) |
Capture of CO2 (eqn (7)) enables carbon removal from the environment (e.g., ambient air) by the molten salt. The subsequent electrolytic conversion of CO2 to carbon (eqn (4)), and preferably to CNTs or graphene produces value-added products and potentially lowers the cost of the CO2 capture and utilization.46,47 By using renewable electricity (e.g., offshore wind), the overall process can be sustainable. Unfortunately, the melting of lithium carbonate that is necessary for carbonate ion formation (eqn (3)) occurs at the high temperature of 723 °C, whereas the decomposition of lithium carbonate and formation of lithium oxide (Li2O) occurs at temperatures above 1200 °C. The presence of Li2O from lithium carbonate is a condition for CO2 capture by molten carbonates (eqn (7)).
Without the presence of metal oxides in the molten alkali metal carbonates, the capacity of the molten carbonates for capture of CO2 from the environment is low, and therefore, the subsequent electrolytic CO2 conversion to the value-added carbon products is limited in scale. The addition of Li2O to molten lithium carbonate is restricted because dissolution of solid Li2O in Li2CO3 is severely limited below T = 750 °C. When Li2O is added to Li2CO3 at 750 °C, Li2CO3 is observed to absorb CO2 from air; at 550 °C, Li2CO3 or its mixture with Li2O is present in a solid form and Li2CO3 will disadvantageously lose (desorb) CO2 into air by decomposition at that temperature.48 Therefore, lithium carbonates cannot be utilized as reversible CO2 sorbents at moderate temperatures below 750 °C. On the other hand, LiOH melts at 462 °C, possesses sufficient conductivity, and can act as an effective additive in the electrolysis processes.49
Furthermore, the presence of molten LiOH can promote co-electrolysis of carbonates and H2O to produce hydrogen and hydrocarbon fuels such as methane or longer-chain hydrocarbons given by the following cathodic and anodic reactions:50
At cathode:
| CO32− + 4OH− + 8e− → CH4 + 7O2− | (8) |
| 2OH− + 2e− → H2 + 2O2− | (9) |
At anode:
| 2O2− → O2 + 4e− | (10) |
These considerations, along with the potential role of LiOH in the alkali-mediated thermal conversion of biomass, guided our design of eutectic carbonates with lithium hydroxide as an additive.22 Here we define eutectic mixtures as compositions of lithium and sodium and/or lithium and potassium carbonate with melting temperatures significantly below those of the pure compounds. Such mixtures exist in a range of compositions and have been previously reported.51–54
Carbonate ion reduction and carbon formation/deposition reactions from eutectic alkali metal carbonate melts in the 500–750 °C range have been reported to occur in the −0.8 to −1.9 V range of cathodic reduction potentials, with cathode materials comprising metals such as Ni, Pt, W, Ag, Mo, Al, Cu, steel as well as glassy carbon electrodes.55–57 Some carbon formation results were recorded on stainless steel electrodes (grade 304) in mixed melts comprised of Li2CO3–Na2CO3 or Li2CO3–K2CO3 blends (molar ratio, 62:38) at 650 °C.58 Carbon was stated to be formed and the anodic peak at 1.5 V was attributed to carbon oxidation via the reaction:
| C + 2O2− → CO2 + 4e− | (11) |
No carbon production was observed at low current densities on a stainless steel electrode in molten Li2CO3–Na2CO3–K2CO3 at 600–700 °C.59 However, carbon deposition did occur at high electrolysis voltages (−2.5 to −5 V) on stainless steel or mild steel electrodes in molten Li2CO3–K2CO3 at 540–700 °C and in Li2CO3, Li2CO3–Na2CO3 (eutectic mole ratio, 52:48) and Li2CO3–Na2CO3–K2CO3.55 As an additional advantage in our salt composition design, Li–K carbonate has been shown to be a good catalyst for thermochemical conversion as shown previously.60
Development of integrated thermo-electrochemical technology for the conversion of commingled marine plastic wastes and biomass into value-added products
The coupling of these two reactive conversion processes (i.e., alkaline thermal treatment and carbonate molten salt electroreduction) provides a novel and efficient way to address the problem of marine plastic wastes commingled with biomass, while allowing the production of high-purity H2 and the utilization of seaweed carbon, which came from the atmosphere. The overall reaction can be considered a negative emission technology, particularly when renewable energy is used for the electrochemically driven elecATT reactions. Fig. 3 provides a general diagram of the proposed tandem conversion thermo-electrochemical (elecATT) process which would be performed in a split-cell system, removing ash and other solid byproducts between ATT and electrolysis. The major components of the system include the thermochemical ATT of biomass and plastic wastes, which produces carbonate salts of K and Li and valuable volatile gases. These gases are then further converted (i.e., cracked, reformed) into H2via catalytic treatment and a condenser is present to remove unconverted tars and recover waxes.22 Concurrent to these ATT processes, the molten carbonate salts are continuously converted into solid carbon, which deposits onto the cathode, and Li or K oxides.61 As the solid carbon is produced, the hydroxide is regenerated for the next cycle ATT reaction. Overall, this process represents an innovative thermo-electrochemical way to utilize complex marine waste streams.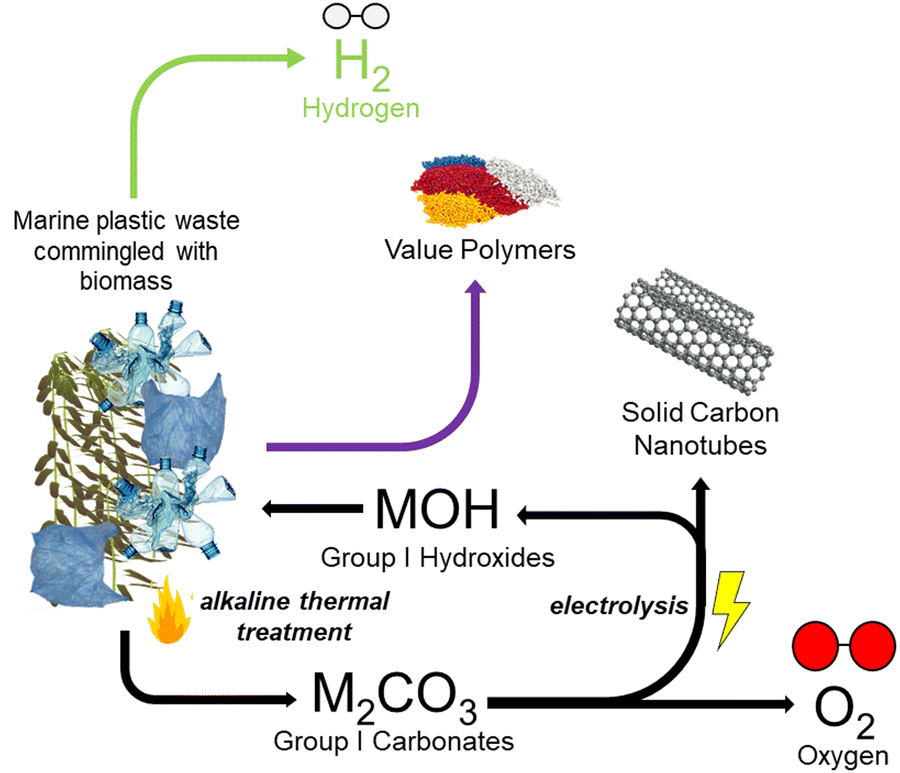 | ||
| Fig. 3 Schematic showcasing the proposed theoretical tandem thermo-electrochemical (elecATT) method of producing value added products and high purity hydrogen from marine plastics commingled with biomass. | ||
Results and discussion
Alkaline thermal treatment (ATT) of plastic wastes and marine biomass with high water and salt contents
For the electrochemical reactions, lithium carbonate (Li2CO3, ACS reagent, ≥99%), lithium hydroxide (LiOH, 98%) and potassium carbonate (K2CO3, ACS reagent, ≥99%) were all obtained from Sigma Aldrich Chemical Co. A powdered blend of Li2CO3 (21.07 g, 0.285 mol) and K2CO3 (24.16 g, 0.175 mol) was ground at ambient temperature using mortar and pestle and was dried in air at 350 °C for 8 h in an electric oven. Following cooling, the resulting eutectic Li, K carbonate (62:38 mol ratio of lithium and potassium carbonates, nominal composition, Li0.62K0.38CO3) was again ground and kept in a sealed container prior to the use. To prepare eutectic Li, K carbonate/lithium hydroxide blends, dried (Li0.62K0.38)2CO3 was blended with LiOH, the resulting mixture was ground using mortar and pestle. The final blend was dried at 350 °C and then kept in a sealed container until further use. The use of lithium and potassium hydroxides for the ATT reaction would increase the reaction temperature, but they allowed the coupling of ATT and electrochemical carbonate reduction reactions in a single reactor system. Thus, we first investigated the hydrogen formation behaviors of the new hydroxide mixtures for the ATT reaction.
Bio-hydrogen production via ATT using molten salt hydroxide
Hydrogen production potential, total gas evolution (Fig. 4(a)), and the gaseous product slate (Fig. 4(b)) were analyzed for six distinct reactions involving alkaline thermal treatment (ATT) on brown seaweed (BS) alone, LDPE alone, and a 50:50 representative mixture of BS and LDPE and the results are compared to those of steam gasification (SG) cases. The ATT of BS alone using a eutectic mixture of LiOH and KOH offered advantages in both increased H2 yield and the reduction of CO2 emissions relative to SG of the same at 600 °C. This trend is supported by previous studies on the ATT of BS using Group I hydroxides.22,40
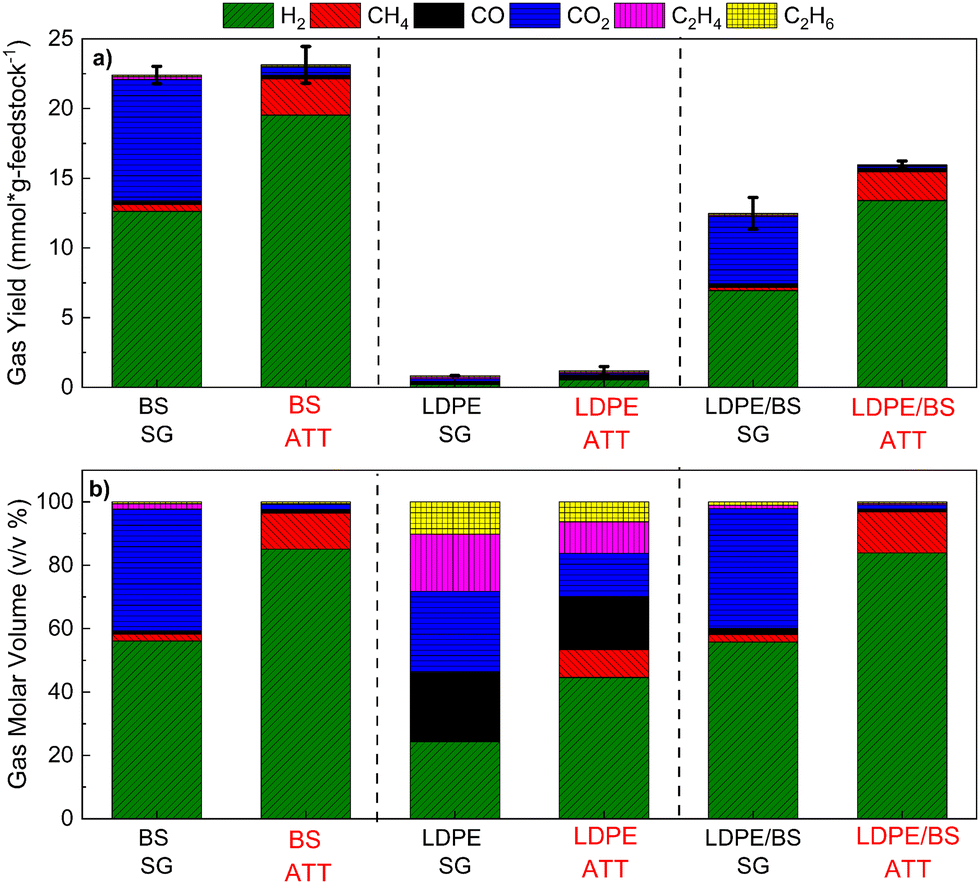 | ||
| Fig. 4 Total gas yields (a) and gas component molar volume (b) obtained during the thermochemical steam gasification (SG) and alkaline thermal treatment (ATT) of brown seaweed (BS), low-density polyethylene (LDPE), and a 50:50 mixture of BS and LDPE. ATT was performed in the presence of a stoichiometric amount of the mixture of (Li,K)OH. Data is normalized to volume per gram (mmol g feedstock−1). | ||
For the ATT of LDPE alone at 600 °C, both low gas yield and low hydrogen production were realized, suggesting that the polymer participated only slightly in the SG and ATT reactions. This result was corroborated with the large percentage of solid waxy polymeric condensates obtained from the SG of LDPE at 600 °C, suggesting that the thermodynamic barrier for thermal cracking and gasification of LDPE is only slightly breached at 600 °C. Higher temperatures were not tested to prevent the undesired calcination of produced lithium and potassium carbonates, thus limiting the conventional gasification reactions. Auto-decomposition of the Li–KOH mixture was performed in the absence of biomass or plastic, revealing minimal H2 yields compared to the actual ATT reactions (Fig. S10, ESI†).
In the SG and ATT of LDPE and BS mixtures, a similar trend was observed, where the use of ATT was able to increase the hydrogen yield of the reaction by approximately 93% and carbon dioxide emissions were reduced by up to 97%. These results suggest that ATT of marine biomass commingled with plastic wastes could be used as a feedstock to produce relatively pure H2 (84%) gas with enhanced carbon capture through the production of stable carbonate salts (e.g., lithium and potassium carbonate).
Due to the absence of hydroxides during steam gasification, water is the main oxidant. The gas evolution, cracking, reforming, water gas shift, and steam methane reforming reactions are all correlated to temperature.62 Additionally, tar and residue cracking and reforming also follows the same behavior.62 In order to probe the temperature effect on total gas yield, co-SG and co-ATT of LDPE/BS were performed at 500 °C as well (Fig. 5). With respect to the previously reported data obtained at 600 °C, an increase in the reaction temperature by 100 °C results in an increase in the total gas yield by almost 268%, with significant increases in H2 and CO2. However, comparison of the ATT gas yields of the same feedstocks at 500 and 600 °C reveals almost comparable total gas yields and gas compositions, since most of the ATT reactions have already occurred at a moderate reaction temperature of 500 °C (Fig. 5). This behavior highlights the distinct energetic and conversion advantages offered by ATT with respect to steam gasification in the thermochemical processing of carbonaceous feedstocks; ATT could be used to lower the energetic requirements of hydrogen production while capturing carbon.63 It is also important to note that, the gasification process requires dried feedstock, whereas wet and salty feedstocks (e.g., marine plastic wastes comingled with seaweed) can be used directly in an ATT reactor without any pre-treatment or drying, which is one of the most important benefits of the ATT technology.
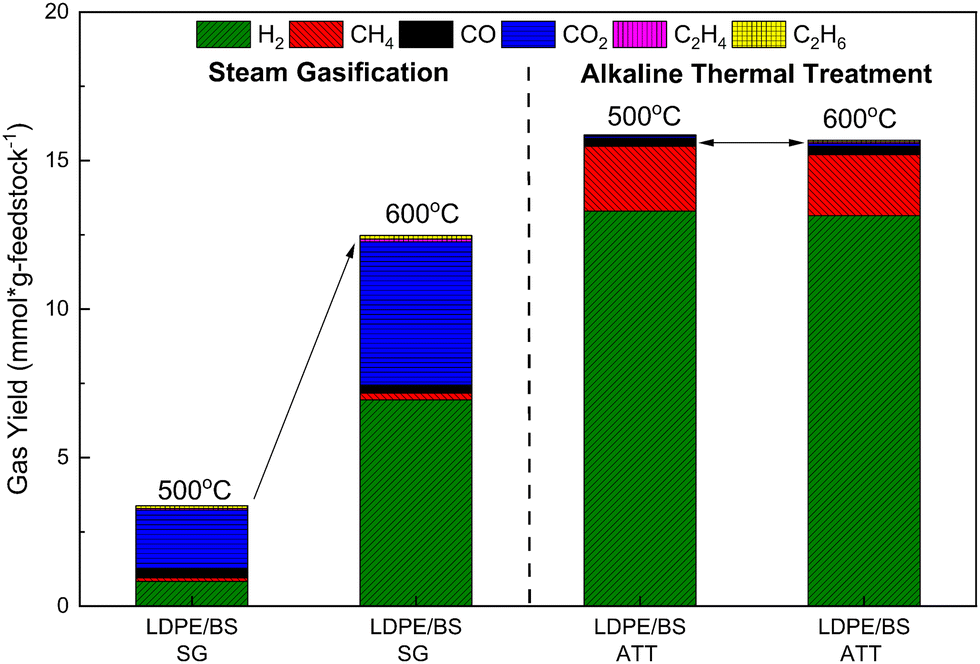 | ||
| Fig. 5 Total gas yield and gas distribution from steam gasification (SG) and alkaline thermal treatment (ATT) of a mixture of BS and LDPE (50:50) at both 500 and 600 °C. | ||
Investigation of different gas formation mechanisms during ATT of seaweed, plastic and their mixture using molten salt hydroxide
As shown in Fig. 6, H2 evolution involves multiple reaction pathways and mechanisms occurring at different temperatures. H2 is formed more rapidly and at earlier temperatures in ATT than in SG (Fig. 6(a)–(c)). In the case of the ATT of BS and the ATT of LDPE/BS, four distinct H2 peaks can be observed from the kinetic graphs, starting as early as 150 °C and reaching a maximum rate of 0.6 mmol min−1 g feedstock−1 with both systems. Hydrogen evolution during ATT ceased at about 500 °C (as indicated by a return to the baseline), whereas during conventional SG, hydrogen evolution did not occur significantly until at least 550 °C. Relatively no CO2 evolution was observed in the case of ATT due to the capture of CO2 into carbonate salts as given by eqn (1) and (2). The capture of CO2 also helped to boost H2 production by shifting the thermodynamic equilibrium of the water gas shift (WGS) reaction, as given below:| CO + H2O ↔ CO2 + H2 | (12) |
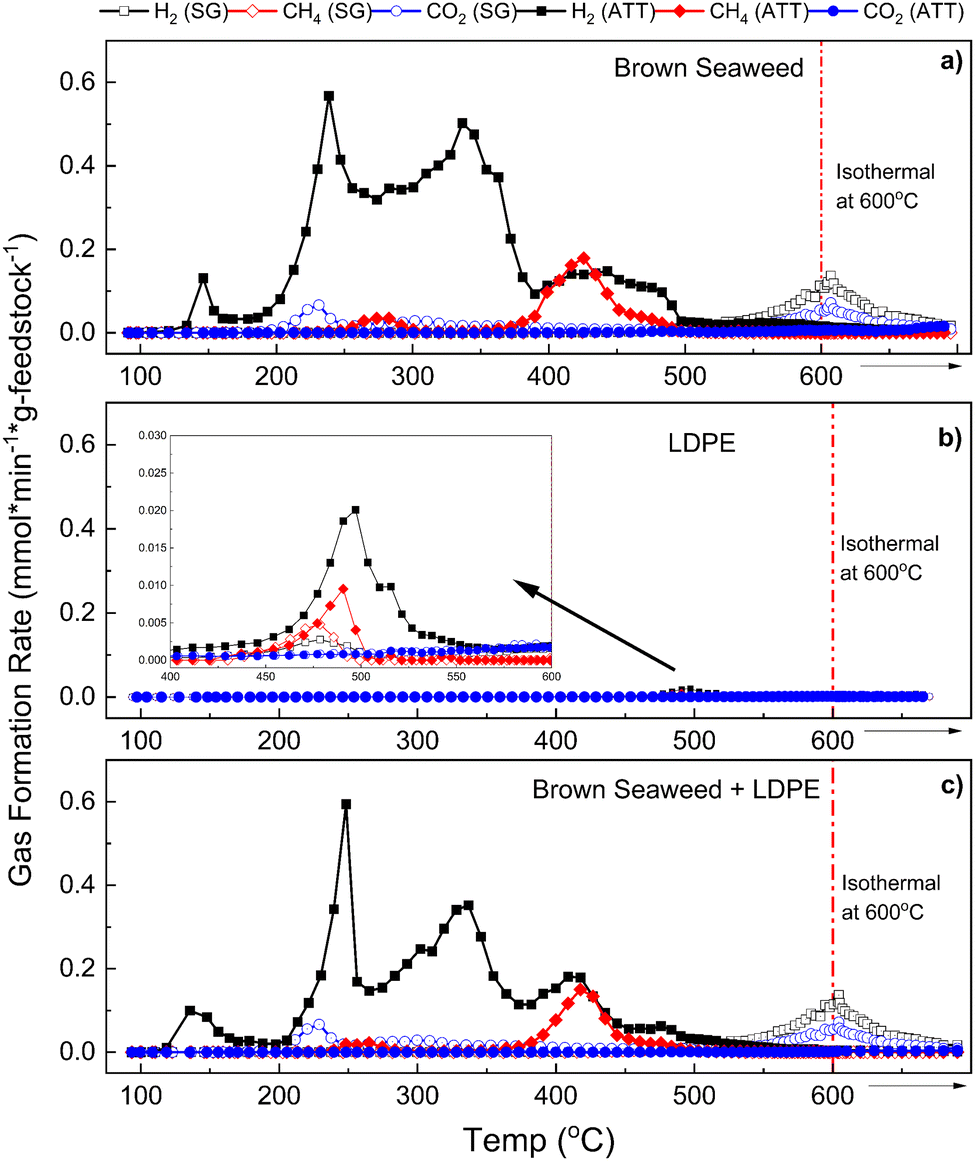 | ||
| Fig. 6 Kinetic data for gas evolution of the main reaction gases, H2, CH4, and CO2, produced during the thermochemical steam gasification (SG) and alkaline thermal treatment (ATT) of BS (a), LDPE (b), and a 50:50 mixture of BS and LDPE (c). Open circles represent the SG reaction kinetic data whereas closed circles represent the ATT reaction kinetic data. Kinetic data are expressed as gas formation rate per minute per gram (mmol min−1 g feedstock−1). | ||
According to La Chatelier's principle, the consumption of CO2via reaction with LiOH and KOH will shift the equilibrium of the WGS reaction towards the right. Thus, ATT is inherently productive in increasing H2 production while also producing virtually no gaseous CO2 emissions.22,38 In both the ATT of BS and the ATT of LDPE/BS mixture, methane production increased approximately 5.3-fold relative to SG (Fig. 4 and 6). This is likely due to the enhancement of methanation reactions (e.g., CO + H2 ↔ CH4 + H2O) and elevated light gas reforming and tar cracking, increased by the presence of the hydroxide mixture.38 Results suggest that significant methane evolution during ATT occurs at about 380 °C and returns to the baseline at about 500 °C (accompanied by H2Fig. 6(a) and (c)). Increased methane production during ATT suggests more efficient conversion of light gases and possible enhanced tar and wax cracking. Previous results suggest that catalysts (such as nickel catalysts) can enhance the conversion of methane to lighter gases during ATT via steam methane reforming (SMR) as given by eqn (13):22,37,39
| CH4 + H2O ↔ CO + 3H2 | (13) |
Catalytic enhancement of the ATT process increasing H2 yield and purity
Catalysts can assist with the cracking and degradation of carbonaceous feedstocks (e.g., plastics, biomass) during thermochemical reactions in both the solid and gaseous states.22,27,64 They can also assist with reforming reaction which can boost the overall amount of hydrogen in the final product.65 Such catalysts include Ni-based systems and zeolitic materials. As previously shown in Fig. 6(b), the SG and ATT of LDPE alone yielded low H2 evolution compared to the ATT of BS. Thus, in an effort to improve the ATT conversion efficiencies of plastics at lower pressures and temperatures than conventionally used a catalyst system of Ni supported on ZrO2 mixed with y-zeolites (30:1 Si/Al ratio, ZLT) was used in both in situ and ex situ (see Methods for details) configurations. As shown in Fig. 7(a) and (b), using either Ni/ZrO2 or y-ZLT in situ during ATT of LDPE alone increases the H2 yield by approximately 267%. The combination of the two catalysts proved to be quite promising for enhancing the hydrogen yields from the ATT of LDPE, producing over 820% more H2 during in situ Ni/ZLT catalytic ATT (catATT) and over 1242% more H2 during ex situ Ni/ZLT catATT (Fig. 7(b)). Additionally, during the catATT reactions of LDPE, no observable waxy condensate product was found after the reactions. This suggests that the catalysts are directly assisting with the conversion of the plastic feedstock.66
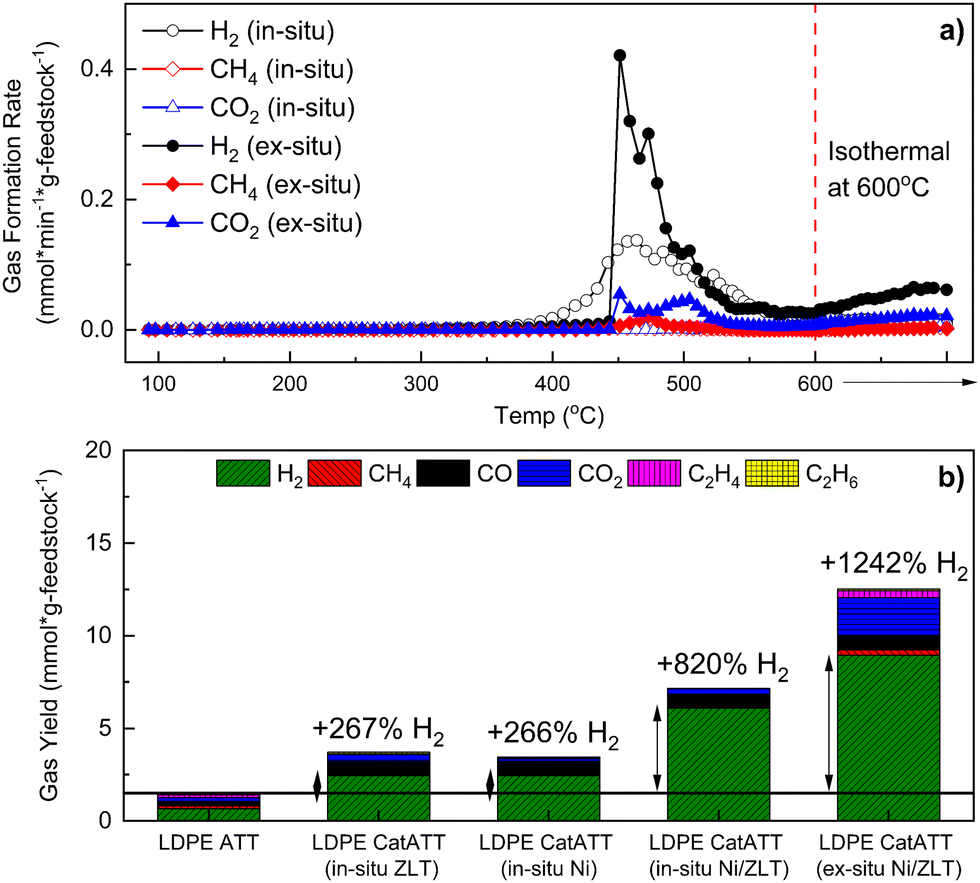 | ||
| Fig. 7 Catalytic alkaline thermal treatment (CatATT) of LDPE using a zeolite catalyst (ZLT), a nickel catalyst on zirconia (Ni), and a combination of the two (Ni/ZLT) both in situ and ex situ. (a) Gas formation kinetics of LDPE ATT with a 1:1 mixture of Ni/ZLT catalysts both in situ (closed shapes) and ex situ (open shapes). (b) Total gas yield and distribution of LDPE ATT reactions with in situ catalysts (Ni, ZLT, and a 1:1 mixture of the two) and ex situ catalysts (a 1:1 Ni/ZLT mixture). | ||
Previous work from our group has shown that catalysts for ATT perform similarly whether they are present in situ or ex situ.39,67 In both cases they assist in the promotion of the steam methane reforming (SMR – eqn (13)) and water gas shift (WGS – eqn (12)) reactions, which is also observed herein in the case of catATT of LDPE. CO2 is produced during the SMR reaction, as can be seen in the case of LDPE catATT ex situ (Fig. 7(b)) and is present in the final gas product if no downstream scrubbers are used. During in situ catATT, this CO2 is captured by excess hydroxides, forming additional carbonate materials, which results in a higher quality of hydrogen. However, from a process standpoint, utilizing in situ catATT may pose challenges with catalyst recovery and regeneration due to the caustic environment of eutectic salts. This effect can be observed in the post reaction analysis of the catalysts by PXRD (Fig. S11, ESI†) and SEM (Fig. S12, ESI†), showing salts caked onto the catalysts in the case of in situ catATT. As shown by Stonor et al. (2017),39 it may be useful to use Ca-rich materials to capture CO2 produced from the SMR downstream of the ex situ catalyst to boost the quality of H2 gas back to near 99%.
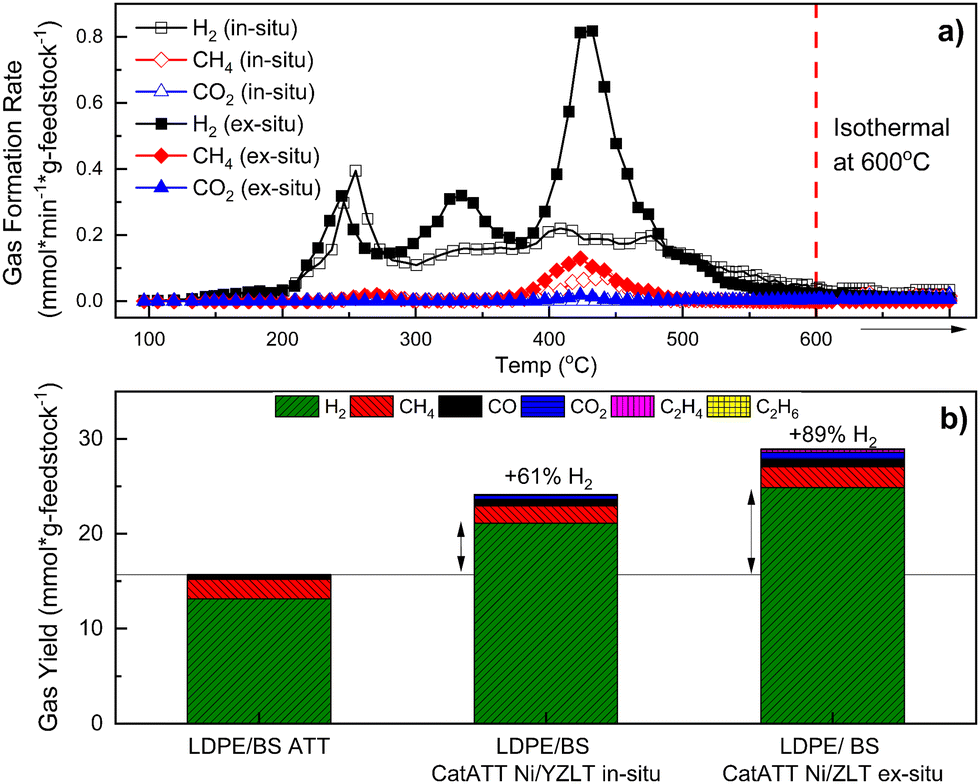
Finally, this catalytic nickel/zeolite system was extended to the ATT of a 50:50 mixture of LDPE/BS to realize any potential conversion advantages between catATT and conventional ATT/SG at 600 °C. In situ catATT of LDPE/BS yielded 61% more H2 and ex situ catATT of the same yielded 89% more H2 than conventional ATT (Fig. 8(b)). Kinetically, ex situ catATT of LDPE/BS shows three distinct H2 evolution peaks (at ∼250 °C, 340 °C, and 440 °C) while in situ catATT of LDPE/BS shows one sharp peak (at 260 °C) and then a broad H2 evolution peak ending close to 600 °C (Fig. 8(a)). This difference points to the stronger gas phase activity of the Ni/ZLT catalytic mixture, performing cracking, gas reforming, and WGS reactions simultaneously, as supported by previous work.22,40
 | ||
| Fig. 8 CatATT of a mixture of BS and LDPE with a Ni/ZLT catalyst system both in situ and ex situ at 600 °C with both kinetic gas yield data (a) and total gas yield data (b). | ||
Fate of seaweed and plastic waste carbon through the ATT reactions
Melting and cooling curves for all the samples tested shifted lower, such that the crystallization temperature (Tc) of the waxes was in the range of 76.3–83.2 °C (vs. 93.0 °C for virgin LDPE) and the melting temperature (Tm) was in the range of 84.3–88.9 °C (vs. 110.8 °C for the virgin LDPE) (Fig. 9(a), (b) and Table S1, ESI†). Percent crystallinity (XC) was also calculated based on the extracted enthalpies of melting and using a reference enthalpy of melting for pure crystalline PE (see eqn (22)).69 In the case of the wax from the LDPE SG reaction, XC was 6.9% lower than for virgin LDPE, whereas LDPE/BS SG wax had an XC which was only 1.0% lower than that of virgin LDPE. Interestingly, the wax from ATT of LDPE/BS has a XC of 61.0%, 5.8% higher than that of virgin LDPE (Fig. 9(a), (b) and Table S1, ESI†). This suggests that the presence of wet and salty biomass during the reaction can potentially lessen the thermochemical damage of the reactive process, producing a more crystalline waxy condensate. In the case of the ATT waxy condensates, the increase in percent crystallinity could be a result of the interactions of the alkaline salts and the melting/pyrolyzing plastic. Although the crystallization and melting points have been shifted for these waxes, the relatively similar and even enhanced crystallinities suggest that these waxy condensates could be feedstocks for plastic production operations or blending into existing polymer supply chains, allowing the recovery of valuable materials from detritus plastics commingled with marine biomass.
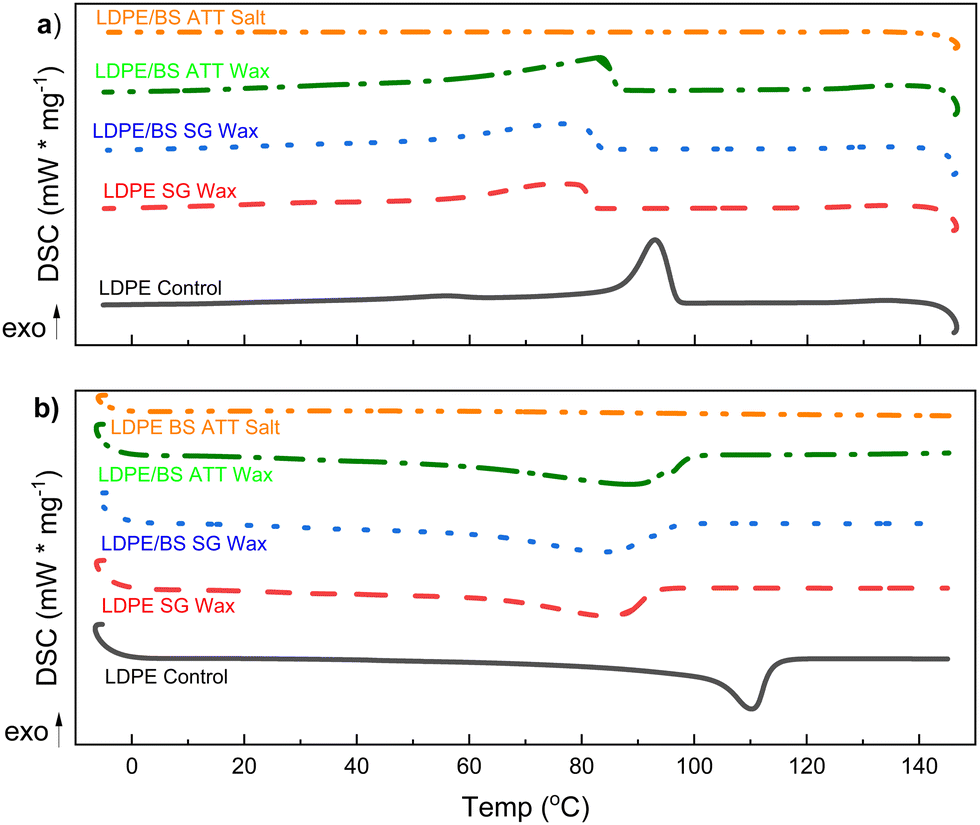 | ||
| Fig. 9 Differential scanning calorimetry (DSC) data on the solid waxy condensable products from both SG and ATT reactions to compare the efficacy of the crystallization and melting behaviors of the polymeric products with respect to the original LDPE. DSC heating curves (a) and cooling curves (b) were collected in argon atmospheres for SG of LDPE, SG of LDPE/BS, and ATT of LDPE/BS. The salt from the latter ATT reaction (LDPE/BS ATT) was tested for residual polymeric matter. | ||
Gel permeation chromatography (GPC) analysis of the waxy solid condensates revealed that Mn (number average molecular weight) was reduced significantly when compared with the virgin LDPE (Fig. 10(a), (b) and Table S2, ESI†). The longer retention time and narrowing of the elution curve for the LDPE SG Wax, LDPE/BS SG Wax, and LDPE/BS ATT Wax suggests that the thermochemical processing of these plastics at 600 °C, either by steam gasification or ATT, alters the polymeric structure through melting and volatilization and then subsequent recrystallization with shorter fragmented polymers and modifications to the LDPE branching. This drastic change can also be exemplified by the change in the dispersity index (i.e., Mw/Mn) between the original LDPE polymer and the post-reaction waxy condensates which dropped from 3.61 to values between approximately 1.16–1.59. Lower dispersity values indicate more polymeric uniformity, which is likely a result of the thermochemical cleavage and reorientation of LDPE side chains during the SG/ATT reactions.
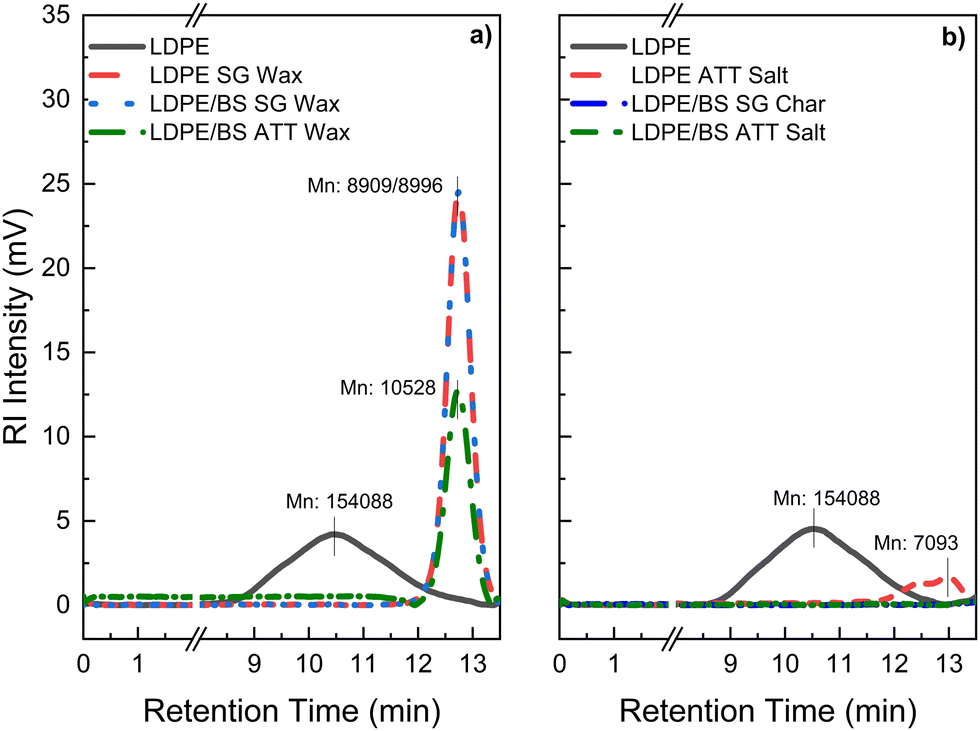 | ||
| Fig. 10 High temperature gel permeation chromatography (HT-GPC) elution curves expressed in refractive intensity (RI) of the waxy condensate products of SG and ATT reactions involving LDPE (a) and the corresponding reaction salt mixtures (b) both run at a steady state temperature of 140 °C using 1,2,4-trichlorobenzene (TCB) as a solvent. | ||
Previous studies have suggested that more uniform polymers with dispersity indexes closer to 1 and lower Mn values are easier to process in polymeric engineering systems, such as extruders, due to lower shear stress susceptibility.70 As a follow-up, a sample of final molten ATT salt was tested as a proof of concept (via DSC, GPC) to probe any residual plastics remaining in the salt mixture. As shown in Fig. 9(a), (b) and 10(b), no detectable melting of the ATT salt reaction product was observed via DSC and minimal elution was detected from the salts via GPC, respectively. The exception was the salt of the LDPE ATT reaction, which showed minor polymeric residues present, likely due to the pure feedstock of the reaction existing as plastic. These results suggest that high purity, lower molecular weight polymers with similar crystallinities as the starting LDPE material could be easily recovered during these thermochemical reactions.
Distribution of carbon in different ATT product streams and characterization of formed molten carbonates/hydroxides
Analysis of the reaction intermediates revealed that ATT increases the percentage of carbonates with respect to all the feedstocks tested at 600 °C (Fig. 11(a)). The percentage of inorganic matter in the solid product was 97.5% in the case of BS ATT, 72.1% in the case of LDPE/BS ATT, and only 28.5% in the case of LDPE ATT. Visually, the presence of carbonate products can be seen by the change in the reaction product from a black material to a white powder (insert photo, Fig. 11(a)). This qualitative result suggests ATT allows increased carbon conversion by increasing char cracking and offsetting any potential char formation via solid carbonate salts. The low percentage of inorganic carbon in the solid phase of LDPE ATT is likely due to low feedstock conversion efficiencies in the absence of catalyst at 600 °C and potential salt/plastic interaction issues. This was further corroborated by the amount of solid waxy condensate products produced during the ATT of LDPE samples. As shown by the full carbon distribution balance (Fig. 11(b)), a high percentage of waxy solid was recovered in the condenser trap in the LDPE SG and LDPE/BS SG cases. Combustion analysis confirmed that it was a carbonaceous material, with a similar percentage of carbon as the original feedstock (∼85 wt%). This suggests that a portion of the carbon is not being fully converted in the case of either LDPE or LDPE/BS SG/ATT without the presence of the previously discussed catalytic system. However, ATT is still an effective method to not only perform thermochemical conversion at lower temperatures but also allows for the offset of potential carbon emissions during the reaction through the formation of solid carbonate salts.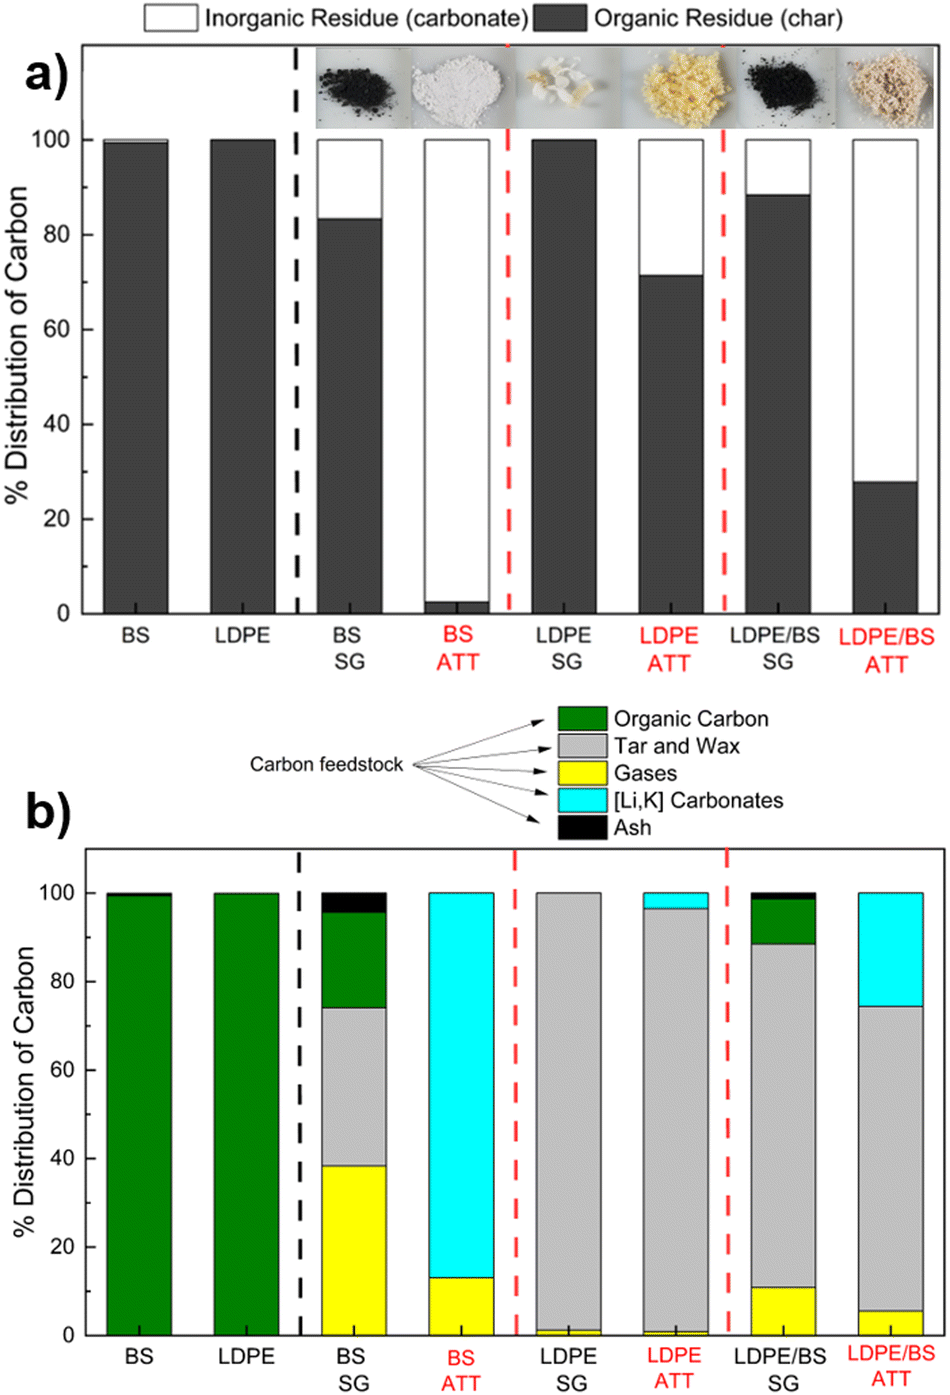 | ||
| Fig. 11 (a) Carbon distribution from the solid products (i.e., char or salt) of the various reactions studied in terms of inorganic residues (carbonates) and organic residues (chars). (b) Carbon distribution of all the thermochemical reaction products from both SG and ATT cases of BS, LDPE, and a 50:50 mixture of BS and LDPE are shown. The products are classified as organic carbon (char, solid residues), tar and wax (solid and liquid condensables), gases (CO, CO2, C2H4, C2H6), (Li, K) carbonates (inorganic carbon, solid residues), and ash (non-combustible solid residue). | ||
Integration of molten salt electrolysis to develop elecATT technology directly converting carbonates into solid carbon
| CO32− → CO2 + 0.5O2 + 2e−; E° = 0 V | (14) |
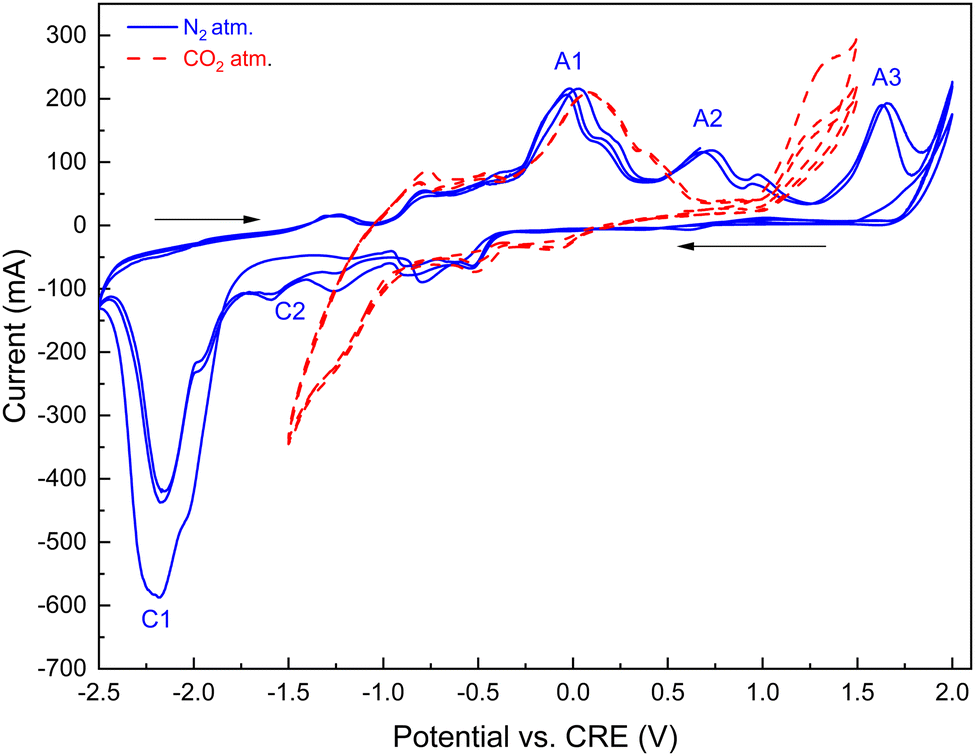 | ||
| Fig. 12 Representative cyclic voltammograms (CV) of a galvanized steel cathode in molten carbonate and lithium hydroxide blend (initial blend composition: Li2CO3:K2CO3:LiOH, 52:32:15 molar ratio). Anode: nickel crucible; temperature: 550 °C. The potential scan started cathodically from 0 V, and the reduction and oxidation sweep directions are shown by arrows (IUPAC convention). Solid and dotted lines show three consecutive scans (scan rate, 20 mV s−1) measured under nitrogen and CO2 purge, respectively. Designations A and C stand for anodic and cathodic peak potentials, respectively. | ||
The observed formation of black coating on the anode interior (see Fig. S6, ESI†) is attributed to the nickel oxidation reaction (reported standard potential 0.697 V71,73) on the anode-melt interface:
| Ni° + CO32− → NiO + CO2 + 2e− | (15) |
The oxidation peak potential (eqn (15)) is indicated by A2 in Fig. 12 on the oxidation scan under a nitrogen atmosphere. Numerous prior studies reported a variety of reduction reactions for nickel compounds in the presence of neutral gas or carbon dioxide:74–77
| NiO + 2e− → Ni° + O2−; E° = −1.50 V | (16) |
During the cathodic reduction, at potentials in the −1.5 to −1 V range, nickel oxide dissolves, forming complexes of nickel and carbonate ions. These complexes are reduced to nickel and carbonate ions (designated by C2 in Fig. 12); the formed nickel is then oxidized in the following anodic scan, at potentials in the 0.5 to 0.9 V range.76 Under a CO2 atmosphere, the oxidation peaks A2 are broadened and shifted to lower oxidation potentials due to the formation of complexes between dissolved nickel ions and dissolved CO2.
In our experiments with the eutectic carbonate–LiOH blends in nitrogen atmosphere (Fig. 12), carbon was produced by cathodic reduction of the carbonate anions (eqn (4); indicated as C1 in the −2.3 V range – Fig. 12). The peaks C1 were prominent due to high concentrations of the carbonate CO32− anions formed by dissociation of the molten alkali metal carbonates. Carbon was deposited on the galvanized steel cathode in significant quantities, along with deposition of the alkali metals. Electroreduction processes in eqn (4) (C1 in Fig. 12) can be seen as transient, as the corresponding peak potentials decreased with increasing number of scans, indicating that the majority of the dissolved CO2 and carbonate ions were electro-reduced.
The reactions in the electrodeposition of carbon by CO2 electrolysis are important for generation of value-added carbon products in our hybrid process.78,79 In our experiments with the molten Li, K carbonate and LiOH blends under a nitrogen atmosphere (Fig. 12), carbon was produced by cathodic reduction of the carbonate anions formed by dissociation of the molten alkali metal carbonates (indicated as C1 in the −2.3 V range; Fig. 12). Carbon deposited on the galvanized steel cathode in significant quantities depending on the molten salt composition, as outlined below. It should be noted that carbon formed on the cathode can be re-oxidized on the anode at higher potentials (transient reactions indicated by A3 in Fig. 12).80–82
| C + 2CO32− → 3CO2 + 4e− | (17) |
Effect of lithium concentration on carbon yield in electro-splitting
Coulombic efficiency (Ce, %) was calculated as the percent of applied current charge that resulted in carbon production according to eqn (18):83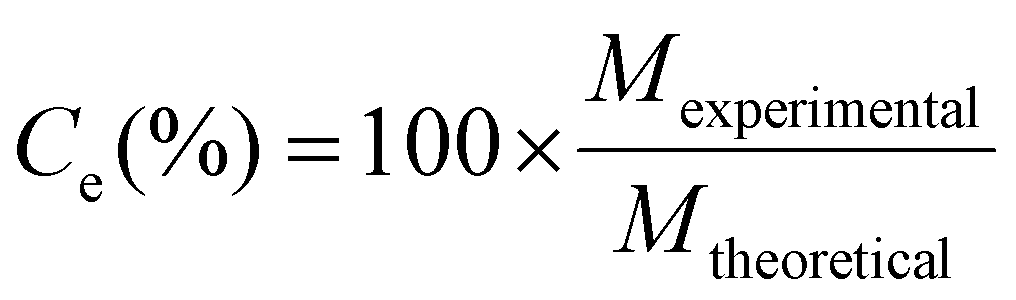 | (18) |
= (Q/nF) × (12.01 g C mol−1) is the theoretical mass, which is determined from Q, the time integrated charge passed during the electrolysis; F = 96485 A s mol−1 e−, the Faraday constant, and n = 4 e− mol−1, reduction number of tetravalent carbon. Previous results indicate that both high initial concentrations of carbonate ions (CO32−) and lithium in the molten electrolyte are required for the efficient conversion of CO2 into carbon, according to the well-established mechanism of the 4-electron reduction of the carbonate ions to carbon (eqn (4)).78 For the reaction to occur in the molten electrolyte, a certain equilibrium concentration of the carbonate ions should be established, either by eqn (19) or by the formation of carbonates during ATT:61| CO2 + O2− ↔ CO32− | (19) |
Our results (Fig. 13) demonstrate that the effect of LiOH addition to the eutectic blend of two molten carbonates is the additive result of two opposing trends. That is, the enhancement of the overall lithium content in the composite by approximately 1 wt% at CLiOH ∼ 15 mol% enables approximately 20% enhancement in the carbon product yield and Coulombic efficiency (Fig. 13). However, further “dilution” of the carbonate by LiOH and decrease in Ccarbonate leads to a precipitous drop in the production of carbon (Fig. 13 and eqn (4)), with the initially pure LiOH electrolyte failing to result in any carbon formation under the conditions of our experiment. Molten LiOH fails to produce enough CO32− in our experiments in the allotted timescale because the CO2 capture occurs via the following sequence of reactions, which are both kinetically slow and thermodynamically challenging:84
| 2LiOH → Li2O + H2O | (20) |
| Li2O(molten) + CO2(atmospheric) ↔ Li2CO3(molten) | (21) |
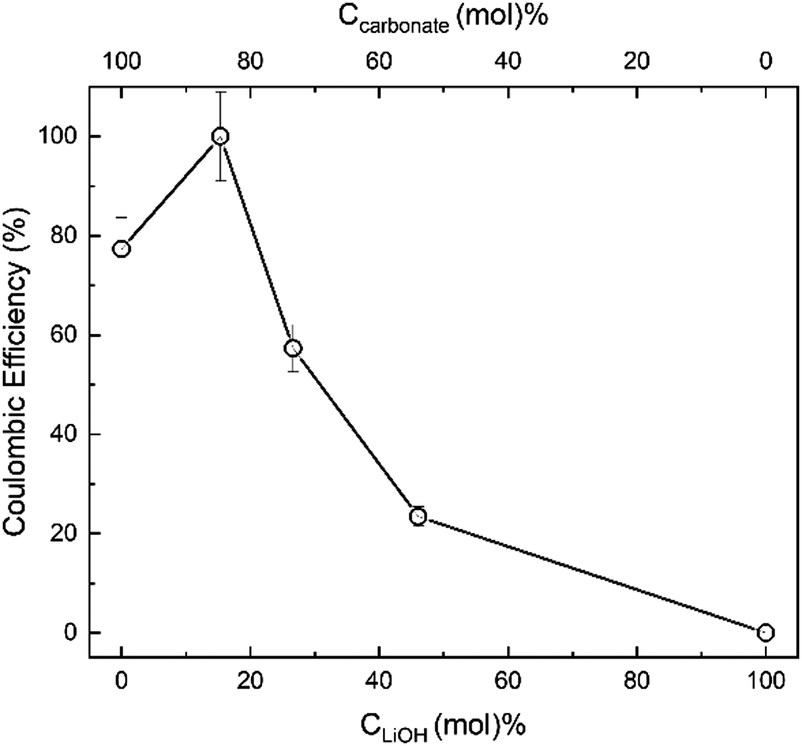 | ||
| Fig. 13 Effect of initial LiOH content (CLiOH, mol%) and initial carbonate content (Ccarbonate, mol%) of the Li2CO3/K2CO3/LiOH electrolyte on the Coulombic efficiency of CO2 electrosplitting process at 500 °C. The electrolyte Li2CO3/K2CO3 mol ratio was set at eutectic 1.63 throughout.51 | ||
Deng et al. demonstrated that it is the presence of lithium carbonate that affords the electrochemical conversion of CO32− to C (eqn (4)), via formation of the carbonate ions (eqn (3)).84 Hence, LiOH added to the carbonate melt must produce Li2O that can absorb CO2 due to its strong alkalinity, resulting in a continuous conversion of CO2 to carbon on the cathode (eqn (4)) and oxygen on the anode (eqn (5)).
It has been demonstrated that the carbonation of Li2O (eqn (7)) is of vital significance as a key intermediate reaction of carbon formation.84 Since Li2O serves as the intermediate for CO2 capture and electrochemical conversion and no Li2O is initially present in LiOH, no deposition of carbon from the LiOH melt occurs (Fig. 13).78 The rate of carbonation (eqn (7)) should match the rate of electrochemical deposition (eqn (4)) to achieve a net transformation of CO2. It appears from our electrosplitting results (Fig. 13) that the carbon (CNT) formation was determined by the initial concentration of carbonate (displaced by LiOH) and not by the mass of CO2 absorbed.
Electrolyte materials-characterization
Powder X-ray diffraction (PXRD) was performed on the products of CO2 electrolysis collected on galvanized steel cathodes (Fig. S8, ESI†). Broad peaks centered at 2θ = 26 − 26.2° were prominent in XRD patterns of the electrolysis products. The product collected from the cathode at the end of the hybrid process was purified and subjected to elemental analysis for carbon content. We were able to obtain a product that contained up to 90–98 wt% carbon; weighing the products enabled calculation of the Coulombic efficiency of the CO2 electrolysis, which was close to 100%, both with LDPE and brown seaweed (BS) initially present. Concentrations of lithium, zinc and nickel in the purified products of the hybrid process with LDPE and BS varied (0.1–0.5 wt%, 0.01–0.03 wt%, and 0.1–0.5 wt%, respectively). Interestingly, the peaks at around 26.2° were clearly present in the products wherein LDPE was initially present, but were minor or absent in the products that originated from the seaweed-containing blend. That indicated that the latter products contained primarily amorphous carbon. However, carbon nanotubes were observed in both types of products.The XRD patterns of the electrolysis products also featured peaks at 2q = 21.3°, 30.6°, and 31.8°, characteristic of the lithium carbonate admixtures that were not removed from the products in the process of purification.85,86 XRD pattern peaks at 34.4° and 2q = 34.4° and 36.2° were due to the presence of ZnO nanoparticles (standard JCPDS cards #79-0206, #36-1451), formed via oxidation of zinc originally present on the galvanized steel cathode surface.87,88 Finally, peaks that are present in some products at 2q = 43.5° and 44.7° are due to NiO crystal lattice and Ni electrodeposited onto the product on the cathode from the molten salt solution, respectively.88,89 It has been noted previously that zinc and nickel ion admixtures to the molten carbonates mediate the synthesis and contribute to the yield of carbon nanotubes in the process of CO2 electrolysis.47,53,90
Analysis of the carbon nanotube (CNT) products
SEM and TEM confirmed the presence of CNT products in the electro-reduced product salt, as deposited on the cathode (Fig. 14). SEM allowed the visualization of the CNT microfibers from the electrolysis of the (Li0.62K0.38)2CO3 salt with 13 mol% LiOH, while TEM showcases the multiwalled structures (Fig. 14(A)–(C)). SEM was unable to confirm the bulk presence of CNTs in the same reaction done with BS, however TEM showcased that multiwalled CNTs were indeed present in the post-reaction mixture (Fig. 14(D)). This corroborates the XRD data (Fig. S8, ESI†), which indicated a higher degree of amorphous carbon based on the graphitic peak at 26.2°.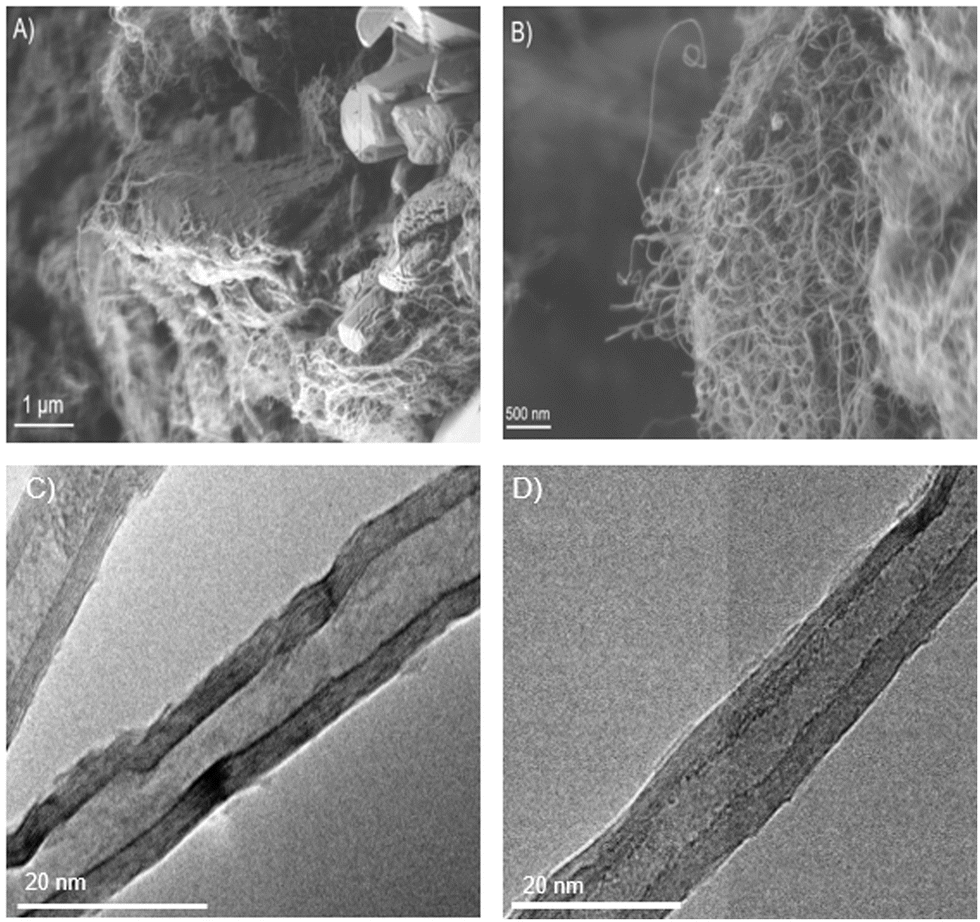 | ||
| Fig. 14 Top row: Representative SEM images of product obtained by electrolyzing (Li0.62K0.38)2CO3 + 13 mol% LiOH with 8 wt% LDPE at 14.2k× magnification (A) and 20.2k× (B). Bottom row: Representative TEM images of product obtained by electrolyzing (Li0.62K0.38)2CO3 + 13 mol% LiOH with 8 wt% LDPE (C) and the same with 8 wt% seaweed (D), confirming multiwalled carbon nanotubes. | ||
Great potential for offshore marine plastic waste cleanup applications
One of the most pressing issues relating to the abundance of marine plastic debris present on the ocean surface and top ocean strata is the volume it occupies because of its relatively low density.4 One option for treatment of these marine and coastal plastic wastes is simply harvesting and then subsequent landfilling. There are a few companies already involved in plastics cleanup, such as The Ocean Cleanup™, which utilizes a process involving the booming of the ocean in high wind and entrance points.91 However, these solutions require landfilling of the collected debris which will simply transfer the problem from sea to land, although in a more controlled manner. Furthermore, anaerobic decomposition of commingled biomass in landfills results in emission of methane, a potent greenhouse gas. The disposal of these marine plastics commingled with biomass via thermo-electrochemical processing is highly advantageous as it not only enables production of high-value products from detritus feedstocks but also allows the volumetric reduction of the feedstock. It is essentially a “carbon-concentrating” mechanism that allows for upgrading, capturing, and then deposition of carbon in the form of CNTs. The overall estimated volumetric reduction using the known densities of the reactants and products is approximately 220% (Fig. S3, ESI†).10,17 This makes the elecATT tandem thermo-electrochemical treatment (proposed in Fig. 3) of waste streams a highly attractive method to generate energy, high-value products, and reduce the relative volume the waste occupies.Conclusions
In this work, we successfully demonstrated the thermo-electrochemical conversion of LDPE commingled with wet and salty seaweeds into high purity H2, valuable waxy polymeric condensates, and high-value CNTs. Ni/ZrO2 and zeolite catalysts were able to increase the production yield of H2 from LDPE by approximately 1242%. The recovery of uniform high-purity waxy condensates from the SG and ATT of LDPE and LDPE/BS was confirmed by similar % crystallinities, melting curves, and resultant size-exclusion column elution data. Carbon analysis showcased that the formation of carbonates was prevalent in the case of ATT of brown seaweed and LDPE mixed with brown seaweed; however, negligible carbonate formation was observed in the ATT of plastic alone (LDPE), confirmed by low gas yields via Micro GC analysis. This elucidates that the direct thermochemical conversion of LDPE at 600 °C is poor, and thus catalytic enhancements are needed should the reaction be carried out at moderate temperatures. Finally, the electroreduction of the eutectic lithium/potassium carbonate mixture proved successful, yielding up to nearly 100% of high purity CNTs, as confirmed by cyclic voltammetry, SEM, and XRD of the post-reaction mixtures. These results suggest that tandem thermo-electrochemical reaction systems can create high value products from environmental pollutants, such as biogenic materials commingled with marine plastic wastes, through the concentration of carbon and feedstock volumetric reduction. Additionally, the use of solar or solar thermal systems to heat the reactor up to molten salt temperatures in addition to utilizing renewable electricity for the electro-reductive hydroxide regeneration both have a great potential within this novel ocean-based Bio-energy with Carbon Capture and Storage (BECCS) and marine waste treatment and upcycling technology.Experimental
Materials
:1 Si/Al mole ratio, 780 m2 g−1, Alfa Aesar) and a nickel-based catalyst (10 wt% Ni supported on zirconia, prepared in-house) were studied both in situ and ex situ. The nickel catalyst was prepared in-house using nickel(II) nitrate hexahydrate dissolved in ethanol and impregnated on zirconia via gradual heating and addition of ZrO2 following the methodology of Zhang et al. (2020).22 Afterwards, the particles were dried at 70 °C overnight and calcined in air for 3.3 hours. Finally, the catalysts were then reduced in a hydrogen atmosphere for final activation.22 Characterization of the raw catalysts and the catalysts after both the in situ and ex situ LDPE ATT were performed using PXRD (Fig. S11, ESI†) and SEM (Fig. S12, ESI†) to assess any structural or visual changes to the catalysts.
Methods
Three main types of reactions were performed: steam-gasification (SG), ATT, or catalytic-ATT (catATT; either in situ or ex situ). For SG reactions, the ceramic boat was charged with feedstock and no salts were added. For ATT reactions, the corresponding amount of a hydroxide mixture (LiOH:KOH, 50:50 molar ratio) was added to the ceramic boat, as determined by stoichiometric calculations (stoichiometry given by eqn (1) and (2); two molar equivalents of hydroxide was used per mole of carbon). Finally, for catalytic-ATT reactions, Y-zeolite and Ni/ZrO2 and a 50:50 mixture of the two were charged in the ceramic boat at a ratio of 1:1 feedstock:catalyst (w/w) along with the feedstock and salt (in situ), or placed in a steel wool chamber ∼20 cm downstream of the ceramic boat (ex situ). This ratio of brown seaweed (BS) to LDPE (1:1) was chosen as a representative metric for the commingling of marine waste and biomass. The reactor was continuously filled with a carrier gas, N2, at a constant rate of 50 mL min−1 as measured by a mass flow controller (Omega FMA5508). The reactor was preheated at a rate of 4 °C min−1 to 80 °C, at which point the temperature was maintained for 30 minutes. Afterwards, the reactor was heated (again, at a rate of 4 °C min−1) to either 500 or 600 °C, where gas samples were analyzed in real time every 2 minutes. Finally, the reactor was maintained at the final temperature for 90 minutes before the conclusion of each experiment. A condenser operated at 0 °C was connected to the outlet of the reactor before the Micro GC to serve as a tar and wax trap for certain condensable products, which were further analyzed. A control experiment was performed to assess the degree to which the eutectic hydroxide mixture of Li–KOH could evolve hydrogen absent of any biomass or plastic present (Fig. S10, ESI†), revealing minimal H2 evolution.
Hybrid thermo-electrochemical reactor
The withdrawn cathode was black, with carbonaceous products of the electrolysis adhering to the cathode surface, a result of the reactions. The nickel anode was observed to be covered by a black coating due to the formation of nickel oxide (Fig. S6, ESI†). The withdrawn cathode was then placed in deionized water and sonicated for 30 min to produce a black suspension (Fig. S6, ESI†). The suspended particles were separated by centrifugation, resuspended with sonication in 1 wt% aqueous HNO3 solution and dialyzed for 2–7 days at room temperature against excess 1 wt% aqueous HNO3 solution (membrane MWCO, 12–14 kDa).
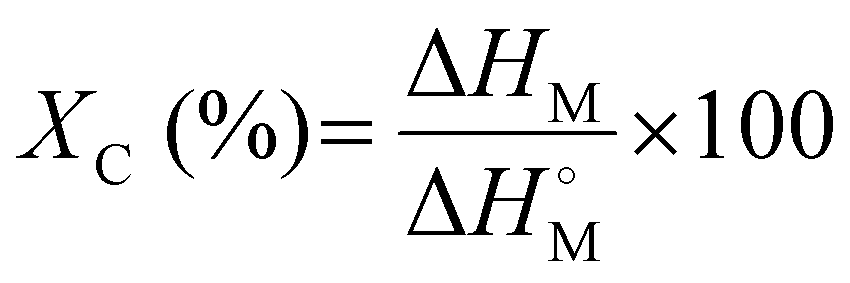 | (22) |
 is the melting enthalpy of fully crystalline PE with a value of 293 J g−1.69
 | (23) |
Author contributions
A.-H. A. P., T. A. H., A. J. M., L. B., and J. M. W. conceived and conceptualized this project. J. M. W. performed the ATT experiments and product categorizations, wrote, and organized most of the paper. M. P. N. and L. B. performed the electroreduction experiments and contributed to the associated Methods and Results details. Z. Q. performed the analysis and data extrapolation for the introductory figures.Conflicts of interest
There are no conflicts to declare.Acknowledgements
This work was supported by the Lenfest Center for Sustainability Endowment, Columbia University, New York, NY, 10027, USA. Additional support was provided by the U.S. National Science Foundation AccelNet Program (grant no. 1927336). We thank Guanhe Rim for conducting preliminary experiments at the conception of this project.References
- M. Gilbert, Brydson's Plastics Materials: Eighth Edition, Butterworth-Heinemann, 2016, pp. 2–18 Search PubMed.
- C. G. Schirmeister and R. Mülhaupt, Macromol. Rapid Commun., 2022, 43, 2200247 CrossRef CAS PubMed.
- B. C. Gibb, Nat. Chem., 2019, 11, 394–395 CrossRef CAS PubMed.
- M. Eriksen, L. C. M. Lebreton, H. S. Carson, M. Thiel, C. J. Moore, J. C. Borerro, F. Galgani, P. G. Ryan and J. Reisser, PLoS One, 2014, 9, e111913 CrossRef PubMed.
- International Energy Agency, The future of petrochemicals: Towards more sustainable plastics and fertilisers, 2018, pp. 1–66 DOI:10.1787/9789264307414-en.
- A. Corma, E. Corresa, Y. Mathieu, L. Sauvanaud, S. Al-Bogami, M. S. Al-Ghrami and A. Bourane, Catal. Sci. Technol., 2017, 7, 12–46 RSC.
- A. Merrington, Applied Plastics Engineering Handbook: Processing, Materials, and Applications, William Andrew Publishing, 2nd edn, 2017, pp. 167–189 Search PubMed.
- R. Geyer, J. R. Jambeck and K. L. Law, Sci. Adv., 2017, 3, 5 Search PubMed.
- F. Bauer, T. D. Nielsen, L. J. Nilsson, E. Palm, K. Ericsson, A. Fråne and J. Cullen, One Earth, 2022, 5, 361–376 CrossRef.
- J. R. Jambeck, R. Geyer, C. Wilcox, T. R. Siegler, M. Perryman, A. Andrady, R. Narayan and K. L. Law, Science, 2015, 347, 768–771 CrossRef CAS PubMed.
- A. Isobe and S. Iwasaki, Sci. Total Environ., 2022, 825, 153935 CrossRef CAS PubMed.
- L. Lebreton, B. Slat, F. Ferrari, B. Sainte-Rose, J. Aitken, R. Marthouse, S. Hajbane, S. Cunsolo, A. Schwarz, A. Levivier, K. Noble, P. Debeljak, H. Maral, R. Schoeneich-Argent, R. Brambini and J. Reisser, Sci. Rep., 2018, 8, 1–15 CAS.
- M. Edelson, D. Håbesland and R. Traldi, Mar. Pollut. Bull., 2021, 171, 112720 CrossRef CAS PubMed.
- H. Ritchie and M. Roser, Plastic Pollution, https://ourworldindata.org/plastic-pollution.
- K. Pabortsava and R. S. Lampitt, Nat. Commun., 2020, 11, 1–11 CrossRef PubMed.
- E. Watt, M. Picard, B. Maldonado, M. A. Abdelwahab, D. F. Mielewski, L. T. Drzal, M. Misra and A. K. Mohanty, RSC Adv., 2021, 11, 21447–21462 RSC.
- Density of plastic, https://www.statista.com/statistics/595434/plastic-materials-density/, (accessed 11 March 2021).
- G. Erni-Cassola, V. Zadjelovic, M. I. Gibson and J. A. Christie-Oleza, J. Hazard. Mater., 2019, 369, 691–698 CrossRef CAS PubMed.
- A. C. (Thanos) Bourtsalas, J. Zhang, M. J. Castaldi and N. J. Themelis, J. Cleaner Prod., 2018, 181, 8–16 CrossRef.
- J. J. Milledge and P. J. Harvey, J. Chem. Technol. Biotechnol., 2016, 91, 2221–2234 CrossRef CAS PubMed.
- A. B. Ross, K. Anastasakis, M. Kubacki and J. M. Jones, J. Anal. Appl. Pyrolysis, 2009, 85, 3–10 CrossRef CAS.
- K. Zhang, W. J. Kim and A. H. A. Park, Nat. Commun., 2020, 11, 1–9 CrossRef PubMed.
- M. A. Alao, O. M. Popoola and T. R. Ayodele, Clean. Energy Syst., 2022, 3, 100034 CrossRef.
- I. Wender, Fuel Process. Technol., 1996, 48, 189–297 CrossRef CAS.
- G. Duman, M. A. Uddin and J. Yanik, Bioresour. Technol., 2014, 166, 24–30 CrossRef CAS PubMed.
- O. S. Djandja, Z. Wang, L. Chen, L. Qin, F. Wang, Y. Xu and P. Duan, Energy Fuels, 2020, 34, 11723–11751 CrossRef CAS.
- B. Ciuffi, D. Chiaramonti, A. M. Rizzo, M. Frediani and L. Rosi, Appl. Sci., 2020, 10, 1–35 Search PubMed.
- A. Kruse, Biofuels, Bioprod. Biorefin., 2008, 2, 415–437 CrossRef CAS.
- M. Ni, D. Y. C. Leung, M. K. H. Leung and K. Sumathy, Fuel Process. Technol., 2006, 87, 461–472 CrossRef CAS.
- J. Dai and K. J. Whitty, Chem. Eng. Process., 2022, 174, 108902 CrossRef CAS.
- L. Han, Q. Wang, Y. Yang, C. Yu, M. Fang and Z. Luo, Int. J. Hydrogen Energy, 2011, 36, 4820–4829 CrossRef CAS.
- N. Aprianti, M. Faizal, M. Said and S. Nasir, J. King Saud Univ., Eng. Sci., 2022, 1–8 CAS.
- A. M. Parvez, S. Hafner, M. Hornberger, M. Schmid and G. Scheffknecht, Renewable Sustainable Energy Rev., 2021, 141, 110756 CrossRef CAS.
- B. Dou, B. Jiang, Y. Song, C. Zhang, C. Wang, H. Chen, B. Du and Y. Xu, Fuel, 2016, 166, 340–346 CrossRef CAS.
- J. R. Fernandez, J. C. Abanades and G. Grasa, Chem. Eng. Sci., 2012, 84, 12–20 CrossRef CAS.
- L. Ã. Barelli, G. Bidini, F. Gallorini and S. Servili, Energy, 2008, 33, 554–570 CrossRef CAS.
- M. R. Stonor, T. E. Ferguson, J. G. Chen and A. H. A. Park, Energy Environ. Sci., 2015, 8, 1702–1706 RSC.
- H. Zhou and A. H. A. Park, Appl. Energy, 2020, 264, 114675 CrossRef CAS.
- M. R. Stonor, N. Ouassil, J. G. Chen and A. H. A. Park, J. Energy Chem., 2017, 26, 984–1000 CrossRef.
- K. Zhang, N. Ouassil, C. A. O. Campo, G. Rim, W. J. Kim and A. H. A. Park, J. Ind. Eng. Chem., 2020, 85, 219–225 CrossRef CAS.
- T. E. Ferguson, Y. Park, C. Petit and A. H. A. Park, Energy Fuels, 2012, 26, 4486–4496 CrossRef CAS.
- M. Rahimi, A. Khurram, T. A. Hatton and B. Gallant, Chem. Soc. Rev., 2022, 51, 8676–8695 RSC.
- L. Bromberg, M. P. Nitzsche and T. A. Hatton, Nanoscale, 2022, 14, 13141–13154 RSC.
- K. M. Diederichsen, R. Sharifian, J. S. Kang, Y. Liu, S. Kim, B. M. Gallant, D. Vermaas and T. A. Hatton, Nat. Rev. Methods Primers, 2022, 2, 10 CrossRef.
- T. L. Biel-Nielsen, T. A. Hatton, S. N. B. Villadsen, J. S. Jakobsen, J. L. Bonde, A. M. Spormann and P. L. Fosbøl, ChemSusChem, 2023, 16, 7 CrossRef PubMed.
- S. Licht, Carbon dioxide to carbon nanotube scale-up, arXiv, 2017, preprint, arXiv.1710.07246 DOI:10.48550/arXiv.1710.07246.
- M. Johnson, J. Ren, M. Lefler, G. Licht, J. Vicini, X. Liu and S. Licht, Mater. Today Energy, 2017, 5, 230–236 CrossRef.
- J. Ren, J. Lau, M. Lefler and S. Licht, J. Phys. Chem. C, 2015, 119, 23342–23349 CrossRef CAS.
- Y. Sato and O. Takeda, Molten Salts Chemistry, Elsevier, 2013, pp. 451–470 Search PubMed.
- O. Al-Juboori, F. Sher, U. Khalid, M. B. K. Niazi and G. Z. Chen, ACS Sustainable Chem. Eng., 2020, 8, 12877–12890 CrossRef CAS.
- C. Chen, T. Tran, R. Olivares, S. Wright and S. Sun, J. Sol. Energy Eng., 2014, 136, 7 CrossRef.
- G. J. Janz and M. R. Lorenz, J. Chem. Eng. Data, 1961, 6, 321–323 CrossRef CAS.
- X. Wang, G. Licht, X. Liu and S. Licht, Sci. Rep., 2020, 10, 1–12 CrossRef PubMed.
- S. Licht, M. Lefler, J. Ren and J. Vivini, Electrosynthetic control of CNT conductivity & morphology: Scale-up of the transformation of the greenhouse gas CO2 into carbon nanotubes by molten carbonate electrolysis, arXiv, 2016, preprint, arXiv.1607.02220 DOI:10.48550/arXiv.1607.02220.
- H. V. Ijije, R. C. Lawrence and G. Z. Chen, RSC Adv., 2014, 4, 35808–35817 RSC.
- X. Wang, G. Licht, X. Liu and S. Licht, Adv. Sustainable Syst., 2022, 6, 2100481 CrossRef CAS.
- X. Liu, G. Licht, X. Wang and S. Licht, Catalysts, 2022, 12, 125 CrossRef CAS.
- M. Keijzer, G. Lindbergh, K. Hemmes, P. J. J. M. van der Put, J. Schoonman and J. H. W. de Wit, J. Electrochem. Soc., 1999, 146, 2508–2516 CrossRef CAS.
- G. J. Janz and A. Conte, Electrochim. Acta, 1964, 9, 1279–1287 CrossRef CAS.
- S. Li, C. Jiang, J. Liu, H. Tao, X. Meng, P. Connor, J. Hui, S. Wang, J. Ma and J. T. S. Irvine, J. Power Sources, 2018, 383, 10–16 CrossRef CAS.
- W. Weng, L. Tang and W. Xiao, J. Energy Chem., 2019, 28, 128–143 CrossRef.
- M. Narobe, J. Golob, D. Klinar, V. Francetič and B. Likozar, Bioresour. Technol., 2014, 162, 21–29 CrossRef CAS PubMed.
- H. M. Sheikh, A. Ullah, K. Hong and M. Zaman, Chem. Eng. Process., 2018, 128, 53–62 CrossRef CAS.
- J. Alvarez, S. Kumagai, C. Wu, T. Yoshioka, J. Bilbao, M. Olazar and P. T. Williams, Int. J. Hydrogen Energy, 2014, 39, 10883–10891 CrossRef CAS.
- G. Guan, M. Kaewpanha, X. Hao and A. Abudula, Renewable Sustainable Energy Rev., 2016, 58, 450–461 CrossRef CAS.
- S. Liu, P. A. Kots, B. C. Vance, A. Danielson and D. G. Vlachos, Sci. Adv., 2021, 7, 1–9 CAS.
- M. R. Stonor, J. G. Chen and A. H. A. Park, Int. J. Hydrogen Energy, 2017, 42, 25903–25913 CrossRef CAS.
- J. V. Gulmine, P. R. Janissek, H. M. Heise and L. Akcelrud, Polym. Test., 2002, 21, 557–563 CrossRef CAS.
- Crystallinity/Degree of Crystallinity, https://www.netzsch-thermal-analysis.com/en/contract-testing/glossary/crystallinity-degree-of-crystallinity/, (accessed 11 March 2021).
- X. Ye and T. Sridhar, Macromolecules, 2005, 38, 3442–3449 CrossRef CAS.
- R. Wartena, J. Winnick and P. H. Pfromm, J. Appl. Electrochem., 2002, 32, 415–424 CrossRef CAS.
- M. Chase, JANAF Thermochemical Tables, American Chemical Society and American Institute for Physics of the National Bureau of Standards, 3rd edn, 1986 Search PubMed.
- Y. Izaki, Y. Mugikura, T. Watanabe, M. Kawase and J. R. Selman, J. Power Sources, 1998, 75, 236–243 CrossRef CAS.
- M. D. Ingram and G. J. Janz, Electrochim. Acta, 1965, 10, 783–792 CrossRef CAS.
- M. S. Yazici and J. R. Selman, J. Electroanal. Chem., 1998, 457, 89–97 CrossRef CAS.
- J. P. T. Vossen, L. Plomp and J. H. W. de Wit, J. Electrochem. Soc., 1994, 141, 3040–3049 CrossRef CAS.
- L. Qingfeng, F. Borup, I. Petrushina and N. J. Bjerrum, J. Electrochem. Soc., 1999, 146, 2449–2454 CrossRef.
- H. Yin, X. Mao, D. Tang, W. Xiao, L. Xing, H. Zhu, D. Wang and D. R. Sadoway, Energy Environ. Sci., 2013, 6, 1538–1545 RSC.
- H. V. Ijije, R. C. Lawrence, N. J. Siambun, S. M. Jeong, D. A. Jewell, D. Hu and G. Z. Chen, Faraday Discuss., 2014, 172, 105–116 RSC.
- W. H. Kruesi and D. J. Fray, J. Appl. Electrochem., 1994, 24, 1102–1108 CrossRef.
- R. D. Weaver, ECS Proc. Vol., 1981, 1981–1989, 316–333 CrossRef.
- C. Cui, S. Li, J. Gong, K. Wei, X. Hou, C. Jiang, Y. Yao and J. Ma, Mater. Renew. Sustain. Energy, 2021, 10, 1–24 CrossRef.
- X. Wang, X. Liu, G. Licht and S. Licht, Sci. Rep., 2020, 10, 1–7 CrossRef PubMed.
- B. Deng, J. Tang, X. Mao, Y. Song, H. Zhu, W. Xiao and D. Wang, Environ. Sci. Technol., 2016, 50, 10588–10595 CrossRef CAS PubMed.
- W. Cai, R. Chen, Y. Yang, M. Yi and L. Xiang, Crystals, 2018, 8, 1–8 Search PubMed.
- H. Effenberger, Z. Kristallogr., 1979, 150, 133–138 CrossRef CAS.
- P. Rajasekaran, H. Kannan, S. Das, M. Young and S. Santra, AIMS Environ. Sci., 2016, 3, 439–455 CAS.
- S. Rakshit, S. Ghosh, S. Chall, S. S. Mati, S. P. Moulik and S. C. Bhattacharya, RSC Adv., 2013, 3, 19348–19356 RSC.
- V. D. Jović, V. Maksimović, M. G. Pavlović and K. I. Popov, J. Solid State Electrochem., 2006, 10, 373–379 CrossRef.
- J. Ren and S. Licht, Sci. Rep., 2016, 6, 1–11 CrossRef PubMed.
- A. van Giezen and B. Wiegmans, Transp. Res. Interdiscip. Perspect., 2020, 5, 100115 Search PubMed.
- S. G. Hatzikiriakos, Polym. Eng. Sci., 2000, 40, 2279–2287 CrossRef CAS.
- M. Arabiourrutia, G. Elordi, G. Lopez, E. Borsella, J. Bilbao and M. Olazar, J. Anal. Appl. Pyrolysis, 2012, 94, 230–237 CrossRef CAS.
- T. G. Feric, S. T. Hamilton, N. M. Cantillo, A. E. Imel, T. A. Zawodzinski and A. H. A. Park, J. Phys. Chem. B, 2021, 125, 9223–9234 CrossRef CAS PubMed.
Footnote |
| † Electronic supplementary information (ESI) available. See DOI: https://doi.org/10.1039/d3ee02461j |
| This journal is © The Royal Society of Chemistry 2023 |