 Open Access Article
Creative Commons Attribution 3.0 Unported Licence
Oxidative coupling of methane under microwave: core–shell catalysts for selective C2 production and homogeneous temperature control†
Reina
Kaneda
a,
José
Palomo
 a,
Lingjun
Hu
ab and
Atsushi
Urakawa
 *a
*a
aCatalysis Engineering, Department of Chemical Engineering, Van der Maasweg 9, 2629 HZ, Delft, The Netherlands. E-mail: A.Urakawa@tudelft.nl
bInstitute of Chemical Research of Catalonia (ICIQ), The Barcelona Institute of Science and Technology, Av. Països Catalans 16, 43007 Tarragona, Spain
First published on 29th August 2023
Abstract
The oxidative coupling of methane (OCM) was investigated using a catalyst with a core@shell structure or a physical mixture comprised of MgO and SiC or Fe3O4, which was thermally activated via two different heating methods, namely, conventional resistive heating and microwave heating. The use of microwave radiation together with the catalyst structure was essential to achieve high reaction efficiency. The C2 selectivity and yield were correlated with the presence of temperature gradients in the catalytic bed under microwave radiation. These thermal gradients and their distribution were experimentally evaluated using operando thermal visualization. Hotspots and thermal gradients were beneficial to achieve a higher CH4 conversion; however, it was found that a uniform reactor temperature was crucial to attain a high C2 yield in OCM and the core@shell structure is beneficial. The hypothesis that an enhanced OCM performance can be achieved by keeping the catalyst material hot and the gas cold, using microwave to prevent uncontrolled gas-phase reactions was supported by a kinetic study and experimentally demonstrated.
Introduction
Modern industry relies on hydrocarbons in general and specially light olefins, such as ethylene, which are mostly produced via the steam cracking of crude oil.1 However, due to the limited oil reserves2 and increase in crude oil prices, research efforts are focused on developing alternative synthetic routes for the production of light olefins.3,4 On the other hand, the increasing discovery of natural gas reserves and soaring exploitation of shale gas guarantee the abundant availability of methane at present and in the near future.2,3 Thus, natural gas, in particular methane, is a potential alternative to crude oil for the production of ethylene if its chemical conversion is feasible. Considering this, significant efforts have been devoted to investigating the transformation of natural gas into light olefins by both industry and the academic community.The main chemical processes for the valorization of natural gas, such as the methanol-to-olefin and Fischer–Tropsch processes, are indirect, making it necessary to perform a natural gas reforming stage to obtain the syngas feedstock, which lowers the efficiency of the process and increases the investment costs.5 Consequently, to date, the feasible direct transformation of methane into olefins remains a great challenge in the chemical industry. Methane pyrolysis was postulated in the 1970s for the direct carbon chain expansion of methane through a gas-phase homogeneous reaction.6 However, given the high stability of the C–H bond (439 kJ mol−1), this process is highly endothermic and temperatures higher than 800 °C are commonly required to achieve reasonable conversion values,7 making this process energy intensive. Subsequently, in the 1980s, to avoid harsh operation conditions, Keller and Bhasin8 introduced the concept of oxidative coupling of methane (OCM) to ethylene on heterogeneous catalysts, enabling methane coupling via an exothermic reaction. In the following decades, this process attracted great interest.4,9–11 However, despite the intensive efforts, the industrial implementation of this process has not been achieved.
The OCM process involves the sequential partial oxidation of methane to ethane and subsequent dehydrogenation to ethylene. The global OCM reaction is generally described by eqn (1).
 | (1) |
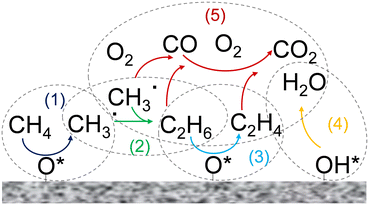 | ||
| Fig. 1 Scheme of the main reaction steps involved in the OCM reaction mechanism in the gas phase and on the catalyst surface. | ||
The majority of OCM studies in the literature focused on the development of catalysts that maximize the yield towards C2 hydrocarbons. Zavyalova et al.20 carried out a statistical analysis based on published results and noted that promising catalysts for OCM consist of strongly basic oxides, mainly Mg and La oxides. However, the development of an optimum catalyst is not the only factor in determining the catalytic performance in the OCM process. For example, the high exothermicity of the OCM reaction usually results in problems related to removing a large amount of heat from the reactor, giving rise to the emergence of hotspots, which is an additional challenge in the implementation of this process.21–23 Furthermore, OCM suffers from a trade-off between conversion and selectivity due to the competition between the reactions involving the generation of C2 hydrocarbons and methyl and ethyl radical and C2 species deep/partial oxidation reactions. The latter reactions are thermodynamically favored at a high gas phase temperature. Regarding this, Zohour et al.14 measured both the spatial gas concentration and temperature profiles along the reactor axial coordinate and found that the COx concentration showed the maximum value at the same position as the temperature peak, which indicates the higher impact of undesirable deep oxidation reactions at high gas phase temperatures. Therefore, efficient temperature control inside the reactor is a crucial aspect to avoid the generation of unexpected and uncontrolled hotspots to enhance the selectivity towards C2 products. This goal should be pursued by simultaneously considering the catalyst and reactor design.24
The ideal solution is to lower the gas phase temperature (avoiding methyl and ethyl radical deep oxidation), while keeping a high catalyst temperature, which is required for methane activation. One way to achieve this is to use microwave-assisted heating instead of the conventional resistive heating. Microwave-assisted reactors can facilitate heterogeneously catalyzed reactions.25 They are capable of selectively heating the solid catalyst rather than both the catalyst and the gas phase. This selective heating of the catalyst bed also results in the appearance of hotspots in the catalyst bed.26–28 In addition to these localized hotspots, it has been reported that thermal gradients emerge between the catalytic solid phase and the fluid phase. Although some theoretical studies reject the existence of these phenomena,29 several authors have reported experimental evidence on the presence of fluid–solid thermal gradients. For example, Bogdal and Lukasiewicz investigated heterogeneous catalytic alcohol oxidation reactions and achieved a solid surface temperature higher than the boiling point of the solvent without observing any phase transition in the liquid phase.30 Recently, Ramirez et al. reported the existence solid–gas temperature gradients in the ethylene epoxidation reaction using a monolith catalyst bed.31 Thus, considering these findings, the use of microwave-heated reactors for OCM may enable the decoupling of gas-phase reactions from surface catalytic reactions, suppressing the gas-phase over-oxidation reactions, and thus improving the C2 yield.
With the application of microwave heating to the OCM process, Bond et al.32 carried out a comparative study on both conventional and microwave heating, using sodium aluminate as the catalyst. They reported that similar selectivity to C2 was obtained for conventional and microwave heating. However, the reaction temperature was 400 °C lower under microwave heating conditions. Additionally, they observed that microwave heating enhanced the selectivity to CO at the expense of CO2 and promoted the ethylene to ethane reaction. Chen et al.33 also observed a difference in both the reactivity and product selectivity by comparing conventional and microwave heating methods using proton conductive catalysts. Similarly, Roussy et al.34,35 reported an enhancement in C2 selectivity under microwave-assisted heating, which was attributed to the decrease in the deep oxidation rate of methyl radicals in the gas phase due to the output gas quenching. Recently, Zhang et al.36 also reported a higher C2 yield up to 800 °C under microwave-assisted heating compared to conventional heating at the same reaction temperature. Furthermore, the differences found in the selectivity and yield towards C2 were more noticeable in the absence of oxygen.37
The aforementioned results clearly highlight that the use of microwave radiation as the heating source for the OCM process can enhance the yield towards C2 hydrocarbons. To explain the positive impacts derived from microwave heating, the presence of hotspots in the catalytic bed has been suggested.32,33,36 An inhomogeneous thermal distribution and gradients may arise from the non-homogeneous heating of the catalytic bed, which is likely when the catalytic bed lacks homogeneity.
Most OCM catalysts, such as MgO and La2O3, present a low microwave absorption capacity, and thus they generally need to be physically mixed with particles of materials possessing enhanced microwave radiation absorption, such as SiC. Consequently, hotspots are generated inside the reactor on and near these materials, potentially giving rise to temperature inhomogeneity. However, the experimental evaluation of the presence of hotspots in the OCM process is challenging due to the harsh reaction conditions. In addition, microwave reactors are commonly bulky38,39 and unfeasible to conduct flexible research, making the determination of hotspots in these reaction systems quite challenging.25 Consequently, no information for the experimental evaluation of these thermal phenomena for OCM under microwave-assisted heating conditions is available to date.
In this work, we report the preparation and evaluation of structured catalysts for the OCM process. These structured materials were prepared by coating a material possessing high microwave radiation adsorption with an OCM catalyst. Accordingly, the spatial arrangement between the catalytic phase and material presenting a high microwave radiation adsorption mimicked the nano-scale core@shell structure, with a difference in the microscale size. Employing this structure, we aimed to attain more homogeneous heating and easier temperature control of the catalyst. Specifically, SiC and Fe3O4 were evaluated as the core and MgO was chosen as the OCM-active shell material. The evaluation of the temperature variations and the presence of hotspots in the catalytic bed were experimentally accomplished using a customized compact microwave system, which was open to incorporate some analytical tools such as a digital microscope and an IR thermographic camera, allowing the operando spatial analysis of the reactor during OCM.
Results and discussion
Characterization of the catalysts
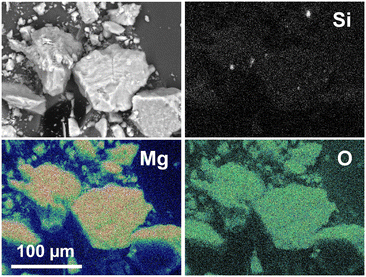
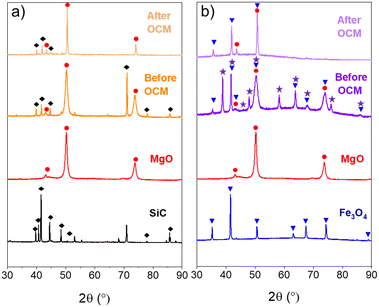
The morphology of the structured core–shell catalysts was evaluated by scanning and transmission electron microscopy. Fig. 2 shows the SEM image together with the elemental mappings obtained by scanning electron microscopy combined with energy-dispersive X-ray spectroscopy (SEM-EDS) of the SiC@MgO catalyst. O and Mg were clearly detected on the catalyst surface. In contrast, Si elemental mapping indicated the absence/minor presence of this element on the surface of the catalyst particles. These results revealed that MgO covered the SiC core particles, further confirming that the target SiC@MgO core–shell structure was successfully synthesized. In contrast, this core–shell structure was not effectively achieved for the Fe3O4@MgO catalyst, as revealed by the TEM analyses (see Fig. S1†).The X-ray diffraction patterns of the core@shell catalysts, i.e., SiC@MgO and Fe3O4@MgO, before and after the OCM reaction at 900 °C are presented in Fig. 3. The SiC@MgO catalyst showed the diffraction peaks of its individual components, i.e., MgO and SiC, before and after the OCM reaction. It is noteworthy that the diffraction peaks corresponding to MgO intensified and became narrower after the catalysts were used in the OCM process (Fig. 3a). This indicates that the crystallite size of MgO became larger, which was estimated using the Scherrer equation before and after the OCM reaction to be 8.3 and 30.5 nm, respectively. These results revealed the sintering of the MgO active phase during the reaction, which is presumably due to the high reaction temperature of the process (900 °C). However, this sintering process occurred on the nano-scale, not perturbing (at least to a noticeable extent) the macroscopic arrangement of the core and shell materials.
Alternatively, the XRD patterns of the Fe3O4@MgO catalyst before reaction revealed the existence of three crystalline phases, namely, MgO, Fe3O4 and Fe2O3 (Fig. 3b). The presence of an Fe2O3 crystal phase was not observed on the bare core material, and thus its presence in the structured catalyst indicates that the core Fe3O4 material underwent an oxidation process during calcination at 450 °C. After the OCM reaction, only diffraction peaks corresponding to the MgO and Fe3O4 crystal phases were detected, suggesting that the Fe2O3 species were reduced to Fe3O4 during the OCM reaction through a redox process between Fe2O3 and CH4.7,40 Additionally, similar to the SiC@MgO catalyst, sintering of the MgO active phase occurred during the OCM reaction, increasing the MgO crystallite size from 6.5 to 19.0 nm.
Subsequently, N2 physisorption studies were performed to assess the textural properties of the materials and the BET surface area values were calculated for both the core@shell catalysts and their individual components. SiC presented a non-porous texture, as expected. The Fe3O4 nanopowder showed a very small N2 uptake with a small specific surface area of 8 m2 g−1. MgO presented a more developed porous texture with a calculated BET surface area of 51 m2 g−1. The surface area of SiC@MgO was 37 m2 g−1, which is close to the proportional sum of its components. However, this proportionality between the structured catalyst and its individual components was not valid for Fe3O4@MgO, which had a surface area of 79 m2 g−1. This enhancement in specific surface area can be attributed to the change in the crystal phase of the core material, as indicated by the XRD analyses after the formation of the structured catalyst.
Catalytic results
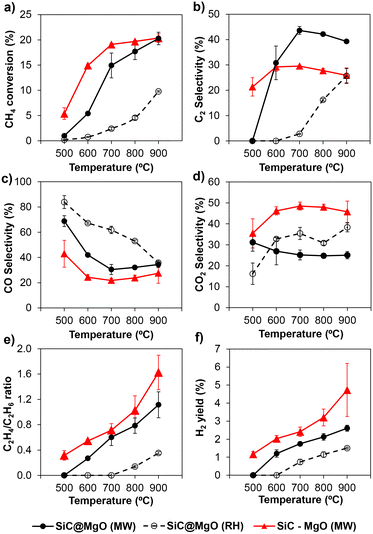
Fig. 4b depicts the selectivity to C2 hydrocarbons as a function of temperature for both heating methods. Under MW, the selectivity towards C2 products increased rapidly upon increasing the reaction temperature up to 700 °C. Above this temperature, a slight decrease in C2 selectivity was observed. Alternatively, using RH (Fig. 4b), the C2 selectivity was low and poor up to 700 °C, and then continuously increased with temperature up to 900 °C. Similar to CH4 conversion, the selectivity to C2 was considerably higher for MW in the range of temperatures studied.
The selectivity to CO and CO2 showed the opposite trend (Fig. 4c and d, respectively). In the case of MW, both reactions were not pronounced in the range of 500–700 °C. Above 800 °C, a slight increase was observed for the selectivity to CO at the expense of the selectivity to C2 hydrocarbons. This suggests the occurrence, despite the low extent, of the partial oxidation or dry/steam reforming of hydrocarbon reactions at these high temperatures. Alternatively, the CO2 selectivity remained almost unaltered in the high temperature range. Using RH, the CO selectivity decreased, whereas the CO2 increased with temperature. In contrast to the trends observed for CH4 conversion and C2 selectivity, the total selectivity to CO and CO2 was considerably lower when MW was used, as shown in Fig. S6 (see ESI†). The differences in the product distribution indicate that MW suppressed partial/deep oxidation reactions. In this case, when comparing the two heating methods under iso-conversion conditions (XCH4 = 5%), the selectivity values towards CO + CO2 products were found to be 70% and 83% for MW and RH conditions, respectively, also evidencing the suppression of deep oxidation reactions under MW operation. This deep oxidation suppression can be attributed to the decrease in the deep oxidation rate of methyl radicals in the gas phase due to the output gas quenching facilitated by the colder gas temperature when MW is used.34
The catalytic tests clearly demonstrated that compared to RH, the use of MW is beneficial to achieve higher CH4 conversion and higher C2 selectivity in the temperature range employed in this study. At 800 °C, the C2 yield with MW was more than 10-times that with RH. The advantages of MW over RH have been discussed in the literature.32,33,36 Bond et al.32 and Zhang et al.36 attributed this enhancement under MW to the non-uniform distribution of temperature in the catalytic bed, inducing the generation of hotspots. The presence of these thermal phenomena during OCM under microwave radiation may also be a plausible explanation for the advantageous catalytic features found in the present work, although this is not precisely the case, at least macroscopically, for the core@shell catalyst, as shown later.
In addition, a high local temperature in the catalyst promotes C2H6 dehydrogenation, which can take place via two different pathways: i) oxidative dehydrogenation (ODH)41 or ii) direct thermal pyrolysis,42 yielding H2. The former takes place at temperatures lower than that used for OCM. However, the latter only occurs at high temperatures (>700 °C). Furthermore, dry reforming and steam reforming of hydrocarbons to produce CO and H2 have been also suggested to take place under OCM conditions at very high temperatures.43 The higher C2H4/C2H6 ratio and H2 yield found in the present study (Fig. 4e and f, respectively) under MW indicate the presence of temperature variations and hotspots in the catalyst bed.
For the determination of hotspots and temperature variations during OCM under MW, Ni et al.37 theoretically estimated the temperature variations inside the catalytic bed and concluded that considerable temperature variations arise in the catalyst bed during OCM when employing microwave-assisted reactors. However, no information about the experimental evaluation of these thermal phenomena for OCM under MW is available in the literature. This lack of information is due to the harsh reaction conditions and the inherent difficulties of performing temperature measurements for microwave reactors.25 In this work, the experimental evaluation of the presence/absence of thermal gradients and hotspots during the OCM reaction under MW was accomplished using a customized compact microwave system, connected with different analytical tools, which allowed operando thermal visualization of the catalyst bed. The analysis of these thermal phenomena under MW will be described later.
![[thin space (1/6-em)]](https://www.rsc.org/images/entities/char_2009.gif) :
:![[thin space (1/6-em)]](https://www.rsc.org/images/entities/char_2009.gif) 2 of the individual components (MSiC/Fe3O4
2 of the individual components (MSiC/Fe3O4![[thin space (1/6-em)]](https://www.rsc.org/images/entities/char_2009.gif) :
:![[thin space (1/6-em)]](https://www.rsc.org/images/entities/char_2009.gif) MMgO) was initially used to match the equivalent ratio to the core@shell catalysts. However, the resulting catalyst bed was not sensitive enough to microwave radiation, and thus the reaction temperature could not be increased to the maximum temperature evaluated in this work. To overcome this issue, an MSiC/Fe3O4
MMgO) was initially used to match the equivalent ratio to the core@shell catalysts. However, the resulting catalyst bed was not sensitive enough to microwave radiation, and thus the reaction temperature could not be increased to the maximum temperature evaluated in this work. To overcome this issue, an MSiC/Fe3O4![[thin space (1/6-em)]](https://www.rsc.org/images/entities/char_2009.gif) :
:![[thin space (1/6-em)]](https://www.rsc.org/images/entities/char_2009.gif) MMgO mass ratio of 1
MMgO mass ratio of 1![[thin space (1/6-em)]](https://www.rsc.org/images/entities/char_2009.gif) :
:![[thin space (1/6-em)]](https://www.rsc.org/images/entities/char_2009.gif) 1 was used. The catalysts prepared by physical mixing were denoted as SiC–MgO and Fe3O4–MgO. Fig. 4 shows the OCM performance of the SiC–MgO catalysts under MW conditions. The catalyst prepared by physical mixing (SiC–MgO) yielded a higher CH4 conversion than the structured catalyst (SiC@MgO) up to 900 °C, where similar values were obtained for both catalysts. However, the selectivity towards C2 hydrocarbons was considerably higher for SiC@MgO in comparison to SiC–MgO at 600–900 °C (Fig. 4b). The CO selectivity showed the same trend for both catalysts, with higher values for the structured catalyst, SiC@MgO, in the whole temperature range studied. The differences in CO selectivity became smaller with an increase in the reaction temperature (Fig. 4c). Interestingly, the CO2 selectivity presented the opposite tendency, which was noticeably higher for the physical-mixed SiC–MgO catalyst, with a value close to twice that obtained for the structured SiC@MgO catalyst at temperatures higher than 600 °C (Fig. 4d). The total selectivity towards partial/deep oxidation products (CO + CO2), as shown in Fig. S2a,† clearly highlights the higher efficiency of the structured SiC@MgO catalyst in terms of avoiding oxidation pathways, especially in the high temperature range. Consequently, SiC@MgO exhibited higher C2 selectivity than SiC–MgO when comparing both catalysts under iso-conversion conditions (Fig. S2b†). Alternatively, the C2H4/C2H6 ratio and H2 yield were higher for the catalyst prepared by physical mixing (SiC–MgO) for the whole temperature range studied (Fig. 4e and f, respectively). These variations in product distribution can be attributed to the differences in thermal phenomena, namely, the generation of temperature gradients and hotspots, in the catalytic bed.
1 was used. The catalysts prepared by physical mixing were denoted as SiC–MgO and Fe3O4–MgO. Fig. 4 shows the OCM performance of the SiC–MgO catalysts under MW conditions. The catalyst prepared by physical mixing (SiC–MgO) yielded a higher CH4 conversion than the structured catalyst (SiC@MgO) up to 900 °C, where similar values were obtained for both catalysts. However, the selectivity towards C2 hydrocarbons was considerably higher for SiC@MgO in comparison to SiC–MgO at 600–900 °C (Fig. 4b). The CO selectivity showed the same trend for both catalysts, with higher values for the structured catalyst, SiC@MgO, in the whole temperature range studied. The differences in CO selectivity became smaller with an increase in the reaction temperature (Fig. 4c). Interestingly, the CO2 selectivity presented the opposite tendency, which was noticeably higher for the physical-mixed SiC–MgO catalyst, with a value close to twice that obtained for the structured SiC@MgO catalyst at temperatures higher than 600 °C (Fig. 4d). The total selectivity towards partial/deep oxidation products (CO + CO2), as shown in Fig. S2a,† clearly highlights the higher efficiency of the structured SiC@MgO catalyst in terms of avoiding oxidation pathways, especially in the high temperature range. Consequently, SiC@MgO exhibited higher C2 selectivity than SiC–MgO when comparing both catalysts under iso-conversion conditions (Fig. S2b†). Alternatively, the C2H4/C2H6 ratio and H2 yield were higher for the catalyst prepared by physical mixing (SiC–MgO) for the whole temperature range studied (Fig. 4e and f, respectively). These variations in product distribution can be attributed to the differences in thermal phenomena, namely, the generation of temperature gradients and hotspots, in the catalytic bed.
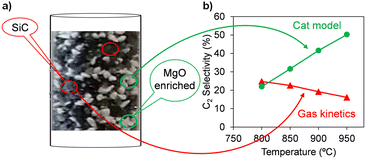 | ||
Fig. 5 a) Digital microscope image of the catalyst bed composed of SiC and MgO physically mixed particles, b) C2 selectivity calculated using the OCM gas-phase kinetic model reported by Chen et al.44 and the comprehensive kinetic model (accounting for the homogeneous–heterogeneous nature of the OCM process) developed for the MgO catalyst,45 at CH4![[thin space (1/6-em)]](https://www.rsc.org/images/entities/char_2009.gif) : :![[thin space (1/6-em)]](https://www.rsc.org/images/entities/char_2009.gif) O2 = 4, PCH4 = 40%, and XO2 = 100%. O2 = 4, PCH4 = 40%, and XO2 = 100%. | ||
This non-uniform arrangement of the particles in the catalytic bed can result in the generation of zones with strong microwave absorption inside the catalytic bed (e.g., zones with mainly SiC particles), making the emergence of hotspots likely.32 This uncontrolled thermal behavior can be problematic in terms of catalytic performance. Fig. 5 presents a comparison of the C2 selectivity for OCM under full O2 conversion conditions, which was calculated using the gas-phase kinetic model reported by Chen et al.,44 with that calculated by the comprehensive kinetic model we developed for the MgO catalyst, accounting for the effects of the catalyst surface and homogeneous–heterogeneous nature of the OCM process.45 Increasing the temperature in the absence of an active catalyst such as MgO resulted in a decrease in the selectivity towards C2 hydrocarbons (red line, Fig. 5). Conversely, in the presence of catalyst and activated surface reactions, a higher catalyst temperature resulted in higher C2 selectivity (green line, Fig. 5). Therefore, selective heating of the catalytic phase while avoiding gas-phase overheating may be an interesting approach, justifying the use of MW for OCM. Importantly, the SiC@MgO bed is composed of only one type of particle with a spatial arrangement between SiC and MgO in the form of core@shell. Consequently, a homogeneous catalytic bed, not only in terms of composition but also microwave radiation absorption can be obtained. Under these conditions, microwave heating increases the temperature of the core due to the localized material-sensitive heating properties of microwave radiation. This heat is dissipated by conduction to the catalyst shell. The gas phase is not directly heated by microwave radiation and a convection heat transfer mechanism occurs between the two phases (solid and gas). In this case, it is expected that a temperature gradient will develop between the catalyst surface and the bulk gas phase. Under the condition of a lower gas phase temperature, suppression of the gas phase reactions occurs according to the Arrhenius law compared to the case of a homogeneous temperature in the catalyst bed. However, it should be noted that oxidation reactions present first-order kinetics with respect to the concentration of radicals, whereas the methyl coupling reaction yielding ethane presents second-order dependence with respect to this chemical species. This is a very important point to consider when analysing these results. A very high catalyst surface temperature promotes methane activation to a large extent, generating a high local concentration of methyl radicals. Given that the temperature in this gas film surrounding the catalyst particles is considered to be lower than the surface of the catalyst, the gas phase kinetics will be effective at a lower temperature, which will make the process more selective (the lower the temperature in the gas phase, the higher the selectivity towards C2, as shown in the kinetic analysis in Fig. 5). Furthermore, this positive effect is also enhanced by the high local concentration of methyl radicals generated by the higher catalyst surface temperature generated by MW-assisted heating, which will accelerate the coupling reaction rather that the oxidation reaction kinetics. Therefore, more homogeneous heating, easier reactor temperature control and higher selectivity towards C2 hydrocarbons are expected.
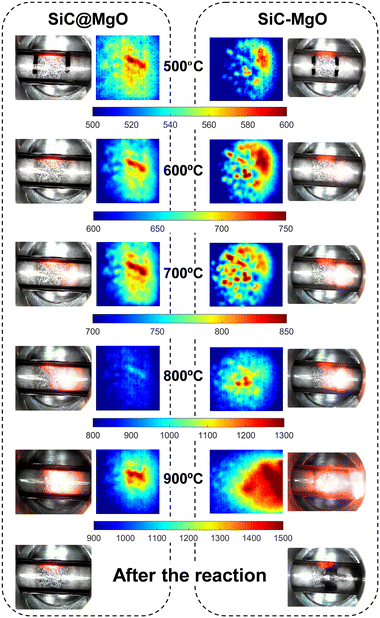
Looking closer at the IR thermography images, hotspots and temperature gradients were observed for both catalyst beds in the whole temperature range studied. However, the location and the extent of these thermal phenomena were different. Both the catalytic bed uniformity and reaction exothermicity can play a role in the generation of these thermal gradients under MW heating conditions, and thus none of these phenomena can be completely ruled out.
SiC@MgO showed a more homogeneous temperature distribution than SiC–MgO, with the presence of temperature gradients between the center of the catalyst bed and the periphery up to 150 °C. The thermal phenomena observed for SiC@MgO are consistent with the results of the theoretical analysis reported by Ni et al.,37 who also predicted a radial temperature gradient in the reactor when analyzing a homogeneous catalytic bed. However, a higher temperature difference between the center and the regions near the reactor wall, which was measured using a thermosensor, was observed in the present work. This can be due to the differences in the catalyst materials and their microwave sensitivity. Alternatively, the thermal visualization analyses for the catalytic bed prepared by physical mixing, i.e., SiC–MgO, clearly revealed the presence of very localized hotspots in the catalyst bed due to aggressive microwave absorption by SiC.
The temperature of the hotspots observed in SiC–MgO was considerably higher than that observed for SiC@MgO, especially at the higher reaction temperatures (Fig. 6). In the SiC–MgO bed at 900 °C, a huge hotspot with a maximum temperature above 1300 °C was generated, whereas a much smaller thermal gradient was observed in the case of the SiC@MgO catalyst bed at 900 °C. Digital microscopy images of both beds were also acquired after OCM reaction at 900 °C. The results showed little variations in the structured catalyst bed, i.e., SiC@MgO before and after the reaction. However, in the case of SiC–MgO, coke deposition was clearly observed after the OCM reaction, seemingly in the same area where hotspots were observed. In the presence of significant hotspots, the pyrolysis of methane and hydrocarbon products is likely, yielding coke and hydrogen.37,42
The results presented above highlight that hotspots and thermal gradients occurring under microwave radiation are important to achieve higher methane conversion. This work demonstrates that a uniform catalytic bed, in terms of composition and microwave radiation absorption capacity, through the formation of a catalyst with a core@shell conformation mitigates the generation of localized hotspots and reactor temperature runaway (Fig. 6). These thermal control advantages result in the more effective suppression of deep oxidation reaction routes, making it feasible to enhance both the C2 selectivity and yield (Fig. 4 and 5). Strikingly, the C2 yield obtained for the structured catalyst bed, i.e., SiC@MgO, showed a relative increase of 37% compared to the catalytic bed prepared by physical mixing, i.e., SiC–MgO, at 800 °C.
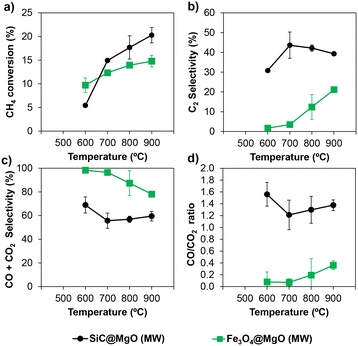 | ||
| Fig. 7 a) CH4 conversion, b) C2 selectivity, c) CO + CO2 selectivity and d) CO/CO2 ratio for SiC@MgO and Fe3O4@MgO catalysts under microwave radiation (MW) conditions. | ||
The differences in the catalytic performance obtained for both catalysts can be related to their structural features. As revealed by the electronic microscopy results, the target core@shell structure was not successfully achieved for the Fe3O4@MgO catalyst in the present work, and consequently part of the core material was exposed to the reaction mixture. In addition, Fe3O4 was oxidized to Fe2O3 during the calcination of the catalyst at 450 °C, as revealed by XRD analyses. The latter iron oxide phase has been reported to promote the complete oxidation of methane under OCM conditions.7,40 The poorer catalytic performance in terms of C2 yield found for Fe3O4@MgO compared to SiC@MgO in the present study can be attributed to the incomplete core@shell structure of the catalyst and exposure of the core to the OCM reaction mixture. This interpretation is supported by the similar catalytic results obtained using the catalyst bed made of physically mixed Fe3O4 and MgO (i.e., Fe3O4–MgO, Fig. S4†). Furthermore, the thermal visualization results for Fe3O4@MgO during OCM evidenced the generation of hotspots with a very localized character in the catalytic bed (Fig. S5†). In this case, the generation of these thermal phenomena was related to the enhancement of the highly exothermic deep oxidation pathways during OCM due to the exposure of the core material to the reaction mixture. These results clearly indicate that the formation of a suitable core@shell structure is a crucial aspect to achieve a high yield towards C2 hydrocarbons.
Conclusions
The use of structured core@shell catalysts with microwave activation was shown to be promising to achieve a high C2 yield in the oxidative coupling of methane (OCM). Compared to the conventional resistive heating, OCM with microwave resulted in a higher yield towards C2 hydrocarbons. The core@shell structure allowed the uniform heating of the catalyst bed and avoided deep oxidation pathways in the OCM reaction, resulting in a higher selectivity and yield to C2 hydrocarbons. The presence of these thermal phenomena during OCM operation under microwave conditions was experimentally assessed by operando thermal visualization. The results highlighted the importance of the core@shell structure to better manage the heat generation and distribution in the catalyst bed. This is important to drive the OCM reaction mainly on and close to the catalyst surface by keeping the surface hot while the gas cold. If there is a hot spot, the gas phase is also heated and the reaction is driven mainly by the gas phase, causing the C2 yield to drop, as indicated by the kinetic study. Considering this, the use of microwave in combination with core@shell materials can be highly beneficial to selectively heat the catalyst material. The evaluation of different core materials (SiC and Fe3O4) for the preparation of the structured catalysts indicated that achieving a suitable core@shell structure is crucial to achieve a high yield of C2 hydrocarbons, especially when the core materials such as Fe3O4 possess detrimental activity for OCM such as total oxidation.Experimental
Materials
SiC (no. 120, Cats Import, Hoogvliet), Fe3O4 (nanopowder, 97%, Thermo Fisher), Mg(NO3)2·6H2O (≥99% trace metal basis, Sigma Aldrich) and NaOH (ACS Reagent, ≥97.0%, Sigma Aldrich) were used for the synthesis of the core@shell catalysts. MgO (≥99% trace metal basis, Sigma Aldrich) was used for the physical-mixture catalysts.Catalyst preparation
The core@shell catalysts were synthesized via the precipitation method. Briefly, 2.64 g of Mg(NO3)2·6H2O was dissolved in 20 mL Milli-Q water. Then, 0.2 g of SiC or Fe3O4 was added to the solution. Thereafter, 20 mL of a solution of 0.8 g of NaOH in water was added dropwise to the solution of Mg and SiC/Fe3O4 in water with stirring for 90 min at room temperature. The resulting suspension was filtered and washed with Milli-Q water. Finally, the materials were dried at 70 °C for 20 h and calcined at 450 °C for 3 h under static air conditions. The catalysts prepared using this procedure possessed an MgO to SiC/Fe3O4 mass ratio of 2 and were denoted as SiC@MgO and Fe3O4@MgO.For comparative purposes, catalysts were also prepared by physical mixing of the individual core (SiC/Fe3O4) and shell (MgO) components. Here, the mass ratio between the individual components (MSiC/Fe3O4![[thin space (1/6-em)]](https://www.rsc.org/images/entities/char_2009.gif) :
:![[thin space (1/6-em)]](https://www.rsc.org/images/entities/char_2009.gif) MMgO) was determined to be 1
MMgO) was determined to be 1![[thin space (1/6-em)]](https://www.rsc.org/images/entities/char_2009.gif) :
:![[thin space (1/6-em)]](https://www.rsc.org/images/entities/char_2009.gif) 1 and 1
1 and 1![[thin space (1/6-em)]](https://www.rsc.org/images/entities/char_2009.gif) :
:![[thin space (1/6-em)]](https://www.rsc.org/images/entities/char_2009.gif) 2. The catalysts prepared by physical mixing were denoted as SiC–MgO and Fe3O4–MgO.
2. The catalysts prepared by physical mixing were denoted as SiC–MgO and Fe3O4–MgO.
Characterization of the catalysts
The morphology of the catalysts was studied by scanning and transmission electron microscopy. Scanning electron microscopy (SEM) images and energy dispersive X-ray spectroscopy (EDS) maps were recorded using an FEI NovaNano microscope. Transmission electron microscopy (TEM) images were acquired using a JEOL JEM-1400Plus instrument.X-ray diffraction patterns (XRD) of the prepared catalysts were recorded on a Bruker D8 Advance X-ray diffractometer using Co-Kα radiation (λ = 0.179026 nm), at a scan step of 0.02° s−1 in the 2θ range of 10–90°. All patterns were background-subtracted to eliminate the contribution of air scatter and possible fluorescence radiation. The average crystallite size of MgO in the catalysts was estimated using the Scherrer equation applied to the most intense (101) diffraction using the shape factor K = 0.9.
The porous texture of the catalysts was characterized by N2 physisorption at −196 °C, which was performed in a Tristar II 3020 instrument (Micromeritics). Samples were previously outgassed under vacuum overnight at 150 °C. Employing the N2 adsorption–desorption isotherm, the apparent surface area (ABET) was determined by applying the BET equation.46
Catalytic tests
Catalytic experiments were carried out under conventional resistive heating (RH) and microwave radiation heating (MW) conditions using a customized laboratory-scale, continuous flow reaction system equipped with a quartz fixed bed microreactor (i.d. of 4 mm). In the resistive heating experiments, the reaction temperature was measured and controlled with a K-type thermocouple inserted at the end of the catalyst bed. In the microwave-assisted heating experiments, a Ryowa Electronics (2.45 GHz ± 50 MHz, maximum 100 W) microwave device was used. The temperature of the catalyst was monitored by a one-point IR temperature sensor and the resonance frequency of microwaves inside the cavity was measured by the detector. With the feedback of these two parameters, the heating power, and thus the catalyst temperature was controlled. The microwave power used to reach the steady-state temperature in each of the catalytic systems analyzed herein was measured and can be found in the ESI† (Table S1). In a typical experiment, 50 mg of catalyst (300–400 μm particle size) was loaded in the quartz reactor and fixed with quartz wool. Then, a mixture of CH4 (40 vol%), O2 (10 vol%), He (37 vol%) and N2 (13 vol%) with a total flow rate of 80 mL min−1 was introduced in the reactor. Finally, the catalyst was heated to the desired temperature. The outlet gas concentrations were analyzed by gas chromatography (GC, Agilent 7890B, equipped with two FID and one TCD) after passing through a water-condenser. GC injections were performed three times for each temperature. N2 was used as the internal standard for the GC analyses.Methane conversion was defined as the ratio of the amount of CH4 converted to the amount of CH4 supplied to the reactor and expressed in molar%. The selectivity to each product, also expressed in molar%, was defined as the ratio of carbon moles in a specific product to the moles of CH4 converted. The C2 yield was calculated as the moles of C2 hydrocarbons produced per mole of CH4 converted. The H2 yield (in mol%) was defined as the moles of H2 generated to twice the moles of CH4 converted.
Visual inspection by digital microscope and IR thermal camera
A digital microscope (×800–1000 magnification) coupled to the reaction system was used for the operando monitoring of the catalytic bed. For the visualization of the 2D (axial and radial) temperature in the catalytic bed and the determination of the presence of hotspots, an infrared camera (Micro-SWIR™ 320CSX Camera, Sensors Unlimited) was also coupled to the reaction system. IR radiation images were converted to temperature distribution images.Conflicts of interest
There are no conflicts to declare.Acknowledgements
We thanks the financial support from the Japanese Science and Technology Agency (JST) PRESTO (Grant No. JPMJPR16S3) and from the European Union's Horizon 2020 research and innovation program under the Marie Skłodowska-Curie Grant Agreement No. 101023416 of J. Palomo.References
- I. Amghizar, L. Vandewalle, K. Van Geem and G. Marin, Engineering, 2017, 6, 171–178 CrossRef.
- BP, BP Statistical Review of World Energy, 2020.
- A. Galadima and O. Muraza, J. Ind. Eng. Chem., 2016, 37, 1–13 CrossRef CAS.
- A. Cruellas, J. Bakker, M. van Sint Annaland, J. Medrano and F. Gallucci, Energy Convers. Manage., 2019, 198, 111789 CrossRef CAS.
- L. A. Vandewalle, R. Van de Vijver, K. M. Van Geem and G. B. Marin, Chem. Eng. Sci., 2019, 198, 268–289 CrossRef CAS.
- C.-J. Chen, M. Back and R. Back, Can. J. Chem., 1975, 53, 3580–3590 CrossRef CAS.
- C. Karakaya and R. J. Kee, Prog. Energy Combust. Sci., 2016, 55, 60–97 CrossRef.
- G. Keller and M. Bhasin, J. Catal., 1982, 73, 9–19 CrossRef CAS.
- B. Beck, V. Fleischer, S. Arndt, M. G. Hevia, A. Urakawa, P. Hugo and R. Schomäcker, Catal. Today, 2014, 228, 212–218 CrossRef CAS.
- P. N. Kechagiopoulos, J. W. Thybaut and G. B. Marin, Ind. Eng. Chem. Res., 2014, 53, 1825–1840 CrossRef CAS.
- C. Hammond, S. Conrad and I. Hermans, ChemSusChem, 2012, 5, 1668–1686 CrossRef CAS PubMed.
- J. H. Lunsford, Angew. Chem., Int. Ed. Engl., 1995, 34, 970–980 CrossRef CAS.
- L. Hu, D. Pinto and A. Urakawa, Catalysis, 2020, 32, 203–223 CAS.
- B. Zohour, D. Noon and S. Senkan, ChemCatChem, 2013, 5, 2809–2812 CrossRef CAS.
- B. L. Farrell, V. O. Igenegbai and S. Linic, ACS Catal., 2016, 6, 4340–4346 CrossRef CAS.
- V. Lomonosov and M. Y. Sinev, Kinet. Catal., 2016, 57, 647–676 CrossRef CAS.
- J. C. Mackie, Catal. Rev.: Sci. Eng., 1991, 33, 169–240 CrossRef CAS.
- J. Sun, J. W. Thybaut and G. B. Marin, Catal. Today, 2008, 137, 90–102 CrossRef CAS.
- Y. San Su, J. Y. Ying and W. H. Green Jr, J. Catal., 2003, 218, 321–333 CrossRef.
- U. Zavyalova, M. Holena, R. Schlögl and M. Baerns, ChemCatChem, 2011, 3, 1935–1947 CrossRef CAS.
- M.-S. Salehi, M. Askarishahi, H. R. Godini, R. Schomäcker and G. N. Wozny, Ind. Eng. Chem. Res., 2016, 55, 1149–1163 CrossRef CAS.
- M. Son, S.-J. Park, Y.-J. Lee and M.-J. Park, Int. J. Heat Mass Transfer, 2018, 127, 102–110 CrossRef CAS.
- Z. Sun, D. H. West, P. Gautam and V. Balakotaiah, AIChE J., 2020, 66, e16949 CrossRef CAS.
- A. Obradović, J. W. Thybaut and G. B. Marin, Chem. Eng. Technol., 2016, 39, 1996–2010 CrossRef.
- L. S. Gangurde, G. S. Sturm, T. J. Devadiga, A. I. Stankiewicz and G. D. Stefanidis, Ind. Eng. Chem. Res., 2017, 56, 13379–13391 CrossRef CAS PubMed.
- S. Tsubaki, T. Matsuzawa, T. Higuchi, S. Fujii and Y. Wada, Chem. Eng. J., 2022, 433, 133603 CrossRef CAS.
- A. Malhotra, W. Q. Chen, H. Goyal, P. J. Plaza-Gonzalez, I. Julian, J. M. Catala-Civera and D. G. Vlachos, Ind. Eng. Chem. Res., 2021, 60, 6835–6847 CrossRef CAS.
- T. Durka, T. Van Gerven and A. Stankiewicz, Chem. Eng. Technol., 2009, 32, 1301–1312 CrossRef CAS.
- W. L. Perry, D. W. Cooke, J. D. Katz and A. K. Datye, Catal. Lett., 1997, 47, 1–4 CrossRef CAS.
- D. Bogdal, M. Lukasiewicz, J. Pielichowski, A. Miciak and S. Bednarz, Tetrahedron, 2003, 59, 649–653 CrossRef CAS.
- A. Ramirez, J. L. Hueso, R. Mallada and J. Santamaria, Chem. Eng. J., 2017, 316, 50–60 CrossRef CAS.
- G. Bond, R. Moyes and D. Whan, Catal. Today, 1993, 17, 427–437 CrossRef CAS.
- C. Chen, P. Hong, S. Dai and J. Kan, J. Chem. Soc., Faraday Trans., 1995, 91, 1179–1180 RSC.
- G. Roussy, E. Marchal, J. Thiebaut, A. Kiennemann and G. Maire, Fuel Process. Technol., 1997, 50, 261–274 CrossRef CAS.
- G. Roussy, J. Thiebaut, M. Souiri, E. Marchal, A. Kiennemann and G. Maire, Catal. Today, 1994, 21, 349–355 CrossRef CAS.
- X. Zhang, C. S.-M. Lee, D. M. P. Mingos and D. O. Hayward, Appl. Catal., A, 2003, 249, 151–164 CrossRef CAS.
- B. Ni, C. Lee, R.-C. Sun and X. Zhang, React. Kinet. Catal. Lett., 2009, 98, 287–302 CrossRef CAS.
- I. Julian, C. M. Pedersen, K. Achkasov, J. L. Hueso, H. L. Hellstern, H. Silva, R. Mallada, Z. J. Davis and J. Santamaria, Catalysts, 2019, 9, 867 CrossRef CAS.
- L. S. Gangurde, G. S. Sturm, M. Valero-Romero, R. Mallada, J. Santamaria, A. I. Stankiewicz and G. D. Stefanidis, Chem. Eng. Process., 2018, 127, 178–190 CrossRef CAS.
- D. Lazarov, V. Rives, R. Klissurska, I. Mitov and D. Klissurki, Mater. Lett., 1996, 27, 129–133 CrossRef CAS.
- E. Heracleous and A. A. Lemonidou, Appl. Catal., A, 2004, 269, 123–135 CrossRef CAS.
- R. Burch and E. M. Crabb, Appl. Catal., A, 1993, 97, 49–65 CrossRef CAS.
- D. Noon, B. Zohour, A. Bae, A. Seubsai and S. Senkan, RSC Adv., 2017, 7, 26783–26789 RSC.
- Q. Chen, J. H. Hoebink and G. B. Marin, Ind. Eng. Chem. Res., 1991, 30, 2088–2097 CrossRef CAS.
- J. Palomo, N. Koenraadt, J. de Kort and A. Urakawa, Submitted for publication.
- S. Brunauer, P. H. Emmett and E. Teller, J. Am. Chem. Soc., 1938, 60, 309–319 CrossRef CAS.
Footnote |
| † Electronic supplementary information (ESI) available. See DOI: https://doi.org/10.1039/d3cy00606a |
| This journal is © The Royal Society of Chemistry 2023 |

