
 Open Access Article
 This Open Access Article is licensed under a Creative Commons Attribution-Non Commercial 3.0 Unported Licence
A rotational investigation of the three isomeric forms of cyanoethynylbenzene (HCC-C6H4-CN): benchmarking experiments and calculations using the “Lego brick” approach†
Jean-Thibaut
Spaniol
a,
Kin Long Kelvin
Lee
 b,
Olivier
Pirali
a,
Cristina
Puzzarini
*c and
Marie-Aline
Martin-Drumel
*a
b,
Olivier
Pirali
a,
Cristina
Puzzarini
*c and
Marie-Aline
Martin-Drumel
*a
aUniversité Paris-Saclay, CNRS, Institut des Sciences Moléculaires d'Orsay, 91405 Orsay, France. E-mail: marie-aline.martin@universite-paris-saclay.fr
bIntel Accelerated Computing Systems and Graphics Group, Intel JF5 2111 NE 25th Ave, Hillsboro, OR 97124, USA
cDipartimento di Chimica “Giacomo Ciamician”, Università di Bologna, via F. Selmi 2, 40126 Bologna, Italy. E-mail: cristina.puzzarini@unibo.it
First published on 26th January 2023
Abstract
We report the study of three structural isomers of phenylpropiolonitrile (3-phenyl-2-propynenitrile, C6H5–C3N) containing an alkyne function and a cyano group, namely ortho-, meta-, and para-cyanoethynylbenzene (HCC–C6H4–CN). The pure rotational spectra of these species have been recorded at room temperature in the millimeter-wave domain using a chirped-pulse spectrometer (75–110 GHz) and a source-frequency modulation spectrometer (140–220 GHz). Assignments of transitions in the vibrational ground state and several vibrationally excited states were supported by quantum chemical calculations using the so-called “Lego brick” approach [A. Melli, F. Tonolo, V. Barone and C. Puzzarini, J. Phys. Chem. A, 2021, 125, 9904–9916]. From these assignments, accurate spectroscopic (rotational and centrifugal distortion) constants have been derived: for all species and all observed vibrational states, predicted rotational constants show relative accuracy better than 0.1%, and often of the order of 0.01%, compared to the experimental values. The present work hence further validates the use of the “Lego brick” approach for predicting spectroscopic constants with high precision.
1 Introduction
High performance radio instruments such as the Yebes and Green Bank telescopes or the ALMA and NOEMA observatories are increasing the rate at which the molecular content of astronomical sources is uncovered. Such instruments have enabled about 300 molecules to now be detected in the interstellar medium (ISM), with 20% of them identified in recent years (see, e.g., ref. 1). Because these current interstellar spectral surveys show unprecedented sensitivity and spectral (as well as spacial) resolution, the limiting factor to further interstellar detections—reaching ideally a full knowledge of the interstellar molecular content—is more than ever the availability of high-resolution laboratory spectroscopic data on molecules that could be present in the ISM. With high performance instrumentation now widely available from the microwave to the submillimeter-wave domains, including chirped-pulse and source-frequency modulation spectrometers,2,3 recording the rotational spectra of terrestrially stable molecules can now be a matter of days and even down to hours‡. Yet, assigning the high density of the observed spectral lines remains tedious and is very often the limiting factor in the speed of laboratory publications. Hence, several groups are working into means to ease that step, from assisted to automated identification of molecular spectral fingerprints.4–12 A general census is that reliable, accurate predictions from quantum chemical calculations is a key into speeding up the spectral assignments.13,14 In this regard, the so-called “Lego brick” approach14 (also known as TM-SE_LR or TM+LR; vide infra), that exploits the idea that the geometry of a molecular system can be built starting from different fragments (the “Lego bricks”) whose accurate semi-experimental (SE) equilibrium structures are available, appears extremely promising. Such an approach allows to accurately determine the equilibrium structure of relatively rigid molecules and thus accurately predict their rotational constants. In Melli et al.,14 a compelling benchmarking of the method against, notably, the experimental rotational constants (from Buchanan et al.15) of phenylpropiolonitrile (C6H5–C3N, hereafter PhC3N), was reported. Very recently, the validity of the approach was also verified against the data of several small-size polycyclic aromatic hydrocarbons (PAHs) and nitrogen-containing PAHs in their ground vibrational states.16The present work results from a combined experimental and theoretical effort to investigate the pure rotational spectra of three molecules of interstellar interest, the ortho-, meta-, and para-cyanoethynylbenzene (or cyanophenylacetylene or ethynylbenzonitrile, HCC–C6H4–CN, Fig. 1)—hereafter o-, m-, and p-CEB—following studies of their PhC3N isomer.14,15 CEBs have focused some interest as potential constituents of the ISM as they may be formed by consecutive additions of C2H and CN (and conversely) to benzene, reactions that have been found—experimentally and theoretically—to be barrierless and exothermic.17,18 Eventually, o-CEB may lead to the formation of nitrogen-containing PAHs which may be of relevance to the chemistry of the atmosphere of Titan.17,18 With the detection of benzonitrile (C6H5–CN) and the recent tentative one of phenylacetylene (C6H5–C2H) in TMC-1,19,20 experimental data on the difunctionalized benzene with –CN and –C2H become needed. Spectroscopic information on these species is rather scarce and almost entirely focused on p-CEB which has been investigated by NMR,21 UV spectroscopy (in the liquid phase),22 and whose structure in the solid and crystal phase has been determined.23 Various complexes of p-CEB with water have also been investigated theoretically24 and by means of infrared-ultraviolet double resonance.25,26 Very recently, the reaction of deprotonation of all three CEBs was characterized with electronic structure calculations.27 Finally, the relative energies of the CEB isomers were calculated in Buchanan et al.15 and their rotational constants were predicted using the “Lego brick” approach in Melli et al.14
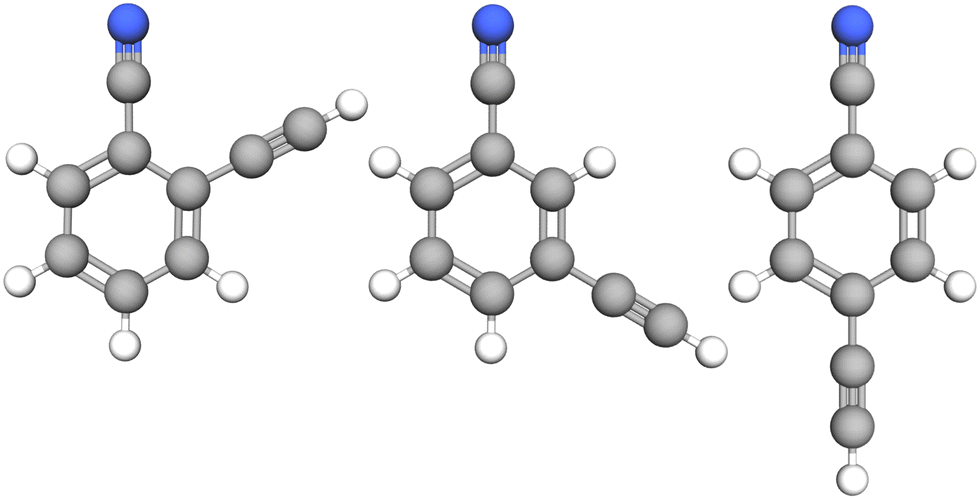 | ||
| Fig. 1 Molecular structure of the three species investigated in this study: from left to right, o-, m-, and p-cyanoethynylbenzene. | ||
We summarize here our investigations on the three CEB species: their millimeter-wave spectra have been recorded using a chirped-pulse Fourier-transform and a source-frequency modulation spectrometers, and the spectral assignments were supported by quantum chemical calculations performed using the “Lego brick” approach. For each species, pure rotational transitions have been assigned in the ground vibrational state as well as in excited vibrational ones. This work further demonstrates the performances of the “Lego brick” approach to predict the rotational constants of rigid molecules with relative accuracy better than 0.1%.
2 Computational methods
Initial experimental searches were based upon geometry optimization calculations carried out at the ωB97X-D/cc-pVQZ level of theory,28–30 which has previously proven extremely reliable to support experimental assignments of rigid molecules13 including the PhC3N isomer of the three CEBs studied in the present work.15 Details on these calculations, that were performed using the Gaussian 16 suite of electronic structure programs,31 are reported in Buchanan et al.15 The calculated rotational constants for all three CEB species can be found in Table S1 in the ESI.†As mentioned in the Introduction, a molecular system can be seen as formed by different fragments (denoted as the “Lego bricks”), whose accurate SE equilibrium geometries are available. The template molecule (TM) approach32 is then employed to account for the modifications occurring when moving from the isolated fragment to the molecular system considered. The linear regression (LR) model is instead used to correct the linkage between the different fragments.33,34 The “Lego brick” approach has also been denoted as TM-SE_LR14 or TM+LR;16 to keep the notation concise, we will use the latter one (TM+LR) in the following. TM+LR structures for o-, m-, and p-CEBs and a detailed description of the approach are provided in the ESI.†
According to vibrational second-order perturbation theory (VPT235), vibrational ground-state rotational constants (B0) consist of two terms: the equilibrium part (Be), which is the largest fraction and only depends on the equilibrium structure and the mass composition, and the vibrational correction (ΔBvib), which requires the computation of the vibration–rotation interaction constants (which—in turn—implies anharmonic force field calculations36). In Melli et al.,14 the Be values of o-, m-, and p-CEB (see Fig. 1) were determined using the TM+LR approach. In that study, the vibration–rotation interaction constants were evaluated at the B3LYP-D3/jun-cc-pVDZ level,37–40 and led to the evaluation of the ΔBvib corrections. In this work, the B3LYP-D3/jun-cc-pVDZ vibration–rotation interaction constants have been employed to predict the rotational constants of vibrationally excited states according to the following VPT2 expression:
 | (1) |
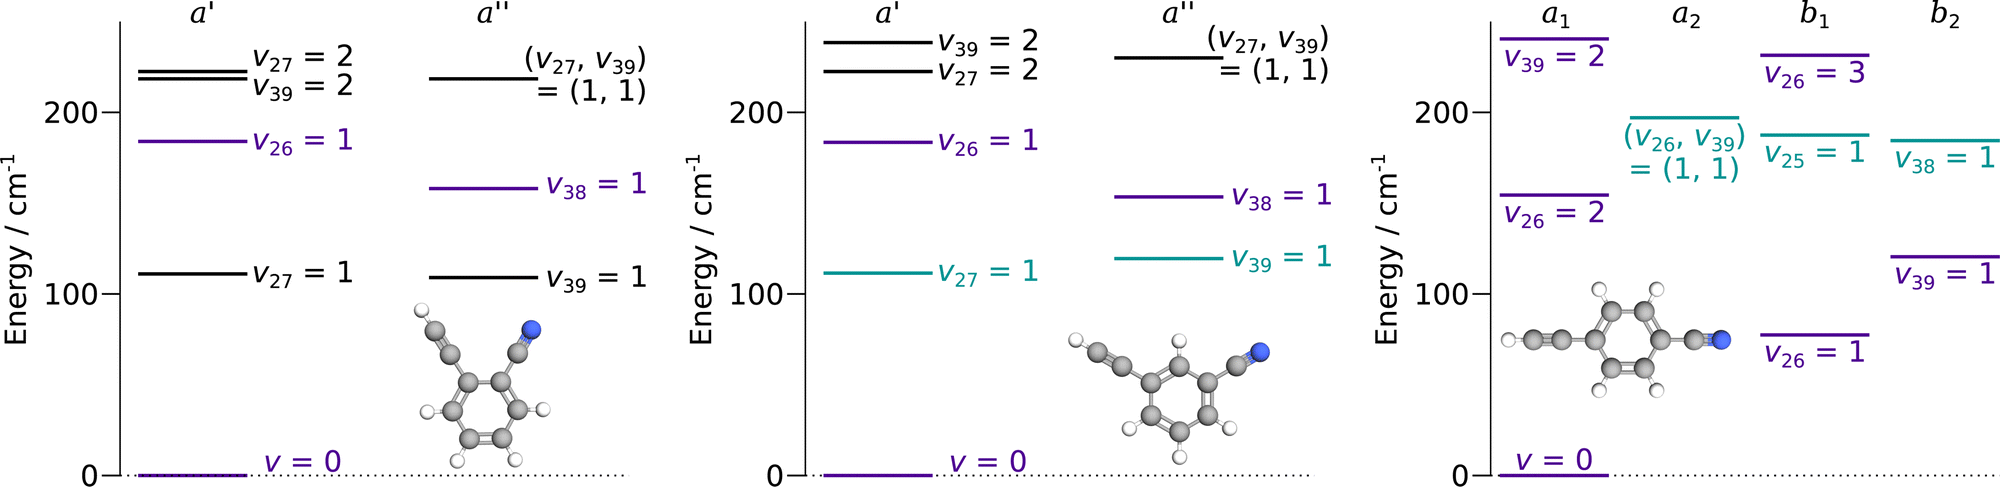 | ||
| Fig. 2 Lowest energy level diagram of o-, m-, and p-CEB, from left to right, as a function of symmetry. Only states lying below 250 cm−1 are represented. Pure rotational transitions within states represented in purple have been assigned in this study. For the states represented in blue-green, tentative assignments are proposed. Energy of states involving several quanta of excitation are obtained by summing the energies of each associated state with a single quantum of excitation. | ||
To further support the spectral assignment for the three CEBs studied in this work, their quartic centrifugal distortion constants have been computed using the using Møller-Plesset second-order theory (MP2)41 in conjunction with the cc-pVTZ basis set and within the frozen-core (fc) approximation. This required the evaluation of the harmonic force field, which has been obtained from analytical second-derivative techniques as implemented in the CFOUR quantum-chemistry program.42,43
3 Experimental methods
3.1 Samples
The o-CEB, m-CEB, and p-CEB samples, of purity higher than 97%, were purchased from Sigma-Aldrich and used without further purification. All three samples are solid at room temperature but possess sufficient vapor pressure to enable their gas phase investigation.3.2 Chirped-pulse Fourier-transform millimeter-wave measurements
Measurements in the 75–110 GHz range were performed using a commercial (Brightspec) chirped-pulse (CP) Fourier transform millimeter-wave spectrometer. Vapor pressure, typically of the order of 1.5–2 μbar, of each sample was introduced into a ∼60 cm-long cell terminated by two PTFE windows. A slow flow was ensured by a turbomolecular pump (Pfeiffer, HiCube80) to maintain stable pressure conditions during the acquisition and prevent from cell outgassing. Excitation pulses of 0.5, 0.25, and 0.5 μs-length were found to maximize the signal of o-, m-, and p-DCB, respectively. Spectra were recorded in the 75–110 GHz range using the standard High Dynamic Range mode of the instrument which uses a segmented approach with 1165 segments of 30 MHz bandwidth. The final CP spectra are obtained via the Fourier-transform of 4 μs of the free induction decay, after applying a Blackman-Harris filter. Under these conditions, isolated transitions of the CEB molecules exhibit a full-width-at-half-maximum (FWHM) of typically 500 kHz (the Doppler-width of the CEB species at 100 GHz is of the order of 100 kHz). For each compound, we acquired spectra averaged over 1 million frames (2 h of acquisition), resulting in a signal-to-noise ratio on the order of ∼100 for the strongest transitions.3.3 Source-frequency modulation millimeter-wave measurements
The spectra of the three species have been recorded in the 140–220 GHz spectral range using a source-frequency modulation millimeter-wave spectrometer that has been described in detail previously.15,44 Similarly to the CP measurements, vapor pressure of each sample at room temperature was introduced into a cell at pressure of 1.5–2 μbar and a slow flow—ensured by a turbomolecular pump (Pfeiffer, HiPace350)—was set to prevent from cell outgassing. Here the absorption cell is a 2 m-long/5 cm-diameter Pyrex absorption cell terminated by two 1 cm-thick Teflon windows. The spectrometer combines a microwave synthesizer (2–20 GHz, Rohde & Schwartz) with a frequency multiplication chain (Virginia Diodes Inc., VDI) to generate tunable radiation in the range of interest (from 75 to 900 GHz), modulated in frequency at a modulation frequency of 48.2 kHz. This radiation is collimated by a 10 mm-focal length Teflon lens into the absorption cell before being focused by a second lens (identical to the first one) onto a detector, here a Schottky diode (VDI). The signal is demodulated at the second harmonic by a lock-in amplifier (Ametek). The spectra have been recorded with a 50 kHz frequency step, a 100 ms time constant, and a frequency modulation deviation of 180 kHz. Isolated transitions exhibit a FWHM typically of 400 kHz at 200 GHz, about twice what expected for Doppler-broadened lines. As similarly observed for PhC3N,15 collisional broadening seems to be significant for these molecules exhibiting a strong permanent dipole moment.4 Results and discussion
4.1 Spectroscopic considerations
o-CEB and m-CEB belong to the Cs point group of symmetry and possess a permanent dipole moment with projections along the a axis of 3.9 D and 3.6 D, and along the b axis of 2.3 D and 2.5 D, respectively (see the ESI† of Buchanan et al.15). They possess 39 normal modes of vibration (Γ = 27a′ ⊕ 12a′′). p-CEB belongs to the C2v point group of symmetry and possesses a permanent dipole moment along the a axis of 4.3 D. The 39 normal modes of vibration of p-CEB follow the irreducible representation Γ = 14a1 ⊕ 3a2 ⊕ 9b1 ⊕ 13b2. Owing to two sets of equivalent hydrogen atoms (2 H in ortho of the –CCH group and 2 H in ortho of the –CN group), the molecule exhibits a statistical weight ratio of 5![[thin space (1/6-em)]](https://www.rsc.org/images/entities/char_2009.gif) :3 for ortho and para levels in the ground vibrational state (a1 symmetry). For excited states, this ratio is 5:3 in states of a1 or a2 symmetry, and 3:5 in states of b1 or b2 symmetry. For the three species, the vibrational states lying below 250 cm−1 are represented in Fig. 2. These molecules are asymmetric-top rotors, with Rays asymmetry parameter κ taking values of −0.1, −0.8, and −0.97 for o-, m-, and p-CEB, respectively.
:3 for ortho and para levels in the ground vibrational state (a1 symmetry). For excited states, this ratio is 5:3 in states of a1 or a2 symmetry, and 3:5 in states of b1 or b2 symmetry. For the three species, the vibrational states lying below 250 cm−1 are represented in Fig. 2. These molecules are asymmetric-top rotors, with Rays asymmetry parameter κ taking values of −0.1, −0.8, and −0.97 for o-, m-, and p-CEB, respectively.
Experimental assignments have been performed using Loomis-Wood diagrams created by the LWWa program for asymmetric top molecules.45 Rotational constants of all three species have been adjusted using the SPFIT/SPCAT suite of programs;46 a Watson A-reduced Hamiltonian in the Ir representation has been employed. Simulations of the spectra using the spectroscopic constants have been performed using the PGOPHER software.47
4.2 Pure rotational transitions in v = 0
For all three species, the assignment of pure rotational transitions within the vibrational ground state was straightforward using predictions derived from the ωB97X-D/cc-pVQZ calculations, and even more obvious using the TM+LR predictions. A comparison of the experimental CP spectrum of m-CEB with a simulated spectrum obtained using the predicted TM+LR constants (also incorporating vibrational corrections) from Melli et al.,14 without addition of any centrifugal distortion term, is shown on Fig. 3. The simulation shows clusters visually matching the experimental spectrum (top panel). A zoomed-in view of the first cluster observed in the spectral region covered experimentally (middle panel) reveals that several transitions involving low-Ka values lie very close to the prediction. It is worth noting that m-CEB was chosen for illustrating the performances of the TM+LR approach because, out of the three molecules studied in this work, it is the one for which predictions are showing the “worst” agreement with the experiment. Fig. 3 also shows a Loomis-Wood representation of the experimental spectrum around the predictions of the QR0, , a-type transitions (lower panel). Clear series, colored in blue-green, are visible. These series deviate significantly from the prediction for high J′′ values, because no centrifugal distortion effect was taken into account at this stage of the prediction. Nevertheless, the clear progression in
  allows for unambiguous assignments.
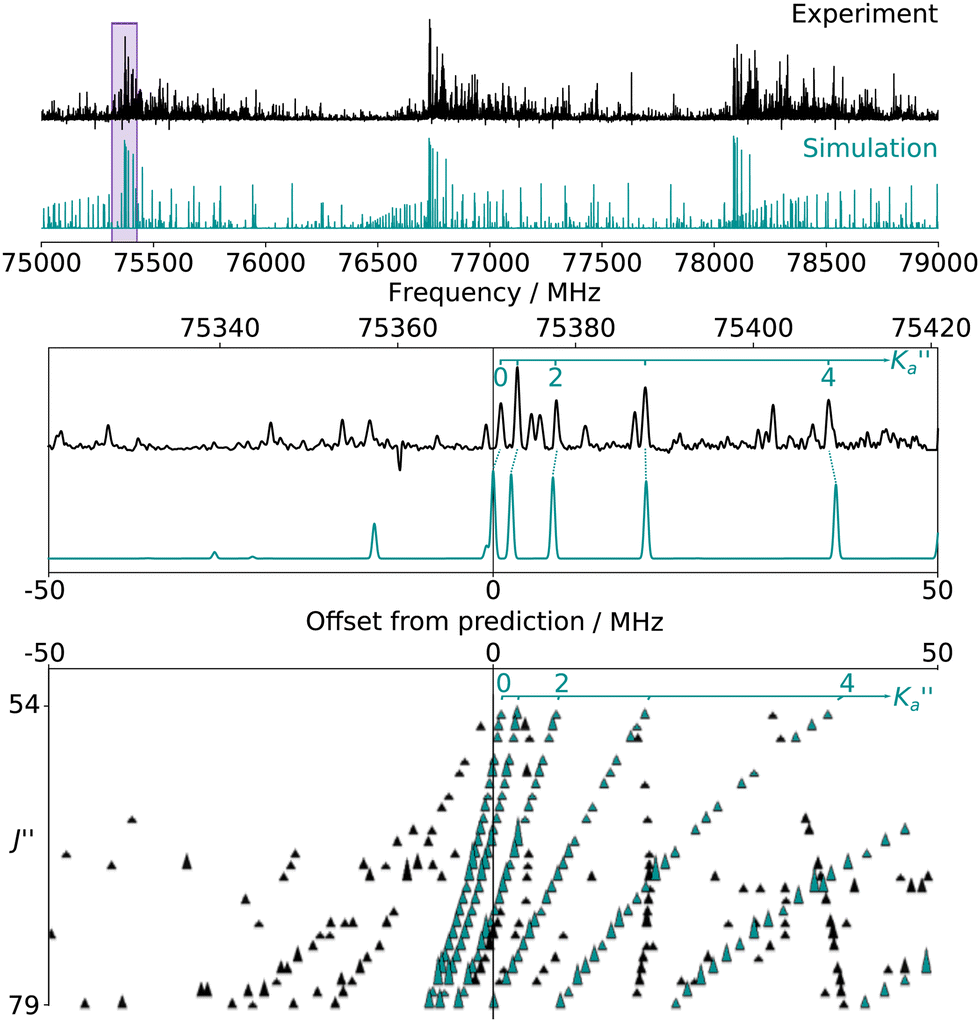 | ||
Fig. 3 (Top panel) Portion of the experimental spectrum (in black) of m-CEB recorded using the CP spectrometer and comparison with a 300 K simulation performed using the rotational constants predicted by the TM+LR approach (in blue-green). (Middle panel) 100 MHz-wide zoom around the predicted frequency of the  transition; the corresponding spectral window is highlighted by a purple area on the top panel. (Bottom panel) Loomis-Wood plot for the QR0, transition; the corresponding spectral window is highlighted by a purple area on the top panel. (Bottom panel) Loomis-Wood plot for the QR0,  , a-type transitions where each experimental transition is represented by a triangle of height proportional to its intensity. Each horizontal section is a 100 MHz-wide portion of the spectrum around the prediction of the corresponding J′′ transition, hence the J′′ = 54 segment matches the zoom presented in the middle panel while the J′′ = 79 one corresponds to the highest frequency cluster visible in the top panel. For the sake of clarity, weak transitions, as well as the 140–220 GHz range, are not represented. Lines assigned to transitions involving the aforementioned selection rule are shown in blue-green. The Ka = 0–5 series are labeled in blue-green in both the middle and bottom panels. , a-type transitions where each experimental transition is represented by a triangle of height proportional to its intensity. Each horizontal section is a 100 MHz-wide portion of the spectrum around the prediction of the corresponding J′′ transition, hence the J′′ = 54 segment matches the zoom presented in the middle panel while the J′′ = 79 one corresponds to the highest frequency cluster visible in the top panel. For the sake of clarity, weak transitions, as well as the 140–220 GHz range, are not represented. Lines assigned to transitions involving the aforementioned selection rule are shown in blue-green. The Ka = 0–5 series are labeled in blue-green in both the middle and bottom panels. | ||
In total, thousands of transitions have been assigned to each species. For o- and m-CEB, both a- and b-type transitions have been observed, although many of them are overlapping, and many weak Q-branch lines have also been assigned. In total, for these two species, 11629 and 10604 transitions have been assigned to 5722 and 6462 different frequencies, respectively. The large difference between number of transitions and number of frequencies comes not only from overlapping a- and b-type transitions but also from unresolved asymmetric splittings. The range of observed quantum numbers involves up to J′′ = 164 and  for o-CEB, and J′′ = 167 and
  for m-CEB. Concerning p-CEB, for which only a-type transitions are allowed, only R-branch transitions have been observed, for a total of 7908 transitions (4814 different frequencies) involving J′′ up to 173 and
  up to 56. To derive the spectroscopic constants in v = 0 for the three species, all transitions were weighted according to their expected experimental accuracy, assumed here to be 50 kHz. To reproduce the data to this experimental accuracy, inclusion of quartic and sextic centrifugal distortion constants was required. In that regard, the assignment of transitions in the 140–220 GHz range (not represented in Fig. 3), involving high J values, was crucial. Table 1 summarizes the derived rotational constants and the centrifugal distortion ones and Table 2 the relevant fit parameters. Overall, the three fits are quite satisfactory and take root mean square (RMS) values of 47 kHz, 45 kHz, and 37 kHz (hence weighted standard deviations of 0.94, 0.91, and 0.73) for o-, m-, and p-CEB, respectively. It is worth noting that for p-CEB, since A≫B∼C, a fit in the S-reduction was also performed. The only parameter affected by this change is δK and overall the resulting fit is of similar quality, taking the same RMS and weighted standard deviation values, as using the A-reduction.
| Parameter | o-CEB | m-CEB | p-CEB | ||||||||
|---|---|---|---|---|---|---|---|---|---|---|---|
| Exp./MHz | Pred.a/MHz | Diff.b/% | Exp./MHz | Pred.a/MHz | Diff.b/% | Exp./MHz | Pred.a/MHz | Diff.b/% | |||
| a For A, B, C: in v = 0, Pred. = calc.; otherwise, Pred. = Exp.(v = 0) − αicalc. b |(Exp. − calc.)/calc.| × 100. c cm−1. | |||||||||||
| v = 0 | A | 2027.441205 (98) | 2028.34 | 0.04 | 2704.87469 (15) | 2707.11 | 0.08 | 5646.3543 (52) | 5647.34 | 0.02 | |
| B | 1329.456144 (39) | 1329.37 | <0.01 | 907.033894 (26) | 906.69 | 0.04 | 709.161497 (30) | 709.10 | 0.01 | ||
| C | 802.668552 (30) | 802.78 | 0.01 | 679.066023 (24) | 679.01 | 0.01 | 630.029790 (29) | 629.98 | 0.01 | ||
| ΔJ | ×103 | 0.0721681 (56) | 0.0715 | 0.9 | 0.0419596 (16) | 0.0418 | 0.4 | 0.00795215 (46) | 0.00766 | 3.8 | |
| ΔJK | ×103 | −0.399792 (18) | −0.409 | 2.3 | −0.434212 (11) | −0.442 | 1.8 | 0.145379 (14) | 0.146 | 0.4 | |
| ΔK | ×103 | 1.815892 (62) | 1.90 | 4.4 | 2.63191 (19) | 2.66 | 1.1 | 1.134 (17) | 1.08 | 5.0 | |
| δ J | ×103 | 0.0302466 (26) | 0.0299 | 1.2 | 0.01709415 (89) | 0.0171 | <0.1 | 0.00107654 (28) | 0.00105 | 2.5 | |
| δ K | ×103 | −0.0630206 (99) | −0.0682 | 7.6 | 0.0593386 (74) | 0.0562 | 5.6 | 0.119902 (99) | 0.120 | 0.1 | |
| v 38 = 1 | E | 158 | 153 | ||||||||
| A | 2014.2218 (80) | 2014.11 | <0.01 | 2684.948 (33) | 2687.42 | 0.09 | |||||
| B | 1330.7245 (42) | 1330.73 | <0.01 | 907.7190 (39) | 907.68 | <0.01 | |||||
| C | 803.548695 (94) | 803.46 | 0.01 | 679.680020 (99) | 679.65 | <0.01 | |||||
| v 26 = 1 | E | 184 | 183 | 77 | |||||||
| A | 2042.9632 (12) | 2042.28 | 0.03 | 2727.459 (27) | 2724.70 | 0.10 | 5541.7655 (67) | 5547.27 | 0.10 | ||
| B | 1331.82713 (51) | 1331.82 | <0.01 | 908.3147 (32) | 908.26 | <0.01 | 709.636066 (40) | 709.63 | <0.01 | ||
| C | 803.15419 (12) | 803.09 | 0.01 | 679.466887 (93) | 679.43 | <0.01 | 630.790167 (37) | 630.75 | <0.01 | ||
| v 39 = 1 | E | 120 | |||||||||
| A | 5746.7343 (78) | 5741.47 | 0.09 | ||||||||
| B | 709.824720 (46) | 709.79 | <0.01 | ||||||||
| C | 630.327283 (42) | 630.30 | <0.01 | ||||||||
Table 1 allows for a comparison of the experimentally-derived rotational constants in v = 0 with those predicted using the TM+LR approach reported in Melli et al.14 The agreement is excellent, with absolute relative differences better than 0.1% and often of the order of 0.01%. In comparison, the predictions obtained by Bayesian scaling of the equilibrium constants using the method described in Lee and McCarthy et al.13 (Table S6 of Buchanan et al.15) show marginally worse agreement with the experimental values, with absolute relative differences of the order of 0.5% or better (see Table S1 in the ESI†). Such agreement is particularly fair with respect to the relatively low computational cost of this approach where no vibrational corrections have to be calculated because a statistical correction in lieu of them is assumed. Finally, it is worth noting that the scaled predictions using the rotational constants of the PhC3N isomer (also proposed in the Table S6 of Buchanan et al.15 and reported in Table S1 in the ESI†) brings that difference down to better 0.05% for B and C, although the error on A remains larger (especially for o-CEB, see Table S1, ESI†). This last method, however, remains only applicable within an isomeric family and implies that one isomer has already been observed experimentally, and does not reach the level of accuracy achieved by the TM+LR approach. Concerning the quartic centrifugal distortion constants, for all three species, the values derived in v = 0 from the fits are in excellent agreement with the MP2 computed values, both in sign and order of magnitude (see Table 1), with averaged deviations of ∼3%. In particular, for p-CEB, even though only a-type transitions are observed, the ΔK parameter is accurately determined (although not at the level reached for the other species). The comparison of experiment with B3LYP-D3/jun-cc-pVDZ quartic centrifugal distortion constants is presented and discussed in the ESI.† This points out potential problems in the Gaussian 16 package.
Fits of these data using a Watson Hamiltonian in the IIIr representation were also attempted with the PGOPHER software. In all cases, these fits were not as satisfactory as using the Ir representation (larger weighted standard deviation, requirement of inclusion of higher order centrifugal distortion parameters to reproduce data at their experimental accuracy) and, in the case of o-CEB, no proper fit was achieved at all. We conclude that the Ir representation is more suited than the IIIr one to reproduce the data of the CEB species.
4.3 Pure rotational transitions within the vibrationally excited states
The numerous low-lying vibrational states of each species possess significant population at room temperature which results in a high density of lines with significant intensity visible on the experimental spectra. To search for pure rotational transitions within the vibrationally excited states involving one quantum of excitation, predictions were obtained by subtracting the calculated vibration–rotation interaction constant α (see Table S2 in the ESI†) to the experimental rotational constants in v = 0 for each species (in eqn (1), the experimental B0 is thus used). The corresponding predicted rotational constants are reported in Table 1. To account for centrifugal distortion, values derived for the quartic and sextic constants in v = 0 (see Table 2) were used as a starting point. Using these predictions, spectral attributions are, again, straightforward for several vibrational states. An example, the case of v38 = 1 for o-CEB, is presented on Fig. 4 (in orange). On this figure, showing the first cluster of lines visible in the CP spectrum, the series of transitions in v38 = 1 appear well predicted, down to the band head at , and merely shifted by 8 MHz or less from the experimental observation. It is interesting to note that extrapolation of the
  series in the Loomis-Wood plot to J′′ = 0 would bring the
  series to a 0 MHz offset value, a further assessment of the quality of the prediction.
| Parametera | o-CEB | m-CEB | p-CEB | ||||||
|---|---|---|---|---|---|---|---|---|---|
| v = 0 | v 38 = 1 | v 26 = 1 | v = 0 | v 38 = 1 | v 26 = 1 | v = 0 | v 26 = 1 | v 39 = 1 | |
| a In MHz, unless otherwise noted. b Number of lines (N) and number of lines with different frequencies (n), unitless. c Root mean square, in MHz. d Weighted standard deviation, unitless. | |||||||||
| ΔJ×103 | 0.0721681 (56) | 0.0717 (10) | 0.071626 (55) | 0.0419596 (16) | 0.04399 (51) | 0.04218 (23) | 0.00795215 (46) | 0.00805657 (61) | 0.00800410 (71) |
| ΔJK×103 | −0.399792 (18) | −0.566 (36) | −0.4950 (12) | −0.434212 (11) | −0.3892 (95) | −0.5191 (44) | 0.145379 (14) | 0.143217 (23) | 0.144134 (35) |
| ΔK×103 | 1.815892 (62) | 1.89 (11) | 2.4420 (40) | 2.63191 (19) | 1.067 (34) | 4.022 (17) | 1.134 (17) | −7.538 (22) | 9.869 (26) |
| δ J ×103 | 0.0302466 (26) | 0.03001 (52) | 0.030009 (29) | 0.01709415 (89) | 0.01808 (25) | 0.01722 (12) | 0.00107654 (28) | 0.00105418 (37) | 0.00110228 (43) |
| δ K ×103 | −0.0630206 (99) | −0.198 (20) | −0.06348 (67) | 0.0593386 (74) | 0.0593386 | 0.0593386 | 0.119902 (99) | 0.01888 (13) | 0.21333 (15) |
| Φ J ×109 | 0.05730 (40) | 0.05730 | 0.05730 | 0.023560 (48) | 0.02327 (13) | 0.02366 (11) | |||
| Φ JK ×109 | −0.6072 (12) | −1.303 (18) | −0.0485 (65) | −0.28178 (80) | −0.28178 | −0.28178 | 0.05162 (26) | 0.07957 (48) | 0.01844 (71) |
| Φ KJ ×109 | 1.2633 (44) | 1.2633 | −8.156 (47) | 0.4892 (34) | 0.4892 | 0.4892 | −0.9319 (44) | −0.7494 (89) | −1.103 (15) |
| Φ K ×109 | 1.866 (12) | −12.24 (30) | 32.54 (21) | 5.017 (71) | 5.017 | 5.017 | |||
| ϕ J ×109 | 0.02875 (20) | 0.02875 | 0.02794 (18) | 0.011514 (29) | 0.011514 | 0.011514 | |||
| ϕ JK ×109 | −0.1692 (12) | −0.1692 | −0.1692 | ||||||
| ϕ K ×109 | 1.2930 (16) | −4.41 (11) | 1.2930 | 2.1395 (79) | 2.1395 | 2.1395 | |||
| N/nb | 11629/5722 |
2785/1492 | 3043/1717 | 10604/6462 |
2063/1068 | 1843/1064 | 7908/4814 | 6316/3951 | 5442/6474 |
|
164, 83 | 135, 30 | 135, 37 | 167, 76 | 159, 20 | 160, 22 | 173, 56 | 172, 49 | 173, 45 |
| RMSc | 0.047 | 0.075 | 0.072 | 0.045 | 0.065 | 0.067 | 0.037 | 0.047 | 0.051 |
| σ | 0.94 | 1.01 | 0.96 | 0.91 | 0.87 | 0.89 | 0.73 | 0.93 | 1.01 |
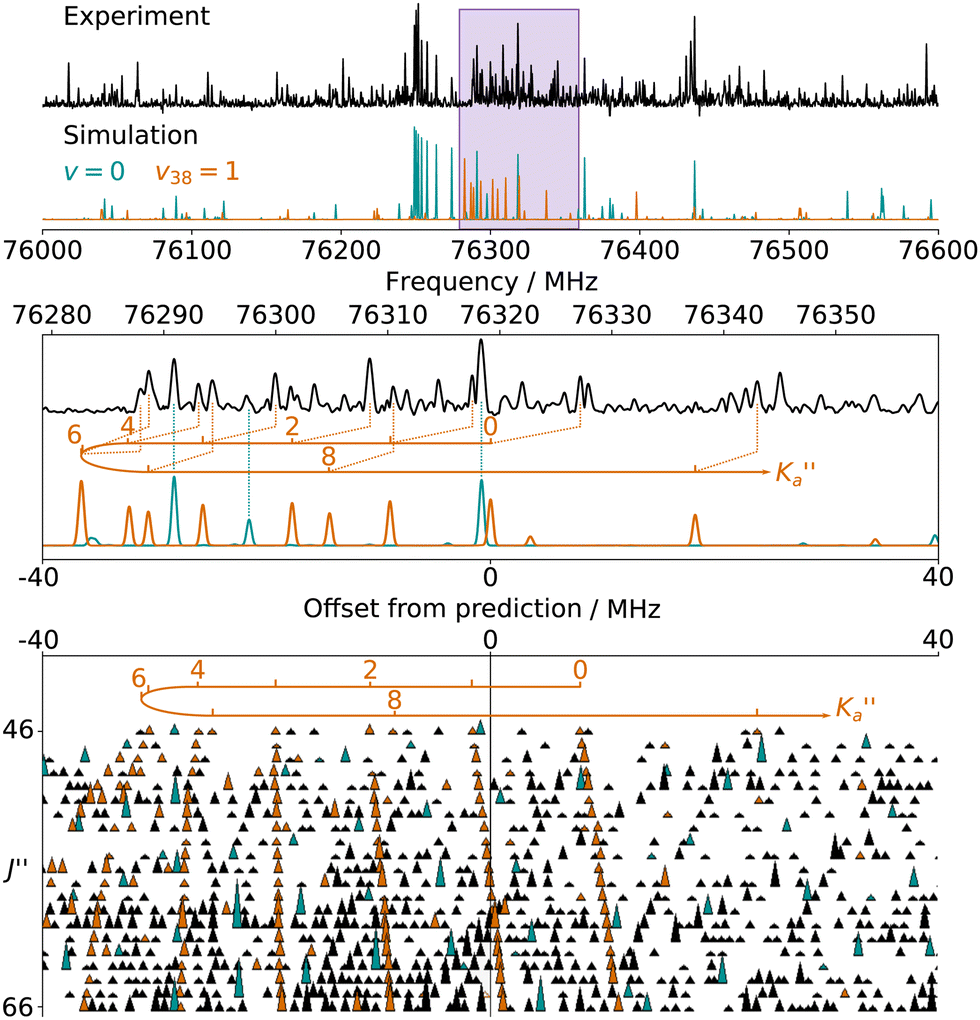 | ||
Fig. 4 (Top panel) Portion of the experimental spectrum around 76 GHz (in black) of o-CEB recorded using the CP spectrometer and comparison with a 300 K simulation of the spectrum in the vibrational ground state (in blue-green) and in v38 = 1 (in orange). The v = 0 simulation was performed using the final set of spectroscopic constants while the one in v38 = 1 was obtained using the rotational constants predicted using eqn (1) (with the experimental B0). (Middle Panel) 80 MHz-wide zoom around the predicted frequency of the  transition; the corresponding spectral window is highlighted by a purple area on the top panel. (Bottom panel) Loomis-Wood plot for the QR0, transition; the corresponding spectral window is highlighted by a purple area on the top panel. (Bottom panel) Loomis-Wood plot for the QR0,  , a-type transitions with 80 MHz-wide segments, similar to the plot presented in Fig. 3. Lines assigned to transitions in v = 0 are shown in blue-green, those in v38 = 1 in orange. The Ka = 0–9 series in v38 = 1 are labeled in orange. , a-type transitions with 80 MHz-wide segments, similar to the plot presented in Fig. 3. Lines assigned to transitions in v = 0 are shown in blue-green, those in v38 = 1 in orange. The Ka = 0–9 series in v38 = 1 are labeled in orange. | ||
Overall, we assigned for each molecule pure rotational transitions within two vibrationally excited states involving a single quantum of excitation, namely v38 = 1 (a′′ symmetry, 158 cm−1) and v26 = 1 (a′ symmetry, 184 cm−1) for o-CEB, v38 = 1 (a′′, 153 cm−1) and v26 = 1 (a′, 183 cm−1) for m-CEB, and v26 = 1 (b1, 77 cm−1) and v29 = 1 (b2, 120 cm−1) for p-CEB (see Fig. 2 for a graphical representation; energy values are at the B3LYP-D3/jun-cc-pVDZ level). For each of these, a thousand or more different frequencies have been assigned with J′′ quantum numbers spanning a similar range to those involving v = 0 and  up to at least 20 (the lower in energy is the level, the higher
  values have been assigned). A detailed account on the assignments is reported in Table 2. Spectroscopic constants for each set of data have been adjusted using a similar Hamiltonian to that for the ground vibrational state of each molecule and all transitions have been weighted to their experimental accuracy, assumed to be 75 kHz for the two observed vibrational satellites of o- and m-CEB, and 50 kHz for those of p-CEB (based on the signal-to-noise ratio of these features). The smaller value for p-CEB arises from the stronger intensities of these satellites (which results from the fact that the corresponding vibrational states lie relatively low in energy). The resulting sets of parameters are reported in Tables 1 and 2. All fits take a weighted standard deviation close to unity. The agreement between the experimentally derived rotational constants and those predicted is again excellent, with all absolute relative difference better than 0.1%. The B and C constants are often predicted within 0.01%. We note that the ΔK values in the vibrationally excited states of p-CEB are significantly different from the ground state value. A fit with ΔK fixed to the ground state (or the calculated) value did not allow to reproduce the transitions satisfactorily and no other distortion parameter, including higher order ones, enabled a proper fit of the data. Such wide variations in ΔK may arise from some perturbations in these excited states.
Each of the three species possesses two additional vibrational states involving a single quantum of excitation lying below 250 cm−1: v39 = 1 (a′′ symmetry, 109 cm−1) and v27 = 1 (a′ symmetry, 111 cm−1) for o-CEB, v27 = 1 (a′, 111 cm−1) and v39 = 1 (a′′, 119 cm−1) for m-CEB, and v38 = 1 (b2, 184 cm−1) and v25 = 1 (b1, 187 cm−1) for p-CEB (see Fig. 2). For o- and m-CEB, these states lie at lower energy than those for which we report spectroscopic assignments and indeed strong transitions are seen in the vicinity of the predictions. The spectra, however, appear severely perturbed. At this stage, it has not been possible to assign and fit with confidence the transitions within these vibrational states that lie very close in energy. Tentative assignments are proposed for v27 = 1 and v39 = 1 for m-CEB, and v38 = 1 and v25 = 1 for p-CEB (these states are shown in blue-green in Fig. 2). In each case, only a few Ka series that appeared the least perturbed have been assigned. The derived tentative spectroscopic constants are reported in Tables S3 and S4 in the ESI.† The experimentally-derived B and C rotational constants appear in excellent agreement with the predictions (to better than 0.1%). The A constant, however, is not as close (with about 2% difference for m-CEB) which may be attributed to the fact that the current model does not attempt to treat the interaction between the energy levels. No assignment was possible for v39 = 1 and v27 = 1 of o-CEB, maybe because these vibrational states are calculated to lie the closest in energy, and thus may suffer the most from perturbations.
Finally, for p-CEB we have also assigned pure rotational transitions within vibrational states involving several quanta of excitation: v26 = 2 (a1 symmetry, 154 cm−1), v26 = 3 (b1, 231 cm−1), and v39 = 2 (a1, 240 cm−1). Predictions for these states were performed using experimental α values derived from the analysis of the lower vibrational states using eqn (1). As expected from such purely experimental scaling, the predictions were extremely close to the experimental transitions. About 2000 different frequencies were assigned to each of these vibrational states, and the spectroscopic constants resulting from the fit of these data are presented in Table S5 in the ESI.† Transitions within v26 = 2 were given a 50 kHz uncertainty and those in v26 = 3 and v39 = 2 a 75 kHz one. All fit have a weighted standard deviation close to unity. The experimentally-derived B and C values are almost equal to the predicted ones (with differences lower than 0.0004%) while A constants are within 0.1% of the prediction. Assignments are also proposed within the (v26, v39) = (1,1) vibrational state, although they remain tentative as this vibrational energy state lies very close to v38 = 1 and v25 = 1 (Fig. 2), and appears severely perturbed as well. The corresponding spectroscopic constants and preliminary fit parameters are reported in Table S4 in the ESI.† For these three states, as well as the two perturbed ones for o- and m-CEB, a proper study of the interaction between the energy levels lying close in energy appears mandatory to enable secure assignments of the full bands and derive accurate spectroscopic constants. Fig. 5 presents a portion of the spectrum, around 218 GHz, recorded for the p-CEB molecule using the source-frequency modulation spectrometer and a comparison with the simulations of the pure rotational transitions within the vibrational ground state and the five vibrationally-excited states assigned with confidence in this study. Because the models for v38 = 1, v25 = 1, and (v26, v39) = (1,1) are not reliable at this stage, the corresponding transitions are not represented on the Figure, although they should be stronger than those within v26 = 3. Regardless, the spectral density of the p-CEB spectrum is nicely reproduced by the simulation and the remaining transitions (at the exclusion of those in the three perturbed states mentioned above) are quite weak. It is also worth to mention that pure rotational transitions of isotopic variants of the species also contribute to the spectral density, although these transitions exhibit at most 1% of the intensity of those of the main species in v = 0.
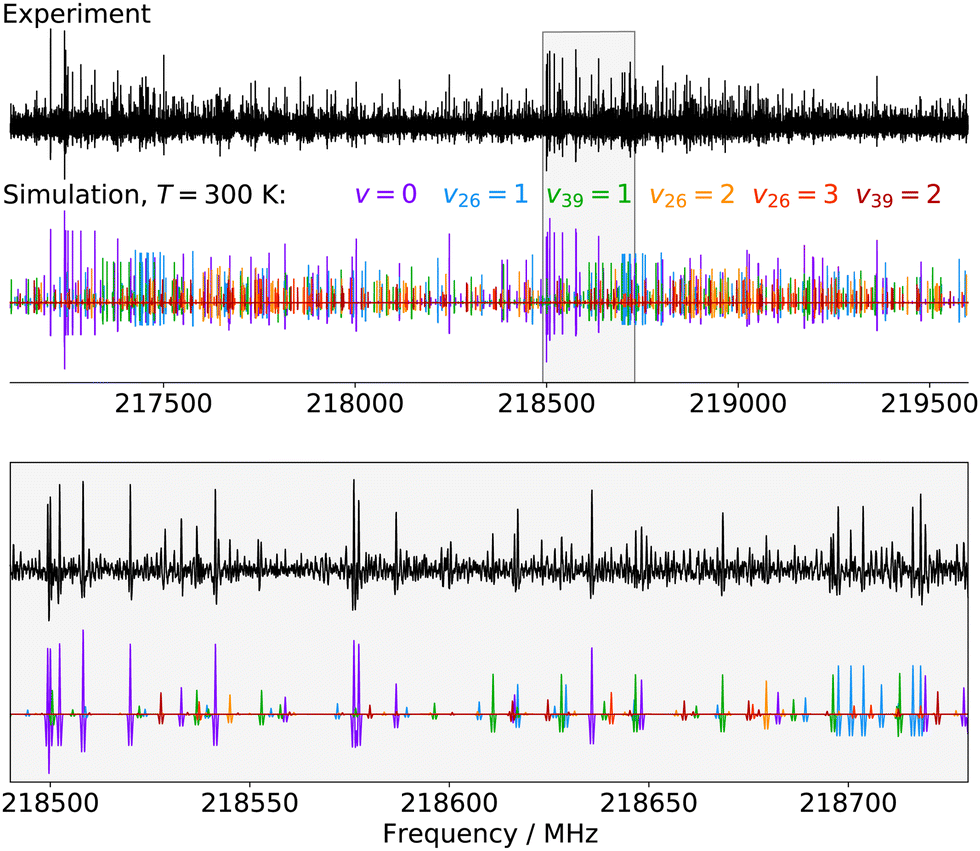 | ||
| Fig. 5 Portions of the spectrum of p-CEB recorded in this work using the source-frequency modulation millimeter-wave spectrometer and comparison with simulations (at 300 K) of the pure rotational spectrum of the molecule in the six vibrational states assigned in this study (from v = 0 to v39 = 2 by increasing energy, see Fig. 2). The second derivative of the simulations is plotted, for better comparison with the experimental spectrum. The lower panel is a zoom-in on the region highlighted in gray in the upper panel. | ||
For all three species and all observed vibrational states, the lists of experimental assignments (secured and tentative) and all fit files are provided in the ESI,† as ASCII files.
4.4 Astronomical implications
Since both –CN and –C2H are strongly polar groups, and since chemically similar species benzonitrile and phenylacetylene are known (or very likely) interstellar molecules,19,20 each CEB isomer is a strong candidate for interstellar detection, and the spectroscopic data obtained throughout this study enables astronomical searches for these molecules. Conditions relevant to likely environments are dark molecular clouds and objects along the star formation process—such as Serpens 1a—where benzonitrile has been detected. More relevant to the vibrationally excited states reported here are warm carbon chemistry regions and hot corinos that possess significantly higher (∼100 K) gas temperatures48 which facilitate population of these states, barring dynamic effects such as pumping or state–specific formation.Regarding astrochemical dynamics, detection of any of these isomers and their relative ratios would provide a wealth of information: among molecular families currently detected in the ISM, these o/m/p-CEB isomers should—under terrestrial conditions—demonstrate preferences to either ortho/para or meta direction depending on the sequence of reactions. If CEB is formed via addition of –C2H to benzonitrile, –CN is known to be meta directing based on Hirshfeld charges,49 whereas –CN addition to phenylacetylene would likely be ortho/para-directing. By quantifying the relative abundance of each isomer, we would be able to infer the mechanistic history of this isomeric family, whether it is dominated by thermodynamics or kinetics, and ultimately gain invaluable insight into the validity of chemical models.
5 Conclusions
In this study we have exploited the “Lego brick” (also known as TM-SE_LR or TM+LR) approach to assign the pure rotational spectrum of three molecules—o-CEB, m-CEB, and p-CEB—in their vibrational ground state and several vibrationally excited states. The performances of the TM+LR approach are excellent, enabling spectroscopic assignments of these rather rigid molecules in a matter of hours for the vibrational ground state, making this analysis step competitive in time with the spectral acquisition and calculation time (both of which are also a matter of hours). The present work further confirms previous results obtained using this approach.14,16 Beyond benchmarking of the “Lego brick” approach, the accurate spectroscopic parameters derived for each molecule enable their searches in various interstellar environments, at any temperature down from 300 K, though observations at frequencies up to, reliably, 220 GHz.Author contributions
Jean-Thibaut Spaniol: investigation, formal analysis, writing – original draft. Kin Long Kelvin Lee: conceptualization, software, writing – review. Olivier Pirali: project administration, funding acquisition, writing – review. Cristina Puzzarini: data curation, writing – review, funding acquisition. Marie-Aline Martin-Drumel: formal analysis, writing – original draft, project administration, funding acquisition.Conflicts of interest
There are no conflicts to declare.Acknowledgements
We thank Mattia Melosso and Silvia Alessandrini for useful discussions. This work has been supported by the Région Ile-de-France, through DIM-ACAV+, from the Agence Nationale de la Recherche (ANR-19-CE30-0017-01), from the “Investissements d'Avenir” LabEx PALM (ANR-10-LABX-0039-PALM), and from the Programme National “Physique et Chimie du Milieu Interstellaire” (PCMI) of CNRS/INSU with INC/INP co-funded by CEA and CNES. In Bologna, this work was supported by the MUR (PRIN Grant Number 202082CE3T).Notes and references
- D. E. Woon, A hyper-bibliography of known astromolecules, http://www.astrochymist.org/.
- G. G. Brown, B. C. Dian, K. O. Douglass, S. M. Geyer, S. T. Shipman and B. H. Pate, Rev. Sci. Instrum., 2008, 79, 053103 CrossRef PubMed.
- S. L. Widicus Weaver, Annu. Rev. Astron. Astrophys., 2019, 57, 79–112 CrossRef.
- K. N. Crabtree, M.-A. Martin-Drumel, G. G. Brown, S. A. Gaster, T. M. Hall and M. C. McCarthy, J. Chem. Phys., 2016, 144, 124201 CrossRef PubMed.
- M.-A. Martin-Drumel, M. C. McCarthy, D. Patterson, B. A. McGuire and K. N. Crabtree, J. Chem. Phys., 2016, 144, 124202 CrossRef PubMed.
- M. Martin-Drumel, C. Endres, O. Zingsheim, T. Salomon, J. van Wijngaarden, O. Pirali, S. Gruet, F. Lewen, S. Schlemmer, M. McCarthy and S. Thorwirth, J. Mol. Spectrosc., 2015, 315, 72–79 CrossRef CAS.
- O. Zingsheim, L. Bonah, F. Lewen, S. Thorwirth, H. S. Müller and S. Schlemmer, J. Mol. Spectrosc., 2021, 381, 111519 CrossRef CAS.
- L. Bonah, O. Zingsheim, H. S. Müller, J.-C. Guillemin, F. Lewen and S. Schlemmer, J. Mol. Spectrosc., 2022, 388, 111674 CrossRef CAS.
- N. A. Seifert, I. A. Finneran, C. Perez, D. P. Zaleski, J. L. Neill, A. L. Steber, R. D. Suenram, A. Lesarri, S. T. Shipman and B. H. Pate, J. Mol. Spectrosc., 2015, 312, 13–21 CrossRef CAS.
- W. L. Meerts and M. Schmitt, Int. Rev. Phys. Chem., 2006, 25, 353–406 Search PubMed.
- M. McCarthy and K. L. K. Lee, J. Phys. Chem. A, 2020, 124, 3002–3017 CrossRef CAS PubMed.
- M. C. McCarthy, K. L. K. Lee, P. B. Carroll, J. P. Porterfield, P. B. Changala, J. H. Thorpe and J. F. Stanton, J. Phys. Chem. A, 2020, 124, 5170–5181 CrossRef CAS PubMed.
- K. L. K. Lee and M. McCarthy, J. Phys. Chem. A, 2020, 124, 898–910 CrossRef CAS PubMed.
- A. Melli, F. Tonolo, V. Barone and C. Puzzarini, J. Phys. Chem. A, 2021, 125, 9904–9916 CrossRef CAS PubMed.
- Z. Buchanan, K. L. K. Lee, O. Chitarra, M. C. McCarthy, O. Pirali and M.-A. Martin-Drumel, J. Mol. Spectrosc., 2021, 377, 111425 CrossRef CAS.
- H. Ye, S. Alessandrini, M. Melosso and C. Puzzarini, Phys. Chem. Chem. Phys., 2022, 24, 23254–23264 RSC.
- A. Landera and A. M. Mebel, Faraday Discuss., 2010, 147, 479 RSC.
- C. J. Bennett, S. B. Morales, S. D. Le Picard, A. Canosa, I. R. Sims, Y. H. Shih, A. H. H. Chang, X. Gu, F. Zhang and R. I. Kaiser, Phys. Chem. Chem. Phys., 2010, 12, 8737 RSC.
- B. A. McGuire, A. M. Burkhardt, S. Kalenskii, C. N. Shingledecker, A. J. Remijan, E. Herbst and M. C. McCarthy, Science, 2018, 359, 202–205 CrossRef CAS PubMed.
- J. Cernicharo, M. Agúndez, R. I. Kaiser, C. Cabezas, B. Tercero, N. Marcelino, J. R. Pardo and P. de Vicente, Astron. Astrophys., 2021, 655, L1 CrossRef CAS.
- D. A. Dawson and W. F. Reynolds, Can. J. Chem., 1975, 53, 373–382 CrossRef CAS.
- X.-K. Jiang, G.-Z. Ji, D. Z.-R. Wang and J. R.-Y. Xie, J. Phys. Org. Chem., 1995, 8, 781–790 CrossRef CAS.
- S. Mahapatra, Y. Azim and G. R. Desiraju, J. Mol. Struct., 2010, 976, 200–204 CrossRef CAS.
- A. Masunov and J. Dannenberg, J. Mol. Struct.: THEOCHEM, 1996, 371, 17–19 CrossRef CAS.
- S. Maity and G. N. Patwari, J. Phys. Chem. A, 2010, 114, 8337–8344 CrossRef CAS PubMed.
- S. Maity and G. Naresh Patwari, Indian J. Phys., 2012, 86, 173–179 CrossRef CAS.
- M. E. Strauss, T. J. Santaloci and R. C. Fortenberry, Chemistry, 2022, 4, 42–56 CrossRef CAS.
- J.-D. Chai and M. Head-Gordon, Phys. Chem. Chem. Phys., 2008, 10, 6615 RSC.
- T. H. Dunning, J. Chem. Phys., 1989, 90, 1007–1023 CrossRef CAS.
- D. E. Woon and T. H. Dunning, J. Chem. Phys., 1993, 98, 1358–1371 CrossRef CAS.
- M. J. Frisch, G. W. Trucks, H. B. Schlegel, G. E. Scuseria, M. A. Robb, J. R. Cheeseman, G. Scalmani, V. Barone, G. A. Petersson, H. Nakatsuji, X. Li, M. Caricato, A. V. Marenich, J. Bloino, B. G. Janesko, R. Gomperts, B. Mennucci, H. P. Hratchian, J. V. Ortiz, A. F. Izmaylov, J. L. Sonnenberg, D. Williams-Young, F. Ding, F. Lipparini, F. Egidi, J. Goings, B. Peng, A. Petrone, T. Henderson, D. Ranasinghe, V. G. Zakrzewski, J. Gao, N. Rega, G. Zheng, W. Liang, M. Hada, M. Ehara, K. Toyota, R. Fukuda, J. Hasegawa, M. Ishida, T. Nakajima, Y. Honda, O. Kitao, H. Nakai, T. Vreven, K. Throssell, J. A. Montgomery, Jr., J. E. Peralta, F. Ogliaro, M. J. Bearpark, J. J. Heyd, E. N. Brothers, K. N. Kudin, V. N. Staroverov, T. A. Keith, R. Kobayashi, J. Normand, K. Raghavachari, A. P. Rendell, J. C. Burant, S. S. Iyengar, J. Tomasi, M. Cossi, J. M. Millam, M. Klene, C. Adamo, R. Cammi, J. W. Ochterski, R. L. Martin, K. Morokuma, O. Farkas, J. B. Foresman and D. J. Fox, Gaussian 16 Revision A.01, 2016 Search PubMed.
- M. Piccardo, E. Penocchio, C. Puzzarini, M. Biczysko and V. Barone, J. Phys. Chem. A, 2015, 119, 2058–2082 CrossRef CAS PubMed.
- E. Penocchio, M. Piccardo and V. Barone, J. Chem. Theory Comput., 2015, 11, 4689–4707 CrossRef CAS PubMed.
- G. Ceselin, V. Barone and N. Tasinato, J. Chem. Theory Comput., 2021, 17, 7290–7311 CrossRef CAS PubMed.
- I. Mills, in Molecular spectroscopy: modern research, ed. K. N. Rao and C. W. Matthews, Academic Press, 1972, pp. 115–140 Search PubMed.
- C. Puzzarini, J. F. Stanton and J. Gauss, Int. Rev. Phys. Chem., 2010, 29, 273–367 Search PubMed.
- A. D. Becke, Phys. Rev. A, 1988, 38, 3098–3100 CrossRef CAS PubMed.
- C. Lee, W. Yang and R. G. Parr, Phys. Rev. B: Condens. Matter Mater. Phys., 1988, 37, 785–789 CrossRef CAS PubMed.
- S. Grimme, J. Antony, S. Ehrlich and H. Krieg, J. Chem. Phys., 2010, 132, 154104 CrossRef PubMed.
- E. Papajak and D. G. Truhlar, J. Chem. Theory Comput., 2011, 7, 10–18 CrossRef CAS PubMed.
- C. Møller and M. S. Plesset, Phys. Rev., 1934, 46, 618–622 CrossRef.
- J. F. Stanton, J. Gauss, L. Cheng, M. E. Harding, D. A. Matthews and P. G. Szalay with contributions from A. A. Auer, R. J. Bartlett, U. Benedikt, C. Berger, D. E. Bernholdt, Y. J. Bomble, O. Christiansen, F. Engel, R. Faber, M. Heckert, O. Heun, M. Hilgenberg, C. Huber, T.-C. Jagau, D. Jonsson, J. Jusélius, T. Kirsch, K. Klein, W. J. Lauderdale, F. Lipparini, T. Metzroth, L. A. Mück, D. P. O’Neill, D. R. Price, E. Prochnow, C. Puzzarini, K. Ruud, F. Schiffmann, W. Schwalbach, C. Simmons, S. Stopkowicz, A. Tajti, J. Vázquez, F. Wang, J. D. Watts and the integral packages MOLECULE (J. Almlöf and P.R. Taylor), PROPS (P.R. Taylor), ABACUS (T. Helgaker, H.J. Aa. Jensen, P. Jørgensen, and J. Olsen), and ECP routines by A. V. Mitin and C. van Wüllen, CFOUR, a quantum chemical program package, 2016, see http://www.cfour.de Search PubMed.
- D. A. Matthews, L. Cheng, M. E. Harding, F. Lipparini, S. Stopkowicz, T.-C. Jagau, P. G. Szalay, J. Gauss and J. F. Stanton, J. Chem. Phys., 2020, 152, 214108 CrossRef CAS PubMed.
- O. Pirali, M. Goubet, V. Boudon, L. D'Accolti, C. Fusco and C. Annese, J. Mol. Spectrosc., 2017, 338, 6–14 CrossRef CAS.
- W. Łodyga, M. Kreglewski, P. Pracna and Š. Urban, J. Mol. Spectrosc., 2007, 243, 182–188 CrossRef.
- H. M. Pickett, J. Mol. Spectrosc., 1991, 148, 371–377 CrossRef CAS.
- C. M. Western, J. Quant. Spectrosc. Radiat. Transfer, 2017, 186, 221–242 CrossRef CAS.
- J. Kalvāns, Astrophys. J., 2021, 910, 54 CrossRef.
- S. Liu, J. Chem. Phys., 2014, 141, 194109 CrossRef PubMed.
Footnotes |
| † Electronic supplementary information (ESI) available: List of assigned transitions and relevant fit files (ASCII format). See DOI: https://doi.org/10.1039/d2cp04825f |
| ‡ Investigating reactive species on Earth often requires many measurements to obtain spectra with adequate signal-to-noise ratios for analysis which significantly increases the acquisition time. |
| This journal is © the Owner Societies 2023 |