
 Open Access Article
 This Open Access Article is licensed under a Creative Commons Attribution-Non Commercial 3.0 Unported Licence
Hierarchical analysis of the target-based scoring function modification for the example of selected class A GPCRs†
Katarzyna
Rzęsikowska
a,
Justyna
Kalinowska-Tłuścik
 *a and
Anna
Krawczuk
*b
*a and
Anna
Krawczuk
*b
aDepartment of Crystal Chemistry and Crystal Physics, Faculty of Chemistry, Jagiellonian University, Gronostajowa 2, 30-387 Kraków, Poland. E-mail: justyna.kalinowska-tluscik@uj.edu.pl
bInstitute of Inorganic Chemistry, Georg-August University, Tammannstrasse 4, 37077, Goettingen, Germany. E-mail: anna.krawczuk@uni-goettingen.de
First published on 16th December 2022
Abstract
Computational methods, especially molecular docking-based calculations, have become indispensable in the modern drug discovery workflow. The constantly increasing chemical space requires fast, robust but most of all highly predictive methods to search for new bioactive agents. Thus, the scoring function (SF) is a useful and broadly applied energy-based element of docking software, allowing quick and effective evaluation of a ligand's propensity to bind to selected protein targets. Despite many spectacular successes of molecular docking applications in virtual screening (VS), the obtained results are often far from ideal, leading to incorrect selection of hit molecules and poor pose prediction. In our study we focused on docking calculation for the selected class A G-protein coupled receptors (GPCRs), with experimentally determined 3D structures and a sufficient set of known ligands with affinity values reported in the ChEMBL database. Our goal is to investigate how much the energy-based scoring function for this particular target class changes when changing from the default to the re-estimated weighting scheme on the specified energy terms in the SF definition. Additionally, we want to verify if indeed more accurate results are obtained when considering different levels of the biological hierarchy, namely: the whole class A GPCRs, sub-subfamilies, or just the individual proteins while applying default or specifically designed weighting coefficients. The performed calculation and evaluation factor values suggest a significant improvement of docking results for the designed SF definition. This individual approach improves the accuracy of binding affinity prediction and active compound recognition. The designed scoring function for classes, sub-subfamilies, or proteins leads to a significant improvement of molecular docking performance, especially at the level of individual proteins. Our results show that to increase the efficiency and predictive power of molecular docking calculations applied in classical VS, the strategy based on the individual approach for scoring function definition for selected proteins should be considered.
1. Introduction
The application of commercially available or in-house specifically designed computational methods has become a routine step in the modern drug discovery process. Such an approach is especially helpful in faster potential hit identification, lead optimization, and reduction of the hit-to-drug timeline. This, as a consequence, can significantly increase the efficiency of a novel drug design. One of the commonly used techniques during this process is the virtual screening (VS) approach1 which enables scanning of large libraries of putative ligands and ranks active compounds ahead of inactive ones. The main outcome of this method is to select the maximum number of active ligands with a significantly high enrichment factor in the result set. For this reason, the use of an effective and highly predictive scoring function (SF) in the ligands poses evaluation is a key component in a molecular docking-based VS procedure.There are three main classes of SFs which are routinely applied in the available docking software: force field-based, knowledge-based and empirical.2 The first class includes those implemented in AutoDock,3 Dock,4 or Gold (GoldScore)5 and estimates binding free energy by calculating various energy terms, for example, electrostatic or van der Waals. The “knowledge-based” class stands on statistical analyses of protein–ligand crystal structure complexes and is used in Gold (ASP). The last type, “empirical”, relies on binding energies calculated as a weighted sum of every hydrophobic contact and hydrogen bond. The Piecewise Linear Potential (PLP)6 and ChemScore7 functions along with the scoring function found in Glide can be included in this class. The linear combination of the two or more SF components from the same or different classes (so-called hybrid scoring function) is a recognized strategy,2,8 and demonstrates the better performance of docking calculations with comparison to single SF use.9–11 Recently, with the highly developing artificial intelligence application in drug discovery, the machine-learning-based class of SF was additionally introduced.12 Despite the progress in scoring function methodologies, the accurate prediction of protein–ligand binding affinities remains a challenge. Benchmark studies have shown that the calculated binding scores display a poor correlation with experimental affinity.13–15 This can result in a high percentage of false-positive compounds in the hit list13,15 and therefore, increase the costs of the drug design process. The above mentioned studies14,16 revealed another major outcome: the tested scoring functions are not universal enough, thus the performance of the entire benchmark may not be consistent with the performance of individual targets. In other words, when the given type of protein has only a few representatives in the investigated group, there is a possibility that the obtained results for the whole set do not match the outcome acquired for these several proteins.
In the present article, we focus on class A of the G protein-coupled receptor (GPCR) family, as a selected protein family with a well-established druggability profile. GPCRs belong to one of the largest transmembrane receptor families that activate internal signal transduction pathways. They are activated by various agents, for example, ions, neurotransmitters, odorants, hormones, lipids, peptides, or proteins.17 Due to their abundance in the human body and involvement in the etiology of many diseases, they are the target of ca. 30% of all marketed drugs.18 However, in most benchmark studies, they are not the primary target of research, and even if they are considered, only a few representatives are included in the study. While such sets can be useful to test the overall performance of the molecular docking program, they may fail in the case of more specific proteins. The GPCRs are interesting targets in terms of molecular docking studies due to the deep binding pocket which almost completely encloses the small molecule ligands. Moreover, the percentage of sequence identity for the binding pocket region for some receptors may reach up to 88% (e.g. M2 and M4 receptors based on the similarity matrix generated using GPCRdb online server19). For the mentioned reasons, the results obtained from benchmark studies where GPCRs are not the primary target, may not apply for those proteins. Although several docking experiments were a successful strategy in the drug design,20 the molecular docking results may be often misleading and questionable, despite a high score.21,22 The selected AutoDock software is not the top performing tool. However, exhaustive research work on pose prediction for the variety of selected protein–ligand complexes available in the PDB, screened additionally against bioactivity data, shows that good pose prediction does not always correlate with good scoring, irrespective of the software used.23 Moreover, the comparative studies indicate that none of the docking tools truly outperforms the others and none of the scoring functions is universal to correctly predict and/or evaluate the ligand's pose for all types of molecules and protein families.23,24 In view of observations related to an irregularity in the performance of scoring functions across various kinds of protein targets, we aim to answer the question of whether the scoring function in AutoDock 4.2 should be applied in the default mode or shall it be re-defined for a particular family/class/protein hierarchy level, on the example of class A GPCRs.
In recent years, more than 50 different docking software packages have been developed. Although they differ regarding scoring function types and conformational space search algorithms, the limitations described in the previous section have not been overcome to date. Over the last 20 years, more than 30% of published articles related to docking studies have used AutoDock as the docking software.25 This free software (its version AutoDock4, available under the GNU General Public License) is widely used with approximately 10![[thin space (1/6-em)]](https://www.rsc.org/images/entities/char_2009.gif) 000 citations since its release in 2009. AutoDock4 was successfully applied in the discovery of several potent inhibitors binding to peptides, proteins, or genes.26–28 The used semi-empirical scoring function is based on the AMBER force field and consists of five weighted energy terms: dispersion/repulsion (a Lenard-Jones 6/12 potential), hydrogen bond (directional hydrogen bond components; based on 10/12 potential), electrostatic (Coulombic potential), desolvation (based on the volume of surrounding atoms, which shelter the given atom from solvent) and entropic term related to the number of freely rotatable bonds in the ligand.29 In view of observations related to an irregularity in the performance of scoring functions across various kinds of protein targets, we aim to answer the question of whether the scoring functions applied in AutoDock 4.2 should be considered universal in the default mode or should it be re-defined for a particular family/class/protein hierarchy level.
000 citations since its release in 2009. AutoDock4 was successfully applied in the discovery of several potent inhibitors binding to peptides, proteins, or genes.26–28 The used semi-empirical scoring function is based on the AMBER force field and consists of five weighted energy terms: dispersion/repulsion (a Lenard-Jones 6/12 potential), hydrogen bond (directional hydrogen bond components; based on 10/12 potential), electrostatic (Coulombic potential), desolvation (based on the volume of surrounding atoms, which shelter the given atom from solvent) and entropic term related to the number of freely rotatable bonds in the ligand.29 In view of observations related to an irregularity in the performance of scoring functions across various kinds of protein targets, we aim to answer the question of whether the scoring functions applied in AutoDock 4.2 should be considered universal in the default mode or should it be re-defined for a particular family/class/protein hierarchy level.
2. Methods
2.1. Preparation of ligands
For selected class A GPCRs, the database of ligands was prepared based on the ChEMBL2430 database search. The result was downloaded in the SMILES format. Few restrictions of the search were implemented. Ligands without the given inhibitor constant (Ki) and with more than 32 rotational bonds were excluded as a consequence of the limitation in AutoDock software. Additionally, solvents and ions were removed from the ligand's SMILES representation. The prepared set of ligands was then divided into five baskets based on Ki values, namely• B1 with Ki ≤ 1 nM.
• B2 with Ki in range (1; 10 > nM.
• B3 with Ki in range (10; 100 > nM.
• B123 with Ki ≤ 100 nM.
• B45 with Ki > 100 nM.
The molecules for which the reported Ki values varied significantly and did not allow a straight classification to an inactive basket (B45) or one of the active baskets (B1, B2, or B3) were rejected. Ligands in the basket-divided set were converted to the PDB format with Open Babel software31 and prepared for the docking procedure, using the prepare_ligand4.py script (AutoDock tools3). Three sets (training, testing1, and testing2) were created using the aforementioned processed database. The training set was utilized to generate new weights for SF in AutoDock software and testing1 and testing2 sets to verify the designed weighting accuracy. As the quantity of ligands varies for individual receptors, to maximize the number of examined receptors, the B1, B2, and B3 baskets contained four ligands and the B45 baskets twenty-four molecules. The B123 basket was established by merging all three active ones (B1, B2, and B3). For each set (training, testing1, and testing2) molecules were selected randomly and without repetition to ensure the diversity of ligands. The ChEMBL codes of selected ligands and their distribution within baskets and the three mentioned sets are shown in Table S1 in the ESI† file.
2.2. Preparation of receptors
For each selected Class A receptor, we fetched from the Protein Data Bank32 the structural data of human proteins with a resolution upper limit equal to 3.5 Å. Combining this requirement with ligands availability, the set used in the study consists of 24 protein structures. The PDB IDs of the receptor structures are given in Table S2 of the ESI† file. The fetched protein structures were pre-processed using the Protein Preparation Wizard from Schrödinger Suite33 and initially prepared for docking procedures by ligands and water molecule removal. The selected target structures were inspected for steric clashes and an appropriate ionization state in pH 7.4. The positions of all hydrogen atoms were calculated and added to each structure. Additionally, all structures were aligned to B2-adrenergic receptor coordinates (PDB ID: 2RH1) to facilitate the docking calculation and analysis of obtained results. Selected proteins were finally prepared for docking calculations using the prepare_receptor4.py script (AutoDock tools3).2.3. Molecular docking
All docking calculations were carried out using AutoDock4.23 software using the Lamarckian Genetic Algorithm. For each receptor, a calculation was conducted with the default parameters except for the number of genetic algorithm runs, which was set to 50 instead of 10. The centre position, number of points, and the length of spacing in the grid file were identical for each protein. The coordinates of the centre were determined based on the positioning of native ligands, and the grid was generated using 126 × 126 × 126 points with 0.208 Å spacing. In all docking analyses, the energy components for poses with the lowest energy were taken into further consideration.2.4. Genetic algorithm
The training set was used to calculate new weights for five energy components applied in AutoDock4.2, with the use of an in-house script based on the genetic algorithm approach and the optimal coefficient search. The final solutions of the calculated weights were selected from ten separate runs of the program (with random initial seed) each of which derived results from a fixed number of generations (3000) with a population size of 20. The testing1 and testing2 sets were used to examine the performance of new weights to confirm or deny the outcomes received from the training set.2.5. Evaluation of the scoring system
Since ligands in the initial sets were originally classified into five baskets based on binding affinity values, the top-scored poses for each ligand have been also classified into one of the baskets, to compare the performance of molecular docking calculations. The AutoDock final score is expressed as binding energy in kcal mol−1, and the obtained energy can be converted into Ki value based on the following equation:34| Ki = e(ΔG/RT) | (1) |
This approach was applied in our study to convert the calculated energy (obtained based on the designed new weights) into Ki, and subsequently, assign the top-scored poses of each ligand into the corresponding basket. As the ligands in our study were divided and characterized by the Ki range baskets, and not by the exact and individual affinity values, the obtained new SF (with the new weighting scheme applied) as well as the original SF (with the default weights) could not be evaluated applying the commonly used ‘Scoring power’ method.13 For that reason, the variation of the enrichment factor35 (EF) was used, in which instead of the fraction of the database, the particular basket was tested:
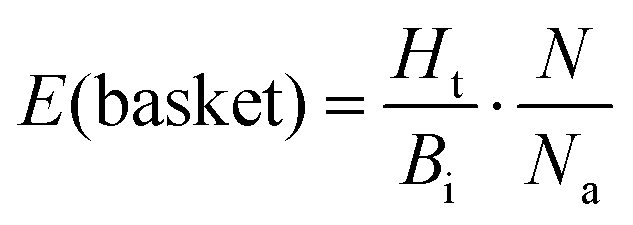 | (2) |
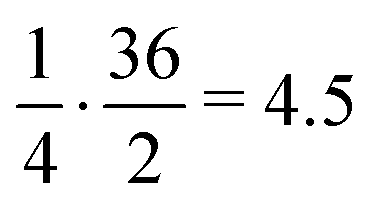 . Apart from the EF metric, two more parameters were used to evaluate the performance of new SF – the success rate calculated as the percentage of adequately assigned ligands in a basket
 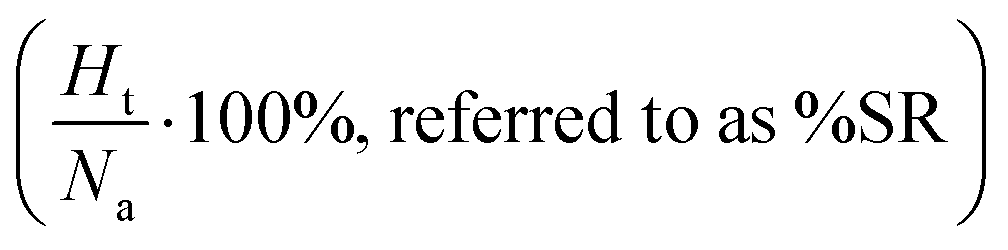 and the percentage of correctly classified ligands in the initial basket
  .
.
3. Results and discussion
To investigate the influence and performance of various weighting schemes on the scoring function results, all the selected ligands were docked to corresponding targets. For each selected receptor, 108 ligands were docked (36 ligands per training, testing1, and testing2 sets). To answer the question of whether the applied scoring functions should be specifically defined for each of the studied targets, the initial protein set was analyzed at three levels of biological hierarchy:36 the whole family (class A GPCRS), four sub-subfamilies (serotonin, opioid, dopamine, and muscarinic acetylcholine receptors) and individual proteins (Fig. 1).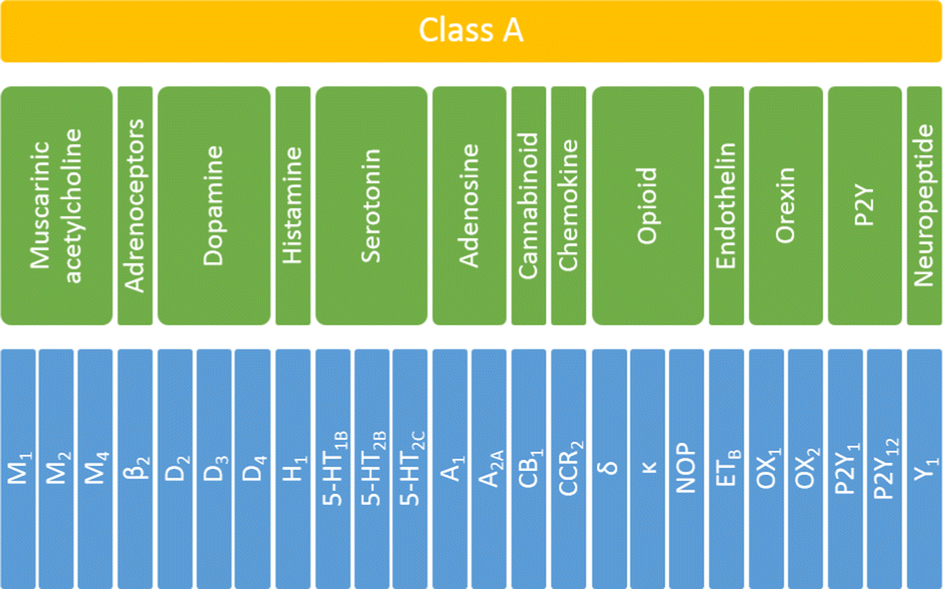 | ||
| Fig. 1 The biological hierarchy of GPCRs selected for this study. The family level is highlighted in yellow, sub-subfamily level in green, and protein in blue. | ||
In total 24 different proteins were examined which belonged to thirteen various sub-subfamilies of the class A GPCRs. Only sub-subfamilies containing at least three experimentally determined structural representatives were taken under consideration. Thus, from the set shown in Fig. 1, seventeen groups were analyzed: whole (family level), serotonin, opioid, dopamine, and muscarinic acetylcholine receptors (sub-subfamily level) and 5-HT1B, 5-HT2B, 5-HT2C, D2, D3, D4, M1, M2, M4, δ, κ and NOP receptors (protein level). For each ligand–protein complex, five energy components were extracted from docking results, using a script from the AutoDock tools. Data for sub-subfamily and family levels were obtained by combining the outcomes for relevant individual proteins.
3.1. The default weighting scheme results
The EF values for the training set are shown in Table 1. The scores of other evaluation parameters (%SR and %A) are shown in Table S3 in the ESI† file. Comparison of the data in Table 1 shows a substantial difference in the EF value for the B1 basket, calculated for considered GPCRs at the family level (class A), with respect to results obtained for each receptor. For discussed proteins (50% of investigated targets), the value of EF is equal to 0.00, whereas for all analyzed receptors it reaches a 1.10 numerical score. Thus, the assumption can be made that the recognized ligands were not evenly distributed between proteins but assigned either to one or few structurally similar receptors instead. The results analysis for baskets B2 and B3 leads to a similar conclusion. The calculated values for these baskets are in a range from 0 to 3.6. Additionally, the comparison of EF values for three receptors belonging to the same sub-subfamily revealed high discrepancies also within the sub-subfamily. For example, the EF value in the B2 basket for the δ receptor is 3.60, whereas for the NOP receptor it is equal to 0.00. These observations suggest that when differentiating very active (B1), medium active (B2) and weakly active (B3) compounds, one should consider applying different weights for different, individually considered targets. The %A and %SR values demonstrate a similar tendency. The obtained %A scores for some proteins are very high, and reach even 100% (for example, M2R in the B3 basket) which means that all initial ligands were assigned to this basket. However, there are cases within the same sub-subfamily where the obtained %A is four times lower (i.e. %A = 25% for the M1R, which belongs to the same sub-subfamily as the above-mentioned M2R). The average values for 12 analyzed proteins are in a reasonable range, and similar to the scores obtained for the whole family (approximately 27% and 40% for 12 proteins and 23% and 38% for the whole family, calculated for B2 and B3, respectively). The problem arises when the level of success rate (%SR) is considered. The average values are notably low (ca. 13% for both B2 and B3 baskets). It means that only 13% of all assigned compounds reached the calculated Ki in the range of 1 nM to 10 nM (for B2). The highest score is obtained for the δ receptor in the B2 basket and is equal to 40%. However, it is a single case where such a high score was obtained, and for most investigated proteins it was in the range of 0 to 20%. Although the primary goal of virtual screening (VS) is to identify possible hits, the more compounds are selected for experimental evaluation, the higher the cost of finding a new promising hit is. In other words, the desired outcome of VS calculations is the set of compounds characterized by both: a very high %A and %SR. The results of molecular docking with the default SF do not fulfil this criterion. The results of the three-evaluation metrics obtained for B123 and B45 were slightly better than for the three separated active baskets (B1, B2, and B3). The calculated EF values for basket B123 vary between sub-subfamilies, though the occurring discrepancies are not as significant as for baskets B1, B2, and B3. The EF values are approximately equal to 1, except for B123 for M4R, where it is 1.71. The average %A and %SR values are also significantly higher than for active baskets (63.89% and 44.44%, 36.75% and 71.64%, for B123 and B45, respectively). The obtained results suggest that the original weights are trustworthy enough to distinguish active and inactive compounds and no differentiation between family or sub-subfamily is necessary.| Examined receptor group | EF for default weights | EF for new weights | ||||||||
|---|---|---|---|---|---|---|---|---|---|---|
| B1 | B2 | B3 | B123 | B45 | B1 | B2 | B3 | B123 | B45 | |
| WHOLE | 1.11 | 1.01 | 1.07 | 1.10 | 1.09 | 2.92 | 1.69 | 2.45 | 1.14 | 1.12 |
| Serotonin | 0.00 | 1.29 | 1.17 | 0.98 | 0.99 | 3.60 | 2.70 | 3.00 | 1.33 | 1.11 |
| 5-HT1B | 0.00 | 1.42 | 1.50 | 1.11 | 1.17 | 3.60 | 3.00 | 3.00 | 1.83 | 1.42 |
| 5-HT2B | 0.00 | 0.00 | 1.29 | 1.00 | 1.00 | 4.50 | 3.00 | 3.00 | 1.64 | 1.14 |
| 5-HT2C | 0.00 | 1.50 | 0.90 | 0.75 | 0.90 | 3.00 | 9.00 | 3.00 | 1.50 | 1.16 |
| Dopamine | 0.00 | 0.96 | 0.64 | 1.07 | 1.07 | 2.70 | 2.57 | 2.00 | 1.36 | 1.13 |
| D2 | 0.00 | 1.29 | 0.00 | 1.00 | 1.00 | 3.00 | 3.00 | 4.50 | 1.65 | 1.41 |
| D3 | 0.00 | 1.50 | 0.56 | 1.09 | 1.07 | 4.50 | 4.50 | 4.50 | 1.93 | 1.30 |
| D4 | 0.00 | 0.00 | 1.13 | 1.13 | 1.13 | 6.00 | 3.00 | 4.50 | 1.71 | 1.23 |
| Muscarinic | 0.00 | 1.50 | 1.66 | 1.26 | 1.15 | 1.29 | 1.42 | 1.80 | 1.38 | 1.45 |
| M1 | 0.00 | 1.29 | 0.90 | 1.06 | 1.03 | 2.25 | 6.00 | 2.25 | 1.38 | 1.50 |
| M2 | 0.00 | 2.57 | 1.89 | 1.15 | 1.20 | 1.50 | 4.50 | 3.86 | 1.44 | 1.50 |
| M4 | 0.00 | 0.00 | 2.00 | 1.71 | 1.23 | 3.60 | 4.50 | 9.00 | 1.91 | 1.20 |
| Opioid | 0.00 | 1.50 | 1.17 | 1.07 | 1.06 | 1.64 | 4.50 | 2.57 | 1.36 | 1.11 |
| Delta | 0.00 | 3.60 | 1.20 | 1.00 | 1.00 | 3.60 | 4.50 | 4.50 | 1.91 | 1.20 |
| Kappa | 0.00 | 0.82 | 0.82 | 1.00 | 1.00 | 1.80 | 4.50 | 3.00 | 1.41 | 1.18 |
| NOP | 0.00 | 0.00 | 1.35 | 1.23 | 1.18 | 2.70 | 4.50 | 9.00 | 1.50 | 1.13 |
3.2. New weighting schemes
To investigate whether the individual weights for the energy components in a scoring function may influence the performance of molecular docking calculations, new weights were calculated for all selected twelve proteins as well as four sub-subfamilies and whole class A, separately. New weighting coefficients were computed in two rounds: (1) for baskets B1, B2, and B3 and (2) for B123 and B45. The second round was introduced due to different observations of EF values for the default weights (see Table 1). The performed calculations, however, are based on parameter training, using limited-sized sets, hence few restrictions were implemented. To avoid overtraining of the obtained SFs, the number of recognized compounds belonging to the B123 basket was set to a minimum of 50% of all molecules in that basket (%A min. 50%). Such an approach ensured that the scoring function is not too specific and hopefully will be transferable to ligands that are structurally different from those in the training set (testing1 and testing2 sets). As shown in Table 1, the calculated values of EF for new parameters are, in most cases, higher than the corresponding ones obtained with the default weights. The only three exceptions are observed in the B45 and B2 baskets for muscarinic acetylcholine sub-subfamily. Usually, the purpose of VS is to identify the active ligands and not inactive compounds. Thus, only value for the muscarinic sub-subfamily worsened after applying newly designed SF. The differences in EF values calculated for the new and the default weights are more noticeable for baskets B1, B2, and B3 than B123 and B45. To examine the impact of new weights, the ratio of EF for new and original SF was calculated. The values above 1.00 indicate that the new SF performed better than the original one. For the cases where the ratio could not be calculated as EF for original SF was equal to 0, only EF for new SF was considered. As it can be shown in the example of baskets B1, B2, and B3 (Fig. 2), the use of the new, specifically designed weights significantly improved the performance of the scoring function.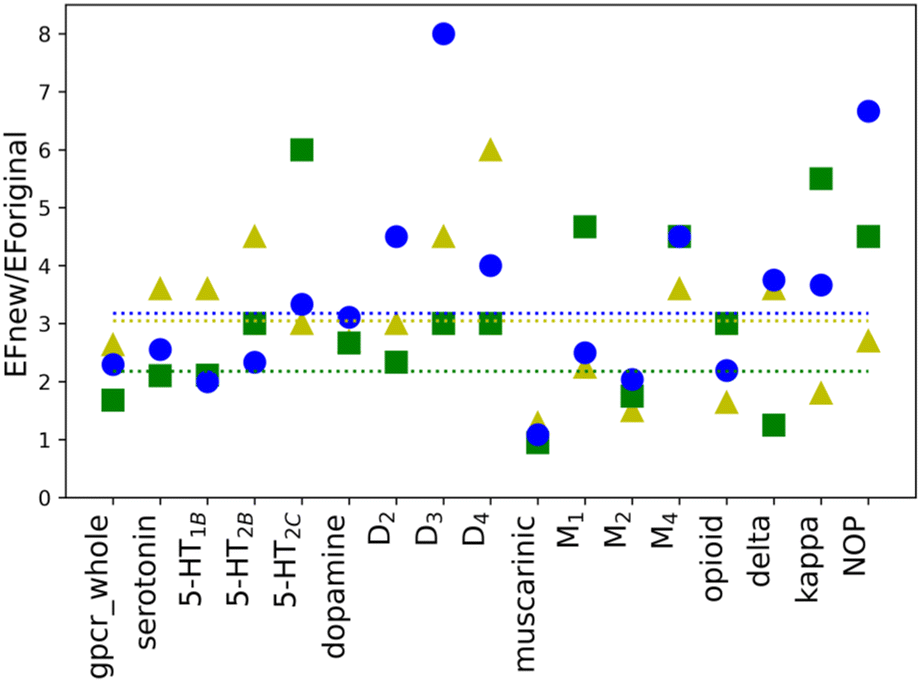 | ||
| Fig. 2 The calculated ratios EFnew/EForiginal for B1 (yellow triangles), B2 (green squares), and B3 (blue circles) baskets. The average values for each basket are shown as dotted lines colored correspondingly to the applied basket coloring. For cases where EForiginal was equal to 0 only EFnew for SF was considered. | ||
The initial purpose of this study was to elucidate if the improvement of the molecular docking performance requires that the scoring function is individually designed for each class, family, or target, separately. From EF values for the original weights, no definitive conclusions could be drawn. However, data analysis of results for baskets B1, B2, and B3 obtained for the training set with new weights indicated several interesting conclusions (Fig. 2). First of all, the average ratio EFnew/EForiginal is 3. The most significant difference can be identified for receptor D3R, basket B3, where the new EF is eight times higher than the corresponding one obtained for the original SF. The dopamine receptors (D2, D3, and D4) show one of the highest EF ratios, i.e. for D3R it is 4.50, 3.00, and 8.00 for B1, B2, and B3 baskets, respectively. The remaining receptors in the dopamine sub-subfamily also have, in most cases, evaluated rates greater than or equal to the average value. What is more, the new EF values for D2, D3, and D4 receptors are higher than the ones for the dopamine sub-subfamily (Fig. 3). This trend is also noticeable for other sub-subfamilies, although it is not as evident as in the above-mentioned example. For almost all proteins, EF values for the individual receptors are greater than or equal to EF for corresponding sub-subfamilies. Only in the case of the serotonin receptor (5-HT2CR) for the most active ligands in the B1 basket, the EF score is lower than for sub-subfamily. The observed tendency is not observed when shifting from class A to sub-subfamily. For example, the muscarinic acetylcholine receptor sub-subfamily has lower values in all three baskets (1.29, 1.42, and 1.80) compared to class A (2.92, 1.69, and 2.45 for B1, B2, and B3, respectively), whereas the serotonin (3.60, 2.70 and 3.00) receptor sub-subfamilies perform better than class A for each basket.
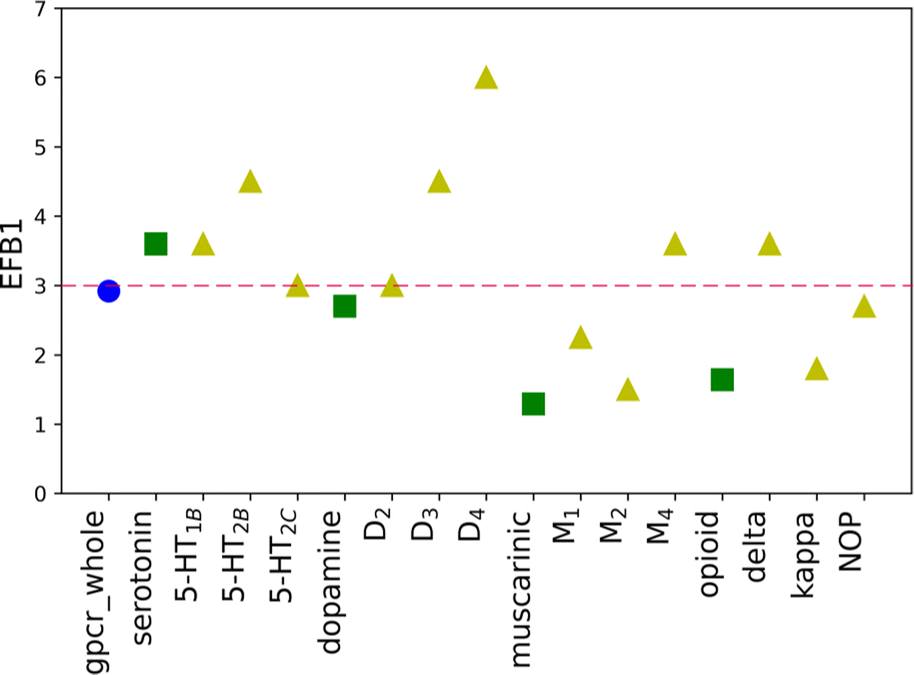 | ||
| Fig. 3 The EF scores for the new SF for B1 basket, divided into three evaluated levels of biological hierarchy: family (blue circle), sub-subfamily (green squares), and individual protein (yellow triangles). The average EFnew value for basket B1 is shown as a dashed red line. | ||
A similar analysis can be carried out considering the differentiation between active (B123) and inactive (B45) molecules. Only in two cases, the EF values for new weights appeared to be lower than the corresponding ones for the default weights (for M4 and NOP receptors in the inactive basket). Receiving inferior values is not an optimal result. However, most scientists use docking to search for active, not inactive compounds, and therefore, the obtained result is an acceptable outcome. The values obtained for B123 reveal the significant influence of the uniquely designed scoring function. While for original weights, the EF values range from 0.75 to 1.71 with average values equal to 1.10, for new SF the minimum value is higher than the average for original SF (1.14 for the whole GPCR family). The transition from family to sub-subfamily as well as from sub-subfamily to selected receptor significantly improves the VS calculations. For example, for the muscarinic acetylcholine receptors sub-subfamily the EF is equal to 1.38 and for the receptors belonging to this sub-subfamily is 1.38, 1.44, and 1.91 for M1, M2, and M4 receptors, respectively. Apart from an increase in the EF scores, the application of the new weights can also influence the values of %A and %SR. For all the groups in the B1 basket, the new %A is at least 7%, whereas, for the original weights, values not equal to 0 are obtained only for the whole class A. The average %A in B1 is equal to 54.17% and the average scores for the other baskets remain at the same satisfactory level. At the same time, the average values of %SR significantly increase from 0.00%, 12.95%, 12.53%, 36.75% and 71.64% to 37.08%, 50.00%, 50.10%, 55.05% and 85.30% for B1, B2, B3, B123 and B45 baskets, respectively. In a few cases, the %SR is even equal to 100% (e.g. B3 basket for M4 receptor). Considering initial restrictions on ligands abundance in the resulting set, the obtained values are very promising towards new potential hit identification.
3.3. Testing sets
To ensure that the performance of calculated scoring functions can be reproduced, two different testing sets were applied (testing1, testing2). The number of compounds and docking calculations parameters were the same as for the training set. The resulting values (for original weights) for the testing sets are comparable to the ones in the training sets (see Tables S3, S4, and S5 in the ESI† file). For most receptors, the EF scores for the most active ligands in the B1 basket are equal to 0.00, similar to the training set. The most significant difference between those three mentioned sets is noticeable for the maximum EF value. For the training set, it is equal to 3.60 (for δR in B2 basket), while for the testing set it is obtained for muscarinic acetylcholine receptors (4.5 for M1R in B2 for the testing1 set and 9.0 M4R in B1 for the testing2 set). The highest value for the training set is 2.5 times lower than for testing2. The value obtained for M4R in B1 for the testing2 set is the highest possible and indicates that all ligands assigned to the basket B1 correspond to Ki not greater than 1 nM. The results confirm that molecular docking calculations carried out with AutoDock software are transferable and consistent for various databases of ligands. However, the EF values for new SF are only slightly worse. For 9 cases in testing1 and 11 in testing2 sets, the obtained scores for new weights are lower than for the original SF. Despite slightly worsened EF values for new SF, the trends observed for the training set are still noticeable.The average EF for all active baskets (B1, B2, and B3) are 2.64 and 3.03 for testing1 and testing2, respectively. Like in the training set, the improvement related to designing individual weights for the class, sub-subfamily or receptor is explicitly visible for the basket B123 (Fig. 4). In some cases, the new EF values are even around 2.5 times higher for receptors than for adequate sub-subfamily (e.g. opioid sub-subfamily in the testing1 set or dopamine sub-subfamily in the testing2 set, see Tables S4 and S5 in the ESI† file). Overall, the results obtained for testing sets confirm that individually designed SF weights performed at the same level for all three examined sets.
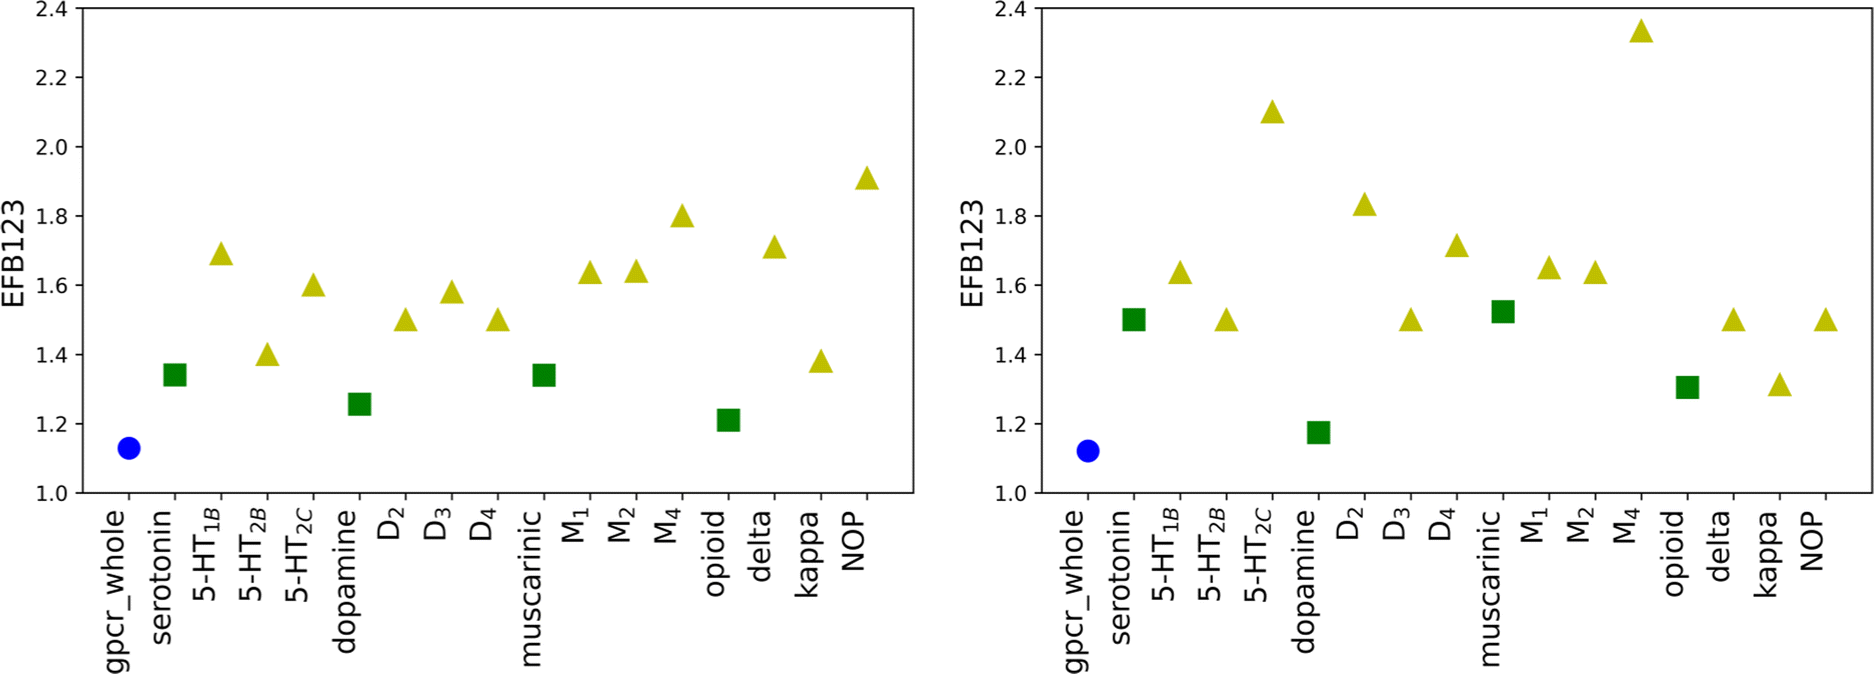 | ||
| Fig. 4 The distribution of EF values calculated for new SF for B123 in testing1 (left) and testing2 (right) sets divided into three levels of biological hierarchy: family (blue circles), sub-subfamily (green squares), and protein (yellow triangles). | ||
4. Conclusions
In this research work, the performance of individually designed scoring functions for class A GPCRs, four sub-subfamilies, and twelve receptors was compared with the original scoring function applied as default in AutoDock4.2. Calculations were performed for a set of 108 ligand–protein complexes, dividing ligands for each receptor into three sets: training, testing1, and testing2. Protein structures were fetched from the Protein Data Bank and ligand–protein binding affinity values were obtained from the ChEMBL database. Only the top-ranked pose per complex was examined.The investigation presented here is highly relevant to the field of computer-aided drug discovery. It is because there is no meticulous research to determine the performance of the scoring function on different kinds of protein targets, whereas most virtual screening calculations are carried out for one or a few specific targets. In this study, we focused on twelve proteins of class A GPCRs which belong to four different sub-subfamilies. To ensure the diversity of the ensemble, another 12 receptors from the same class but different sub-subfamilies were considered. Newly designed scoring function coefficients were calculated for each selected target as well as sub-subfamily and whole class A. The comparison of the calculated evaluation factors: EF, %A, and %SR for all obtained data, showed a significant improvement in the docking results comparing to the default SF settings. In particular, the accuracy of binding affinity prediction tends to be increased when individually designed weighting coefficients are applied. Additionally, the active compounds recognition success rate increases by nearly a factor of 2. The most important finding is that the design of a specific scoring function for class, sub-subfamily, or protein (three different levels of biological hierarchy) leads to a significant improvement in molecular docking performance.
Notwithstanding the promising results of this manuscript, we also see the need to further improve and expand our research. In the future studies, different activation states of the receptors should be still taken into consideration and carefully evaluated as it may significantly influence the shape and size but also electrostatic potential of the active binding site. Additionally, prediction of ligands binding to allosteric sites of the GPCRs remains a challenge but could be an interesting direction of our study. Both above-mentioned effects could affect the definition of the scoring schemes. Despite these aspects, the presented results clearly show that the individual approach for scoring function calculation in virtual screening strategy can lead to a higher probability of hit molecule identification. Thus, considering the chosen receptor–ligand system, the estimation of weights for the scoring function would be beneficial before VS calculations. Even though this approach requires increased computational time, the calculations of new and individually designed weights for the force field scoring function can decrease the number of failures and in consequence, reduce the costs of identifying and examining the lead molecule.
Author contributions
The manuscript was written through the contributions of all authors. All authors have approved the final version of the manuscript.Conflicts of interest
There are no conflicts to declare.Acknowledgements
This research was supported in part by PL-Grid Infrastructure.References
- I. Muegge and S. Oloff, Drug Discovery Today: Technol., 2006, 3, 405–411 CrossRef.
- X. Y. Meng, H. X. Zhang, M. Mezei and M. Cui, Curr. Comput.-Aided Drug Des., 2011, 7, 146–157 CrossRef CAS PubMed.
- G. M. Morris, H. Ruth, W. Lindstrom, M. F. Sanner, R. K. Belew, D. S. Goodsell and A. J. Olson, J. Comput. Chem., 2009, 30, 2785–2791 CrossRef CAS PubMed.
- M. M. Mysinger and B. K. Shoichet, J. Chem. Inf. Model., 2010, 50, 1561–1573 CrossRef CAS PubMed.
- G. Jones, P. Willett, R. C. Glen, A. R. Leach and R. Taylor, J. Mol. Biol., 1997, 267, 727–748 CrossRef CAS PubMed.
- O. Korb, T. Stützle and T. E. Exner, J. Chem. Inf. Model., 2009, 49, 84–96 CrossRef CAS PubMed.
- M. D. Eldridge, C. W. Murray, T. R. Auton, G. V. Paolini and R. P. Mee, J. Comput.-Aided Mol. Des., 1997, 11, 425–445 CrossRef CAS PubMed.
- E. Management Association, I. R., Pharmaceutical Sciences: Breakthroughs in Research and Practice, IGI Global, 2017.
- V. Y. Tanchuk, V. O. Tanin, A. I. Vovk and G. Poda, Chem. Biol. Drug Des., 2016, 87, 618–625 CrossRef CAS PubMed.
- M. Baek, W. H. Shin, H. W. Chung and C. Seok, J. Comput.-Aided Mol. Des., 2017, 31, 653–666 CrossRef CAS PubMed.
- S. Yin, L. Biedermannova, J. Vondrasek and N. V. Dokholyan, J. Chem. Inf. Model., 2008, 48, 1656–1662 CrossRef CAS PubMed.
- J. Liu and R. Wang, J. Chem. Inf. Model., 2015, 55, 475–482 CrossRef CAS PubMed.
- Y. Li, Z. Liu, J. Li, L. Han, J. Liu, Z. Zhao and R. Wang, J. Chem. Inf. Model., 2014, 54, 1700–1716 CrossRef CAS PubMed.
- Z. Wang, H. Sun, X. Yao, D. Li, L. Xu, Y. Li, S. Tian and T. Hou, Phys. Chem. Chem. Phys., 2016, 18, 12964–12975 RSC.
- N. S. Pagadala, K. Syed and J. Tuszynski, Biophys. Rev., 2017, 9, 91–102 CrossRef CAS PubMed.
- G. L. Warren, C. W. Andrews, A. M. Capelli, B. Clarke, J. LaLonde, M. H. Lambert, M. Lindvall, N. Nevins, S. F. Semus, S. Senger, G. Tedesco, I. D. Wall, J. M. Woolven, C. E. Peishoff and M. S. Head, J. Med. Chem., 2006, 49, 5912–5931 CrossRef CAS PubMed.
- S. Basith, M. Cui, S. J. Macalino, J. Park, N. A. Clavio, S. Kang and S. Choi, Front. Pharmacol., 2018, 9, 1–26 CrossRef PubMed.
- A. S. Hauser, M. M. Attwood, M. Rask-andersen and H. B. Schiöth, Nat. Rev. Drug Discovery, 2019, 16, 829–842 CrossRef PubMed.
- A. J. Kooistra, S. Mordalski, G. Pándy-Szekeres, M. Esguerra, A. Mamyrbekov, C. Munk, G. M. Keseru and D. E. Gloriam, Nucleic Acids Res., 2021, 49, D335–D343 CrossRef CAS PubMed.
- M. A. Phillips, M. A. Stewart, D. L. Woodling and Z.-R. Xie, Has Molecular Docking Ever Brought us a Medicine?, IntechOpen, Rijeka, 2018 Search PubMed.
- Y.-C. Chen, Trends Pharmacol. Sci., 2015, 36, 78–95 CrossRef PubMed.
- J. P. Cerón-Carrasco, ChemMedChem, 2022, 17, e202200278 Search PubMed.
- D. Plewczynski, M. Łazniewski, R. Augustyniak and K. Ginalski, J. Comput. Chem., 2011, 32, 742–755 CrossRef CAS PubMed.
- N. Moitessier, P. Englebienne, D. Lee, J. Lawandi and C. R. Corbeil, Br. J. Pharmacol., 2008, 153, S7–S26 CrossRef CAS PubMed.
- M. Gupta, R. Sharma and A. Kumar, Comput. Biol. Chem., 2018, 76, 210–217 CrossRef CAS PubMed.
- A. A. Almaqwashi, W. Zhou, M. N. Naufer, I. A. Riddell, Ö. H. Yilmaz, S. J. Lippard and M. C. Williams, J. Am. Chem. Soc., 2019, 141, 1537–1545 CrossRef CAS PubMed.
- S. Corre, N. Tardif, N. Mouchet, H. M. Leclair, L. Boussemart, A. Gautron, L. Bachelot, A. Perrot, A. Soshilov, A. Rogiers, F. Rambow, E. Dumontet, K. Tarte, A. Bessede, G. J. Guillemin, J. C. Marine, M. S. Denison, D. Gilot and M. D. Galibert, Nat. Commun., 2018, 9, 4775 CrossRef PubMed.
- P. J. Salveson, S. Haerianardakani, A. Thuy-Boun, S. Yoo, A. G. Kreutzer, B. Demeler and J. S. Nowick, J. Am. Chem. Soc., 2018, 140, 11745–11754 CrossRef CAS PubMed.
- G. M. Morris, D. S. Goodsell, R. Huey, W. E. Hart, S. Holliday, R. Belew and A. J. Olson, Users Guide AutoDock: Automated Docking of Flexible Ligands to Receptors, 2010.
- A. Gaulton, A. Hersey, M. L. Nowotka, A. Patricia Bento, J. Chambers, D. Mendez, P. Mutowo, F. Atkinson, L. J. Bellis, E. Cibrian-Uhalte, M. Davies, N. Dedman, A. Karlsson, M. P. Magarinos, J. P. Overington, G. Papadatos, I. Smit and A. R. Leach, Nucleic Acids Res., 2017, 45, D945–D954 CrossRef CAS PubMed.
- N. M. O’Boyle, M. Banck, C. A. James, C. Morley, T. Vandermeersch and G. R. Hutchison, J. Cheminf., 2011, 3, 1–14 Search PubMed.
- H. M. Berman, T. Battistuz, T. N. Bhat, W. F. Bluhm, P. E. Bourne, K. Burkhardt, Z. Feng, G. L. Gilliland, L. Iype, S. Jain, P. Fagan, J. Marvin, D. Padilla, V. Ravichandran, B. Schneider, N. Thanki, H. Weissig, J. D. Westbrook and C. Zardecki, Acta Crystallogr., Sect. D: Biol. Crystallogr., 2002, 58, 899–907 CrossRef PubMed.
- Maestro, Schrödinger Release 2016-4, LLC, New York, NY and USA, 2016 Search PubMed.
- P. R. Deepa, S. Vandhana, S. Muthukumaran, V. Umashankar, U. Jayanthi and S. Krishnakumar, J. Ocul. Biol. Dis. Inf., 2010, 3, 117–128 CrossRef CAS PubMed.
- B. Q. Wei, W. A. Baase, L. H. Weaver, B. W. Matthews and B. K. Shoichet, J. Mol. Biol., 2002, 322, 339–355 CrossRef CAS PubMed.
- Z. L. Peng, J. Y Yang and X. Chen, BMC Bioinform., 2010, 11, 420 CrossRef PubMed.
Footnote |
| † Electronic supplementary information (ESI) available. See DOI: https://doi.org/10.1039/d2cp04671g |
| This journal is © the Owner Societies 2023 |