Concerted and sequential three-body fragmentation of deep-core-ionized carbon disulfide†
Received
13th September 2022
, Accepted 2nd November 2022
First published on 25th November 2022
Abstract
Momentum vector correlation is a powerful tool to study molecular dissociation. We have studied the three-body fragmentation of carbon disulfide after sulfur 1s photoionization by means of momentum imaging techniques. Concerted and sequential pathways are disentangled in three-body fragmentation using adapted analysis strategies. In particular, we introduce various data visualization schemes that are proved to be particularly efficient to determine dissociation dynamics.
1 Introduction
In the last twenty years, molecular fragmentation studies have benefited from the development of recoil-ion and electron momentum spectroscopy that gave birth to a new family of experimental instruments, the so-called reaction microscopes, which are now routinely used by scientists from diverse communities.1 This decisive advance was made possible by the merging of different techniques including time-of-flight measurements, multi-coincidence and imaging techniques, as well as large collection angles. Such schemes allow the measurement of the momentum vectors of several ions and electrons, produced during the fragmentation of a molecular target after collision with photons or charged particles. It is now possible to study in detail the nuclear dynamics in the Coulomb explosion of polyatomic systems. In particular, significant efforts have been made in the study of three-body fragmentation, using various ionizing sources such as synchrotron radiation,2–5 intense lasers,6–13 ion impact14–19 and electron impact.20–23 Most of these studies focused on the fragmentation dynamics of archetypal triatomic molecules, namely CO2,4,10,13–16,20,21 OCS,11,17,19,23 and CS2.5–8,12,22 The challenging aspect of three-body fragmentation studies is the reconstruction of the dynamics and the difficulty that can arise to disentangle simultaneous or stepwise breakup mechanisms. This particular question has been the focus of numerous studies. Neumann et al.15 have shown that it is possible to distinguish different breakup mechanisms by selecting an appropriate kinetic energy range. In a previous study on core–hole localization in the photoionization of CS2,5 we have applied ion kinetic energy selection to separate, with some limitations, the sequential and concerted mechanisms in the three-body dissociation of CS24+ into C+ + S+ + S2+. Several authors have proposed different strategies to handle and visualize the complex set of data produced by full momentum vector spectroscopy.6,13,15,17,19 Notably, Rajput et al.13 have suggested the use of “native frames” associated with each step of the sequential process ABC → A + BC → A + B + C to enable a clear separation of the breakup mechanisms when the undissociated fragment BC lives long enough to rotate before it dissociates. Recently, we have studied the femtosecond dynamics of water molecules imaged by X-ray free-electron laser pulses24 and have developed new strategies for appropriate data vizualization. It is the aim of the present article to go a step further towards a better understanding of fragmentation mechanisms and propose momentum analysis and strategies adapted to the case study. To this purpose, we have revisited the three-body fragmentation of the carbon disulfide (CS2) molecule, where the two C–S bonds are broken, and presented a step-by-step analysis of the momentum vector correlation data, allowing a clear representation of the nuclear dynamics associated with molecular dissociation.
2 Experimental setup
All the measurements described in this study were performed using photoionization by synchrotron radiation, 10 eV above the sulfur 1s threshold lying at 2478 eV.25 The fragmentation pathways were experimentally studied by measuring photoelectrons in coincidence with all the three ions created, combining time-of-flight (TOF) and imaging techniques for full-momentum vector measurements. The experiment was performed at the beamline LUCIA of the French national synchrotron source SOLEIL which provided X-rays with 100% linear polarization during the eight-bunch operation of the storage ring. The experimental setup was described in detail elsewhere.26
Briefly, a cold supersonic jet of the sample gas is produced by adiabatic expansion through a nozzle and intersects the photon beam at the focal point of a double momentum spectrometer. Electrons and ions are separated and accelerated in opposite directions using a set of electrostatic lenses with a static electric field which was set to 140 V cm−1 to extract all cations with kinetic energies up to 30 eV within a 4π collection angle. The TOF of the particles is measured with respect to a periodic signal provided by the storage ring and set to match the time window between two electron bunches in the eight-bunch machine operation. Impact positions are derived from the time difference measured at the two ends of the delay lines. Data for each ionization event can be filtered off-line in order to isolate events from only the coldest portion of the supersonic molecular beam and to focus on specific ranges of flight time (i.e. a specific ion), impact position, and/or kinetic energy of a particle. Four-particle coincidences Sr+ + Cp+ + Sq+ + eph−, noted PE3PICO for photoelectron-3-photion coincidences, could be measured with sufficient statistics for ten different pathways (see below) despite the low photoionization cross section for S 1s (∼0.1 Mb27).
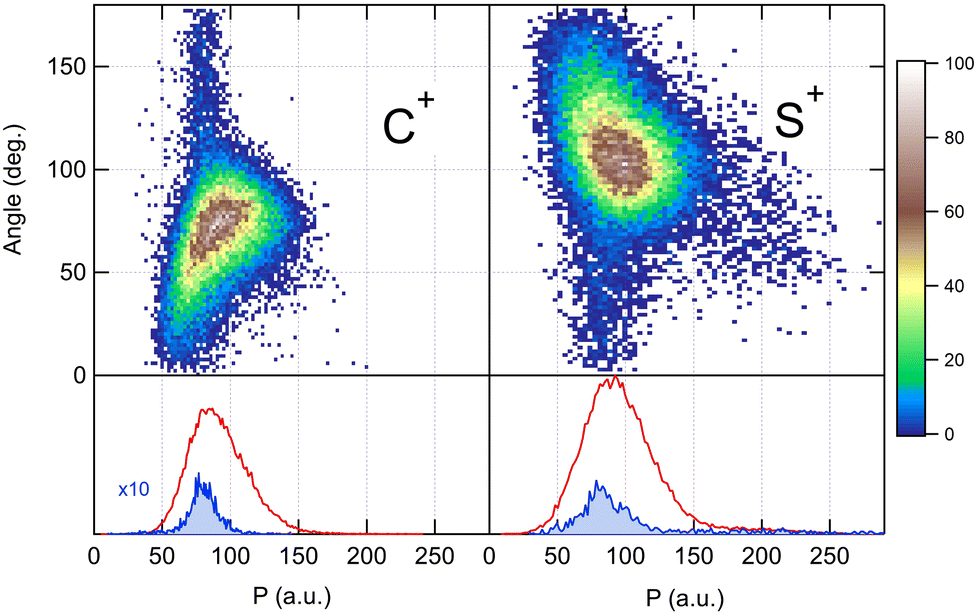
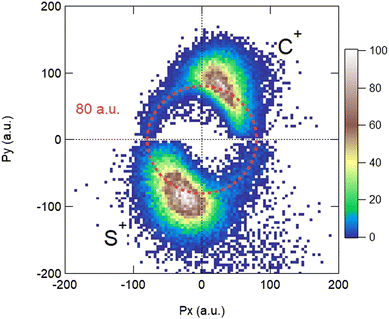
The measurement of the TOF and impact positions provides the three components (Px, Py, and Pz) of the initial momentum vector P of each particle detected in coincidence.28Fig. 1 shows the x and y components of the momenta measured in the laboratory frame for the S2+ + C+ + S+ + eph− PE3PICO channel. The momentum of the photoelectron (top left panel) shows the expected angular distribution for a 1s electron emitted after the absorption of a photon, following a cos2 intensity distribution with respect to the linear polarization of the incident photon beam (oriented along the x axis on the figure). The angular distributions of the ions appear to be isotropic, which is the expected above threshold far from any resonance. This figure shows the sum of all the recorded events; however, our data are recorded in list mode and we can correlate all the momentum vectors event-by-event independently. One of the great achievements of the momentum correlation method is the possibility to derive the photoelectron angular distribution in the molecular frame. It has been the subject of a previous publication5 and we will not discuss it further in this article. Here, the momentum vector correlation is used to provide a detailed analysis of the molecular dissociation mechanisms.
 |
| | Fig. 1 Momentum distributions recorded in the laboratory frame for the S2+ + C+ + S+ + eph− PE3PICO channel after core S 1s photoionization in CS2. | |
3 Molecular fragmentation
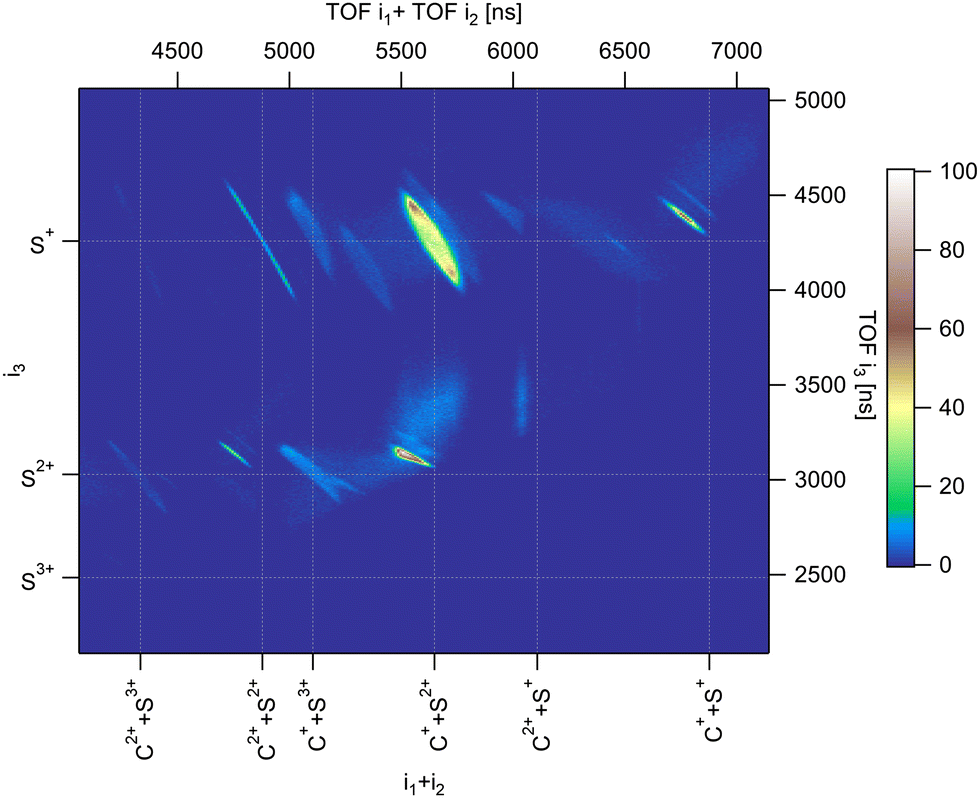
Fig. 2 shows the three-ion coincidence map measured with our experimental setup. A convenient way to represent the time correlation of three particles on a 2D map is to sum the time of flight of two particles on one of the axes. Here, we use the sum of the TOF of the first and second ions detected along the x-axis of the map, and the TOF of the third ion along the y-axis. The time scale in ns is presented on the top and right axis and is substituted by the name of the ions for easy identification on the bottom and left axis. Each island on the map represents a three-body dissociation channel. The slopes of the islands reflect the charge difference between fragments. After deep-core ionization, relaxation processes involve multiple Auger decays where several electrons are emitted sequentially in a cascade. As a consequence, highly charged ions are produced.25,29 We have shown in argon that complex decay pathways following core 1s photoionization lead to the production of multiple charged ions up to 7+,29,30 although branching ratios are dominated by the production of Ar4+ which amounts to 46.3% of all ions produced. In the case of a molecule containing only a few atoms, multiple ionization is usually followed by the coulomb explosion of the molecular ion and each constituent atom carries a positive charge (in some cases negative ions are also produced31). The deep-shell ionization of a molecule can thus lead to the production of a large variety of fragment ions representing complex decay pathways. S 1s photoionization in CS2 can be compared to Ar 1s photoionization. The dominant channel corresponds to the decay of CS24+ which, all two-body and three-body dissociation channels included, amounts to about 40%,32 and the maximum degree of ionization is 7+. In this article, we discuss only the three-body fragmentation channels. From our coincidence measurements, we were able to isolate ten different channels detailed in Table 1.
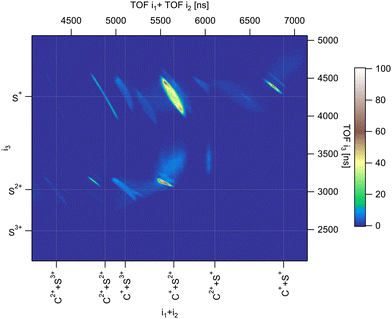 |
| | Fig. 2 Three-ion coincidence map recorded in PE3PICO measurements after core S 1s photoionization in CS2. | |
Table 1 Fragmentation channels measured in four-particle coincidences
|
|
Parent ions |
Fragments |
Branching ratios (%)25 |
| (1) |
CS23+ |
C+ + S+ + S+ |
8.9 ± 0.6 |
| (2) |
CS24+ |
C+ + S+ + S2+ |
36.6 ± 1.6 |
| (3) |
C2+ + S+ + S+ |
2.1 ± 0.2 |
| (4) |
CS25+ |
C+ + S2+ + S2+ |
15.6 ± 1.1 |
| (5) |
C2+ + S+ + S3+ |
7.6 ± 0.6 |
| (6) |
C2+ + S+ + S2+ |
5.0 ± 0.4 |
| (7) |
CS26+ |
C+ + S2+ + S3+ |
10.0 ± 0.7 |
| (8) |
C2+ + S2+ + S2+ |
3.1 ± 0.2 |
| (9) |
C2+ + S+ + S3+ |
1.1 ± 0.1 |
| (10) |
CS27+ |
C2+ + S2+ + S3+ |
2.2 ± 0.2 |
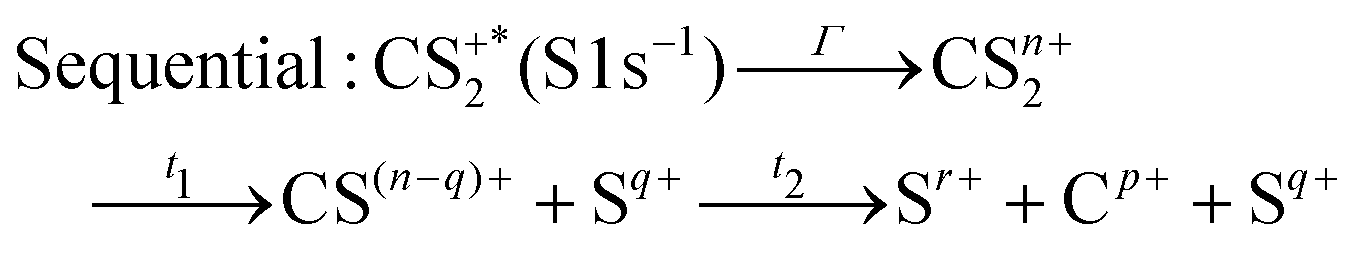
These channels correspond to all the three-body fragmentation channels identified by U. Ankerhold et al.25 with branching ratios above 1%. Other channels were not distinguished from the background noise in our measurements. The main decay of CS2 is the three-body fragmentation of CS24+, channel (2) in Table 1, which leads mainly to the production of C+, S+ and S2+ that represents 36.3% of all fragmentation pathways. The branching ratios of the two other major channels, channels (4) and (7) in Table 1, decrease to 15.6% and 10%, respectively. In the dissociation of a molecule where several bonds can be broken, we can distinguish two pathways a priori: a concerted mechanism in which all the bonds are broken simultaneously and a sequential process where two consecutive fragmentations, or more, are considered independently. In the case of CS2 where two bonds can be broken, we can write the concerted and sequential pathways as follows:
| |  | (1) |
| | 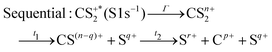 | (2) |
where
n =
r +
p +
q,
Γ is the core–hole lifetime, about 1 fs for the S 1s core hole,
33t1 is the dissociation time of the CS
2n+ ion, and
t2 is the dissociation time of the CS
(n−q)+ fragment. Maul and Gericke proposed a further distinction between the synchronous concerted and asynchronous concerted pathways depending on the time difference between the two bond cleavages compared to the mean rotational period of the intermediate metastable fragment.
34 The authors suggest the following definitions, based on the time difference Δ
t =
t2 −
t1 in
eqn (2): Δ
t/
τrot > 1 for sequential fragmentation, 0 < Δ
t/
τrot < 1 for asynchronous concerted fragmentation, and Δ
t/
τrot = 0 for synchronous concerted fragmentation. Similarly, Neumann
et al.15 distinguish concerted, asynchronous and sequential fragmentation pathways. In a concerted breakup, all bonds are broken simultaneously in the equilibrium geometry of the molecule. In the asynchronous breakup, all bonds also break simultaneously but at the time when the geometry of the molecule is changed by the excitation of vibrational levels and rotation may occur. In sequential breakups, the bonds break stepwise and the rotation of the undissociated fragments occurs at a distance from the other fragments. From an experimental point of view, the difference between these pathways should be reflected on the momentum correlation of the three fragments in CS
2. In particular, in a sequential decay where the metastable fragment has time to rotate, the momentum vector correlation will be lost.
4 Momentum analysis
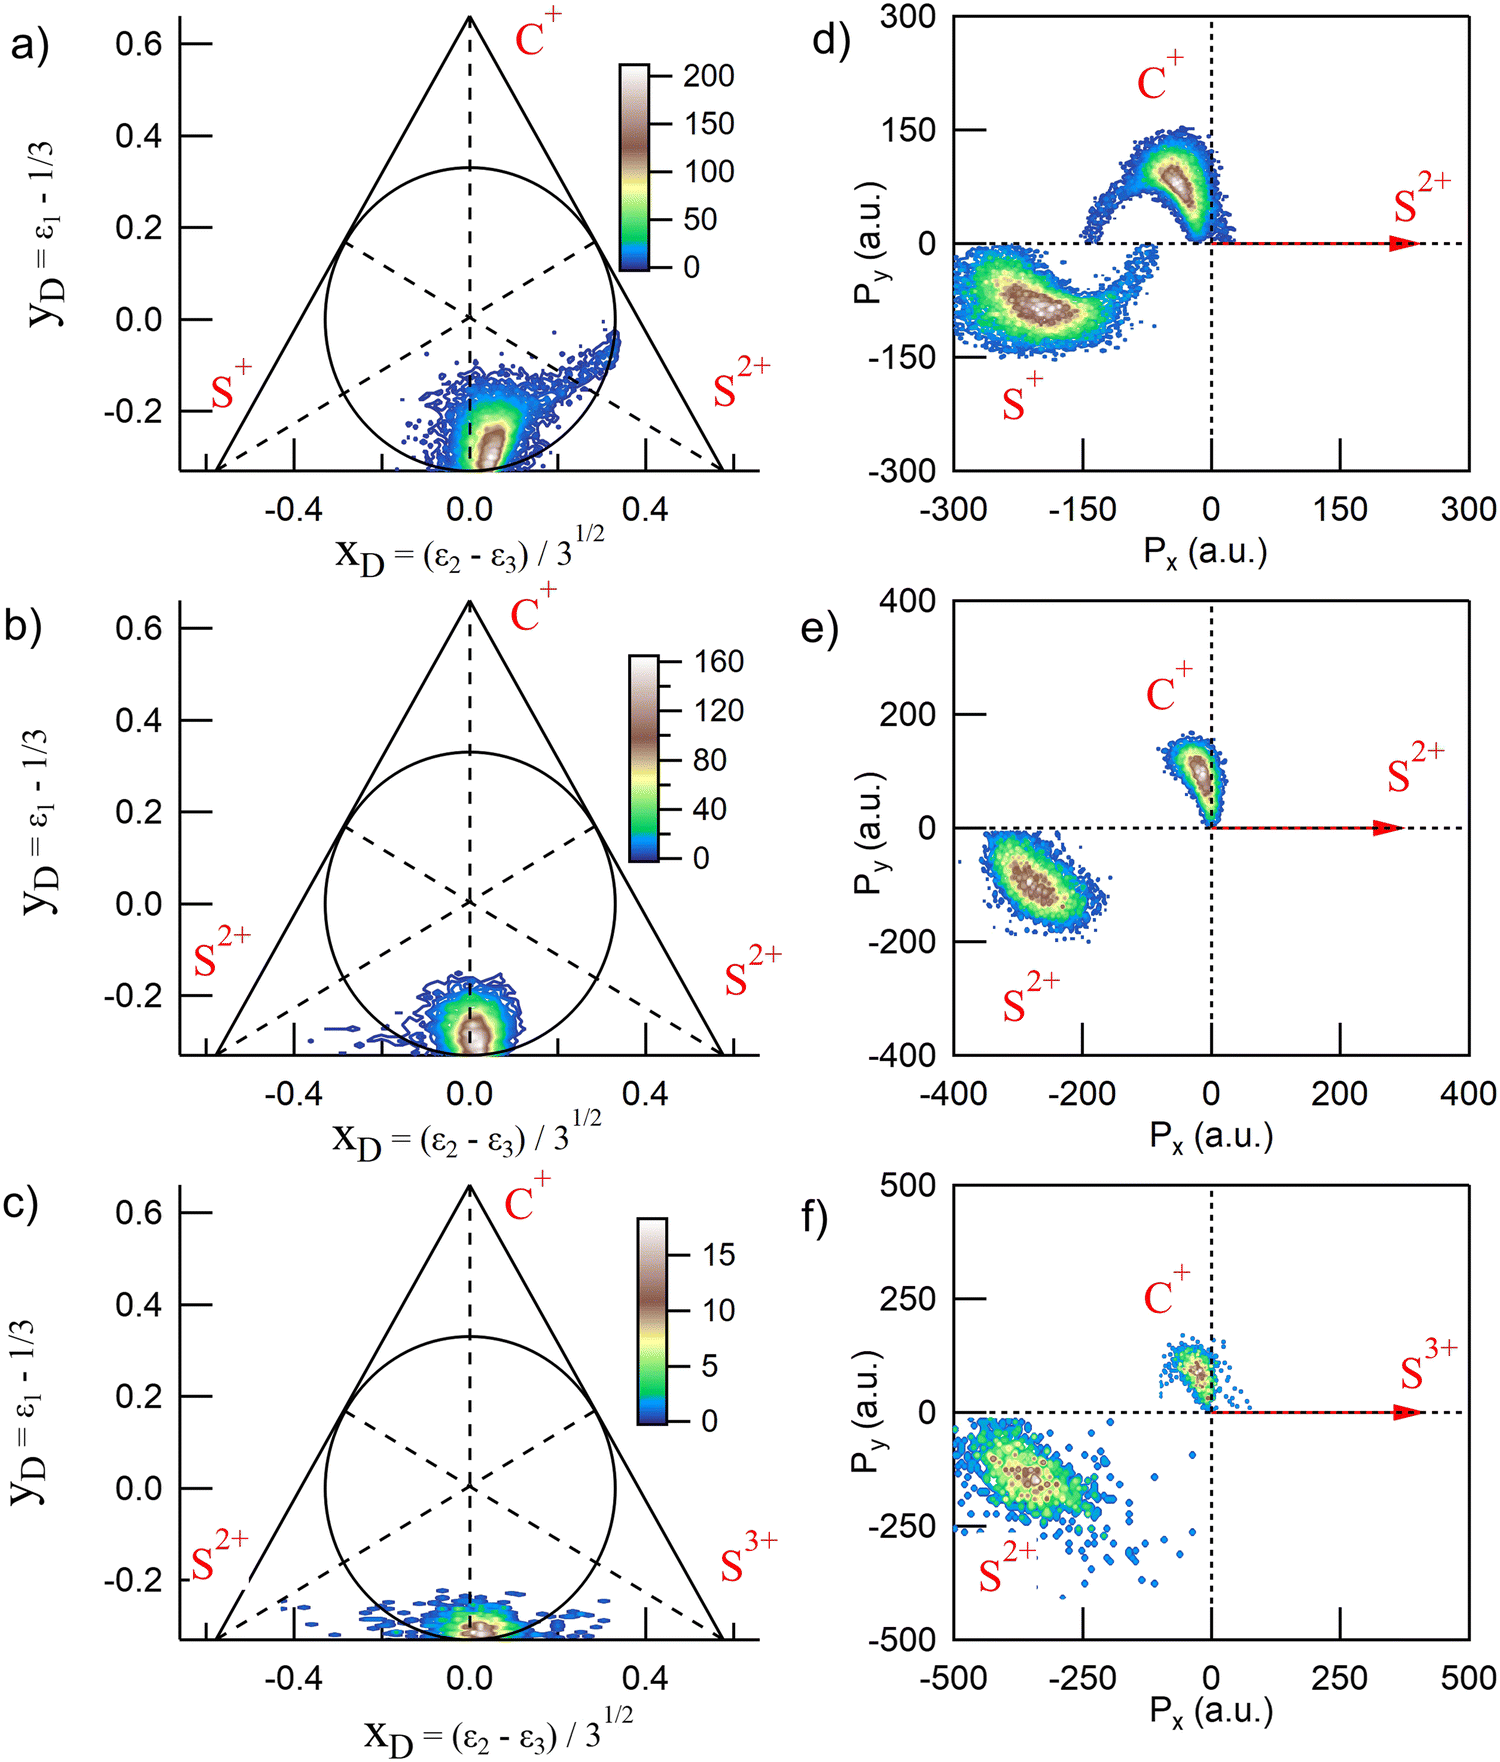
CS2 is linear in its ground state and undergoes deformation during fragmentation, showing a variety of nuclear dynamics. Full-momentum vector measurements allow for a detailed analysis of the molecular breakup mechanisms. In the case of three-body fragmentation, convenient tools such as Dalitz diagrams2,4,15,35,36 and Newton plots37,38 are often used to describe the intricate momentum distributions between the fragments and identify sequential and nonsequential dissociation pathways. We show in Fig. 3 the Dalitz diagrams and Newton plots obtained for the three main dissociation channels observed: channels (2), (4) and (7) in Table 1, corresponding to the fragmentation of CS24+, CS25+ and CS26+, respectively. These representations, both probability density plots, are complementary. The Dalitz diagrams in Fig. 3(a–c) show the partition of momentum among the three fragments in the three-body dissociation and the Newton plots in Fig. 3(d–f) show the momentum vector distribution relative to a reference in the center of mass.
 |
| | Fig. 3 Dalitz diagrams and Newton plots obtained for the three main three-body dissociation channels (see Table 1 for details) after core S 1s photoionization in CS2. The Dalitz diagrams for channels (2), (4) and (7) are represented in subplots a, b, and c, respectively. The corresponding Newton plots are represented in subplots d, e, and f. | |
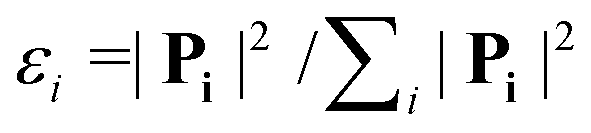
The Dalitz diagrams shown on the left hand side in Fig. 3 are constructed in phase space using the normalized coordinate  for each ion i of momentum Pi and the cartesian coordinates
  and yD = ε1 − 1/3 to plot the 2D diagrams.2 We chose to represent the data in phase space because the fragmentation dynamics is based on momentum conservation, but the same diagrams can be constructed using the kinetic energies of the fragment ions instead of the momenta.36 Each fragment is associated with one of the vertices of an equilateral triangle and an axis represented by the median joining the vertex on the figure. Momentum conservation requires that all events lie inside the inscribed circle, and for each ion the altitude from the opposite base is εi, i.e. a point lying on the base indicates a null momentum for the fragment associated with the opposite vertex. All points in the diagram correspond to a set of defined directions of the three momentum vectors Pi and indicate the geometry of the molecule at the moment of the breakup. The coordinate system is chosen such that the two sulfur ions lie on the base line which then corresponds to the linear geometry of the molecular ground state and the carbon axis is the vertical axis.
In Fig. 3(a), the fragmentation of CS24+ is shown and ε1 = εC+, ε2 = εS2+, and ε3 = εS+. ε1 = εC+, ε2 = εS2+, and ε3 = εS2+ in Fig. 3(b) and ε1 = εC+, ε2 = εS3+, and ε3 = εS+ in Fig. 3(c), respectively. In the case of the fragmentation of CS25+ and CS26+, Fig. 3(b and c), respectively, the probability density plots show that the C+ fragment carries very little momentum and we observe the equipartition of the energy between the two sulfur ions which are emitted back-to-back. Such a localized distribution is typical of the concerted breakup of a linear molecule in its ground state with no or little geometrical change. In this case, little momentum the carbon fragment can acquire comes from a slightly bent geometry in the excited state amplified by coulomb repulsion. Therefore, momentum conservation requires the density plot to be centered at the intersection of the base line with the carbon axis which is what is observed in the two Dalitz diagrams shown in Fig. 3(b and c). The diagrams obtained for the other dissociation channels listed in Table 1 are not included in this figure because they were found to be identical to these two diagrams. Also, as observed recently by Wang et al.,22 only the Dalitz diagram for the fragmentation of CS24+ in Fig. 3(a) is remarkably different. The main part of the probability density extends above the base and to the right side of the median towards the S2+ vertex, indicating that the S2+ fragment carries more energy than the S+ fragment, while C+ gains energy. The distribution is curved which indicates the bending of the molecule during the dissociation process due to vibrational excitation. We also observe a wing structure that extends to the right toward the edge of the circle. In contrast to what has been observed in the fragmentation of CO2,15,16 where the sequential process gives rise to a symmetrical distribution between the two oxygen ions, with a distinctive V-shaped structure observed in the Dalitz plot; here, the asymmetrical structure extending linearly to the right shows that S2+ is emitted in the first step of the sequential breakup following the sequence
| |  | (3) |
In the second step, the second C–S bond breaks. In the case of a purely sequential breakup, the second step occurs away from the primary fragment. Therefore, the momentum distribution associated with the second step of the sequence should be uncorrelated with the momentum of the first departing ion and shows no variation along the S2+ axis. However, we observe that the associated wing structure does not stretch perpendicularly to the S2+ axis as observed in the case of OCS for instance.19 Using Monte Carlo simulations as a function of lifetime, Méry et al.39 showed that this type of structure develops when the lifetime of the metastable ion is short and momentum transfer occurs while the first-departing ion is still close enough to influence the Coulomb explosion. This, together with the large bending of the molecule, shows the continuity between concerted, asynchronous, and sequential breakups.
The Newton plots presented in the right-hand panels in Fig. 3 show the full momentum vectors of the three ions in the molecular frame. Because of momentum conservation, the three vectors are coplanar. One ion is chosen as a reference axis and the momentum vectors of the two other ions are calculated relative to this axis. In the sequential process identified above, S2+ is the first departing ion and is thus used as a reference to construct the Newton plot in Fig. 3(d) in order to emphasize the nuclear dynamics in the second step. Accordingly, the Newton plots in panels (e) and (f) are constructed by choosing the most highly charged ion Sn+ produced in each fragmentation pathway as a reference axis. Therefore, using the notation of eqn (2), the momentum vector of Sn+ defines the x-axis, and the momentum vectors of Cr+ (y positive) and Sp+ are mapped in the upper half (Py > 0) and lower half (Py < 0), respectively. The coordinate (0, 0) is the center of the mass of the three ions.
Newton plots provide a clear image of the molecular geometry during the Coulomb explosion. In the three panels, the main islands show the concerted fragmentation and the asynchronous breakup through the bending of the molecule with the C+ ion being emitted at an angle larger than 90° relative to the Sn+ ion, with the maximum of the distribution centered at around 100° for CS25+ and 114° for CS24+. The S+ ion is emitted at an angle smaller than 180° with a wide distribution that reflects the magnitude of the bending. A minor contribution corresponding to the sequential breakup in the dissociation of CS24+ appears as a circle in the momentum distributions of C+ and S+, shifted towards the negative values of Px. The shift reflects the momentum conservation during which the first step of the breakup and the circle is a clear indication of the rotation of the CS2+ fragment before the second step of the dissociation. Such momentum distributions were also reported in the dissociation of CO23+,15,16,21 OCS3+11 and CS24+.5,22 This interpretation supposes the existence of a metastable fragment. By means of ab initio molecular orbital calculations, Krishnamurthi et al.40 have shown that the potential energy curves of the two low-lying 3Π and 1Σ+ electronic states of CS2+ present barriers separating the potential in two bound and repulsive parts, resulting in a metastable character. Based on the observation of the rotation of the CS2+ fragment in the dissociation of CS23+ in intense laser fields, Hishikawa et al.7 have estimated that the lifetime of the predissociated fragment could be bracketed by 10 ps < t2 β 1 μs. The lower limit of 10 ps corresponds to half the estimated rotational period τrot of ∼ 20 ps. The higher limit is imposed by the fact that no CS2+ ion was observed by the authors in their study. As discussed above, the Dalitz plots obtained suggest that the fragmentation process we observe in this study is not a pure sequential fragmentation where Δt/τrot > 1 as defined by Maul and Gericke,34 but an asynchronous mechanism with 0 < Δt/τrot < 1 which suggests that the lifetime of the metastable fragment is closer to the lower limit.
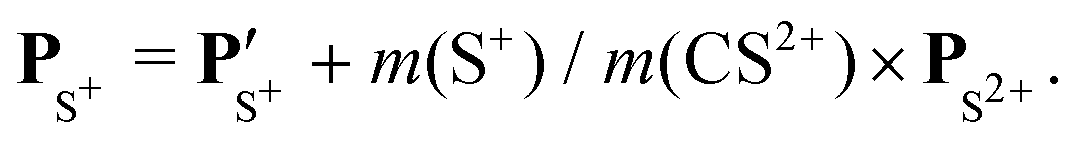
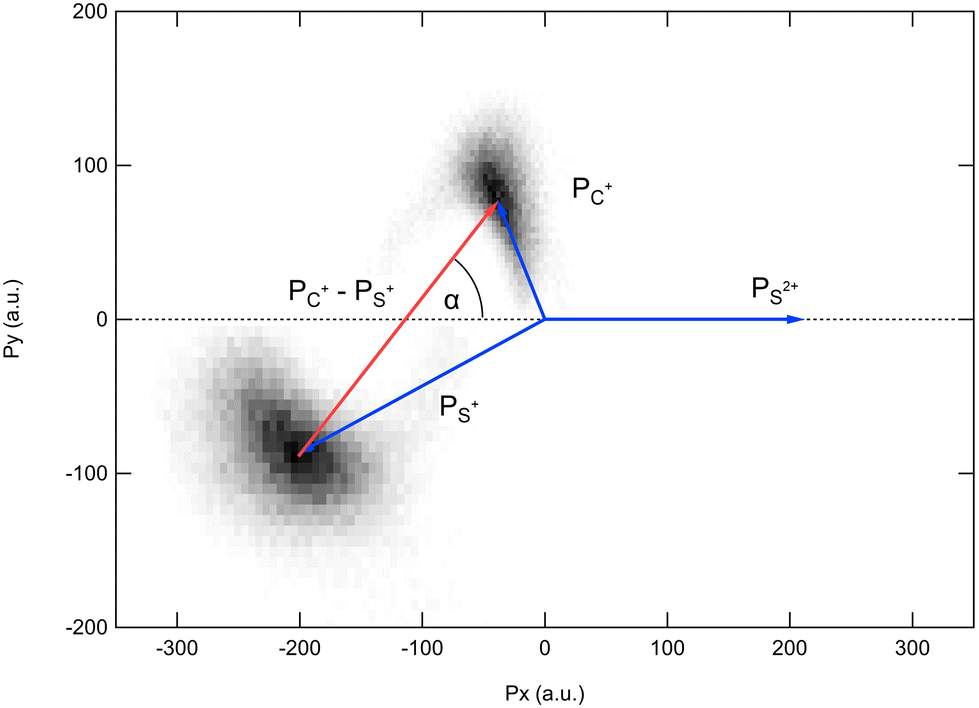
Because the momentum acquired by the fragments during the dissociation process is determined by the Coulomb interaction between the three particles and, therefore, depends on the geometrical arrangement of the ions, it is convenient to represent the momentum distribution as a function of the emission angle. In the case of a stepwise fragmentation, the relevant angle is the rotation angle of the internuclear axis in the CS2+ fragment with respect to the first-departing ion, S2+, which can be derived from the momentum vectors of the two C+ and S+ ions, as shown in Fig. 4 where we define the angle α as the angle between the momentum vector PS2+ and the composite vector PC+ − PS+. Such an approach, where several momentum vectors are combined to produce a system of hyperspherical coordinates, has been used to study strongly correlated few-body systems (see ref. 41, for instance). Using the composite angle α as a new coordinate, we introduce in Fig. 5 a novel 2D representation that shows the momentum density plots obtained for the three ions C+, S+ and S2+, respectively, relative to α. To our knowledge, this is the first time such a representation is used to disentangle the contribution of the different steps in a sequential process to the momentum distribution. We observe that as the rotation of the fragment increases, C+ gains the momentum and S+ loses the momentum, while the momentum distribution of S2+ associated with the sequential contribution remains constant at a value of around 205 a.u. This representation clearly shows the continuity between concerted, asynchronous and sequential breakups. The projections of the total momentum distributions are shown as red curves in the bottom panels of Fig. 5. In this case, such 1D projections do not permit to distinguish between processes, apart from a low momentum contribution for S+ that can be uniquely associated with the sequential fragmentation of CS2+. When studying molecular fragmentation, the kinetic energies of the fragment ions are more commonly used as they relate directly to the potential energy surfaces. Therefore, it is interesting to see how the momentum distribution translates into the kinetic energy distribution among the fragment ions. In Fig. 6, we report the kinetic energies of the three ions with respect to the rotation angle α as 2D density plots and 1D projections. The red curves show the total kinetic energy distributions for each fragment, i.e. integrated over all angles, and the solid blue curves show the partial integration over all angles between 100° and 180°. The rotation of the undissociated fragment leads to high kinetic energies of C+, with a partial distribution centered at around 11.3 eV with a half width at half maximum of 2.5 eV, while the concerted breakup is associated with low kinetic energies. For S+, the rotation leads to low kinetic energies with a partial distribution for 100° < α < 180° centered at around 1.8 eV ± 1 eV (HWHM), while the concerted and asynchronous fragmentations are associated with high kinetic energies. The same observation can be made for the primary S2+ fragment, indicating that the sequential breakup is associated with a different potential energy curve with a shallow minimum. As shown previously by Neumann et al.,15 it is possible, in certain cases, to separate the different breakup mechanisms by selecting the appropriate kinetic energy range. The selection of a low energy component (<5 eV) in the energy distribution of S+ has been used to filter the data and distinguish the two processes, concerted and sequential, in the analysis of the molecular frame photoelectron angular distributions.5 However, it is clear from Fig. 6 that such an opportunity is limited and in this case possible only with one of the fragment ions. The method we used in this article to analyze the data provides a much clearer picture to understand the details of fragmentation mechanisms.
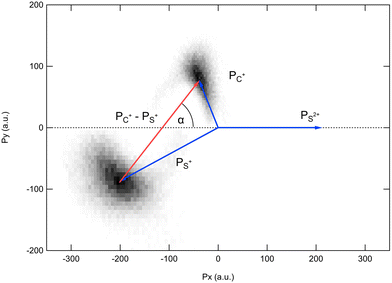 |
| | Fig. 4 Definition of the rotation angle α measured between the momentum vector of the S2+ ion PS2+ and the composite vector PC+ − PS+. | |
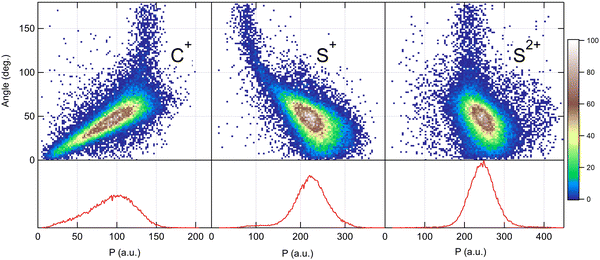 |
| | Fig. 5 Angular dependence of the momentum distributions measured for the three fragment ions produced in the dissociation of CS4+ after core S 1s photoionization in CS2. Bottom panels show the 1D projection of the total momentum distributions. | |
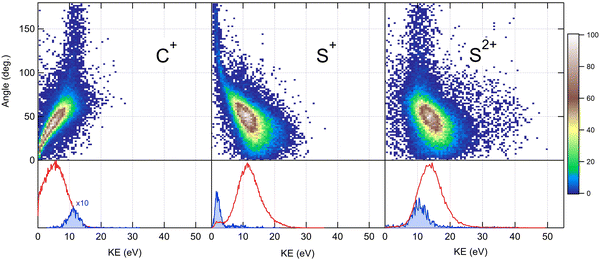 |
| | Fig. 6 Angular dependence of the kinetic energy distributions measured for the three fragment ions produced in the dissociation of CS4+ after core S 1s photoionization in CS2. Bottom panels show the 1D projection of the total kinetic energy distributions in red, and the partial distributions in solid blue for a selected range of angles (see the text for details). | |
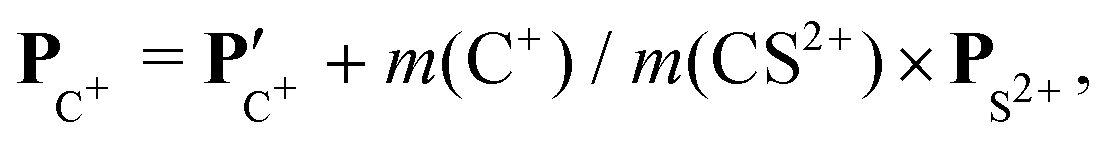
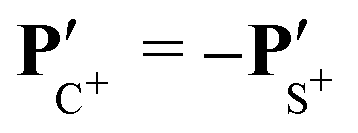
The angular dependence of the momentum distribution is a consequence of the combination of the momentum acquired by the undissociated fragment CS2+ during the first step of the breakup, PCS2+ = −PS2+, and the momentum acquired by the individual ions C+ and S+ during the second step of the breakup,  . The vector composition leads to the final momenta
| | 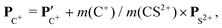 | (4) |
| |  | (5) |
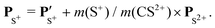
Using these relations, we can calculate the momentum distribution in the native frame of the CS2+ dissociation to determine the momentum |P′| acquired by C+ and S+ in the second step of the process, by removing the momentum acquired in the first-step breakup. Similarly, to the novel representation introduced in Fig. 5, we can introduce two new representations in Fig. 7 and 8 in the native frame. Fig. 7 shows the angular dependence of the momentum transfer during the rotation of the dissociating fragment. The angle is measured with respect to the momentum vector of S2+. In Fig. 8, we show the reconstructed Newton plot representing the dissociation of CS2+ in the fragment frame. The momentum distribution associated with the sequential breakup is distributed along a circle centered on the center of the mass of the two ions C+ and S+. The main islands associated with the asynchronous concerted breakup spreads over 110°, emphasizing the bending of the molecule and the nuclear dynamics during fragmentation. By integrating the distribution of C+ over all angles between 110° and 180°, we found that the momentum acquired during the dissociation of CS2+ is a distribution centered at around 80.0 a.u. ± 12.3 (HWHM), which corresponds to a kinetic energy release (KER) of 5.5 eV ± 0.1 eV. This value is slightly higher than the value of 4.8 eV for the vibrational ground level of the 3Π state calculated by Krishnamurthi et al.,40 and the experimental value of 5.3 eV by Wang et al.19 More recently, using the multireference configuration interaction (MRCI), T. Šedivcová et al.42 and B. Yan and Y.-J. Zhang43 were able to perform more advanced calculations on the potential energy curves of the CS dication. Both studies confirm the existence of potential barriers suported by the two low-lying 3Π and 1Σ+ electronic states and obtained the refined values for the KER. These studies show that the experimental value is compatible with the excitation of vibrational states during the sequential three-body dissociation of CS23+. In particular, for the 3Π state, the KER should be in the range of 3.73 eV to 6.05 eV. In the case of the sequential three-body dissociation of CS24+, we can expect higher vibrational excitation due to the repulsion of the S2+ fragment and the increase of the KER. By extrapolating the distribution over all angles between 0° and 180°, we can estimate that the sequential breakup amounts to 7% ± 1 of the fragmentation of CS24+.
 |
| | Fig. 7 Angular dependence of the momentum distributions measured for the two fragment ions C+ and S+ produced in the dissociation of CS2+ in the second step of the dissociation of the molecular ion CS24+. Bottom panels show the 1D projection of the total momentum distributions in red and for selected angular ranges in solid blue. See the text for details. | |
 |
| | Fig. 8 Reconstructed Newton plot of the dissociation of CS2+ in the fragment frame. See the text for details. | |
5 Conclusion
For its importance in plasma physics and chemistry in interstellar medium, a three-body fragmentation study is undoubtly still a work in progress, and analysis methods will continue to develop as the experimental techniques evolve. Using a momentum vector correlation, we have studied the fragmentation of carbon disulfide after sulfur 1s ionization by X-ray photons. Momentum vector spectroscopy provides a unique tool to reveal the nuclear dynamics on short time scales and disentangle the different mechanisms that can produce three-body dissociation. In the case of the CS4+ ion created after the Auger decay of the initial core hole, new analysis methods and original vizualization strategies reveal major differences in the momentum distribution from concerted, asynchronous or sequential molecular breakups, and provide efficient ways to extract new information about the dynamics of the process.
Conflicts of interest
There are no conflicts to declare.
Acknowledgements
The experiment was performed at the LUCIA beamline at SOLEIL Synchrotron, France (Proposal No. 20120122). We are grateful to the SOLEIL staff for smoothly running the facility.
References
- J. Ullrich, R. Moshammer, A. Dorn, R. Dörner, L. P. H. Schmidt and H. Schmidt-Böcking, Rep. Prog. Phys., 2003, 66, 1463 CrossRef CAS.
- K. Ueda, A. De Fanis, N. Saito, M. Machida, K. Kubozuka, H. Chiba, Y. Muramatu, Y. Sato, A. Czasch, O. Jaguzki, R. Dörner, A. Cassimi, M. Kitajima, T. Furuta, H. Tanaka, S. L. Sorensen, K. Okada, S. Tanimoto, K. Ikejiri, Y. Tamenori, H. Ohashi and I. Koyano, Chem. Phys., 2003, 289, 135 CrossRef CAS.
- X.-J. Liu, N. Saito, H. Fukuzawa, Y. Morishita, S. Stoychev, A. Kuleff, I. H. Suzuki, Y. Tamenori, R. Richter, G. Prümper and K. Ueda, J. Phys. B: At., Mol. Opt. Phys., 2007, 40, F1–F7 CrossRef CAS.
- J. Laksman, E. P. Måansson, C. Grunewald, A. Sankari, M. Gisselbrecht, D. Céolin and S. Sorensen, J. Chem. Phys., 2012, 136, 104303 CrossRef CAS PubMed.
- R. Guillemin, P. Decleva, M. Stener, C. Bomme, T. Marin, L. Journel, T. Marchenko, R. K. Kushawaha, K. Jänkälä, N. Trcera, K. P. Bowen, D. W. Lindle, M. N. Piancastelli and M. Simon, Nat. Commun., 2015, 6, 6166 CrossRef CAS PubMed.
- H. Hasegawa, A. Hishikawa and K. Yamanouchi, Chem. Phys. Lett., 2001, 349, 57 CrossRef CAS.
- A. Hishikawa, H. Hasegawa and K. Yamanouchi, Chem. Phys. Lett., 2002, 361, 245 CrossRef CAS.
- A. Hishikawa, H. Hasegawa and K. Yamanouchi, Chem. Phys. Lett., 2004, 388, 1 CrossRef CAS.
- L. Zhang, S. Roither, X. Xie, D. Kartashov, M. Schöffler, H. Xu, A. Iwasaki, S. Gräfe, T. Okino, K. Yamanouchi, A. Baltuska and M. Kitzler, J. Phys. B: At., Mol. Opt. Phys., 2012, 45, 085603 CrossRef.
- C. Wu, C. Wu, D. Song, H. Su, Y. Yang, Z. Wu, X. Liu, H. Liu, M. Li, Y. Deng, Y. Liu, L.-Y. Peng, H. Jiang and Q. Gong, Phys. Rev. Lett., 2013, 110, 103601 CrossRef PubMed.
- B. Wales, E. Bisson, R. Karimi, S. Beaulieu, A. Ramadhan, M. Giguère, Z. Long, W.-L. Liu, J.-C. Kieffer, F. Légaré and J. Sanderson, J. Electron Spectrosc. Relat. Phenom., 2014, 195, 332 CrossRef CAS.
- A. Matsuda, E. J. Takahashi and A. Hishikawa, J. Electron Spectrosc. Relat. Phenom., 2014, 195, 327 CrossRef CAS.
- J. Rajput, T. Severt, B. Berry, B. Jochim, P. Feizollah, B. Kaderiya, M. Zohrabi, U. Ablikim, F. Ziaee, K. P. Raju, D. Rolles, A. Rudenko, K. D. Carnes, B. D. Esry and I. Ben-Itzhak, Phys. Rev. Lett., 2018, 120, 103001 CrossRef CAS PubMed.
- B. Siegmann, U. Werner, H. O. Lutz and R. Mann, J. Phys. B: At., Mol. Opt. Phys., 2002, 35, 3755 CrossRef CAS.
- N. Neumann, D. Hant, L. P. H. Schmidt, J. Titze, T. Jahnke, A. Czasch, M. S. Schöffler, K. Kreidi, O. Jagutzki, H. Schmidt-Böcking and R. Dörner, Phys. Rev. Lett., 2010, 104, 103201 CrossRef CAS PubMed.
- S. Yan, X. L. Zhu, P. Zhang, X. Ma, W. T. Feng, Y. Gao, S. Xu, Q. S. Zhao, S. F. Zhang, D. L. Guo, D. M. Zhao, R. T. Zhang, Z. K. Huang and X. J. Zhang, Phys. Rev. A, 2016, 94, 032708 CrossRef.
- H. Kumar, P. Bhatt, C. P. Savfan and J. Rajput, J. Chem. Phys., 2018, 148, 064302 CrossRef PubMed.
- Y. Zhang, T. Jiang, L. Wei, D. Luo, X. Wang, W. Yu, R. Hutton, Y. Zou and B. Wei, Phys. Rev. A, 2018, 97, 022703 CrossRef CAS.
- B. Wang, J. Han, X. Zhu, L. Wei, B. ren, Y. Zhang, W. Yu, S. Yan, X. Ma, Y. Zou, L. Chen and B. Wei, Phys. Rev. A, 2021, 103, 042810 CrossRef CAS.
- X. Wang, Y. Zhang, D. Lu, G. C. Lu, B. Wei, B. H. Zhang, Y. J. Tang, R. Hutton and Y. Zou, Phys. Rev. A: At., Mol., Opt. Phys., 2014, 90, 062705 CrossRef.
- E. Wang, X. Shan, Z. Shen, M. Gong, Y. Tang, Y. Pan, K.-C. Lau and X. Chen, Phys. Rev. A: At., Mol., Opt. Phys., 2015, 91, 052711 CrossRef.
- E. Wang, M. Gong, Z. Shen, X. Shan, X. Ren, A. Dorn and X. Chen, J. Chem. Phys., 2018, 149, 204301 CrossRef PubMed.
- Z. Shen, E. Wang, M. Gong, X. Shan and X. Chen, J. Chem. Phys., 2016, 145, 234303 CrossRef PubMed.
- T. Jahnke,
et al.
, Phys. Rev. X, 2021, 11, 041044 CAS.
- U. Ankerhold, B. Esser and F. von Busch, J. Phys. B: At., Mol. Opt. Phys., 1997, 30, 1207 CrossRef CAS.
- C. Bomme, R. Guillemin, T. Marin, L. Journel, T. Machenko, D. Dowek, N. Trcera, B. Pilette, A. Avila, H. Ringuenet, R. K. Kushawaha and M. Simon, Rev. Sci. Instrum., 2013, 84, 103104 CrossRef CAS PubMed.
- B. L. Henke, E. M. Gullikson and J. C. Davis, At. Data Nucl. Data Tables, 1993, 54, 181 CrossRef CAS.
- R. Dörner, V. Mergel, O. Jagutzki, L. Spielberger, J. Ullrich, R. Moshammer and H. Schmidt-Böcking, Phys. Rep., 2000, 330, 95 CrossRef.
- R. Guillemin, C. Bomme, T. Marin, L. Journel, T. Marchenko, R. K. Kushawaha, N. Trcera, M. N. Piancastelli and M. Simon, Phys. Rev. A: At., Mol., Opt. Phys., 2011, 84, 063425 CrossRef.
- R. Guillemin, K. Jänkälä, B. Cunha de Miranda, T. Marin, L. Journel, T. Marchenko, O. Travnikova, G. Goldsztejn, I. Ismail, R. Püttner, D. Céolin, B. Lassalle-Kaiser, M. N. Pirancastelli and M. Simon, Phys. Rev. A, 2018, 97, 013418 CrossRef CAS.
- W. C. Stolte, D. L. Hansen, M. N. Piancastelli, I. Dominguez Lopez, A. Rizvi, O. Hemmers, H. Wang, A. S. Schlachter, M. S. Lubell and D. W. Lindle, Phys. Rev. Lett., 2001, 86, 4504 CrossRef CAS PubMed.
- B. Esser, U. Ankerhold, N. Anders and F. von Busch, J. Phys. B: At., Mol. Opt. Phys., 1997, 30, 1191 CrossRef CAS.
- J. L. Campbell and T. Papp, Widths of the Atomic K-N7 Levels, At. Data Nucl. Data Tables, 2001, 77, 1 CrossRef CAS.
- C. Maul and K.-H. Gericke, Int. Rev. Phys. Chem., 1997, 16, 1 Search PubMed.
- R. H. Dalitz, Phys. Rev., 1954, 94, 1046 CrossRef CAS.
- D. Babikov, E. A. Gislason, M. Sizun, F. Aguillon, V. Sidis, M. Barat, J. C. Brenot, J. A. Fayeton and Y. J. Picard, J. Chem. Phys., 2002, 116, 4871 CrossRef CAS.
- T. G. Clements, A. K. Luong, H.-J. Deyerl and R. E. Continetti, J. Chem. Phys., 2001, 114, 8436 CrossRef CAS.
- S. D. Price, Int. J. Mass Spectrom., 2007, 260, 1 CrossRef CAS.
- A. Méry, X. Fléchard, S. Guillous, V. Kumar, M. Lalande, J. Rangama, W. Wolff and A. Cassimi, Phys. Rev. A, 2021, 104, 042813 CrossRef.
- V. Krishnamurthi, M. Krishamurthy, V. R. Marathe and D. Mathur, J. Phys. B: At., Mol. Opt. Phys., 1992, 25, 5149 CrossRef CAS.
- T. Šedivcová, V. Špirko and J. Fišer, J. Chem. Phys., 2006, 125, 164308 CrossRef PubMed.
- B. Yan and Y.-J. Zhang, Chin. Phys. B, 2013, 22, 023103 CrossRef.
- J. P. D’incao and B. D. Esry, Phys. Rev. A: At., Mol., Opt. Phys., 2014, 90, 042707 CrossRef.
Footnote |
| † PACS numbers: 31.15.xg, 32.70.Jz, 32.80.Aa, 32.80.Fb, 32.80.Hd. |
|
| This journal is © the Owner Societies 2023 |

 *a,
T.
Marin
a,
M.
Zmerli
a,
C.
Bomme
a,
I.
Ismail
*a,
T.
Marin
a,
M.
Zmerli
a,
C.
Bomme
a,
I.
Ismail

 for each ion i of momentum Pi and the cartesian coordinates
 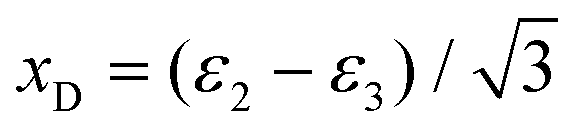 and yD = ε1 − 1/3 to plot the 2D diagrams.2 We chose to represent the data in phase space because the fragmentation dynamics is based on momentum conservation, but the same diagrams can be constructed using the kinetic energies of the fragment ions instead of the momenta.36 Each fragment is associated with one of the vertices of an equilateral triangle and an axis represented by the median joining the vertex on the figure. Momentum conservation requires that all events lie inside the inscribed circle, and for each ion the altitude from the opposite base is εi, i.e. a point lying on the base indicates a null momentum for the fragment associated with the opposite vertex. All points in the diagram correspond to a set of defined directions of the three momentum vectors Pi and indicate the geometry of the molecule at the moment of the breakup. The coordinate system is chosen such that the two sulfur ions lie on the base line which then corresponds to the linear geometry of the molecular ground state and the carbon axis is the vertical axis.

 . The vector composition leads to the final momenta