
 Open Access Article
 This Open Access Article is licensed under a
 Creative Commons Attribution 3.0 Unported Licence
Phospholipid headgroup composition modulates the molecular interactions and antimicrobial effects of sulfobetaine zwitterionic detergents against the “ESKAPE” pathogen Pseudomonas aeruginosa†
Kira L. F.
Hilton
a,
Howard
Tolley
b,
Jose L.
Ortega-Roldan
 a,
Gary S.
Thompson
a,
J. Mark
Sutton
bc,
Charlotte K.
Hind
*b and
Jennifer R.
Hiscock
*a
a,
Gary S.
Thompson
a,
J. Mark
Sutton
bc,
Charlotte K.
Hind
*b and
Jennifer R.
Hiscock
*a
aDivision of Natural Sciences, University of Kent, Canterbury, CT2 7NH, UK. E-mail: J.R.Hiscock@Kent.ac.uk
bUKHSA, Science Group, Manor Farm Road, Salisbury, SP4 0JG, UK. E-mail: Charlotte.Hind@UKHSA.gov.uk
cInstitute of Pharmaceutical Sciences, School of Cancer & Pharmaceutical Sciences King's College London, SE1 9NQ, UK
First published on 10th August 2023
Abstract
We determine the efficacy for three known structurally related, membrane active detergents against multidrug resistant and wild type strains of Pseudomonas aeruginosa. Accessible solution state NMR experiments are used to quantify phospholipid headgroup composition of the microbial membranes and to gain molecular level insight into antimicrobial mode of action.
Antimicrobial resistance (AMR) is a significant threat to world health,1,2 with bacteria now found to be resistant to all currently marketed antimicrobials,3 including the membrane-active peptide, colistin, one of the antibiotics of last resort.4 One mechanism of AMR which remains less well understood, involves alteration of the phospholipid composition of the bacterial membrane,5,6 which decreases effective drug delivery7–9 and/or alters the drug target.10–12 For example, daptomycin susceptible (S447) and resistant (R446) strains of Enterococcus faecium exhibit different phospholipid membrane profiles: PG:L-PG:CL:DAG 34
![[thin space (1/6-em)]](https://www.rsc.org/images/entities/char_2009.gif) :14:39:13 (S447) and PG:L-PG:CL:DAG 15:16:47:23 (R446).13 These differences in phospholipid content were paired with increased daptomycin resistance, which was thought to be due to increased membrane rigidity and changes in biophysical properties. As is common for studies of this type, the specific interactions between the antimicrobial agent and phospholipids within the cell membrane were not identified (see Fig. 1 for a summary of phospholipid headgroup structures). Therefore, the development of methodologies, such as those described herein, which enable the characterisation of molecular level interaction events with the cell membrane has become vital to inform the identification of antimicrobial therapeutic regimes.
:14:39:13 (S447) and PG:L-PG:CL:DAG 15:16:47:23 (R446).13 These differences in phospholipid content were paired with increased daptomycin resistance, which was thought to be due to increased membrane rigidity and changes in biophysical properties. As is common for studies of this type, the specific interactions between the antimicrobial agent and phospholipids within the cell membrane were not identified (see Fig. 1 for a summary of phospholipid headgroup structures). Therefore, the development of methodologies, such as those described herein, which enable the characterisation of molecular level interaction events with the cell membrane has become vital to inform the identification of antimicrobial therapeutic regimes.
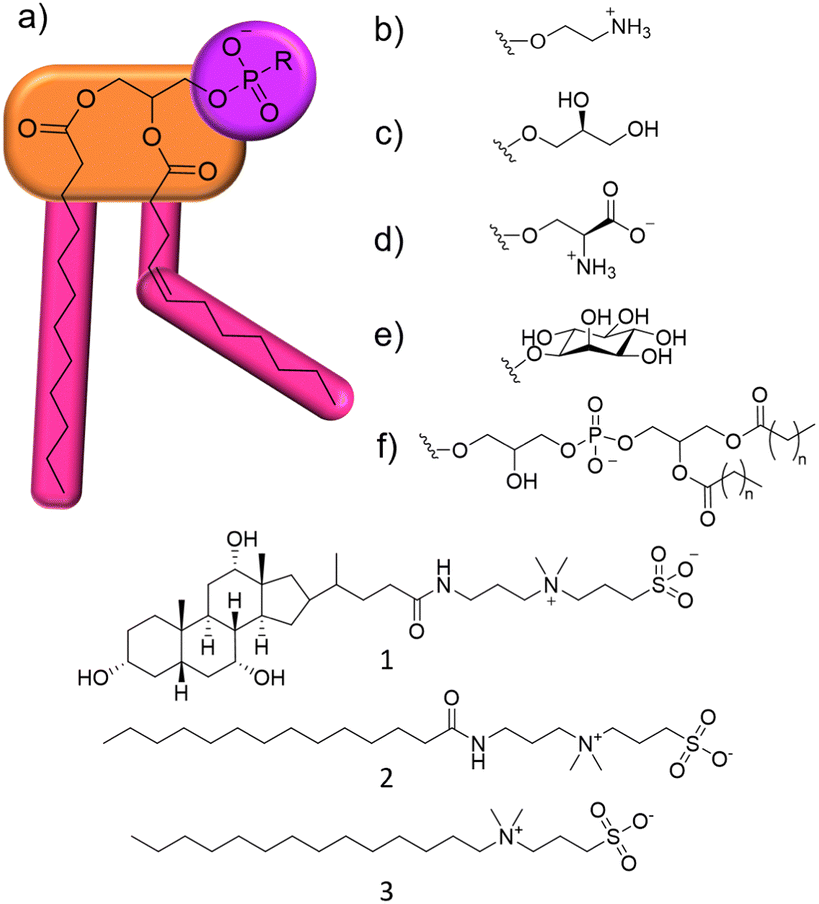 | ||
| Fig. 1 (a) General structure of a phospholipid and 1–3. Purple = hydrophilic phosphate headgroup, orange = glycerol linking group, pink = hydrophobic hydrocarbon residue, which can differ in chain length and degree of saturation. R groups: (b) phosphatidylethanolamine (PE); (c) phosphatidylglycerol (PG); (d) phosphatidylserine (PS); (e) phosphatidylinositol (PI); (f) cardiolipin (CL). | ||
Within this proof of principle study, we utilise a unique combination of solution state multinuclear NMR techniques, phospholipid nanodiscs produced from lipids obtained from target bacterial species, alongside standard antimicrobial efficacy studies and membrane fluidity experiments (Section S10, ESI†). This produces a body of data that enables us to understand the relationship between phospholipid membrane headgroup composition, molecular level membrane interaction events and antimicrobial activity against multiple microbial species taking advantage of widely accessible, automated, NMR based methodologies. This removes limitations such as the need for intrinsic molecular fluorescence and traditional bespoke experimental facilities. To demonstrate this, we target a series of three zwitterionic, sulfobetaine membrane disrupting agents 1–3 (Fig. 1),14 which have been known as detergents for biological use. We chose 1–3 because of their stepwise molecular structure modification and lack of evidence describing molecular level mode of action.15
Initially, the minimum inhibitory concentration (MIC – defined as the lowest concentration of a compound required to inhibit visual growth) was determined for 1–3 against two strains of Pseudomonas aeruginosa (P. aeruginosa), Table 1. This pathogen was selected as it is a microbe identified by the WHO as urgently requiring new treatment options.16 NCTC 13437 and PAO1 are both derived from clinical isolates with differing antimicrobial resistance profiles. Whilst PAO1 is sensitive to the majority of clinically relevant antibiotic classes, NCTC 13437 is resistant to multiple classes including fluoroquinolones, aminoglycosides, carbapenems, cephalosporins and colistin.
| Bacterial Strain | MIC (mM) | MIC50 (mM) | ||||
|---|---|---|---|---|---|---|
| 1 | 2 | 3 | 1 | 2 | 3 | |
| PAO1 | 12.5 | >100 | 100 | 3.12 | 1.56–50 | 0.4 |
| NCTC 13437 | 50 | >100 | 100 | 6.25 | 0.4 | 0.8 |
| Phospholipid headgroup composition (%) | ||||||
| PE | PG | PI | PS | CL | Other | |
| PAO1 | 73.1 | 19.9 | 4.3 | 2.7 | 0 | 0 |
| NCTC 13437 | 53.4 | 46.6 | 0 | 0 | 0 | 0 |
MIC values obtained against both strains of P. aeruginosa show this microorganism to be more susceptible to the effects of 1 over 2 and 3. However, when comparing MIC50 values, 3 is found to inhibit 50% growth at much lower concentrations when compared to 1, 0.8 mM and 6.25 mM respectively, against NCTC 13437. Interestingly, there is also some variation between the strains susceptibility for 1–3. For example, the MIC of 1 against PAO1 was 12.5 mM, whilst for NCTC 13437, the MIC of 1 increased to 50 mM.
To confirm the membrane disruption mechanism of action for 1–3 against PAO1 and NCTC 13437, an outer membrane permeabilisation assay was performed (Fig. 2, bar charts). Here, N-phenylnaphtylamine (NPN) acts as a fluorescent reporter. When the outer membrane is intact, this hydrophobic reporter is excluded from the microbial membrane. However, should the microbial membrane become disrupted, the NPN reporter is able to enter the membranes hydrophobic environment resulting in an increased fluorescence signal. We observe a definitive inverse relationship between membrane permeabilisation and percentage growth for 1, as shown in Fig. 2. This relationship was also observed for 2 and 3 however, the relationship is less obvious due to the unusual plateau effect associated with bacterial growth. Therefore, these data support the hypothesis that membrane disruption is the mechanism of action for 1–3, as previously reported.14 These findings are further supported by the results of scanning electron microscopy (SEM), Section 12 (ESI†), where holes in the bacterial membranes of NCTC 13437 were identified in the presence of 1–3.
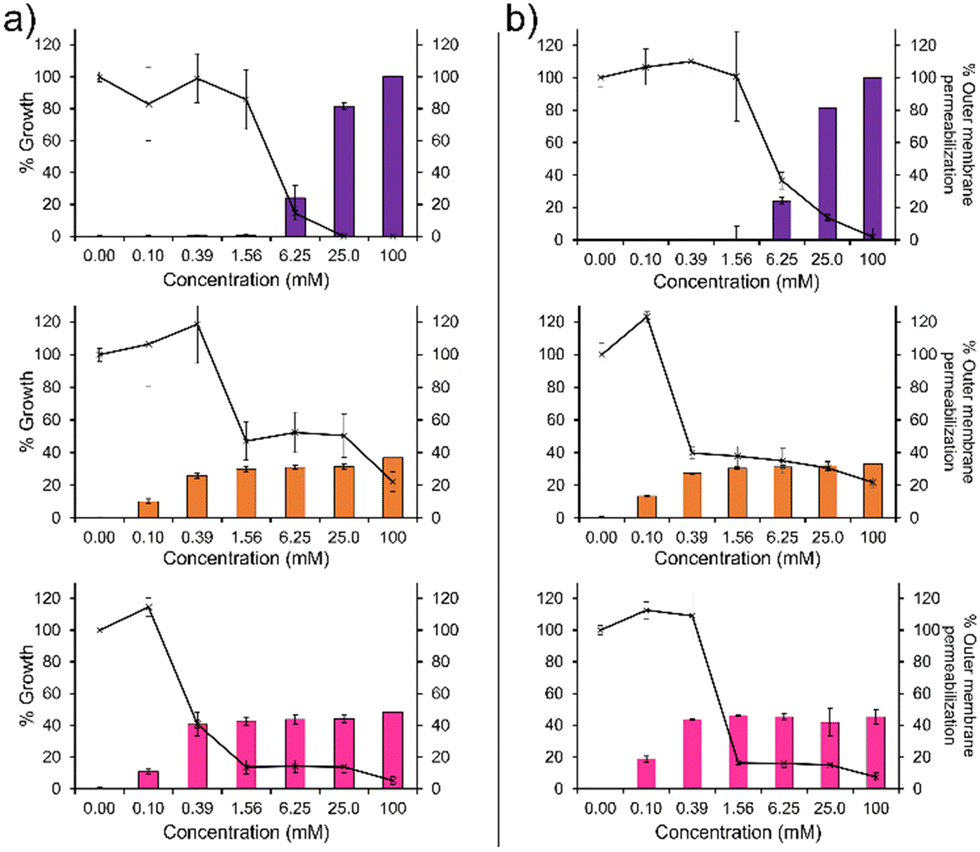 | ||
| Fig. 2 The outer membrane permeabilization (bar chart, right hand y-axis) of (a) PAO1 and (b) NCTC 13437 when exposed to 1 (purple), 2 (orange) and 3 (pink), compared to the percentage endpoint growth for PAO1 and NCTC 13437 after treatment with 1–3 (line graph, left hand y-axis) compared to an untreated bacterial control. | ||
In addition, 1 shows a correlation between increasing concentration and increasing percentage membrane permeabilization against both strains of P. aeruginosa. However, 2 and 3 show limited increases in percentage membrane permeabilization and growth at concentrations above 0.1 mM. We believe that this observation is due to the critical aggregation concentration (CAC) of 2 and 3, 0.1 mM17 and 0.4 mM18 respectively. The CAC is defined as the concentration at which any additional compound added to a solution will result in the formation of higher order self-associated aggregates, e.g. micelles.19 Therefore, at concentrations above CAC, free 1–3 will become incorporated into aggregated species. In the case of 2 and 3, we believe this limits the concentration of compound available to interact with the microbial membranes and thus limits the activity of these agents at concentrations above this value, explaining the differences in antimicrobial efficacy identified from MIC as opposed to MIC50 values (Table 1). Compound 1 exhibits a much higher CAC at 6.4 mM20 and thus the antimicrobial activity of this compound is less affected by increasing concentration.
To determine if there was any difference in the total phospholipid membrane headgroup composition of these two strains of P. aeruginosa, the membranes were extracted,21 analysed using 2D 1H-31P HSQC NMR experiments, and compared to previously published control data.22 Here we observe clear differences in the phospholipid headgroup composition of the membranes extracted from wild type PAO1 and multidrug resistant NCTC 13437 (Table 1), meaning that changes in the phospholipid headgroup composition of microbial membranes could be a cause for, or a result of, the AMR observed for the NCTC 13437 strain of P. aeruginosa. For example, the presence of PS (2.7%) and PI (4.3%) could only be identified with PAO1. However, the greatest differences in total membrane phospholipid headgroup composition were identified when considering the percentage of PE (∼20% lower for NCTC 13437) and PG (>25% higher for NCTC 13437) present within the membranes of these two bacterial strains. These substantial differences in phospholipid membrane headgroup composition support a hypothesis that differences in MIC values obtained for detergents 1–3 could be due to changes in phospholipid membrane headgroup composition.
To test the validity of this hypothesis, and confirm if alterations in phospholipid headgroup composition alter the molecular interaction events of 1–3, we performed a series of 1H NMR phospholipid nanodisc experiments. To date, phospholipid nanodiscs have been mainly used to enable the study of membrane bound proteins under native conditions.23–25 However, we have also recently expanded the use of these systems to enable the study of small molecule-phospholipid membrane interaction events, adapting traditional 1H NMR titration based methodologies (Section S7–S9, ESI†).26–28 Absolute integration of 1H NMR resonances, corresponding to the different 1H environments of 1–3, and subsequent fitting of these data to Hill plot kinetics using Origin 2018 software,28,29 enabled the effective concentration of nanodisc needed to coordinate 50% of 1–3 (EC50) at 100 μM to be determined (Fig. 3). Put simply the greater the 1/EC50 the greater the affinity of 1–3 for the phospholipid nanodisc. When comparing EC50 values generated from different residues of the same molecules, we may gain some insight into the mode of action for a specific agent. For example, the sterol head group of 1 (Fig. 3a, resonances d–f) was shown to exhibit a greater affinity towards both types of phospholipid nanodiscs, compared to the polar tail group (Fig. 3a, resonances a–c). Thus, we hypothesise that the lipophilic sterol group is able to embed itself into the nanodisc, leaving the tail free to rotate within the solution. In addition, we observed increased 1/EC50 values for 1 against nanodiscs derived from PAO1 membranes, indicating a stronger interaction, which correlates with increased antimicrobial efficacy for 1 against this same strain of P. aeruginosa and changes in phospholipid headgroup composition (Table 1).
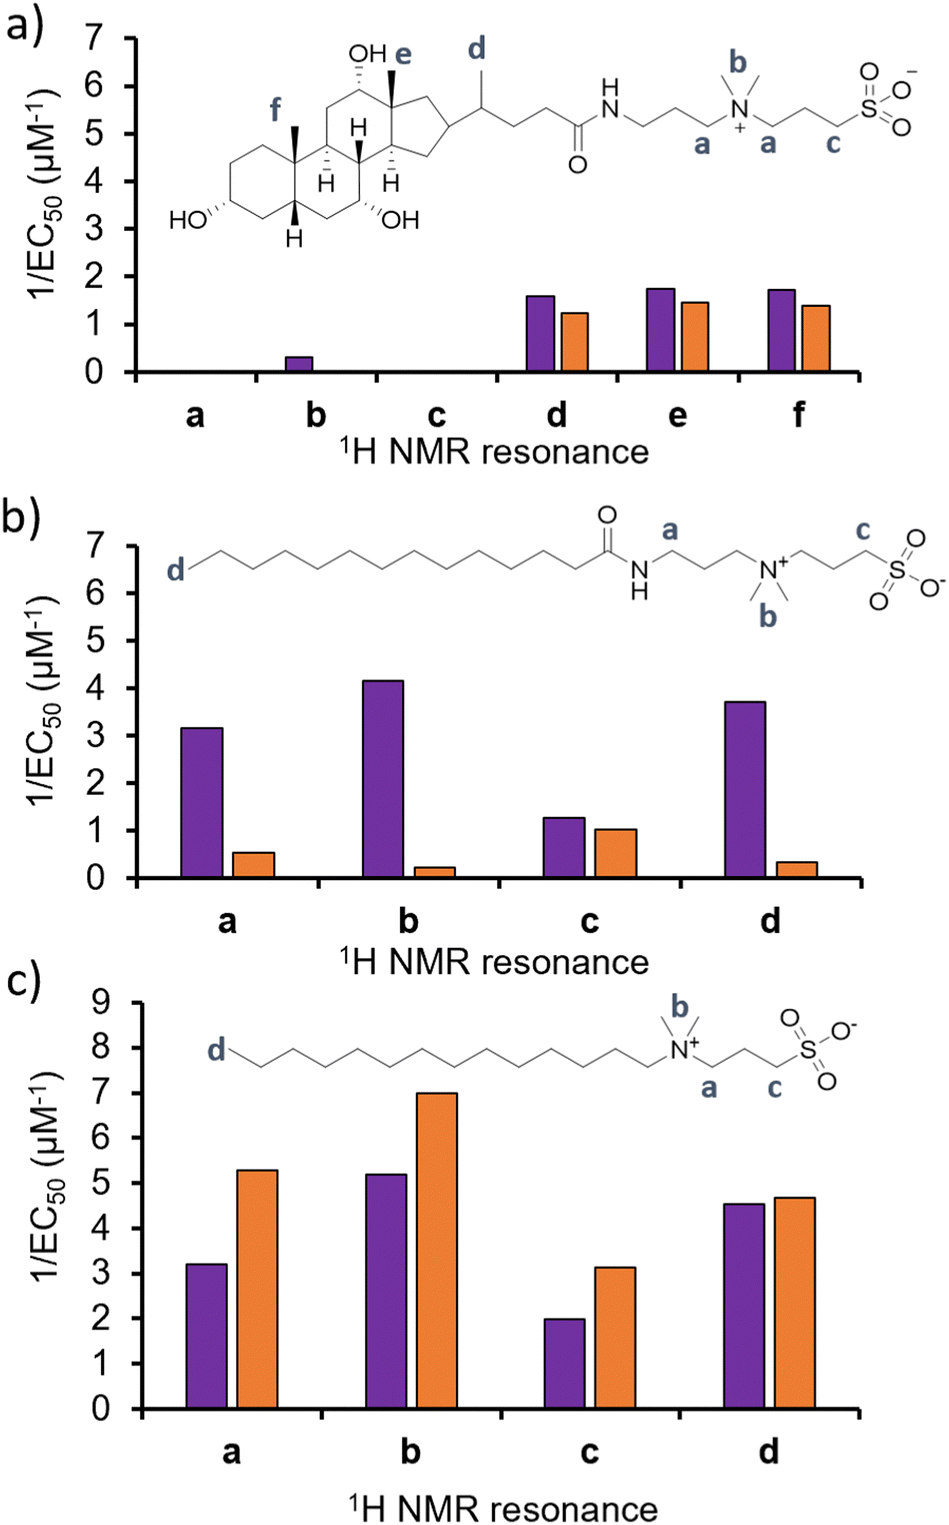 | ||
| Fig. 3 Graphs summarizing 1/EC50 (μM−1) values obtained from the fitting of (a) 1, (b) 2 or (c) 3 nanodisc titration data to Hill Plot kinetics using Origin 2018 software.29Vmax was fixed to 100%. Where co-ordination did not reach 50%, data was not fitted. Purple = results from PAO1 nanodiscs 1H NMR titration studies, orange = results from NCTC 13437 nanodisc 1H NMR titration studies. The Hill coefficient (n) produced through the fitting of this data provides a measure of the cooperative/non-cooperative nature of binding events.30 As shown in Table S2–S4 and Section S9 (ESI†), the Hill coefficients generated from these data sets exhibit a value n > 1 in general, providing evidence that these phospholipid bilayer binding events are co-operative. Fitting these data to a simple binding isotherm was not possible due to the suspected complexity of interactions present between 1–3 and nanodiscs derived from PAO1 and NCTC 13437. | ||
With the sterol group in 1 substituted for the alkyl group in 2 and 3, the disparity in interaction between the two ends of the antimicrobial agent decreases. The step-wise modification between 2 and 3 shows that the amide linker of 2 is responsible for the specificity of this detergent molecule for nanodiscs formed from PAO1 over NCTC 13437 membranes, and therefore believe that introduction of this functionality results in decreased affinity for PG phospholipids. However, there is no longer a correlation observed between increased antimicrobial interaction and increased antimicrobial efficacy, attributing this effect to 1 only, pointing to differing modes of action for this group of three antimicrobial agents.
In conclusion, we establish the efficacy of membrane active antimicrobial agents, 1–3, against different strains of the “ESKAPE” pathogen P. aeruginosa, adding molecular level insight to the mode of antimicrobial action for these agents for the first time. We show differences in the phospholipid membrane headgroup composition of wild type PAO1 and multidrug resistant clinical isolate NCTC 13437 and, through the incorporation of these phospholipids into nanodiscs, observe molecular level antimicrobial co-ordination events for 1–3. This leads us to hypothesise that the sterol unit of 1 embeds into the nanodisc, leaving the hydrophilic tail substituent free to interact with the solution environment. Interestingly, the increased strength of the sterol headgroup interaction events was also found to correlate with increased antimicrobial efficacy. Finally, we also suggest that decreased CAC may also limit the antimicrobial efficacy of an agent at concentrations above this value, further demonstrating the need to determine both MIC and MIC50 values for membrane active amphiphilic agents such as 1–3, dependent on CAC. These findings support the need for ongoing investigations in this area, initially identifying and then quantifying the role changes in phospholipid headgroup composition plays in AMR.
KLFH: investigation; validation; writing – original draft, review & editing. HT: investigation. JLOR, GST and JMS: investigation; validation; writing – review & editing. CKH and JRH: conceptualization; funding acquisition; project administration; supervision; writing – original draft, review & editing.
This work was supported by JH's UKRI Future Leaders Fellowship (MR/T020415/1), the University of Kent and UKHSA.
Conflicts of interest
There are no conflicts to declare.Notes and references
- C. J. Murray, K. S. Ikuta, F. Sharara, L. Swetschinski, G. Robles Aguilar, A. Gray, C. Han, C. Bisignano, P. Rao, E. Wool, S. C. Johnson, A. J. Browne, M. G. Chipeta, F. Fell, S. Hackett, G. Haines-Woodhouse, B. H. Kashef Hamadani, E. A. P. Kumaran, B. McMani-gal, R. Agarwal, S. Akech, S. Albertson, J. Amuasi, J. Andrews, A. Aravkin, E. Ashley, F. Bailey, S. Baker, B. Basnyat, A. Bekker, R. Bender, A. Bethou, J. Bielicki, S. Boonkasidecha, J. Bukosia, C. Car-valheiro, C. Castañeda-Orjuela, V. Chansamouth, S. Chaurasia, S. Chiurchiù, F. Chowdhury, A. J. Cook, B. Cooper, T. R. Cressey, E. Criollo-Mora, M. Cunningham, S. Darboe, N. P. J. Day, M. De Luca, K. Dokova, A. Dramowski, S. J. Dunachie, T. Eckmanns, D. Eibach, A. Emami, N. Feasey, N. Fisher-Pearson, K. Forrest, D. Garrett, P. Gastmeier, A. Z. Giref, R. C. Greer, V. Gupta, S. Haller, A. Haselbeck, S. I. Hay, M. Holm, S. Hopkins, K. C. Iregbu, J. Jacobs, D. Jarovsky, F. Javanmardi, M. Khorana, N. Kissoon, E. Kobeissi, T. Kostyanev, F. Krapp, R. Krumkamp, A. Kumar, H. H. Kyu, C. Lim, D. Limmathu-rotsakul, M. J. Loftus, M. Lunn, J. Ma, N. Mturi, T. Munera-Huertas, P. Musicha, M. M. Mussi-Pinhata, T. Nakamura, R. Nanavati, S. Nangia, P. Newton, C. Ngoun, A. Novotney, D. Nwakanma, C. W. Obiero, A. Olivas-Martinez, P. Olliaro, E. Ooko, E. Ortiz-Brizuela, A. Y. Peleg, C. Perrone, N. Plakkal, A. Ponce-de-Leon, M. Raad, T. Ramdin, A. Riddell, T. Roberts, J. V. Robotham, A. Roca, K. E. Rudd, N. Russell, J. Schnall, J. A. G. Scott, M. Shivamallappa, J. Sifuentes-Osornio, N. Steenkeste, A. J. Stewardson, T. Stoeva, N. Tasak, A. Thaiprakong, G. Thwaites, C. Turner, P. Turner, H. R. van Doorn, S. Velaphi, A. Vongpradith, H. Vu, T. Walsh, S. Waner, T. Wangrang-simakul, T. Wozniak, P. Zheng, B. Sartorius, A. D. Lopez, A. Stergachis, C. Moore, C. Dolecek and M. Naghavi, Lancet, 2022, 399, 629–655 CrossRef CAS PubMed.
- S. Davies, J. Farrar, J. Rex, L. White, R. Murry and J. O’Neill, Antimicrobial Resistance: Tackling a crisis for the health and wealth of nations, 2014.
- E. D. Brown and G. D. Wright, Nature, 2016, 529, 336–343 CrossRef CAS PubMed.
- K. Talkington, C. Shore and P. Kothari, Pew Charitable Trusts, Philadelphia USA, 2016, vol. 1, pp. 33–39 Search PubMed.
- A. York, Nat. Rev. Microbiol., 2020, 18, 63 Search PubMed.
- C. P. J. Vendrik, J. J. Bergers, W. H. De Jong and P. A. Steerenberg, Cancer Chemother. Pharmacol., 1992, 29, 413–429 CrossRef CAS PubMed.
- K. L. F. Hilton, C. Manwani, J. E. Boles, L. J. White, S. Ozturk, M. D. Garrett and J. R. Hiscock, Chem. Sci., 2021, 12, 13273–13282 RSC.
- B. Chertok, M. J. Webber, M. D. Succi and R. Langer, Mol. Pharmaceutics, 2013, 10, 3531–3543 CrossRef CAS PubMed.
- G. Tiwari, R. Tiwari, B. Sriwastawa, L. Bhati, S. Pandey, P. Pandey and S. K. Bannerjee, Int. J. Pharm. Invest., 2012, 2, 2–11 CrossRef PubMed.
- Y. Ma, K. Gao, H. Yu, W. Liu, Y. Qin, R. Xing, S. Liu and P. Li, Carbohydr. Polym., 2021, 261, 117821 CrossRef CAS PubMed.
- H. Cheng, R.-R. Zheng, G.-L. Fan, J.-H. Fan, L.-P. Zhao, X.-Y. Jiang, B. Yang, X.-Y. Yu, S.-Y. Li and X.-Z. Zhang, Biomaterials, 2019, 188, 1–11 CrossRef CAS PubMed.
- M. Rucevic, D. Hixson and D. Josic, Electrophoresis, 2011, 32, 1549–1564 CrossRef CAS PubMed.
- N. N. Mishra, A. S. Bayer, T. T. Tran, Y. Shamoo, E. Mi-leykovskaya, W. Dowhan, Z. Guan and C. A. Arias, PLoS One, 2012, 7, e43958 CrossRef CAS PubMed.
- M. Nazari, M. Kurdi and H. Heerklotz, Biophys. J., 2012, 102, 498–506 CrossRef CAS PubMed.
- D. Wieczorek, D. Gwiazdowska, K. Staszak, Y.-L. Chen and T.-L. Shen, J. Surfactants Deterg., 2016, 19, 813–822 CrossRef CAS.
- WHO publishes list of bacteria for which new antibiotics are urgently needed, https://www.who.int/news/item/27-02-2017-who-publishes-list-of-bacteria-for-which-new-antibiotics-are-urgently-needed, (accessed 27 January 2023).
- M. G. D’Andrea, C. C. Domingues, S. V. P. Malheiros, F. G. Neto, L. R. S. Barbosa, R. Itri, F. C. L. Almeida, E. de Paula and M. L. Bianconi, Langmuir, 2011, 27, 8248–8256 CrossRef PubMed.
- P. Di Profio, R. Germani, A. Fontana and V. Canale, J. Mol. Liq., 2019, 278, 650–657 CrossRef CAS.
- A. Piñeiro, X. Banquy, S. Pérez-Casas, E. Tovar, A. García, A. Villa, A. Amigo, A. E. Mark and M. Costas, J. Phys. Chem. B, 2007, 111, 4383–4392 CrossRef PubMed.
- A. Chattopadhyay and K. g Harikumar, FEBS Lett., 1996, 391, 199–202 CrossRef CAS PubMed.
- J. Folch, M. Lees and G. H. Sloane Stanley, J. Biol. Chem., 1957, 226, 497–509 CrossRef CAS PubMed.
- G. Townshend, G. S. Thompson, L. J. White, J. R. Hiscock and J. L. Ortega-Roldan, Chem. Commun., 2020, 56, 4015–4018 RSC.
- T. J. Knowles, R. Finka, C. Smith, Y.-P. Lin, T. Dafforn and M. Overduin, J. Am. Chem. Soc., 2009, 131, 7484–7485 CrossRef CAS PubMed.
- S. C. Lee, T. J. Knowles, V. L. G. Postis, M. Jamshad, R. A. Parslow, Y. Lin, A. Goldman, P. Sridhar, M. Overduin, S. P. Muench and T. R. Dafforn, Nat. Protoc., 2016, 11, 1149–1162 CrossRef CAS PubMed.
- M. Orwick-Rydmark, J. E. Lovett, A. Graziadei, L. Lind-holm, M. R. Hicks and A. Watts, Nano Lett., 2012, 12, 4687–4692 CrossRef CAS PubMed.
- H. Y. Carr and E. M. Purcell, Phys. Rev., 1954, 94, 630–638 CrossRef CAS.
- S. Meiboom and D. Gill, Rev. Sci. Instrum., 1958, 29, 688–691 CrossRef CAS.
- J. E. Boles, C. Bennett, J. Baker, K. L. F. Hilton, H. A. Kotak, E. R. Clark, Y. Long, L. J. White, H. Yuk Lai, C. K. Hind, J. Mark Sutton, M. D. Garrett, A. Cheasty, J. L. Ortega-Roldan, M. Charles, C. J. E. Haynes and J. R. Hiscock, Chem. Sci., 2022, 13, 9761–9773 RSC.
- OriginPro (version 9.9.0.225), OriginLab Corporation, Northhampton, MA, USA.
- S. Goutelle, M. Maurin, F. Rougier, X. Barbaut, L. Bour-guignon, M. Ducher and P. Maire, Fundam. Clin. Pharmacol., 2008, 22, 633–648 CrossRef CAS PubMed.
Footnote |
| † Electronic supplementary information (ESI) available: This includes experimental details, materials and methods, DLS data, microscopy data, multinuclear NMR spectroscopy data, nanodisc characterisation data, 1H NMR spectroscopy titration data, MIC and MIC50 data, membrane permeabilization and fluidity data. See DOI: https://doi.org/10.1039/d3cc02320f |
| This journal is © The Royal Society of Chemistry 2023 |