 Open Access Article
Creative Commons Attribution 3.0 Unported Licence
Sensitive quantification of short-chain fatty acids combined with global metabolomics in microbiome cultures†
Weifeng
Lin
 a,
Fabricio Romero
García
b,
Elisabeth Lissa
Norin
b,
Didem
Kart
b,
Lars
Engstrand
b,
Juan
Du
 b and
Daniel
Globisch
 *ab
*ab
aDepartment of Chemistry – BMC, Science for Life Laboratory, Uppsala University, Uppsala 75124, Sweden. E-mail: Daniel.globisch@scilifelab.uu.se
bCentre for Translational Microbiome Research (CTMR), Department of Microbiology, Tumor and Cell Biology, Karolinska Institutet, Stockholm, Sweden
First published on 19th April 2023
Abstract
The microbiome has been identified to have a key role for the physiology of their human host. One of the major impacts is the clearance of bacterial pathogens. We have now developed a chemoselective probe methodology for the absolute quantification of short-chain fatty acids at low nM concentrations, with high reproducibility and spiked isotope labelled internal standards. Immobilization to magnetic beads allows for separation from the matrix and the tagged metabolites upon bioorthogonal cleavage can be analyzed via UHPLC-MS. The major advantage of our sensitive method is the simple combination with global metabolomics analysis as only a small sample volume is required. We have applied this chemical metabolomics strategy for targeted SCFA analysis combined with global metabolomics on gut microbiome co-cultures with Salmonella and investigated the effect of antibiotic treatment.
The critical role of the gut microbiota for human health has been manifested in the past few decades.1 The gut microbiota is considered as an additional organ that modulates human physiology via the production of diverse metabolites. Short-chain fatty acids (SCFAs), defined as a class of aliphatic carboxylic acids with less than six carbons, are one major bacterial metabolite class that has been extensively investigated. Although SCFAs are products of several metabolic pathways, the main location is the colon as it requires the metabolism of specific commensal bacteria.2 Acetate, propionate and butyrate are among the main SCFAs in mammals and are bioproducts of the gastrointestinal fermentation of dietary fibers and resistant starches.3 The function of SCFAs is not only energy supply but also the regulation of T regulatory (Treg) colonies. In addition, SCFAs have been identified to exert a crucial physiological impact on several organs including the brain. Plasma and fecal SCFA levels were identified as biomarkers in chronic kidney disease (CKD) patients.4,5 Importantly, the level of SCFAs in the liver or blood is much lower than in the intestine.6 Furthermore, SCFA levels can be reduced by antibiotic treatment due to the disruption of the gut microbiome. Thus, an analytical method that enables a highly reproducible and sensitive quantification of SCFAs in a broad concentration range using limited volumes of samples is required for biological and clinical research for blood and microbiota metabolism.
The quantification of biological SCFAs is typically performed using nuclear magnetic resonance (NMR) or mass spectrometry (MS).7 Due to their small molecular weight and volatility, these metabolites are commonly derivatized to overcome the limitations of SCFA detection. Siloxyl ether, aniline, nitrophenylhydrazones (NPH), and 4-bromo-N-methylbenzylamine (4-BNMA) have been utilized to conjugate SCFAs, which improves their ionizability and thus MS-based analysis.8–11 However, in order to precisely quantify the SCFAs, internal standards for each metabolite are needed to prepare the calibration curves. The ideal internal standard is an isotopically labelled analogue of the corresponding SCFA.12 Unfortunately, not all isotope labelled internal standards are commercially available or they are expensive. Most studies have thus used other internal standards with a similar chemical structure to quantify different SCFAs.9,11 This strategy can be biased in the precision and accuracy of the quantification analysis. Additionally, these approaches using derivatisation reagents usually suffer from ion suppression due to the interference by the sample matrix and the use of excess coupling reagents. Many biological samples are precious and many studies are limited by the amount of biological sample volume.13 A highly sensitive quantification method would be beneficial to reduce the limit of quantification (LOQ) and the sample volume required. Thus, a method that is feasible for the quantification of SCFAs within a broad range of concentrations (femtomole to micromole) to readily obtain isotopic analogue-based internal standards is still missing.
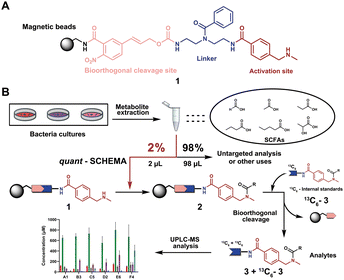
We have recently introduced a new method, termed Quantitative Sensitive CHEmoselective MetAbolomics (quant-SCHEMA) using magnetic bead-immobilized chemoselective probes for mass spectrometric analysis of carbonyl-containing metabolites using alkoxyamine as the reactive site for selective reaction with carbonyls from different human samples.14 Due to the high importance of SCFAs, we have now developed a precise quantification method for this compound class by activating our chemoselective probes with N-methylbenzylamine as a new carboxylic acid chemoselective reactive moiety (1). The chemoselective probe design for reaction with SCFAs has three advantages: (i) chemical synthesis of all corresponding 13C6-labelled SCFA internal standards; (ii) a tag to enable analysis of volatile SCFAs via UHPLC-MS analysis; and (iii) the magnetic separation removes the matrix background and allows for highly sensitive analysis (Fig. 1A).
 | ||
| Fig. 1 General overview of this methodology. (A) Chemoselective probe's chemical structure. (B) General workflow in this chemical probe utilization for SCFA quantification. | ||
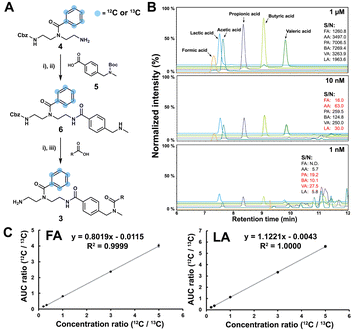
As a proof-of-concept, we sought to develop this probe for quantification of SCFAs in an isolated healthy microbiome mixture co-cultured with the pathogen Salmonella. The design of our probe allows for straightforward activation through acidic deprotection of Boc in the immobilized probe (10/Scheme S1, ESI†). The activated chemical probe was incubated with a limited amount of the sample extract (2 μL) to react with the SCFAs using peptide coupling conditions. The immobilized probes with captured SCFAs were then magnetically separated from the complex sample matrix to obtain cleaner chromatograms (Fig. S1, ESI†).15–17 This separation step has an additional major advantage as the solvent of analytes from the probe treatment and the standard solution for the calibration curves are highly similar, which further improves the quantification accuracy. All six synthetic 13C6-labelled internal standards 3a–f* were spiked into the probe solution before the bioorthogonal cleavage of p-nitrocinnamyloxy-carbonyl (Noc) to release the SCFA conjugates (Fig. 3A).16 The mixture of SCFA conjugates 3a-f and their corresponding internal standards 3a–f* were separated from the magnetic beads and analysed via UHPLC-MS analysis (Fig. 1B).
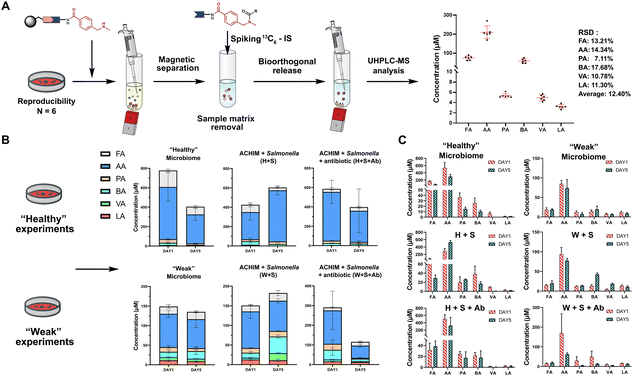
The SCFA conjugates and their 13C6-labelled SCFA conjugates for the calibration curve were synthesized from a simplified probe. Synthetic intermediate 4 was coupled with 4-(Boc-aminomethyl)benzoic acid 5 using the common amide coupling reagents HBTU, HOBT and DIPEA (Fig. 2A). Our optimized conjugation conditions allow for 66% to quantitative conversion of SCFAs. The simplified probe was then treated under acidic conditions to remove the Boc protecting group for activation. Activated probe 6 was then coupled with formic acid (FA), acetic acid (AA), propanoic acid (PA), butyric acid (BA), valeric acid (VA), and lactic acid (LA) using amide coupling conditions to obtain the corresponding SCFA conjugates 3a–f and their corresponding 13C6-labelled conjugates 3a–f* (Fig. 2A and Scheme S2, ESI†). These optimized conditions were also applied for the immobilized probe experiments in biological samples. After the synthesis of these SCFA conjugates, they were prepared as a series of concentration solutions to determine the six LOD/LOQ values and the six calibration curves. Serial dilution for each SCFA conjugate was prepared to determine the signal-to-noise ratios for these SCFA conjugates (Fig. 2B). We initially determined the rough LOQ for these analytes to either be 10 nM (50 femtomole for FA, AA, and LA) or 1 nM (5 femtomole for PA, BA, and VA/Table S1, ESI†). The calibration curves were prepared with near perfect linearity and the detailed LOD and LOQ values were determined that are comparable to other MRM-based methods (R2 > 0.9994; Fig. 2C, Fig. S2 and Tables S2, S3, ESI†).14,18,19 In addition, the linear concentration range was determined to be between 1 nM and 1000 nM (Fig. S3, ESI†). The method was then validated by quantifying an identical bacterial sample six times to determine its reproducibility with relative standard deviations (RSD) between 7.1% and 17.7%. These highly reproducible results (average RSD as 12.40%) also demonstrate the robustness of this new method (Fig. 3A). A reduction of the signal of 68.3% to 83.9% was determined by quantifying the same sample four times with and without the sample matrix. We also observed a lower reproducibility of the matrix effect (RSD = 23.6%) in comparison to analysis without matrix (RSD = 8.4%; Fig. S4 and Tables S4, S5, ESI†).
 | ||
| Fig. 3 SCFA quantification. (A) Quantification of SCFAs in the random identical sample 6 times to validate the method reproducibility (See also Table S8, Scheme S3, ESI†). Bioorthogonal cleavage conditions: triphenylphosphine, dimethyl-barbituric acid, and Pd(OAc)2 in THF for 5 hours. (B) Total SCFA quantification in biological samples and (C) individual SCFA values. Each condition was analysed as triplicates. Error bars are standard deviation. | ||
One of the major advantages of our method is the high sensitivity and thus a low need for the investigated biological sample, which is compatible with global metabolomics analysis. Our method only requires 2% of the sample extract to perform this sensitive SCFA quantification and the remaining sample volume can be utilized for conventional global metabolomics analysis. Herein, we have focused our SCFA quantification in co-cultures of anaerobically cultivated human intestinal microflora (ACHIM) and Salmonella for which we only required 2 μL of the sample. Salmonella infection is one of the main causes of food-borne diarrheal diseases. ACHIM has been identified as a powerful model system that represents the healthy human gut microbiota and demonstrated its ability to inhibit Salmonella growth.20 However, the small molecule metabolites responsible for this effect are yet unknown.
Herein, quant-SCHEMA was utilized for 2 μL of the bacterial sample to investigate how SCFAs are altered between the healthy microbiome (H), a co-culture of the healthy microbiome and Salmonella (H + S), and the co-culture of the healthy microbiome with Salmonella in the presence of the antibiotic spectinomycin (H + S + Ab) at two different time points (day 1 and day 5). We have selected an antibiotic resistant Salmonella strain as a realistic example for the disruption of the healthy microbiome after antibiotic treatment, which has been identified to alter SCFA concentrations.21 In addition, a diluted ACHIM culture is also tested and referred to as a “weak” gut microbiome together with less Salmonella to evaluate our method in a disrupted gut microbiome with less density of bacteria and lower concentration of SCFA (Fig. 3B). The antibiotic treated samples (H + S + Ab) were observed with a significant decrease of the total SCFA levels on day 5 compared to day 1 regardless of the healthy or the weak gut microbiome (Fig. 3B). This reduced total SCFA production is consistent with literature reports of antibiotic treatment and validates our method. Our results also reveal that acetate, propanoate and butyrate are mostly altered in cultures treated with spectinomycin. Moreover, the total SCFA concentrations in the microbiome (H) were slightly decreased after 5 days culture compared to an increase in the ones co-cultured with Salmonella, which was observed in the healthy and the weak gut microbiome. This observation correlates well with reports that the production of SCFAs by the healthy microbiome has been linked to the starvation of pathogens through a higher consumption of sugars.22 This function is hindered through the antibiotic treatment, which is further supported by the increased Salmonella colony forming units (CFU) when the antibiotic is present in the gut microbiome cultures (Fig. S5, ESI†).
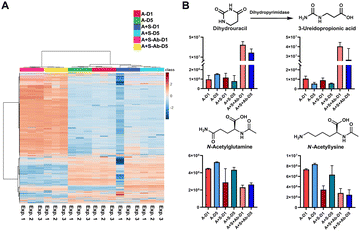
Based on the successful SCFA experiments using a small amount of the sample extract, we then utilized the remaining sample for global mass spectrometry-based metabolomics.23,24 We have determined the main metabolites altered in the three groups of the healthy microbiome, the Salmonella co-culture (H + S) and the antibiotic administration culture (H + S + Ab). The internal standards spiked into each sample for quality control demonstrate the stability of the mass spectrometry method with less than 10% of RSD in the QC samples (Table S6, ESI†). The multivariate analysis and the heatmap revealed that the antibiotic treatment has strongly affected the metabolite composition (Fig. 4A and Fig. S6, ESI†). The chemical structures for 44 metabolites of the Top100 features with the highest statistical significance were determined through metabolite annotation with the Human Metabolome Database (HMDB) (Fig. S7, ESI†).25 A total of 13 metabolites were validated at the highest confidence level through comparison with reference standard compounds.26 Furthermore, two microbial metabolites 3-phenyllactic acid and indoleacrylic acid were identified among these metabolites (Table S7, ESI†).27,28 Interestingly, these two metabolites were significantly increased after antibiotic administration. Similarly, 2-methylmalonic acid has been reported as a metabotoxin and was increased in the antibiotic treated group, which could be associated with side effects for the human host of antibiotic administration.29 The two catabolism products of the nucleoside uridine, dihydrouracil and 3-ureidopropionic acid, both have similar tendencies in the investigated samples (Fig. 4B). Two N-acetylated amino acids were both reduced, while the two amino acids valine and tyrosine were found to be significantly increased after Streptomycin treatment (Fig. 4B). The reduction of the N-acetylated amino acids after antibiotic treatment correlates with the decrease of acetic acid, which is required for the biosynthesis of the acetyl-donor Acetyl-CoA.30 These findings are novel and indicate that our method is of great value in finding new bioactive compounds against pathogens, especially for antibiotic resistant bacteria. This demonstrates the powerful application of our combined quantification method of volatile metabolites and through standard global metabolomics analysis.
 | ||
| Fig. 4 Standard global metabolomics analysis: (A) Heatmap; (B) Bar charts and chemical structures of validated metabolites. Error bars: Standard deviation. | ||
In summary, we have developed a novel method at the interface of chemistry and biology for the precise quantification of short chain fatty acids with high sensitivity. This method only requires 2% of the global metabolomics sample volume to save precious biological samples and to additionally obtain the SCFA concentrations. To demonstrate this major advantage, we have additionally performed a conventional global metabolomics analysis using the remaining sample extract. Our quantitative methodology has been validated by a series of analytical experiments including linearity, limit of quantification, reproducibility, and a positive control experiment in the presence of an antibiotic. We have also synthesized the corresponding six 13C6-labelled SCFA conjugates as internal standards, which are now available for routine quantification experiments. The designed synthetic route of 13C6-labelled conjugates allows for the synthesis of the corresponding internal standard for any desired carboxylic acid metabolite as our method does not require a commercially available isotopically labelled standard. As a proof-of-concept study for our methodology, we have successfully and precisely quantified the concentrations of SCFAs in 36 bacterial samples and performed a metabolomics analysis in parallel to identify metabolic alterations in these bacterial co-cultures. This parallel targeted and global analysis is possible due to a required low sample volume for the SCFA quantification. We envisage that these quantitative chemoselective probes will be applied for general use in any biomedical studies for the quantification of SCFAs as only small sample volumes are required. This chemical metabolomics strategy can be coupled with other analyses of low quantity samples.
This study was funded by the Swedish Research Council (2016-04423, 2020-04707), the Science for Life Laboratory Starting Grant (SLL 2016/5) and the Swedish Cancer Foundation (22 2449 Pj) to D. G. J. D. was supported by the Swedish Research Council (2021-01683, 2021-06112) and SSF [ICA16-0050].
Conflicts of interest
There are no conflicts to declare.Notes and references
- T. S. B. Schmidt, J. Raes and P. Bork, Cell, 2018, 172, 1198–1215 CrossRef CAS PubMed.
- D. J. Morrison and T. Preston, Gut Microbes, 2016, 7, 189–200 CrossRef PubMed.
- B. Dalile, L. Van Oudenhove, B. Vervliet and K. Verbeke, Nat. Rev. Gastroenterol. Hepatol., 2019, 16, 461–478 CrossRef PubMed.
- R. Davies, Clin. Kidney J., 2018, 11, 694–703 CrossRef CAS PubMed.
- A. Jadoon, A. V. Mathew, J. Byun, C. A. Gadegbeku, D. S. Gipson, F. Afshinnia and S. Pennathur, Am. J. Nephrol., 2018, 48, 269–277 CrossRef PubMed.
- D. Parada Venegas, et al. , Front Immunol, 2019, 10, 277 CrossRef PubMed.
- J. Cai, et al. , Anal. Chem., 2017, 89, 7900–7906 CrossRef CAS PubMed.
- D. J. Trader and E. E. Carlson, Org. Lett., 2011, 13, 5652–5655 CrossRef CAS PubMed.
- C. Y. Weng, et al. , Anal. Chem., 2020, 92, 14892–14897 CrossRef CAS PubMed.
- J. C. Chan, D. Y. Kioh, G. C. Yap, B. W. Lee and E. C. Chan, J. Pharm. Biomed. Anal., 2017, 138, 43–53 CrossRef CAS PubMed.
- B. J. Marquis, H. P. Louks, C. Bose, R. R. Wolfe and S. P. Singh, Chromatographia, 2017, 80, 1723–1732 CrossRef CAS PubMed.
- D. Globisch, et al. , Angew. Chem., Int. Ed., 2011, 50, 9739–9742 CrossRef CAS PubMed.
- N. T. Holland, M. T. Smith, B. Eskenazi and M. Bastaki, Mutat. Res., 2003, 543, 217–234 CAS.
- W. Lin, L. P. Conway, M. Vujasinovic, J. M. Lohr and D. Globisch, Angew. Chem., Int. Ed., 2021, 60, 23232–23240 CrossRef CAS PubMed.
- W. Lin, L. P. Conway, A. Block, G. Sommi, M. Vujasinovic, J. M. Lohr and D. Globisch, Analyst, 2020, 145, 3822–3831 RSC.
- N. Garg, et al. , Angew. Chem., Int. Ed., 2018, 57, 13805–13809 CrossRef CAS PubMed.
- L. P. Conway, N. Garg, W. Lin, M. Vujasinovic, J. M. Lohr and D. Globisch, Chem. Commun., 2019, 55, 9080–9083 RSC.
- M. J. McKay, et al. , J. Chromatogr. B: Anal. Technol. Biomed. Life Sci., 2023, 1217, 123618 CrossRef CAS PubMed.
- J. Han, K. Lin, C. Sequeira and C. H. Borchers, Anal. Chim. Acta, 2015, 854, 86–94 CrossRef CAS PubMed.
- Y. O. O. Hu, et al. , mSystems, 2018, 3, e00119–18 CrossRef CAS PubMed.
- J. Guinan, S. Wang, T. R. Hazbun, H. Yadav and S. Thangamani, Sci. Rep., 2019, 9, 8872 CrossRef PubMed.
- N. Kamada, G. Y. Chen, N. Inohara and G. Nunez, Nat. Immunol., 2013, 14, 685–690 CrossRef CAS PubMed.
- L. P. Conway, V. Rendo, M. S. P. Correia, I. A. Bergdahl, T. Sjoblom and D. Globisch, Angew. Chem., Int. Ed., 2020, 59, 14342–14346 CrossRef CAS PubMed.
- T. Vallianatou, W. Lin, N. B. Bechet, M. S. Correia, N. C. Shanbhag, I. Lundgaard and D. Globisch, J. Cereb. Blood Flow Metab., 2021, 41, 3324–3338 CrossRef CAS PubMed.
- D. S. Wishart, et al. , Nucleic Acids Res., 2022, 50, D622–D631 CrossRef CAS PubMed.
- E. L. Schymanski, J. Jeon, R. Gulde, K. Fenner, M. Ruff, H. P. Singer and J. Hollender, Environ. Sci. Technol., 2014, 48, 2097–2098 CrossRef CAS PubMed.
- N. V. Beloborodova, A. S. Khodakova, I. T. Bairamov and A. Y. Olenin, Biochemistry, 2009, 74, 1350–1355 CAS.
- M. Wlodarska, et al. , Cell Host Microbe, 2017, 22, 25–37 CrossRef CAS PubMed.
- J. Ramirez, F. Guarner, L. Bustos Fernandez, A. Maruy, V. L. Sdepanian and H. Cohen, Front. Cell. Infect. Microbiol., 2020, 10, 572912 CrossRef CAS PubMed.
- L. Shi and B. P. Tu, Curr. Opin. Cell Biol., 2015, 33, 125–131 CrossRef CAS PubMed.
Footnote |
| † Electronic supplementary information (ESI) available. See DOI: https://doi.org/10.1039/d3cc01223a |
| This journal is © The Royal Society of Chemistry 2023 |


![[thin space (1/6-em)]](https://www.rsc.org/images/entities/char_2009.gif) :
: