 Open Access Article
Creative Commons Attribution 3.0 Unported Licence
Spontaneous preparation of a fluorescent ratiometric chemosensor for metal ions using off-the-shelf materials†
Yui
Sasaki
 a,
Kohei
Ohshiro
 a,
Qi
Zhou
 a,
Xiaojun
Lyu
 a,
Wei
Tang
 a,
Kiyosumi
Okabe
 a,
Shin-ya
Takizawa
 b and
Tsuyoshi
Minami
 *a
*a
aInstitute of Industrial Science, The University of Tokyo, 4-6-1 Komaba, Meguro-ku, Tokyo, 153-8505, Japan. E-mail: tminami@g.ecc.u-tokyo.ac.jp
bDepartment of Basic Science, Graduate School of Arts and Sciences, The University of Tokyo, 3-8-1, Komaba, Meguro-ku, Tokyo, 153-8902, Japan
First published on 12th May 2023
Abstract
A self-assembled chemosensor prepared using off-the-shelf materials has shown various fluorescence responses including ratiometric and simple ON–OFF switching profiles by adding different toxic metal ions. The unique fingerprint-like responses have been applied to pattern recognition of metal ions in river water for environmental analysis.
Chemosensor arrays using inherent cross-reactivities of artificial receptors1 are potent analytical tools allowing high-throughput sensing combined with data processing techniques.2 However, inset data for pattern recognition is conventionally prepared using several chemosensors owing to the limitation of variation of sensor responses, which causes synthetic efforts for the preparation of a chemosensor library.3 To this end, we herein propose a single self-assembled chemosensor prepared from off-the-shelf materials to discriminate toxic metal ions4 quantitatively based on pattern recognition for environmental assessment.
In contrast to typical indicator–spacer–receptor-based chemosensors that are covalently connected,5 indicator displacement assay (IDA)-based chemosensors are easily obtained by non-covalent bonds between indicators and receptors.6 However, the conventional IDA-based fluorescent chemosensors show only simple switching profiles such as ON–OFF (or OFF–ON) responses because indicators do not contribute to analyte capture.7 In the case of ON–OFF or OFF–ON-type chemosensors, the discrimination of a response for analyte detection from background noise in the real-sample analysis is a concern because of the single fluorescence channel.8 On the other hand, ratiometric responses possessing two-fluorescence color channels can reduce false-positive signals originating from interference effects.4b,9 Thus, ratiometric-type chemosensors are promising materials for real-sample analysis;8b,10 however multi-step organic synthesis is generally required to obtain a fluorescent ratiometric chemosensor.11 Hence, we decided to design a ratiometric self-assembled chemosensor based on a catechol dye that acts as not only an indicator but also a binding unit to increase optical response patterns in a competitive assay.12
A coumarin derivative (i.e., esculetin (EL)) as an off-the-shelf catechol fluorophore is capable of interacting with not only target metal ions through a coordination bond13 but also a phenylboronic acid (PBA) derivative through a dynamic covalent bond.7,11a The coordination of EL and a metal ion offers fluorescence changes, whereas the spectral shifts of EL upon adding metal ions are not significant. Namely, the fluorescence changes in one channel are dominant. In this assay, a self-assembled complex of EL and 3-nitrophenylboronic acid (3-NPBA) was employed as a fluorescent chemosensor for metal ions (Fig. 1). A fluorescence change in EL occurs upon the formation of the boronate/boronic ester,14 owing to photoinduced electron transfer (PeT) from the excited state of EL to the nitrophenyl moiety of 3-NPBA.7b,15 In our strategy, the absolute fluorescence intensity of EL is purposely manipulated by 3-NPBA. Therefore, the fluorescence responses of EL in the presence of 3-NPBA upon adding analyte metal ions can be apparently observed as significant changes. The approach provides various optical responses including ratiometric and simple ON–OFF switching profiles with the difference in target metal ions, which contributes to pattern recognition-driven chemical sensing.
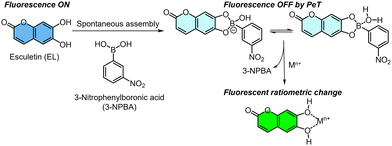 | ||
| Fig. 1 Schematic of the fluorescence detection mechanism of the self-assembled chemosensor, comprising esculetin (EL) and 3-nitrophenylboronic acid (3-NPBA), for metal ions. | ||
The optical properties in this competitive assay were evaluated step-by-step. In the UV-vis titration of 3-NPBA, a non-linear saturation curve obtained from stepwise blueshifts of UV-vis absorption spectra of EL indicated the formation of the boronate ester of the catechol chromophore and 3-NPBA (Fig. S1, ESI†). In addition, the fluorescence intensity of EL decreased upon the addition of 3-NPBA (Fig. S2, ESI†), owing to PeT.6,7b In this regard, emission quantum yields (φ) of EL and the EL–3-NPBA complex were determined to be 21% and 3%, respectively (Table S1, ESI†). Meanwhile, almost no change in the lifetime (τ) of EL before and after adding 3-NPBA was observed (Table S1, ESI†), implying a static quenching mechanism.16 The complexation between EL and 3-NPBA with a 1![[thin space (1/6-em)]](https://www.rsc.org/images/entities/char_2009.gif) :
:![[thin space (1/6-em)]](https://www.rsc.org/images/entities/char_2009.gif) 1 stoichiometry was also supported by electrospray ionization-mass spectrometry (ESI-MS) analysis.7b Judging from the complexation rate of 99% in the fluorescence titration (Fig. S2, ESI†), the molar ratio of EL and 3-NPBA for the further demonstration of detecting metal ions was decided as 1
1 stoichiometry was also supported by electrospray ionization-mass spectrometry (ESI-MS) analysis.7b Judging from the complexation rate of 99% in the fluorescence titration (Fig. S2, ESI†), the molar ratio of EL and 3-NPBA for the further demonstration of detecting metal ions was decided as 1![[thin space (1/6-em)]](https://www.rsc.org/images/entities/char_2009.gif) :
:![[thin space (1/6-em)]](https://www.rsc.org/images/entities/char_2009.gif) 60.
60.
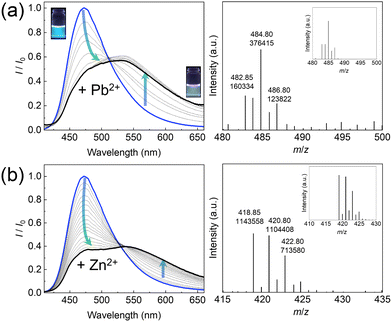
Next, the optical response changes of the EL–3-NPBA complex upon adding metal ions were assessed. The fluorescence spectra of the EL–3-NPBA complex were red-shifted upon the addition of a metal ion (i.e., Pb2+) (Fig. 2(a), left). Indeed, the change in the fluorescence color was recognized by the naked eye, showing a ratiometric behavior. Certainly, the fluorescence response at 543 nm of the EL–3-NPBA complex with an increase in Pb2+ concentration was significant in comparison to that in the absence of 3-NPBA, which indicated the contribution of 3-NPBA to the ratiometric fluorescence changes (Fig. S28, ESI†). The lifetime measurements of EL in the presence of Pb2+ presented two components (τ1 and τ2), which could be attributed to the EL–Pb2+ complex and EL, respectively. In this regard, the lifetime of EL was not influenced even in the presence of 3-NPBA (Table S1, ESI†). Moreover, Fig. 2(b) shows the quantitative ratiometric fluorescence changes upon adding Zn2+. The ESI-MS analysis results supported the complexation of EL and Zn2+ with a 1![[thin space (1/6-em)]](https://www.rsc.org/images/entities/char_2009.gif) :
:![[thin space (1/6-em)]](https://www.rsc.org/images/entities/char_2009.gif) 1 stoichiometry (Fig. 2(b), right). In accordance with the 1
1 stoichiometry (Fig. 2(b), right). In accordance with the 1![[thin space (1/6-em)]](https://www.rsc.org/images/entities/char_2009.gif) :
:![[thin space (1/6-em)]](https://www.rsc.org/images/entities/char_2009.gif) 1 binding mode, the apparent binding constant of EL to Zn2+ in the presence of 3-NPBA was estimated to be (8.3 ± 0.4) × 102 M−1. Although the EL–Pb2+ complex with a 1
1 binding mode, the apparent binding constant of EL to Zn2+ in the presence of 3-NPBA was estimated to be (8.3 ± 0.4) × 102 M−1. Although the EL–Pb2+ complex with a 1![[thin space (1/6-em)]](https://www.rsc.org/images/entities/char_2009.gif) :
:![[thin space (1/6-em)]](https://www.rsc.org/images/entities/char_2009.gif) 1 stoichiometry in the presence of 3-NPBA was observed in ESI-MS analysis (Fig. 2(a), right), a nonlinear curve fitting based on a 1
1 stoichiometry in the presence of 3-NPBA was observed in ESI-MS analysis (Fig. 2(a), right), a nonlinear curve fitting based on a 1![[thin space (1/6-em)]](https://www.rsc.org/images/entities/char_2009.gif) :
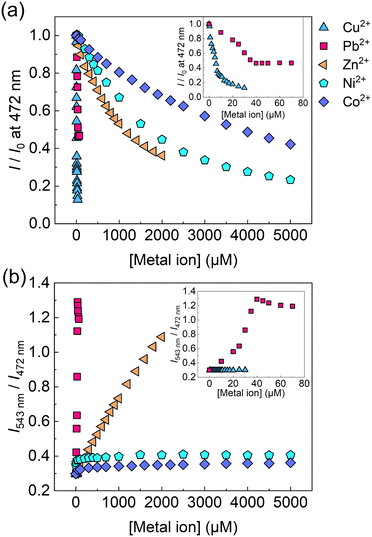
:![[thin space (1/6-em)]](https://www.rsc.org/images/entities/char_2009.gif) 1 binding stoichiometry was not achieved owing to the biphasic behavior17 (for more details, see the ESI†). Subsequently, a selectivity test of the self-assembled chemosensor for 13 metal ions (i.e., Pb2+, Zn2+, Cu2+, Ni2+, Hg2+, Cd2+, Co2+, Ca2+, K+, Na+, Mg2+, Ba2+, and Cs+) was carried out. Other metal ions including Al3+, Sn2+, Fe2+, Cr3+, and Ga3+ were excluded from the metal ion library because of hydrolysis under the measurement conditions. The EL–3-NPBA complex did not respond to Ca2+, K+, Na+, Mg2+, Ba2+, and Cs2+ owing to their low binding affinities to a coumarin derivative (Fig. S22–S27, ESI†).13a Although the UV-vis absorption spectra of the EL–3-NPBA complex changed upon the addition of Hg2+ and Cd2+ at high concentrations (Fig. S7 and S8, ESI†), significant spectral changes were not observed in fluorescence titrations. The EL–3-NPBA complex exhibited different ON–OFF responses upon addition of Pb2+, Zn2+, Ni2+, Co2+, and Cu2+ (Fig. 3(a)), and the magnitudes of the determinable apparent binding constants were approximately 102 to 103 M−1. Among them, the EL–3-NPBA complex showed ratiometric fluorescence responses to Pb2+ and Zn2+ (Fig. 3(b)). Notably, the response of EL to Cu2+ was significant compared to Pb2+ at λem = 472 nm (Fig. 3(a)), although a ratiometric behavior to Cu2+ was not observed (Fig. 3(b)). In addition, the responses to Ni2+ and Co2+ at high concentrations were also non-ratiometric ON–OFF switching profiles. Therefore, the obtained concentration-dependent fluorescence response pattern including ratiometric and simple ON–OFF switching profiles indicated its potential for pattern recognition. As an additional evaluation, NMR analysis was also carried out to investigate the complexation of EL and Pb2+ in the presence of 3-NPBA; however evidence to support the complexation of EL and Pb2+ in the presence of 3-NPBA was not provided by NMR analysis.18
1 binding stoichiometry was not achieved owing to the biphasic behavior17 (for more details, see the ESI†). Subsequently, a selectivity test of the self-assembled chemosensor for 13 metal ions (i.e., Pb2+, Zn2+, Cu2+, Ni2+, Hg2+, Cd2+, Co2+, Ca2+, K+, Na+, Mg2+, Ba2+, and Cs+) was carried out. Other metal ions including Al3+, Sn2+, Fe2+, Cr3+, and Ga3+ were excluded from the metal ion library because of hydrolysis under the measurement conditions. The EL–3-NPBA complex did not respond to Ca2+, K+, Na+, Mg2+, Ba2+, and Cs2+ owing to their low binding affinities to a coumarin derivative (Fig. S22–S27, ESI†).13a Although the UV-vis absorption spectra of the EL–3-NPBA complex changed upon the addition of Hg2+ and Cd2+ at high concentrations (Fig. S7 and S8, ESI†), significant spectral changes were not observed in fluorescence titrations. The EL–3-NPBA complex exhibited different ON–OFF responses upon addition of Pb2+, Zn2+, Ni2+, Co2+, and Cu2+ (Fig. 3(a)), and the magnitudes of the determinable apparent binding constants were approximately 102 to 103 M−1. Among them, the EL–3-NPBA complex showed ratiometric fluorescence responses to Pb2+ and Zn2+ (Fig. 3(b)). Notably, the response of EL to Cu2+ was significant compared to Pb2+ at λem = 472 nm (Fig. 3(a)), although a ratiometric behavior to Cu2+ was not observed (Fig. 3(b)). In addition, the responses to Ni2+ and Co2+ at high concentrations were also non-ratiometric ON–OFF switching profiles. Therefore, the obtained concentration-dependent fluorescence response pattern including ratiometric and simple ON–OFF switching profiles indicated its potential for pattern recognition. As an additional evaluation, NMR analysis was also carried out to investigate the complexation of EL and Pb2+ in the presence of 3-NPBA; however evidence to support the complexation of EL and Pb2+ in the presence of 3-NPBA was not provided by NMR analysis.18
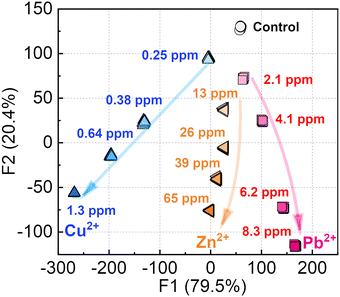
As the next attempt, the chemosensor was applied to pattern recognition (e.g., a semi-quantitative assay) of Cu2+, Pb2+, and Zn2+ which could act as inhibitors to root growth.19 The semi-quantitative assay was not performed for Ni2+ and Co2+ because a situation requiring the detection of these metal ions at high concentrations (mM levels) is not realistic in practical sensing. In this assay, the inset data for pattern recognition was constructed from the fluorescence changes of the EL–3-NPBA complex upon the addition of Cu2+, Pb2+, or Zn2+ at different concentrations. The data matrix obtained from the fluorescence measurements was treated using the Student's t-test to exclude outliers of 4 repetitive data points from 24 repetitive data points. The treated dataset contains multi-dimensional information that was constructed by 1 chemosensor × 3 analytes (Cu2+, Pb2+, and Zn2+) × 5 concentrations ([Cu2+] = 0–1.3 ppm, [Pb2+] = 0–8.3 ppm, and [Zn2+] = 0–65 ppm) × 58 wavelength points (ranging from 415 to 700 nm, in 5 nm interval of λem) × 20 repetitions, obtaining 17![[thin space (1/6-em)]](https://www.rsc.org/images/entities/char_2009.gif) 400 data points in total. The inset data was subsequently treated using linear discriminant analysis (LDA), which is capable of classification of clusters and decreasing the multi-dimensional information. Through the data processing with LDA, the multi-dimensional inset data can be visualized as two- (Factor 1 (F1), F2) or three-dimensional (F1, F2, and F3) canonical score plots. The values of each factor represent a contribution of the inputted data matrix for the discrimination.2aFig. 4 shows a concentration-dependent distribution of each cluster with a 100% correct classification. Each cluster of Zn2+ and Pb2+ containing 20 repetitive datasets was nonlinearly distributed in accordance with the increase in the concentrations, originating from the ratiometric responses. On the other hand, the positions of clusters of Cu2+ indicated linearity stemmed from a simple ON–OFF response.
400 data points in total. The inset data was subsequently treated using linear discriminant analysis (LDA), which is capable of classification of clusters and decreasing the multi-dimensional information. Through the data processing with LDA, the multi-dimensional inset data can be visualized as two- (Factor 1 (F1), F2) or three-dimensional (F1, F2, and F3) canonical score plots. The values of each factor represent a contribution of the inputted data matrix for the discrimination.2aFig. 4 shows a concentration-dependent distribution of each cluster with a 100% correct classification. Each cluster of Zn2+ and Pb2+ containing 20 repetitive datasets was nonlinearly distributed in accordance with the increase in the concentrations, originating from the ratiometric responses. On the other hand, the positions of clusters of Cu2+ indicated linearity stemmed from a simple ON–OFF response.
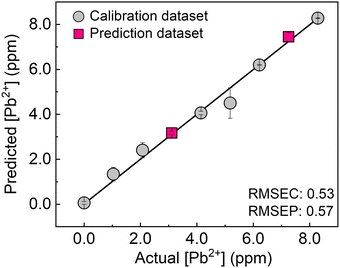
Finally, the single chemosensor was applied to a real-sample analysis with river water. To evaluate the applicability of the chemosensor to environmental assessment, a support vector machine (SVM)20 was employed. The calibration line was built using the inset data constructed from seven different concentrations of Pb2+ (gray circles), followed by the prediction of two concentrations of unknown samples (pink squares). In Fig. 5, the predicted clusters at 3.1 and 7.3 ppm were distributed on the calibration line with a low root mean square error for the prediction (RMSEP) value. Taken together, the accurate prediction of unknown concentrations of the target metal ion in river water was achieved by the ratiometric responses based on molecular self-assembly.
In summary, we designed a single self-assembled fluorescent ratiometric chemosensor for the simultaneous discrimination of metal ions using off-the-shelf materials. A catechol fluorophore EL spontaneously interacted with 3-NPBA, which caused fluorescence quenching by PeT. Notably, the self-assembled chemosensor displayed ratiometric responses upon the addition of Pb2+ and Zn2+, indicating the feasibility of pattern recognition using a single chemosensor. Indeed, the single self-assembled chemosensor achieved a semi-quantitative assay of Pb2+, Zn2+, and Cu2+ with high accuracy. Furthermore, a regression analysis of Pb2+ in river water was demonstrated using a machine learning method, and the favorable applicability to real-sample analysis was revealed by the accurate prediction of unknown concentrations of Pb2+ in river water. Further investigation to understand the unique optical properties of the self-assembled chemosensing system is required, while we believe that our approach to maximizing the power of molecular self-assemblies could be used for not only metal ion detections but also for other species because of the abundant combination of building blocks.
T. Minami thanks the financial support from the Japan Society for the Promotion of Science (JSPS KAKENHI Grant No. JP23H03864 and JP21H01780) and JST CREST (Grant No. JPMJCR2011). Y. Sasaki also thanks the special fund of Institute of Industrial Science, the University of Tokyo, the JSPS KAKENHI (Grant No. JP22K14706). K. Ohshiro, Q. Zhou, and X. Lyu thank the JSPS Research Fellow for Young Scientists (DC1) (Grant No. JP23KJ0785, JP22J23433, and JP22J23435, respectively).
Conflicts of interest
There are no conflicts of interest to declare.References
- (a) T. A. Dickinson, J. White, J. S. Kauer and D. R. Walt, Nature, 1996, 382, 697–700 CrossRef CAS PubMed; (b) K. J. Albert, N. S. Lewis, C. L. Schauer, G. A. Sotzing, S. E. Stitzel, T. P. Vaid and D. R. Walt, Chem. Rev., 2000, 100, 2595–2626 CrossRef CAS PubMed.
- (a) P. Anzenbacher Jr, P. Lubal, P. Buček, M. A. Palacios and M. E. Kozelkova, Chem. Soc. Rev., 2010, 39, 3954–3979 RSC; (b) Z. Li, J. R. Askim and K. S. Suslick, Chem. Rev., 2019, 119, 231–292 CrossRef CAS PubMed; (c) Y. Geng, W. J. Peveler and V. M. Rotello, Angew. Chem., Int. Ed., 2019, 58, 5190–5200 CrossRef CAS PubMed; (d) Y. Sasaki, R. Kubota and T. Minami, Coord. Chem. Rev., 2021, 429, 213607 CrossRef CAS.
- (a) Y. Sasaki, S. Kojima, V. Hamedpour, R. Kubota, S. Takizawa, I. Yoshikawa, H. Houjou, Y. Kubo and T. Minami, Chem. Sci., 2020, 11, 3790–3796 RSC; (b) Y. Liu, T. Minami, R. Nishiyabu, Z. Wang and P. Anzenbacher Jr, J. Am. Chem. Soc., 2013, 135, 7705–7712 CrossRef CAS PubMed.
- (a) S. Bolisetty, M. Peydayesh and R. Mezzenga, Chem. Soc. Rev., 2019, 48, 463–487 RSC; (b) H. Jin, M. Yang, Z. Sun and R. Gui, Coord. Chem. Rev., 2021, 446, 214114 CrossRef CAS.
- For reviews, see: (a) D. Wu, A. C. Sedgwick, T. Gunnlaugsson, E. U. Akkaya, J. Yoon and T. D. James, Chem. Soc. Rev., 2017, 46, 7105–7123 RSC; (b) Y. Fang and W. Dehaen, Coord. Chem. Rev., 2021, 427, 213524 CrossRef CAS; for examples, see: (c) K. Rout, A. K. Manna, M. Sahu, J. Mondal, S. K. Singh and G. K. Patra, RSC Adv., 2019, 9, 25919–25931 RSC; (d) C. A. S. Pothulapadu, A. Jayaraj, N. Swathi, R. N. Priyanka and G. Sivaraman, ACS Omega, 2021, 6, 24473–24483 CrossRef CAS PubMed.
- (a) B. T. Nguyen and E. V. Anslyn, Coord. Chem. Rev., 2006, 250, 3118–3127 CrossRef CAS; (b) A. C. Sedgwick, J. T. Brewster, T. Wu, X. Feng, S. D. Bull, X. Qian, J. L. Sessler, T. D. James, E. V. Anslyn and X. Sun, Chem. Soc. Rev., 2021, 50, 9–38 RSC.
- (a) X. Liang and M. Bonizzoni, J. Mater. Chem. B, 2016, 4, 3094–3103 RSC; (b) Y. Sasaki, É. Leclerc, V. Hamedpour, R. Kubota, S. Takizawa, Y. Sakai and T. Minami, Anal. Chem., 2019, 91, 15570–15576 CrossRef CAS PubMed.
- (a) L. Gao, W. Wang, X. Wang, F. Yang, L. Xie, J. Shen, M. A. Brimble, Q. Xiao and S. Q. Yao, Chem. Soc. Rev., 2021, 50, 1219–1250 RSC; (b) Y. Zheng, Y. Ding, X. Zheng, C. Zhang, Y. Zhang, Y. Xiang and A. Tong, Anal. Chem., 2021, 93, 10272–10281 CrossRef CAS PubMed.
- (a) M. H. Lee, J. S. Kim and J. L. Sessler, Chem. Soc. Rev., 2015, 44, 4185–4191 RSC; (b) S.-H. Park, N. Kwon, J.-H. Lee, J. Yoon and I. Shin, Chem. Soc. Rev., 2020, 49, 143–179 RSC.
- (a) Y. Han, C. Ding, J. Zhou and Y. Tian, Anal. Chem., 2015, 87, 5333–5339 CrossRef CAS PubMed; (b) Z. Liu, X. Jing, S. Zhang and Y. Tian, Anal. Chem., 2019, 91, 2488–2497 CrossRef CAS PubMed.
- (a) K. Sakakibara, L. A. Joyce, T. Mori, T. Fujisawa, S. H. Shabbir, J. P. Hill, E. V. Anslyn and K. Ariga, Angew. Chem., Int. Ed., 2012, 51, 9643–9646 CrossRef CAS PubMed; (b) A. Kaur, H. Sharma, S. Kaur, N. Singh and N. Kaur, RSC Adv., 2013, 3, 6160–6166 RSC; (c) L. Tang, D. Wu, X. Wen, X. Dai and K. Zhong, Tetrahedron, 2014, 70, 9118–9124 CrossRef CAS; (d) J. Y. Lee, H. D. Root, R. Ali, W. An, V. M. Lynch, S. Bähring, I. S. Kim, J. L. Sessler and J. S. Park, J. Am. Chem. Soc., 2020, 142, 19579–19587 CrossRef CAS PubMed; (e) N. Dey, B. Maji and S. Bhattacharya, Chem. – Asian J., 2018, 13, 664–671 CrossRef CAS PubMed.
- (a) Y. Kubo, T. Ishida, A. Kobayashi and T. D. James, J. Mater. Chem., 2005, 15, 2889–2895 RSC; (b) T. Minami, F. Emami, R. Nishiyabu, Y. Kubo and P. Anzenbacher Jr, Chem. Commun., 2016, 52, 7838–7841 RSC; (c) Y. Sasaki, T. Minamiki, S. Tokito and T. Minami, Chem. Commun., 2017, 53, 6561–6564 RSC.
- (a) L. Zhang, S. Dong and L. Zhu, Chem. Commun., 2007, 1891–1893 RSC; (b) Y. Sasaki, X. Lyu, R. Kubota, S. Takizawa and T. Minami, ACS Appl. Bio Mater., 2021, 4, 2113–2119 CrossRef CAS PubMed.
- (a) S. D. Bull, M. G. Davidson, J. M. H. van den Elsen, J. S. Fossey, A. T. A. Jenkins, Y.-B. Jiang, Y. Kubo, F. Marken, K. Sakurai, J. Zhao and T. D. James, Acc. Chem. Res., 2013, 46, 312–326 CrossRef CAS PubMed; (b) S. Cho, S. Y. Hwang, D. X. Oh and J. Park, J. Mater. Chem. A, 2021, 9, 14630–14655 RSC.
- (a) B. Daly, J. Ling and A. P. de Silva, Chem. Soc. Rev., 2015, 44, 4203–4211 RSC; (b) T. Ueno, Y. Urano, H. Kojima and T. Nagano, J. Am. Chem. Soc., 2006, 128, 10640–10641 CrossRef CAS PubMed.
- L. K. Fraiji, D. M. Hayes and T. C. Werner, J. Chem. Educ., 1992, 69, 424 CrossRef CAS.
- (a) S. C. McCleskey, A. Metzger, C. S. Simmons and E. V. Anslyn, Tetrahedron, 2002, 58, 621–628 CrossRef CAS; (b) A. Le Person, A. Moncomble and J.-P. Cornard, J. Phys. Chem. A, 2014, 118, 2646–2655 CrossRef CAS PubMed.
- NMR analysis was carried out to investigate the complexation of EL and Pb2+ in the presence of 3-NPBA; however a precipitate was obtained under the high concentration conditions of the components (>500 μM) in D2O at pD 7.4. The coordination between the hydroxyl groups of EL and Pb2+ caused a dramatic decrease in the solubility of EL in the aqueous solution, and consequently a solid-state product originating from the EL–Pb2+ complex was unexpectedly precipitated. Overall, evidence to support the complexation of EL and Pb2+ was not provided by NMR analysis because the sensitivity of the saturated solution mixture was not satisfactory for the NMR measurements.
- S. M. Palacio, F. R. Espinoza-Quiñones, R. M. Galante, D. C. Zenatti, A. A. Seolatto, E. K. Lorenz, C. E. Zacarkim, N. Rossi, M. D. A. Rizzutto and M. H. Tabacniks, Braz. Arch. Biol. Technol., 2005, 48, 191–196 CrossRef.
- L. Hamel, Knowledge Discovery with Support Vector Machines, Wiley, New Jersey, 2009 Search PubMed.
Footnote |
| † Electronic supplementary information (ESI) available: Selected UV-vis and fluorescence titration results, photophysical properties, discussion of binding stoichiometry, and array experiments. See DOI: https://doi.org/10.1039/d3cc00949a |
| This journal is © The Royal Society of Chemistry 2023 |

