
 Open Access Article
 This Open Access Article is licensed under a Creative Commons Attribution-Non Commercial 3.0 Unported Licence
Does non-thermal plasma modify biopolymers in solution? A chemical and mechanistic study for alginate†
Francesco
Tampieri
 abc,
Albert
Espona-Noguera
abc,
Cédric
Labay
abc,
Maria-Pau
Ginebra
abd,
Maksudbek
Yusupov
efgh,
Annemie
Bogaerts
h and
Cristina
Canal
*abc
abc,
Albert
Espona-Noguera
abc,
Cédric
Labay
abc,
Maria-Pau
Ginebra
abd,
Maksudbek
Yusupov
efgh,
Annemie
Bogaerts
h and
Cristina
Canal
*abc
aBiomaterials, Biomechanics and Tissue Engineering Group, Department of Materials Science and Engineering and Research Centre for Biomedical Engineering, Universitat Politècnica de Catalunya BarcelonaTech (UPC), 08019 Barcelona, Spain. E-mail: cristina.canal@upc.edu
bBarcelona Research Centre in Multiscale Science and Engineering, Universitat Politècnica de Catalunya BarcelonaTech (UPC), 08019 Barcelona, Spain
cInstitut de Recerca Sant Joan de Déu, 08034 Barcelona, Spain
dInstitute for Bioengineering of Catalonia, 08028 Barcelona, Spain
eSchool of Engineering, New Uzbekistan University, 100007 Tashkent, Uzbekistan
fDepartment of Power Supply and Renewable Energy Sources, National Research University TIIAME, 100000 Tashkent, Uzbekistan
gLaboratory of Thermal Physics of Multiphase Systems, Arifov Institute of Ion-Plasma and Laser Technologies, Academy of Sciences of Uzbekistan, 100125 Tashkent, Uzbekistan
hResearch group PLASMANT, Department of Chemistry, University of Antwerp, 2610 Antwerp, Belgium
First published on 11th April 2023
Abstract
In the last decades, non-thermal plasma has been extensively investigated as a relevant tool for various biomedical applications, ranging from tissue decontamination to regeneration and from skin treatment to tumor therapies. This high versatility is due to the different kinds and amount of reactive oxygen and nitrogen species that can be generated during a plasma treatment and put in contact with the biological target. Some recent studies report that solutions of biopolymers with the ability to generate hydrogels, when treated with plasma, can enhance the generation of reactive species and influence their stability, resulting thus in the ideal media for indirect treatments of biological targets. The direct effects of the plasma treatment on the structure of biopolymers in water solution, as well as the chemical mechanisms responsible for the enhanced generation of RONS, are not yet fully understood. In this study, we aim at filling this gap by investigating, on the one hand, the nature and extent of the modifications induced by plasma treatment in alginate solutions, and, on the other hand, at using this information to explain the mechanisms responsible for the enhanced generation of reactive species as a consequence of the treatment. The approach we use is twofold: (i) investigating the effects of plasma treatment on alginate solutions, by size exclusion chromatography, rheology and scanning electron microscopy and (ii) study of a molecular model (glucuronate) sharing its chemical structure, by chromatography coupled with mass spectrometry and by molecular dynamics simulations. Our results point out the active role of the biopolymer chemistry during direct plasma treatment. Short-lived reactive species, such as OH radicals and O atoms, can modify the polymer structure, affecting its functional groups and causing partial fragmentation. Some of these chemical modifications, like the generation of organic peroxide, are likely responsible for the secondary generation of long-lived reactive species such as hydrogen peroxide and nitrite ions. This is relevant in view of using biocompatible hydrogels as vehicles for storage and delivery reactive species for targeted therapies.
Introduction
Atmospheric non-thermal plasmas (NTPs) are partially ionized gases that can be easily generated at atmospheric pressure and room temperature by an electrical discharge. They have been largely studied in the last decades for many applications, such as materials science, energy and environmental applications (green chemistry) and biomedicine, due to their ability to generate, among others, highly reactive chemical species.1Biomedicine is probably the field in which this technology has shown the most promising results, with applications ranging from tissue decontamination to advanced therapies, namely regenerative medicine and cancer treatment.2–4 While the advantages of direct NTP treatment on biological targets are extensively reported5–7 and can be explained considering all the potential actors that are generated during treatment (free electrons, ions, radicals, excited molecules and electromagnetic radiation), a significant debate is rising in the plasma medicine community on the advantages of plasma-treated liquids (PTLs).8,9
PTLs are liquids (water, saline solutions, cell culture media, etc.) that are loaded with reactive species by direct NTP treatment, and, subsequently, put in contact with the target. Due to their generation process, they contain only long-lived chemical species (lifetime of minutes or longer) and therefore, their biological effect can be ascribed mainly to these species and to other short-lived species that can be generated in solution by secondary processes. An example of the latter is the well-known generation of OH and NO2 radicals that occurs by reaction of hydrogen peroxide and nitrite ions in acidic conditions, passing through the generation of peroxynitrite ions.10
The PTLs that are studied for biomedical applications can be classified in three categories, according to their components prior to the treatment: (i) pure/deionized water; (ii) water solutions containing inorganic salts (e.g. phosphate buffered saline, Ringer's saline); (iii) water solutions containing small organic molecules and/or macromolecules (e.g. organic buffers, cell culture media). By treating pure water with NTP, in presence of molecular oxygen and nitrogen, a plethora of short-lived reactive oxygen and nitrogen species (RONS) is generated by interaction of free electrons and primary ions with the molecules of the gas and water and subsequent dissolution processes, but, after the treatment, the only species that can survive in solution are ozone, hydrogen peroxide and nitrogen-containing acids (nitric acid, fully dissociated and nitrous acid, partially dissociated, depending on the pH). Plasma-treated water is quite simple in its chemical composition and several attempts were made in order to reproduce it “artificially”, obtaining comparable biological effects.9,11,12
The treatment of saline solutions adds more variables to the system, by introducing new elements, therefore opening many more chemical pathways, like the generation of hypochlorite from chloride ions13,14 and carbonate, phosphate and sulphate radicals from the corresponding anions.15–17
Finally, the presence of organic matter in solution during NTP treatment exponentially increases the number of chemical pathways. Providing enough treatment time and energy, NTP is able to completely oxidize all organic molecules to their complete mineralization, passing through many intermediate stages.18–20 In the biomedical field, NTP has been used to treat cell culture media, solutions of amino acids and of other small molecules of biological interest.21–26 Beyond plasma medicine, the effect of NTP treatment on organic molecules has also been extensively studied for other applications, in particular for the purpose of wastewater decontamination from persistent organic pollutants and recently new perspectives have been explored to synthesize highly valuable chemicals in a cheap and green way.27
The use of biopolymers, especially of those able to form hydrogels, has been very limited in the field of plasma medicine. The two main aims have been the use of hydrogels to mimic tissues for studies related to RONS penetration and as vehicles for storage and local delivery of RONS.28–32 Very little is known about the effects of direct NTP treatment on biopolymers’ solutions and hydrogels, mainly due to the intrinsic difficulties in assessing the modifications on macromolecules at a chemical level. A few studies exist showing the ability of NTP (dielectric barrier discharge and plasma jets) to degrade proteins or polysaccharides by cleaving the bonds between repeating units.32–35
It has also been reported by our group that the presence of biopolymers in solution (polysaccharides and proteins) can enhance the generation of long-lived RONS (hydrogen peroxide and nitrite ions mainly) after NTP treatment.30–32 The same effect has been observed by other authors after treating cell culture media and amino acids solutions.36 These effects are due to secondary reactions that take place in water solutions and that are likely initiated by the interaction of short-lived RONS during the direct NTP treatment with the organic matter.
With this in mind, the aim of this work is twofold. First, we want to study in detail the effect of the NTP treatment on biopolymers in aqueous solution. Second, we want to assess their role in the secondary reactions that lead to the generation of long-lived RONS in solution during the treatment. We selected alginate as biopolymer for this study, because of its rather simple structure (linear copolymer composed of β-D-mannuronate and α-L-guluronate residues (1 → 4)-linked, Scheme 1a) and because of its high interest in the field of plasma medicine as a vehicle for the delivery of RONS, due to its ability to crosslink in presence of divalent cations.30,37 We investigated the modifications induced by NTP treatment on alginate, both in solution, by size exclusion chromatography (SEC) and rheology, and after crosslinking, by rheology and scanning electron microscopy (SEM). To study the chemical modifications induced by NTP treatment on alginate, we used glucuronate, as a molecular model. It has the same functional groups and same configuration as alginate (Scheme 1b). The model was first validated, in terms of reactivity. Then, we studied the effect of the NTP treatment on glucuronate by high performance liquid chromatography coupled with mass spectrometry detector (HPLC-MS). In parallel, we performed reactive molecular dynamics (MD) simulations on glucuronate (namely, on its protonated form glucuronic acid), in presence of short-lived reactive species, to rationalize the MS results.
 | ||
| Scheme 1 Chemical structures of alginate (a) and glucuronate (b). | ||
Experimental section
Materials
Sodium alginate ((C6H7O6Na)n, 99.8%, MW = 10–600 kDa, viscosity at 1% and 20 °C = 450 mPa) and phosphoric acid (H3PO4, 85.0–88.0%w/w) were purchased from Panreac. Sodium glucoronate monohydrate (C6H9NaO7·H2O, 97.5%), sodium dihydrogen phosphate dihydrate (NaH2PO4·2H2O, >98.0%), disodium hydrogen phosphate dodecahydrate (Na2HPO4·12H2O, >98.0%), sulfanilamide (C6H8N2O2S, ≥99%), calcium chloride dihydrate (CaCl2·2H2O, >96.0%), N-(1-naphthyl)ethylenediamine dihydrochloride (C12H16Cl2N2, >98%), horseradish peroxidase Type VI (HRP), hydrogen peroxide solution (H2O2, 30%w/w), sodium nitrite (NaNO2, >98.0%), disodium terephthalate (C6H4(COONa)2, 96%) and 2-hydroxyterephtalic acid (C8H6O5, >97%) were purchased from Sigma Aldrich. Formic acid (HCOOH, 98–100%) was purchased from Supelco. Amplex Red reagent was purchased from Thermo Fisher Scientific. Acetonitrile (ACN, 99.9%) was purchased from Carlo Erba Reagents. Ultrapure water was obtained by filtration using 0.22 μm pore size MILLEXGP filter unit (Merck Millipore). Helium gas (99.998%, maximum impurities of O2 and H2O 5 ppmv) was provided by Praxair.Plasma source and treatments
The plasma source used in this work is an atmospheric pressure plasma jet (APPJ), operating with helium.38,39 The active electrode is a copper wire (0.1 mm diameter) embedded inside a quartz tube (ID = 1.2 mm) and connected to a high voltage power supply. The discharge was operated with a sinusoidal waveform at 23 kHz with (U) ∼ 2 kV and (I) ∼ 3 mA. The average power delivered to the discharge was 1 W. A Bronkhorst Mass-View flow controller was used to set the helium flow rate. Experiments were performed in open air, at room temperature and with an average relative humidity of 70%.All the treatments, if not otherwise stated, were done using the following conditions: He flow rate 1 L min−1, distance between plasma nozzle and target 10 mm, sample volume 1.0 mL, sample support 24-well plate, according to previous studies.30 Treatment time was generally varied between 0 and 600 s. The He flow was started 15–20 min before each treatment in order to ensure a good purge of the gas line. The plasma was started at least 5–10 min before the treatment to let it stabilize. All solutions were prepared in phosphate buffer (50 mM, pH 7) to avoid any pH drop during the plasma treatment. Each NTP treatment was repeated at least three times to ensure reproducibility. Relative water evaporation rate due to NTP treatment was quantified ((2.10 ± 0.09) × 10−4 s−1) and was taken into account during data processing.
Size exclusion chromatography experiments
SEC measurements were done using a Shimadzu Prominence XR instrument, equipped with a Shimadzu Shim-Pack Bio Diol-200 column (3 μm, 4.6 × 300 mm), with autosampler and refractive index detector. The separation range of the column is 5–300 kDa. Phosphate buffer (50 mM, pH 7) was used as eluent, flow rate was 0.5 mL min−1 and injection volume 20 μL. 5 g L−1 alginate solutions were diluted 1![[thin space (1/6-em)]](https://www.rsc.org/images/entities/char_2009.gif) :10 with phosphate buffer before analysis. Alginate samples with lower concentrations were analyzed directly, without diluting.
:10 with phosphate buffer before analysis. Alginate samples with lower concentrations were analyzed directly, without diluting.
Rheology experiments
Rheology experiments were done at room temperature using a Hybrid Rheometer (Discovery HR-2, TA Instruments) with 20 mm parallel plates configuration. The viscosity profile of NTP-treated alginate solutions (liquid samples, without crosslinking agent) was obtained by means of rotational measurements with a shear rate sweep from 1 to 100 Hz. All the measurements were performed with smooth geometry and base, a gap of 1500 μm and a sample volume of 0.5 mL. Viscoelastic properties of hydrogel obtained using NTP-treated alginate solutions were determined by oscillatory measurements. First, 0.75 mL of each NTP-treated solution was transferred into a 12-well plate and then, 0.75 mL of 0.5 M CaCl2 solution was added drop-by-drop, evenly covering the entire surface. Samples were stored at 4 °C overnight to allow the complete crosslinking and obtain the solidified hydrogels. The storage (G′) modulus of the resulting disk-shaped hydrogels (crosslinked samples, diameter: 22 mm, thickness: 2 mm) was determined at room temperature with the rheometer using the 20 mm parallel rugose plates configuration, at a gap of 1500 μm, 1 Hz frequency and a displacement of 0.001 rad.Scanning electron microscopy experiments
For SEM evaluation, hydrogels were prepared as described in the previous paragraph for the measurement of the viscoelastic properties (0.75 mL of 5 g L−1 alginate solution, treated or untreated, plus 0.75 mL of 0.5 M CaCl2 solution in 12-well plate). After that, samples were frozen using liquid nitrogen and then freeze-dried (Noxair lyophilizer). We do not exclude a contribution of the freeze-drying process in distortion of pores in the samples, but it is supposed to be the same in both treated and untreated samples, since they were processed following the same protocol. Due to the low conductivity of alginate, samples were coated with a fine layer of carbon using an EMITECH K950X Turbo Evaporator (Quorum Technologies Ltd). Finally, the topography of the hydrogels’ cross-section was evaluated using the Phenom XL Desktop SEM (Phenom-World) operating at 10 kV.Reactive species detection and quantification
NTP-generated reactive species were analyzed using chemical probes according to previously published methods.40,41 Hydrogen peroxide was quantified using the Amplex Red method.42 For the preparation of 10 mL reagent solution, 50 μL of 20 mM Amplex Red stock solution in DMSO and 10 μL of 250 U mL−1 HRP stock solution in phosphate buffer (0.1 M, pH 6) was mixed with 9.940 mL of ultrapure water. Subsequently, 50 μL of Amplex Red reagent was added to 50 μL of diluted NTP-treated solution in a black 96-well plate. After incubating the well plate at 37 °C for 30 minutes, the fluorescence was measured (λex/em = 560/590 nm) using a microplate reader (Synergy™ HTX, Biotek). Calibration lines were built using standard solutions of hydrogen peroxide prepared in the same media used during NTP treatment.Nitrite ions were measured, using the Griess test.43 Griess reagent was prepared dissolving sulphanilamide, naphthylethylenediamine dihydrochloride and phosphoric acid in ultrapure water to obtain 1%w/w, 0.1%w/w and 1.2%w/w concentrations, respectively. 50 μL of Griess reagent was added to 50 μL of NTP-treated solution in a 96-well plate. After incubating the sample at room temperature for 10 minutes, the absorbance value at 540 nm was measured using a microplate reader. Calibration lines were built using standard solution of sodium nitrite prepared in the same media used during NTP treatment.
The production of hydroxyl radical during the NTP treatment was studied using sodium terephthalate (TPA).41 TPA reacts with free OH radicals to generate the fluorescent product 2-hydroxyterephthalate (hTPA). 1 mM solutions of TPA in different media were treated with APPJ. After the treatment, 0.5 mL was transferred in a 48-well plate and fluorescence was measured using the microplate reader (λex/em = 360/460 nm). To quantify the amount of hTPA generated, calibration lines were built using standard solutions of 2-hydroxyterephtalate prepared in the same media used during NTP treatment.
Chromatographic and mass analysis
HPLC-MS analysis of NTP-treated glucuronate solutions was performed with a HPLC (Agilent 1200) equipped with a Acquity BEH amide column (1.7 μm 2.1 × 100 mm) and a Hybrid Quadrupole-TOF LC/MS/MS Mass Spectrometer detector (QStar Elite ABsciex). Eluents were water + 0.1% formic acid (A) and acetonitrile + 0.1% formic acid (B). Gradient (min, %B) was (0, 85) (5, 30) (8, 30) (8.1, 85) (10, 85). Flow rate, column temperature and injection volume were set at 0.35 mL min−1, 45 °C and 5 μL, respectively. The ionization was performed within the turbo spray source in negative polarity in Full Scan mode from 100 to 600 m/z. Data were acquired with Analyst Software QS 2.0.Safety statement
No unexpected or unusually high safety hazards were encountered.Computational section
Reactive molecular dynamics simulations
To study the effect of NTP oxidation on glucuronic acid and to gain insight into the reaction mechanisms at the atomic level, reactive MD simulations were performed based on the density functional-tight binding (DFTB) method.44 DFTB is an approximate quantum chemical method derived from DFT. It is based on a third-order expansion of the DFT total energy expression (i.e., so-called DFTB3 method) and can correctly describe the proton affinities and H binding energies as well as H transfer barriers in a fast and reliable manner.45 The DFTB-based reactive MD simulations (i.e., DFTB-MD) are computationally more expensive than classical reactive MD simulations such as ReaxFF-MD,46 but still two orders of magnitude faster than DFT.47 In this study, a parameter set ‘3ob-3-1’ was used in DFTB-MD to describe the interatomic interactions. This parameter set was particularly developed for DFTB3 method and can be used for organic and biomolecules.48,49Simulation details
The glucuronic acid molecule (ESI, Fig. S1†) was used as a model system in this study. It was placed in a simulation box with dimensions of 30 Å × 30 Å × 30 Å and with periodic boundary conditions applied in all Cartesian directions. The volume of the box was chosen to be much larger than the system itself, which was done to randomly create a single O atom around the structure (see below). The choice of O atom as reactive species is based on previous works showing that it can act on the model system as two OH radicals.35,50–52 In other words, O atoms and OH radicals give rise to the same mechanisms, but because MD simulations are very time-consuming, and O atoms can thus speed up the reactions, useful results can be obtained within a more reasonable computation time. The model system was then energy minimized employing the conjugate gradient method. Subsequently, the system was equilibrated for 600 ps, in the canonical (NVT) ensemble (i.e., constant number of particles N, volume V and temperature T) at 300 K, using the Berendsen thermostat with a coupling constant of 100 fs.53 The equilibration time used was sufficient to obtain a well thermalized structure (ESI, Fig. S2†). After that, a single O atom was randomly created around the model structure at a distance of at least 5 Å from the molecule. This was done to avoid initial long distance non-bonded interactions (i.e., Coulomb and van der Waals) between the O atom and the glucuronic acid molecule. To obtain some statistics for bond breaking and formation processes and to study all possible mechanisms of O atom interaction with the glucuronic acid molecule, 200 DFTB-MD runs were performed. Each simulation lasted for a total time of 100 ps (i.e., 2 × 10⁵ iterations), which was sufficiently long to observe the processes of bond dissociation and formation in the model structure. The same temperature and thermodynamic ensemble mentioned above were used during the particle impact simulations. In all simulations, i.e., during the equilibration as well as in particle impact simulations, a time step of 0.5 fs was used. All simulations were carried out using the DFTB+ package.54,55Results
For this work, most of the experiments on alginate are done using 5 g L−1 biopolymer concentration (0.5%w/vol). This concentration was selected in a previous work as being in the lower range for the easy production of stable hydrogels.30 5 g L−1 corresponds to a concentration of residues (mannuronate and guluronate) of about 3 × 10⁻² M. This is a very high concentration, if compared with the amount of reactive species, and in particular of OH radicals, that are typically generated during our NTP treatments (rate of formation 10−9 mol s−1, that would correspond to 10−7–10−6 mol generated during a 10 min treatment).41 For this reason, to emphasize the effect of the NTP treatment on alginate and glucuronate, we performed some experiments using lower concentrations (10−4–10−3 M). In this situation we assume that the chemical modifications that we have detected were the same, only to a different extent.Size exclusion chromatography
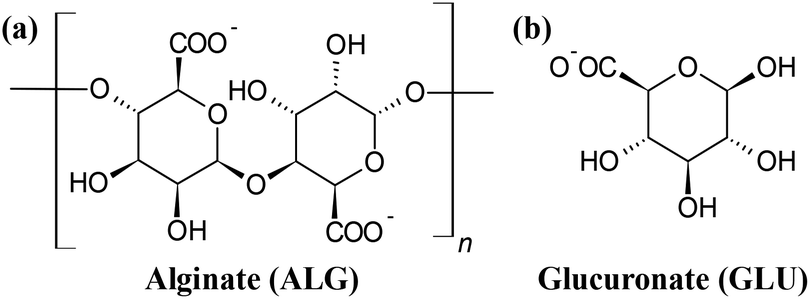
The effect of NTP treatment on the molecular weight (MW) distribution of alginate solutions with different starting concentrations (0.05, 0.5 and 5 g L−1) was assessed by size exclusion chromatography. The results are collected in Fig. 1. Fig. 1a reports the chromatograms of 0.5 g L−1 alginate solutions treated for different times; chromatograms for 0.05 and 5 g L−1 samples have similar peaks and trends (Fig. S3, S4 and S5, ESI†). The chromatogram of the untreated sample (black line) shows a large peak centered at 5.5 min and a small peak at 10.2 min. These two retention times correspond to the separation limits of the column. The peak at 5.5 min is due to alginate, whose MW distribution ranges from 10–600 kDa (as indicated by the provider) so the components with higher molecular weight are not separated by the column (5–300 kDa). The peak at 10.2 min is likely due to sodium ions and to any impurities contained in the samples, with MW lower than 5 kDa. All the components that appear at this retention time are fully retained by the column. By increasing the NTP treatment time, the peak at 5.5 min decreases and moves to higher retention times, the peak at 10.2 min increases and we can observe an increase in the signal between 6.5 and 10 min, along all the column separation range. Fig. 1b reports the area evolution of the peak at 5.5 min (black points, 4.7–6.5 min), the region between 6.5 and 9.9 min (red points) and the sum of these (blue points, 4.7–9.9 min) for all NTP treatment times in the case of the 0.5 g L−1 alginate solutions; similar plots were obtained for 0.05 and 5 g L−1 samples (Fig. S4 and S5, ESI†). Overall, the area of the signal of untreated alginate decreases exponentially with the treatment time (half-life time (1030 ± 20) s) and, at the same time, the overall area within all the column separation range increases. The sum of both contributions remains constant with the treatment time. In Fig. 1c we report the comparison of the decrease of the alginate peak (5.5 min) with the treatment time, for the three concentrations studied. The dependence of the decay time with the starting concentration is evident. The half-life times estimated for the experiments with 0.05 and 5 g L−1 are (580 ± 40) s and (8000 ± 2000) s, respectively. The area of the peak at 10.2 min as function of the NTP treatment time (Fig. 1d) for the three concentrations studied shows a linear increase of the signal as function of the treatment time in all cases. By fitting linearly the experimental points we obtained the values of intercept (area of the peak at time zero) and the slope (increase rate of the peak) for the three cases. The slope is roughly the same for the three cases, (570 ± 30) kAU s−1, while the intercept increases with one order of magnitude by increasing the alginate concentration accordingly ((3.46 ± 0.03), (22.9 ± 0.2) and (221 ± 4) kAU). This confirms that the signal at 10.2 min is due to ions and small molecular impurities present in the raw material (signal at time zero) and to the reactive species generated by NTP, whose concentration does not strongly depend on the polymer concentration (constant slope).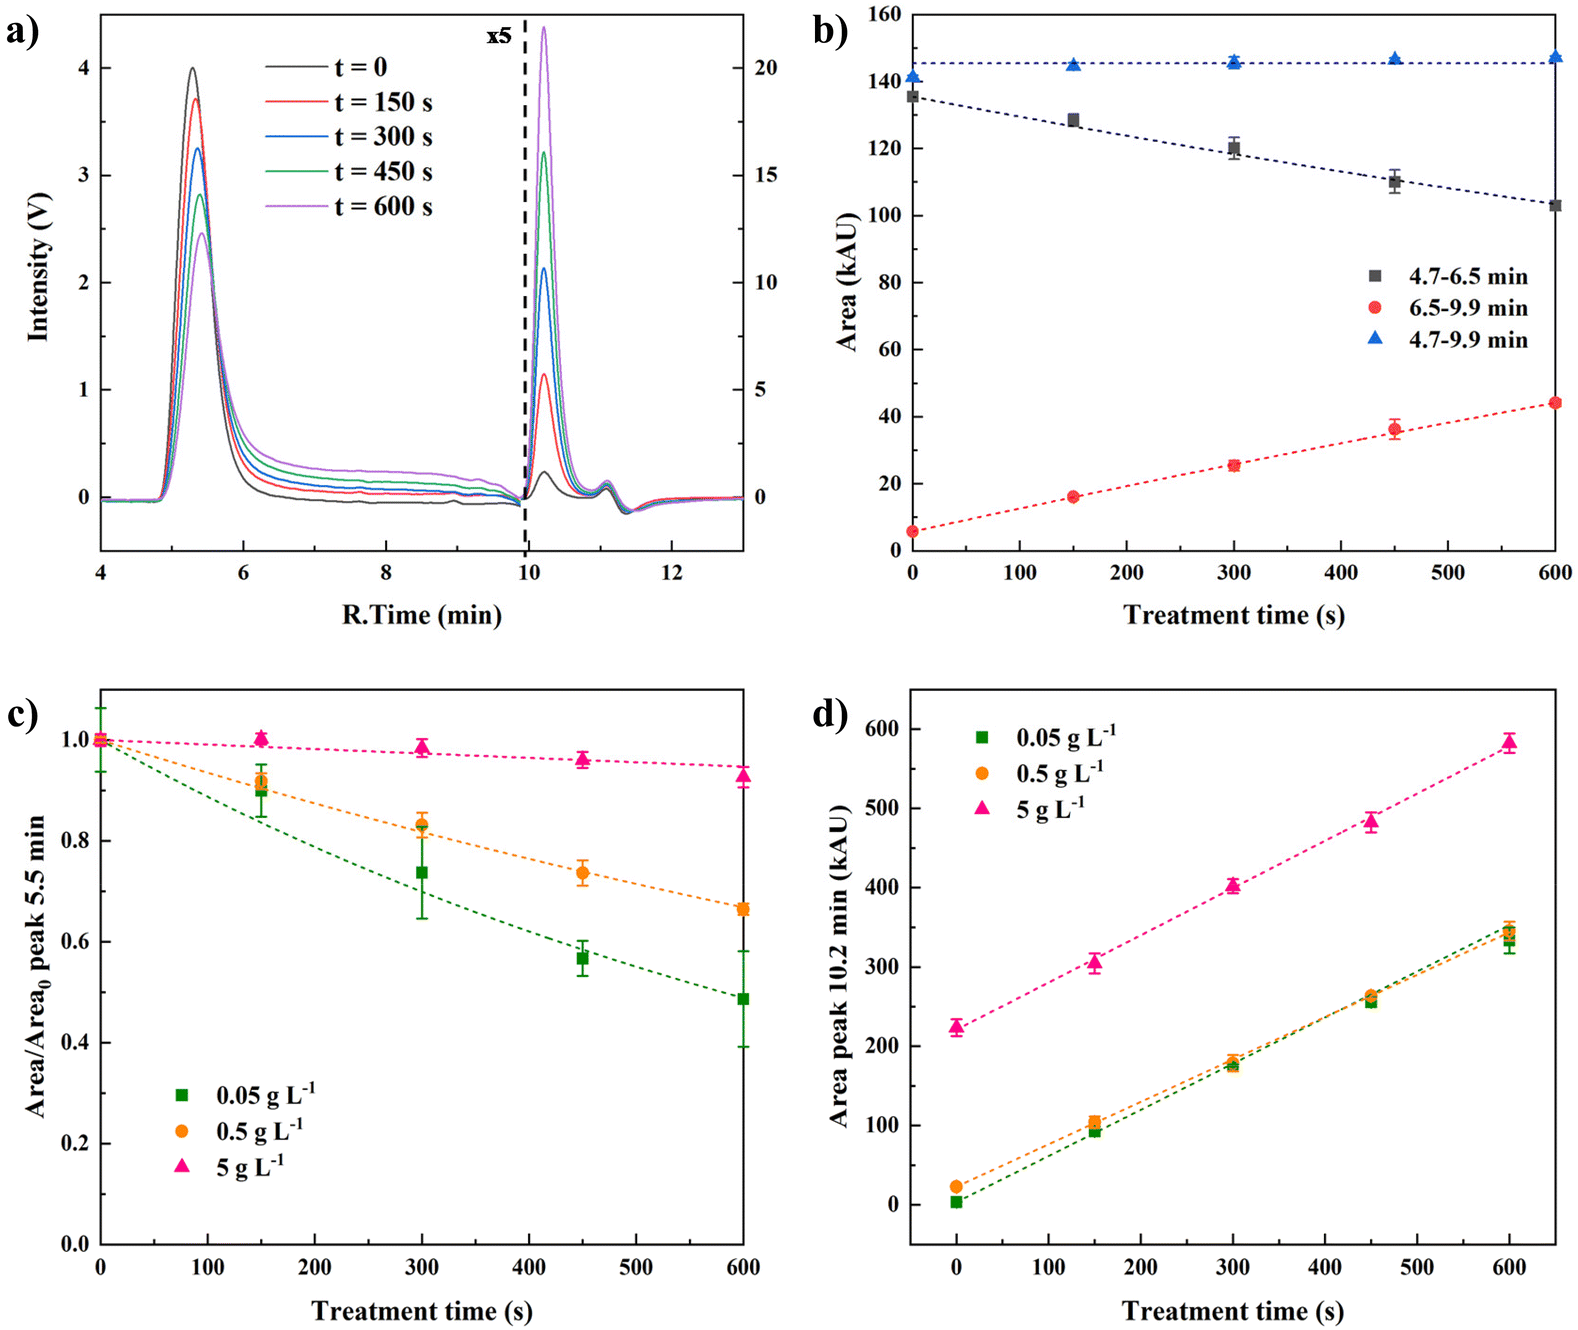 | ||
| Fig. 1 Results of SEC experiments on NTP-treated alginate solutions. (a) Chromatograms of 0.5 g L−1 alginate solutions treated by NTP for different times; the left part of the figure (before the black dashed line) has been enlarged 5 times to emphasize the differences; (b) areas of different portions of the chromatograms for 0.5 g L−1 alginate solutions as function of the treatment time; the dashed lines are exponential (black and red) or linear (blue) fits; (c) relative area of the peak centered at 5.5 min as function of the treatment time for 0.05, 0.5 and 5 g L−1 alginate solutions; the dashed lines are exponential fits; (d) area of the peak centered at 10.2 min as function of the treatment time for 0.05, 0.5 and 5 g L−1 alginate solutions; the dashed lines are linear fits. The data in panels b, c and d are expressed as average ± standard deviation; n = 3. | ||
Rheology
The effects of NTP treatment on the viscosity of alginate solutions and on the visco-elastic properties of alginate hydrogels have been assessed by rheology. The viscosity profile as function of the shear rate of untreated and 10 min NTP-treated 5 g L−1 alginate solutions (Fig. 2) reflects a decrease of viscosity on the NTP-treated samples compared to the untreated control, with viscosity ranging from 0.022 Pa s to 0.012 Pa s at a shear rate of 100 s−1. Irrespective of the possible effect of NTP on alginate chains, the water evaporation during a 10 min NTP treatment would increase its concentration from 5 to 5.8 g L−1. To consider this, the viscosity profile of control alginate solutions at concentrations of 5.5 g L−1 and 6 g L−1 was also determined. Both controls displayed higher viscosity profiles compared to 5 g L−1 alginate solution control. Thus, the viscosity decrease observed in the 10 min-treated alginate cannot be attributed to the water evaporation that happens during the NTP treatment since that would increase the viscosity of the sample.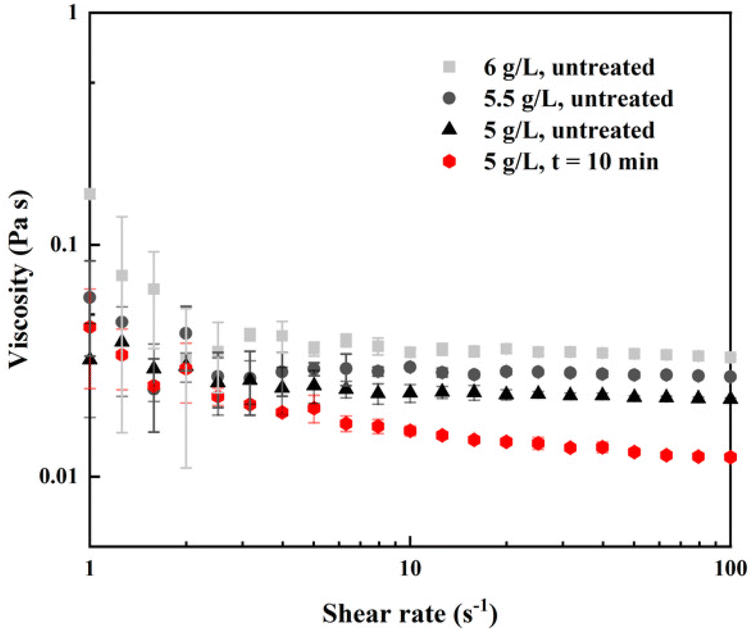 | ||
| Fig. 2 Viscosity profiles of untreated and 10 min-treated alginate solutions. In grey are reported the data for control solutions with higher concentrations (5.5 and 6 g L−1) to show the effect of water evaporation. Data are expressed as average ± standard deviation; n = 3. | ||
Table 1 reports the viscosity values at shear rate 100 s−1 of the 5.5 g L−1 and 6 g L−1 controls and the 5 g L−1 alginate solutions treated with NTP for 0, 2, 4, 6, 8 and 10 minutes. Results showed that viscosity values of 2 min (18.4 Pa s) and 4 min (19 Pa s) NTP treatment were close to the non-treated control (21.6 Pa s). However, from 6 min to 10 min NTP treatment conditions, the viscosity decreased when increasing the NTP treatment time.
| Sample | η (mPa s) | G′ (kPa) |
|---|---|---|
| 6 g L−1, untreated | 32.6 ± 0.6 | 6.8 ± 0.3 |
| 5.5 g L−1, untreated | 26.9 ± 0.5 | 5.9 ± 0.3 |
| 5 g L−1, untreated | 21.6 ± 0.3 | 5.6 ± 0.5 |
| 5 g L−1, 2 min | 18.4 ± 0.7 | 5.1 ± 0.3 |
| 5 g L−1, 4 min | 19 ± 4 | 2.7 ± 0.4 |
| 5 g L−1, 6 min | 16.2 ± 0.7 | 2.6 ± 0.3 |
| 5 g L−1, 8 min | 15 ± 4 | 2.0 ± 0.2 |
| 5 g L−1, 10 min | 12.1 ± 0.1 | 1.97 ± 0.08 |
The storage modulus of cross-linked hydrogels (Table 1) showed a similar trend as viscosity. The untreated hydrogel controls (5.5 g L−1 5.9 kPa and 6 g L−1 6.8 kPa) displayed higher storage modulus than 5 g L−1 alginate hydrogel (5.6 kPa). In the NTP-treated hydrogels, the storage modulus decreased in a NTP treatment time-dependent manner, i.e. from 5.6 kPa at time 0 to 1.97 kPa at 10 min NTP treatment.
Scanning electron microscopy
The effect of NTP treatment on the structure and topography of the studied samples (5 g L−1 cross-linked treated and untreated alginate solutions) was investigated by SEM (Fig. 3). SEM micrographs displayed differences between 5 g L−1 alginate hydrogels, untreated and 10 min treated. Untreated samples showed the typical porous structure of crosslinked alginate hydrogels with a large amount of pores with uniform morphology and homogeneous distribution (Fig. 3a).56,57 Apparently, in a very qualitative manner, the 10 min NTP treatment seemed to have an influence on the microstructure that looked more irregular, with a lower number of pores which were also heterogeneously distributed through the surface than those of untreated alginate hydrogels (Fig. 3b). | ||
| Fig. 3 Representative SEM images of the fracture of untreated (a) and 10 min NTP-treated (b) cross-linked alginate from 5 g L−1 alginate solutions. | ||
Validation of glucuronate as a model for alginate
Since alginate, being a macromolecule, cannot be analyzed using standard chromatographic methods, we selected a small molecular model, glucuronate, for this purpose. To validate the model, in terms of chemical effects of NTP treatment, we prepared solutions of glucuronate and alginate in phosphate buffer with the same concentration (5 g L−1) and quantified the NTP-generated RONS. Fig. 4 reports the concentration of hydrogen peroxide (a), nitrite ions (b) and 2-hydroxyterephthalate (c, the hydroxylation product of terephthalate, related to the production of OH radicals) as function of the treatment time in 5 g L−1 alginate and glucuronate solutions (that corresponds to 21.7 mM for glucuronate). The values generated in phosphate buffer are reported as well for comparison. In all cases, the concentration of RONS (and hTPA) increases linearly with the NTP treatment time, at least for the short treatment times. The values obtained in alginate and in glucuronate solutions are the same, within the experimental errors, in all cases, and differ from the values obtained in phosphate buffer. The concentration of hydrogen peroxide and nitrite ions is higher in alginate/glucuronate solutions than in phosphate buffer, in accordance with the trend reported in a previous work,30 while the concentration of hTPA is lower. By fitting the experimental data with linear functions we were able to obtain the generation rates of all species, which are reported in Fig. 4.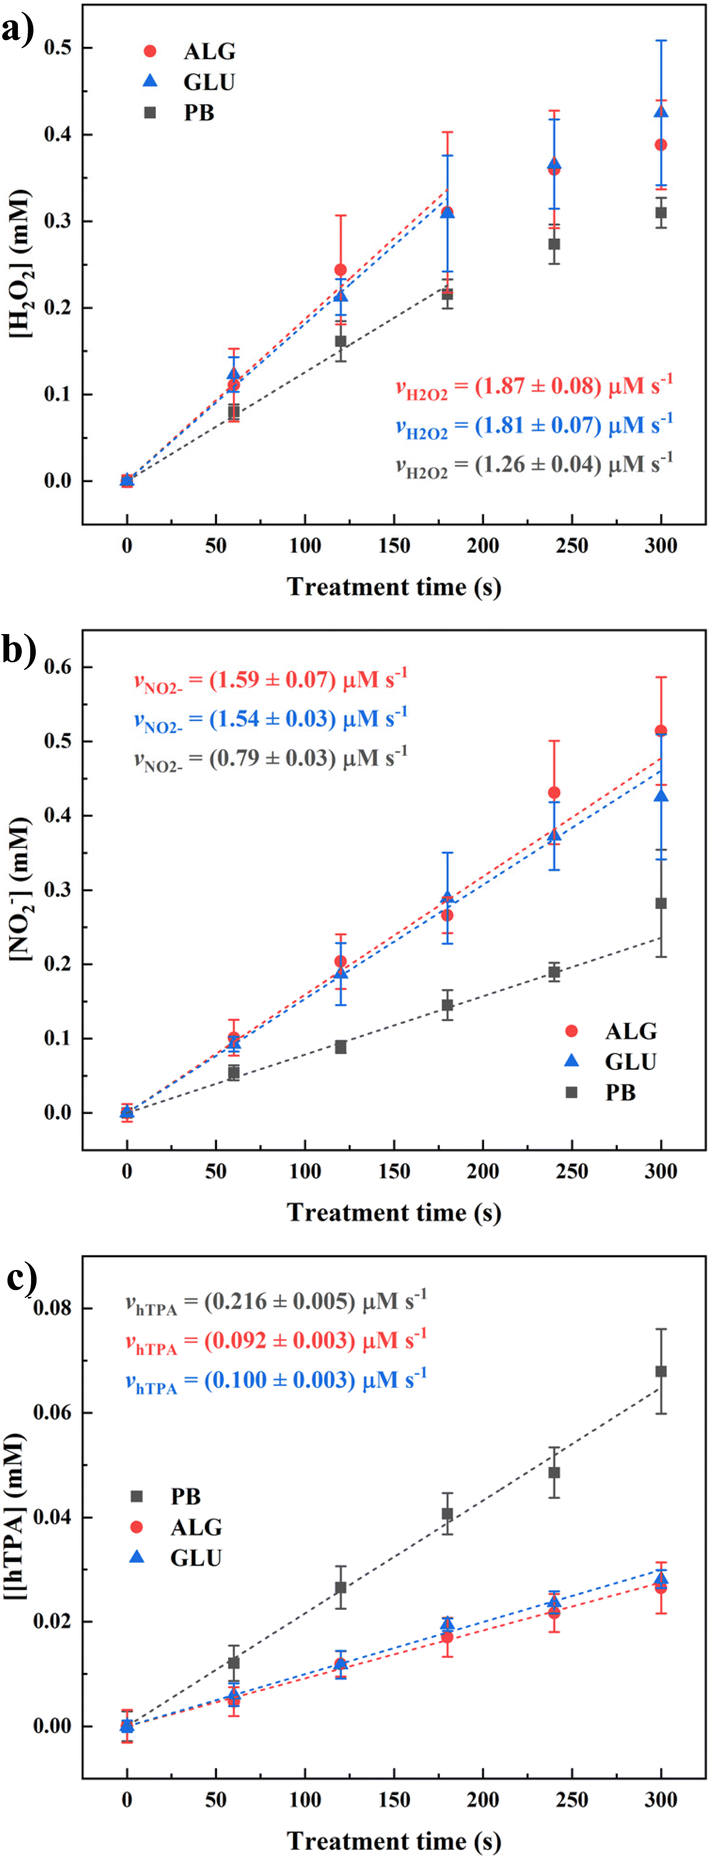 | ||
| Fig. 4 Quantification of NTP-generated reactive species as function of the treatment time in phosphate buffer (PB), 5 g L−1 alginate solution (ALG) and 5 g L−1 (21.7 mM) glucuronate solution (GLU). (a) Hydrogen peroxide; (b) nitrite ions; (c) 2-hydroxyterephthalate as indirect measure of OH radicals. The dashed lines are linear fits. The data are expressed as average ± standard deviation; n = 3. The generation rates of the species, obtained by fitting of the curves, are also listed. | ||
HPLC-MS of NTP-treated glucuronate
Once glucuronate was validated as a suitable model for alginate to study the effect of NTP treatment on the chemical structure, 1 mM glucuronate solutions were exposed to NTP for different times and analyzed by HPLC-ESI-MS to detect and quantify the residual glucuronate concentration and any oxidation product generated by interaction with NTP-generated RONS. The chromatograms highlight the presence of two main compounds, other than glucuronate, whose mass spectra are reported in Fig. 5. The first compound has m/z 191 and molecular formula C6H7O7− (Fig. 5b). The proposed structure is added in the figure. It has a double carbon–carbon bond in some position in the 6-membered ring and it is in keto-enolic equilibrium with seven other structures (Fig. 5e). The second component has m/z 163 and molecular formula C5H7O6− (Fig. 5c). The formation of these oxidation products is in agreement with previously published data.23 By analyzing the trend of the signals of glucuronate and the two main oxidation products as a function of the NTP treatment time (Fig. 5d) we observed an exponential decrease for the first, with half-life time of about 15 min and an increase of the other two with trends typical of reaction intermediates.58 In principle, other oxidation products were generated during the oxidation of glucuronate, but we were not able to detect them so we may assume that they are either not stable or have very minor contribution.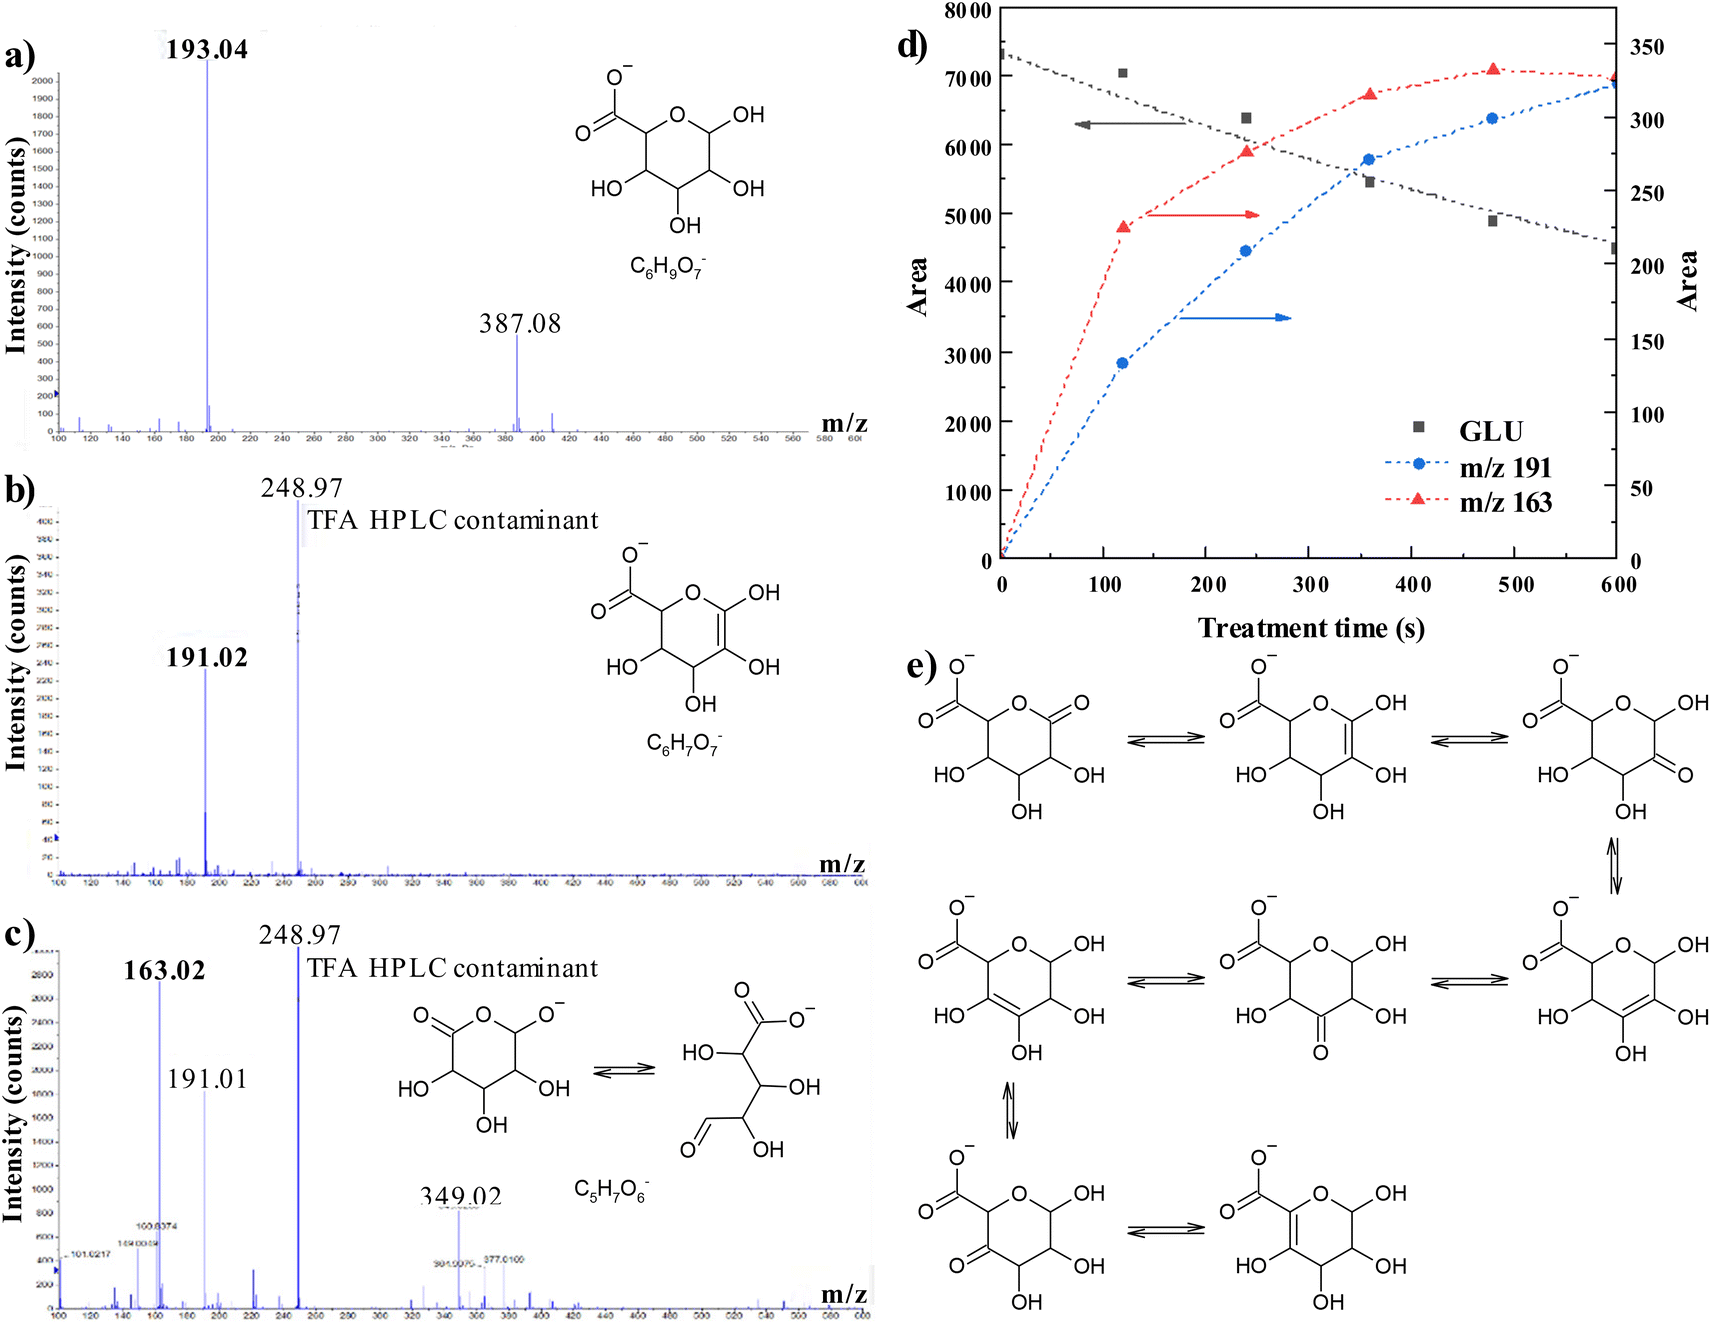 | ||
| Fig. 5 HPLC-ESI-MS analysis of NTP-treated glucuronate. Negative ESI-MS spectra of glucuronate (a) and of the two oxidation products with m/z 191 (b) and m/z 163 (c); intensity of the signal of the 3 compounds as function of the NTP treatment time (d) (the black dashed line is the exponential fit of the experimental data, the red and blue dashed lines are a guide for the eye); keto–enol tautomerism equilibria of the oxidation product with m/z 191 (e). | ||
Reactive MD simulations
To confirm the experimental results and to obtain further information on the interaction of NTP-generated short-lived RONS with glucuronate, as a model for alginate, we performed reactive MD simulations. Specifically, we investigated the nonconsecutive impact of O atoms on intact glucuronic acid. The O atom was chosen as impinging particle in our simulations because of its representative behavior for NTP-induced reactive oxygen species.35,50–52 Note that, as mentioned above, we chose glucuronic acid as the model system, rather than its deprotonated form, since the water layer surrounding the model molecule was not taken into account due to the high computational cost of the DFTB-MD method. Nevertheless, the simulation results qualitatively agreed with the experimental results (see Discussion section), so that the approach used is justified. The same approach was used in a recent study with cellotriose molecule and the computational results were also in a good agreement with the experiments.35 A table with all the detailed results obtained from the simulations is given in the ESI (Table S1†). Here we just report the main outcomes (Fig. 6). The results of the simulations show that most of the possible reactions between the O atom and the glucuronic acid start with the abstraction of one or two hydrogen atoms (89.5% of the runs), at different carbons (35.5% of the runs) and/or oxygen atoms (59.5% of the runs) in the molecule. Subsequently, the most common outcomes are the generation of hydroxyl groups (30% of the runs, mostly geminal diols, 22%), the formation of oxygen-oxygen (i.e., peroxide) bonds (44% of the runs), the liberation of carbon dioxide and water (25.5% of the runs) and the fragmentation/opening of the six-membered ring (22% of the runs). Other minor events were observed, like the generation of biradical species (3%), the formation of carbenes (2%), epoxides or dioxiranes (1.5%) and ethers (0.5%). The sum of all these outcomes is higher than 100% because some events occur together. Many of these compounds are not stable, so if they are formed during the NTP treatment, they are expected to react fast into more stable products. Some possible mechanisms will be discussed in the next section and used to explain the experimental data.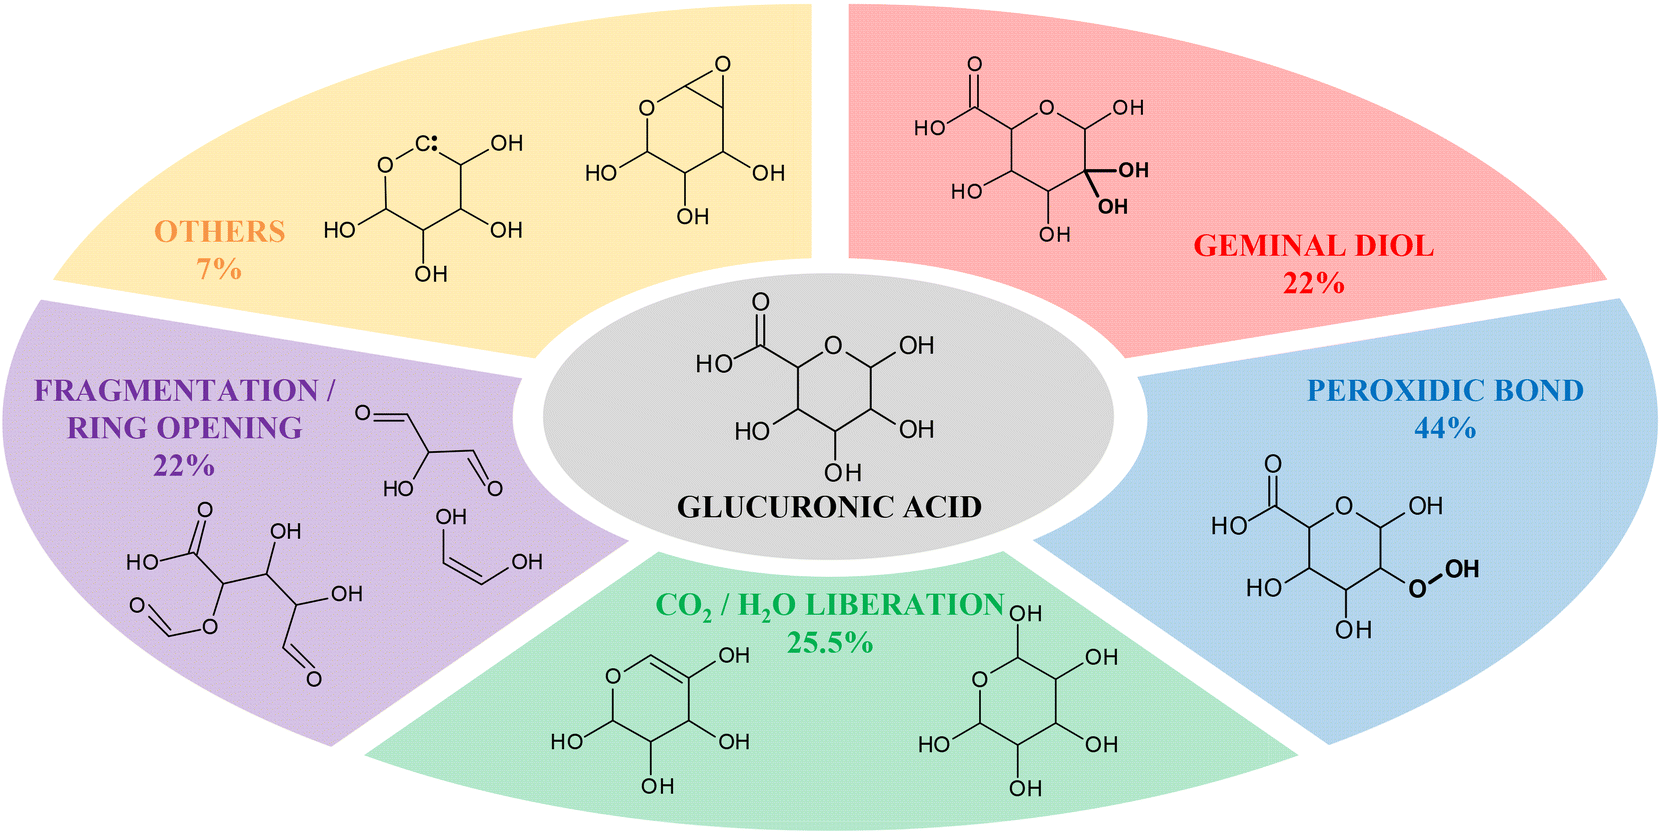 | ||
| Fig. 6 Summary of the main outcomes and associated probabilities obtained from reactive MD simulations. The sum of all the percentages is higher than 100% because some events occur together. | ||
Discussion
In this paper we show how NTP treatment, using an APPJ source, effectively modifies alginate in solution, as well as glucuronate, used here as molecular model for alginate. We also show and explain how the presence of organic matter in solution (in the form of small molecules and/or macromolecules) and its oxidation products affects the generation of long-lived RONS.NTP treatment fragments alginate chains
The most important macroscopic effect of NTP treatment on alginate solutions is related to diminishing the viscosity with increasing NTP treatment time. We measured a decrease of about 50% for a 10 min treatment in a 5 g L−1 alginate solution (see Fig. 2 and Table 1). The effect is even larger if we take into account the water evaporation during treatment, which has the opposite effect of the NTP treatment by increasing the viscosity of the solution. This effect of lowering a biopolymer solution viscosity by NTP treatment was already observed in the literature, for low biopolymer concentrations.59 For high biopolymer concentrations, the contribution of water evaporation is more important than the extent of polymer modification induced by the NTP, so the net effect is a viscosity increase.59,60 The decrease in viscosity of a polymer solution can be related to the decrease of the molecular weight distribution, according to the Mark–Houwink eqn (1):61| [η] = k·MWa | (1) |
The results obtained by SEC (Fig. 1) concur with this explanation. Indeed, a clear decrease and a shift of the peak of alginate with the treatment time is observed together with an increase of the generation of smaller fragments with a very broad molecular weight distribution. This effect was more evident when treating the polymer at low concentration (0.05 g L−1), but it was also confirmed at high concentration (5 g L−1) (Fig. S4, ESI†). The same effect was recently reported also with methylcellulose, that has a similar chemical structure to alginate.32
Putting together SEC and rheology results, there is a clear evidence that NTP treatment is able to fragment, to various extents, alginate chains in solutions. This ability to break biopolymer chains in water solutions was also observed on proteins where the results showed the cleaving effect of NTP-generated RONS on the peptide bonds.33
NTP treatment decreases the crosslinking degree of alginate hydrogels
The second macroscopic effect observed in alginate, after NTP treatment, is its modified crosslinking ability. The stiffness of alginate hydrogels decreases with increasing treatment time on the alginate solution prior to crosslinking (Table 1). A 65% decrease of the storage modulus of hydrogels was recorded in 5 g L−1 alginate solutions treated for 10 min with NTP. As discussed in the previous paragraph, the effect is larger if we take into account the water evaporation (see Table 1 and ref. 60). The lower storage modulus can be explained by the partial chain fragmentation discussed earlier, but also by invoking a lower crosslinking degree in the hydrogels obtained with NTP-treated alginate solutions. SEM micrographs (Fig. 3) provided visual proof of evident changes on the microstructure, thus corroborating the effect of NTP treatment on the crosslinking degree of alginate hydrogels.Alginate hydrogels crosslink via ionic interactions between the carboxylic groups of the biopolymer and divalent cations in solution (Ca2+ in the current case).37 As the NTP treatment is applied to alginate solutions before adding the calcium salt, its effects can be ascribed to reactivity with the carboxylic groups in the polymer chains.
Oxidation products of NTP-treated glucuronate help understanding the modifications on alginate
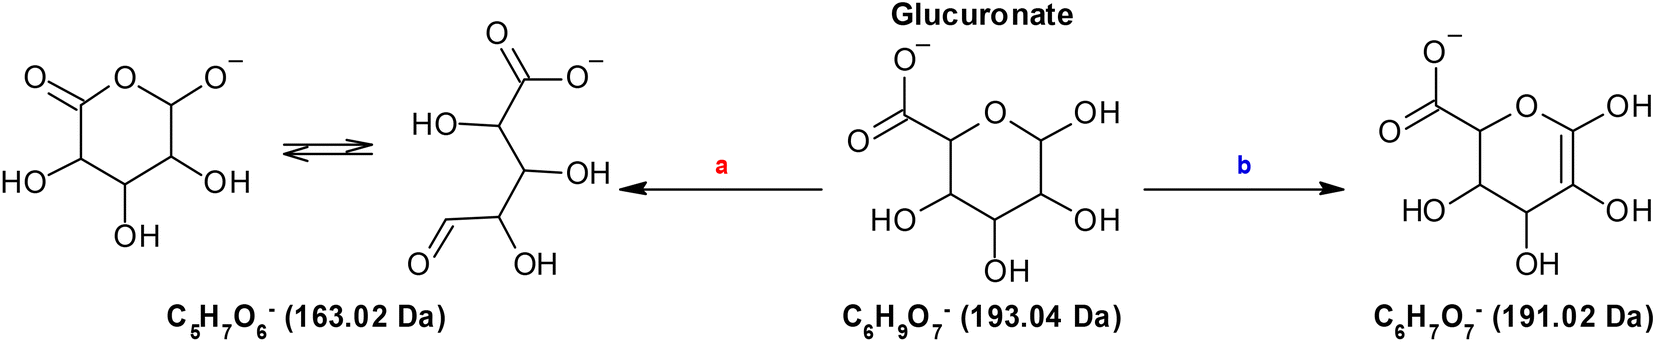
In order to obtain more information, at the chemical level, on the modifications induced on alginate by NTP treatment, it is mandatory to detect and identify its oxidation products, so we used a molecular model. A possible choice is to select a monomer, glucuronate, as it has been done in many publications that used glucose to study the oxidation of cellulose.62–64 Glucuronate has the same functional groups and configuration as alginate (see Scheme 1) and therefore, a similar reactivity towards NTP-generated RONS is expected. The results reported in Fig. 4 confirm this hypothesis. The amount of RONS generated by NTP treatment is the same, in alginate and glucuronate solutions, and different in phosphate buffer only. This means that the organic components, macromolecules or small molecules, have the same effect in solution in terms of reactivity. The lower generation of hydroxyterephtalate in alginate and glucuronate solutions (Fig. 4c) indicates that they both act as scavengers for short-lived NTP-generated RONS (e.g., O and OH radicals), generating as a consequence a variety of oxidation products.HPLC-MS analysis on NTP-treated glucuronate C6H9O7− (193.04 Da) solutions allowed to identify two main oxidation products (Fig. 5); the first one with 2 Da less than glucuronate, C6H7O7− (191.02 Da) (with a double bond or a keto group at some part of the molecule), in keto–enol equilibrium, and the second compound with the formula C5H7O6− (163.020 Da), which is the result of the loss of CO with a simultaneous oxidation (Scheme 2).
 | ||
| Scheme 2 Glucuronate and the two oxidation products detected by MS analysis. | ||
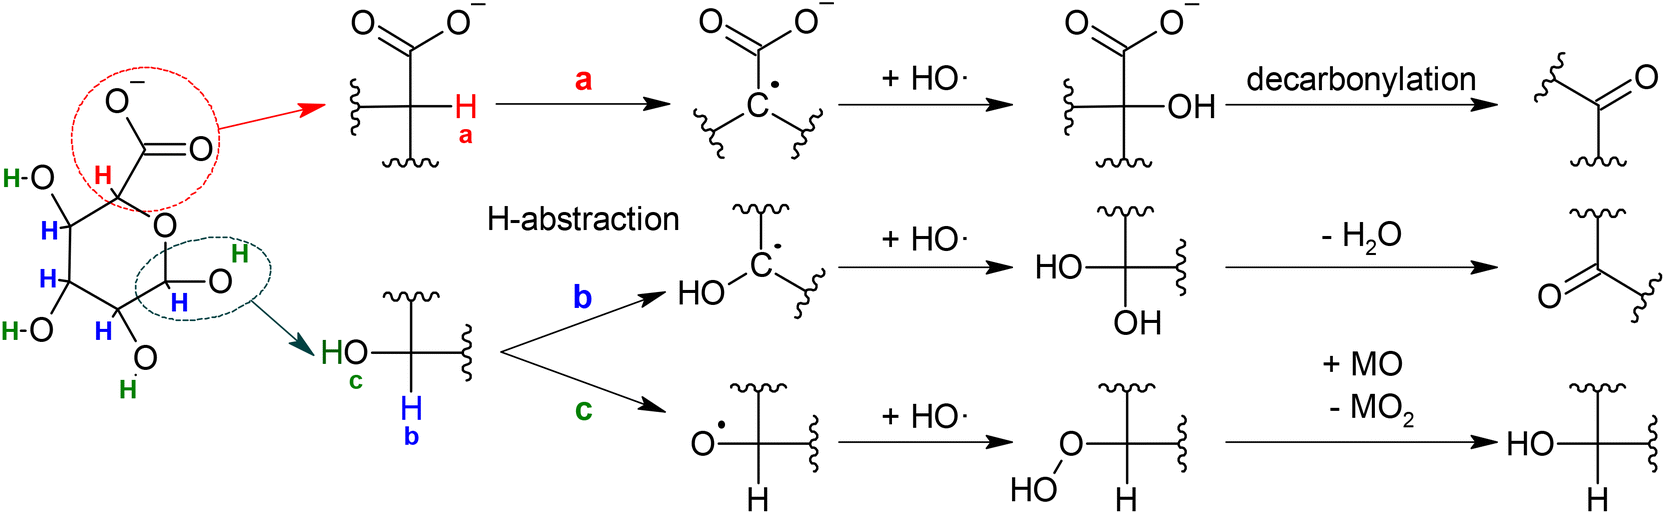
Combining the results from the MS analysis and the MD simulations, led us to propose chemical mechanisms to explain the generation of the oxidation products of glucuronate during the NTP treatment and the interaction of the organic molecule with the NTP-generated RONS. The main short-lived reactive species generated by our NTP jet in the current treatment conditions, are OH radicals.41 Typically, when OH radicals interact with non-aromatic organic molecules, the first event is the abstraction of a H atom followed by the generation of a water molecule and an organic radical. This was confirmed by the MD results that indicated the abstraction of an H atom as starting step for almost 90% of the runs. There are three kinds of H atoms in glucuronate: one in α position to the carboxyl group (a), four in α position to the hydroxyl groups (b) and four in the hydroxyl groups (c). These different hydrogens are indicated in the left part of Scheme 3 and labeled with different colors.
 | ||
| Scheme 3 Proposed mechanisms for the generation of the oxidation products of glucuronate. | ||
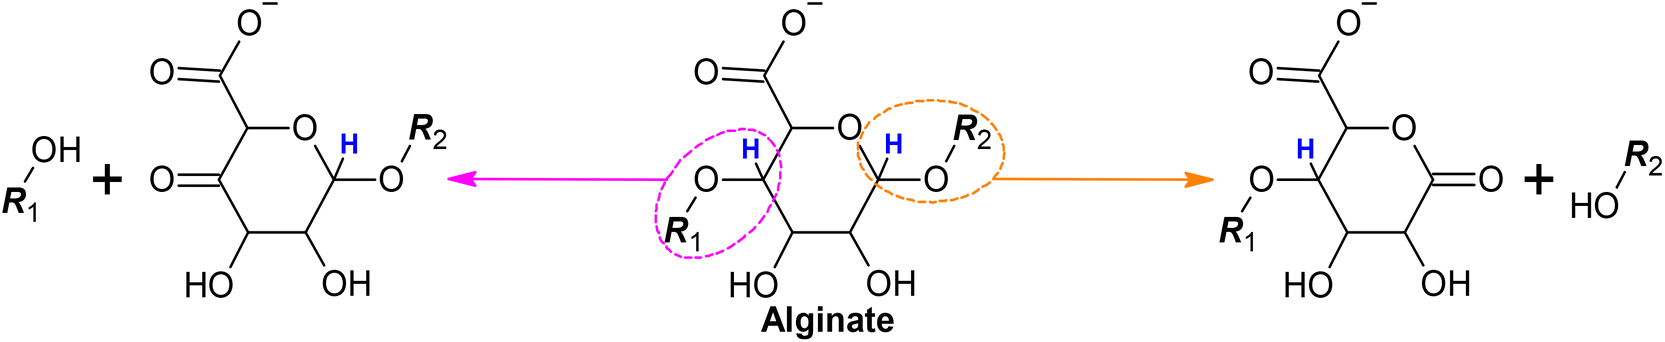
If the H-abstraction happens in position “a”, what follows is the generation of an α-hydroxy acid that can undergo decarbonylation to generate a ketone.65 This pathway is represented in Scheme 3a and can explain the generation of the glucuronate oxidation products with m/z 163.02 detected in the HPLC-MS analysis. If the H-abstraction happens in any of the four “b” positions, it is followed by the generation of a geminal diol that is in equilibrium with its keto-form. This pathway is represented in Scheme 3b and explains the generation of the oxidation product with m/z 191.02, in keto–enol tautomerism. Lastly, if the H-abstraction happens in any of the four “c” positions (Scheme 3c), it is followed by the generation of an organic peroxide that can subsequently decompose to regenerate glucuronate by oxidizing a third molecule that, in the current case, could be water or nitric oxide.
The results obtained by MD simulations (Fig. 6) are perfectly in line with the outcomes of the MS analysis. As already reported, the first event in most of the runs was H-abstraction from carbon or oxygen atoms. Then the major outcomes, as already mentioned in the previous section, are the generation of germinal diols, the generation of peroxidic bonds, the liberation of carbon dioxide and water and the fragmentation/opening of the central ring.
HPLC-MS analysis follows the kinetic of glucuronate oxidation and its two oxidation products with NTP treatment time (Fig. 5d). At long treatment times, above 6 min, the signals of the two oxidation products reach a maximum and then start to decrease. This indicates that they are reaction intermediates that can be further oxidized by NTP-generated RONS.
Extrapolating the information obtained on glucuronate to the case of alginate allows to identify the chemistry behind the macroscopic effects observed on the polymer discussed earlier. The partial decarbonylation can be responsible of the lower crosslinking degree of hydrogels prepared from NTP-treated alginate. As mentioned before, alginate crosslinks by ionic interactions between the carboxylic groups in the alginate chains and divalent cations in solution. If the concentration of carboxylic groups in alginate is reduced, there are less crosslinking points in the resulting hydrogel that will be less stiff, i.e. with a lower storage modulus.
The fragmentation of the alginate chains observed by SEC (Fig. 1), responsible for the decreased viscosity (Fig. 2), can be due to H-abstraction of one of the two H atoms highlighted in Scheme 4. This would lead to the formation of a keto group and the breaking of the chain. This event can happen with the same probability to any of the residues on the alginate chain, leading to the generation of fragments with a very wide distribution of molecular weights (increase of the signal in the SEC chromatogram along all the separation range of the column).
 | ||
| Scheme 4 Chemical representation of the possible fragmentation of alginate during NTP treatment. | ||
Alginate (and glucuronate) in solution enhances the generation of long-lived reactive species
The amount of hydrogen peroxide and nitrite ions detected in the liquid after NTP treatment is higher in presence of organic matter, irrespective whether it is alginate or glucuronate (Fig. 4). The main chemical routes that could lead to the generation of these two species do not happen within the liquid. Hydrogen peroxide is mainly generated by recombination of OH radicals, according to reaction (2) that takes place predominantly above the gas–liquid interface.66,67 Nitrite ions come from the dissociation in water of nitrous acid (3) that, in turn, is generated by reactions of nitric oxide and nitrogen dioxide with water molecules or with OH radicals (4)–(6), which are also reported to occur primarily in the gas-phase.10| OH + OH → H2O2 | (2) |
| HNO2(aq) + H2O(l) → H3O+(aq) + NO2−(aq) | (3) |
| NO + OH → HNO2 | (4) |
| NO + NO2 + H2O → 2HNO2 | (5) |
| 2NO2 + H2O → HNO2 + HNO3 | (6) |
The presence of organic matter in solution does not affect the gas-phase chemistry. Therefore, it likely enables new pathways within the liquid for the secondary generation of long-lived RONS. The data obtained from the MD simulations (see Fig. 6 and Table S1†) report that the major outcome of direct NTP treatment on glucuronate and, by extension on alginate, is the generation of organic peroxides, as obtained in almost half of the runs. These organic peroxides are not stable so we were not able to detect them by mass spectrometry. They likely decompose by transferring an oxygen atom to another molecule in solution, water or nitric oxide, restoring in this way the more stable hydroxyl group (Scheme 3c). If the oxygen atom is transferred to a water molecule, hydrogen peroxide is generated (7), if it is transferred to nitric oxide, the outcome is nitrogen dioxide (8), that can contribute to the formation of nitrous acid via reaction (5) and (6)
| ROOH + H2O → ROH + H2O2 | (7) |
| ROOH + NO → ROH + NO2 | (8) |
These mechanisms explain why, although the formation of organic peroxides is the most probable event according to the MD data, it was not possible to detect them experimentally in the NTP-treated solutions. Instead, an increase in the generation of hydrogen peroxide and nitrite ions was observed.
Conclusions
In this paper, we demonstrate that the physic-chemical properties of alginate solutions are affected by direct non-thermal plasma treatment. Macroscopically, we detected lower viscosity and lower crosslinking ability of NTP-treated alginate solutions. We could formulate mechanisms to explain these effects at a chemical level, by using glucuronate as a molecular model and by analysing its interaction with NTP-generated reactive species using mass spectrometry and molecular dynamics simulations. In particular, we showed that NTP is able to oxidize and fragment the alginate chains as well as to interact and modify its carboxylic groups. The extent of the modifications induced by NTP treatment on the biopolymer is however not large enough to compromise its functionalities in its hydrogel form.Besides, alginate plays a role in the generation of NTP-derived long-lived reactive species. A higher amount of hydrogen peroxide and nitrite ions was detected in presence of alginate and we were able to explain this as the consequence of the generation of organic peroxides during NTP treatment that, by decomposing, open new pathways in solutions for the secondary generation of long-lived species.
Many of the results of these work can be extended also to other relevant biopolymers since the basic structure of alginate is in large part similar to many other polysaccharides that are used in biomedicine, like cellulose, hyaluronic acid, chondroitin, etc.
Thus, with this work we provide a chemical rationale for the use of plasma-treated liquids containing organic matter in biomedical applications. The presence of organic matter, alginate or glucuronate in the current case, on the one hand, causes the generation of a large variety of oxidation products that may have biological effects and, on the other hand, affects the amount of bioactive reactive species generated by NTP. In the case of biopolymers with the ability of generating hydrogels, these effects are even more important because these hydrogels can then be used as vehicles for storage and controlled release of reactive species and other oxidation products for new non-invasive therapies.
Data availability statement
The datasets supporting this article have been published in the article itself and as part of the ESI.†Author contributions
Conceptualization: FT, AEN, CL, MY, CC; data curation: FT, AEN, MY; formal analysis: FT, AEN, MY; funding acquisition: MPG, CC; investigation: FT, AEN, MY; methodology: FT, AEN, CL, MY, AB, CC; project administration: AB, CC; resources: MPG, AB, CC; software: MY; supervision: FT, AB, CC; validation: FT, AEN, MY; visualization: FT; writing – original draft: FT, AEN, MY; writing – review & editing: all authors.Conflicts of interest
There are no conflicts to declare.Acknowledgements
We thank Gonzalo Rodríguez Cañada and Xavier Solé-Martí (Universitat Politècnica de Catalunya) for help in collecting some of the experimental data and for the useful discussions. This work has been primarily funded by the European Research Council (ERC) under the European Union's Horizon 2020 research and innovation program (grant agreement no. 714793). The authors acknowledge MINECO for PID2019-103892RB-I00/AEI/10.13039/501100011033 project (CC). The authors belong to SGR2022-1368 (FT, AEN, CL, MPG, CC) and acknowledge Generalitat de Catalunya for the ICREA Academia Award for Excellence in Research of CC. We thank also COST Actions CA20114 (Therapeutical Applications of Cold Plasmas) and CA19110 (Plasma Applications for Smart and Sustainable Agriculture) for the stimulating environment provided.References
- A. Bogaerts, E. Neyts, R. Gijbels and J. van der Mullen, Spectrochim. Acta, Part B, 2002, 57, 609–658 CrossRef.
- J. M. Sadowska, N. Skoro, R. Laurita, S. Bekeschus, A. Przekora-Kuśmierz, A. Lin, S. Laurencin, S. Sério, S. Cousty and C. Canal, Europhys. News, 2022, 53, 20–23 CrossRef.
- T. von Woedtke, S. Reuter, K. Masur and K. D. Weltmann, Phys. Rep., 2013, 530, 291–320 CrossRef CAS.
- G. Fridman, G. Friedman, A. Gutsol, A. B. Shekhter, V. N. Vasilets and A. Fridman, Plasma Processes Polym., 2008, 5, 503–533 CrossRef CAS.
- B. Stratmann, T.-C. Costea, C. Nolte, J. Hiller, J. Schmidt, J. Reindel, K. Masur, W. Motz, J. Timm, W. Kerner and D. Tschoepe, JAMA Netw. Open, 2020, 3, e2010411 CrossRef PubMed.
- S. Hartwig, C. Doll, J. O. Voss, M. Hertel, S. Preissner and J. D. Raguse, J. Oral Maxillofac. Surg., 2017, 75, 429–435 CrossRef PubMed.
- F. Virard, S. Cousty, J.-P. Cambus, A. Valentin, P. Kémoun and F. Clément, PLoS One, 2015, 10, e0133120 CrossRef PubMed.
- Y. Gorbanev, Comment following the 9th International Conference on Plasma Medicine, https://www.linkedin.com/posts/yury-gorbanev-963b0817a_icpm9-plasmamedicine-ptw-activity-6950717857731100672-dFSP?utm_source=linkedin_share&utm_medium=member_desktop_web, (accessed 8 July 2022).
- J. Jirešová, V. Scholtz, J. Julák and B. Šerá, Plants, 2022, 11, 1471 CrossRef PubMed.
- Z. Machala, B. Tarabová, D. Sersenová, M. Janda and K. Hensel, J. Phys. D: Appl. Phys., 2019, 52, 034002 CrossRef.
- P.-M. Girard, A. Arbabian, M. Fleury, G. Bauville, V. Puech, M. Dutreix and J. S. Sousa, Sci. Rep., 2016, 6, 29098 CrossRef CAS PubMed.
- K. Sklias, J. Santos Sousa and P.-M. Girard, Cancers, 2021, 13, 615 CrossRef CAS PubMed.
- Y. Gorbanev, J. Van der Paal, W. Van Boxem, S. Dewilde and A. Bogaerts, Phys. Chem. Chem. Phys., 2019, 21, 4117–4121 RSC.
- V. Jirásek and P. Lukeš, J. Phys. D: Appl. Phys., 2020, 53, 505206 CrossRef.
- E. Marotta, E. Ceriani, M. Schiorlin, C. Ceretta and C. Paradisi, Water Res., 2012, 46, 6239–6246 CrossRef CAS PubMed.
- H. Tresp, M. U. Hammer, K.-D. Weltmann and S. Reuter, Plasma Med., 2013, 3, 45–55 CrossRef.
- F. Bilea, C. Bradu, N. B. Mandache and M. Magureanu, Chemosphere, 2019, 236, 124302 CrossRef CAS PubMed.
- E. Ceriani, E. Marotta, V. Shapoval, G. Favaro and C. Paradisi, Chem. Eng. J., 2018, 337, 567–575 CrossRef CAS.
- A. Giardina, F. Tampieri, E. Marotta and C. Paradisi, Chemosphere, 2018, 210, 653–661 CrossRef CAS PubMed.
- A. Giardina, F. Tampieri, O. Biondo, E. Marotta and C. Paradisi, Chem. Eng. J., 2019, 372, 171–180 CrossRef CAS.
- J.-W. Lackmann, K. Wende, C. Verlackt, J. Golda, J. Volzke, F. Kogelheide, J. Held, S. Bekeschus, A. Bogaerts, V. Schulz-von der Gathen and K. Stapelmann, Sci. Rep., 2018, 8, 7736 CrossRef PubMed.
- C. Klinkhammer, C. Verlackt, D. Śmiłowicz, F. Kogelheide, A. Bogaerts, N. Metzler-Nolte, K. Stapelmann, M. Havenith and J.-W. Lackmann, Sci. Rep., 2017, 7, 13828 CrossRef PubMed.
- M. Ahmadi, Z. Nasri, T. von Woedtke and K. Wende, ACS Omega, 2022, 7, 31983–31998 CrossRef CAS PubMed.
- S. Wenske, J.-W. Lackmann, L. M. Busch, S. Bekeschus, T. von Woedtke and K. Wende, J. Appl. Phys., 2021, 129, 193305 CrossRef CAS.
- H. Tanaka, K. Nakamura, M. Mizuno, K. Ishikawa, K. Takeda, H. Kajiyama, F. Utsumi, F. Kikkawa and M. Hori, Sci. Rep., 2016, 6, 36282 CrossRef CAS PubMed.
- I. Hamouda, C. Labay, U. Cvelbar, M.-P. Ginebra and C. Canal, Sci. Rep., 2021, 11, 17521 CrossRef CAS PubMed.
- H. Hosseini, M. Saleem, E. Marotta and C. Paradisi, Plasma Processes Polym., 2021, 18, 2100012 CrossRef CAS.
- I. Adamovich, S. Agarwal, E. Ahedo, L. L. Alves, S. Baalrud, N. Babaeva, A. Bogaerts, A. Bourdon, P. J. Bruggeman, C. Canal, E. H. Choi, S. Coulombe, Z. Donkó, D. B. Graves, S. Hamaguchi, D. Hegemann, M. Hori, H.-H. Kim, G. M. W. Kroesen, M. J. Kushner, A. Laricchiuta, X. Li, T. E. Magin, S. Mededovic Thagard, V. Miller, A. B. Murphy, G. S. Oehrlein, N. Puac, R. M. Sankaran, S. Samukawa, M. Shiratani, M. Šimek, N. Tarasenko, K. Terashima, E. Thomas Jr., J. Trieschmann, S. Tsikata, M. M. Turner, I. J. van der Walt, M. C. M. van de Sanden and T. von Woedtke, J. Phys. D: Appl. Phys., 2022, 55, 373001 CrossRef.
- E. J. Szili, S.-H. Hong, J.-S. Oh, N. Gaur and R. D. Short, Trends Biotechnol., 2018, 36, 594–602 CrossRef CAS PubMed.
- C. Labay, I. Hamouda, F. Tampieri, M.-P. Ginebra and C. Canal, Sci. Rep., 2019, 9, 16160 CrossRef PubMed.
- C. Labay, M. Roldán, F. Tampieri, A. Stancampiano, P. E. Bocanegra, M. P. Ginebra and C. Canal, ACS Appl. Mater. Interfaces, 2020, 12, 47256–47269 CrossRef CAS PubMed.
- X. Solé-Martí, T. Vilella, C. Labay, F. Tampieri, M.-P. Ginebra and C. Canal, Biomater. Sci., 2022, 10, 3845–3855 RSC.
- M. Krewing, B. Schubert and J. E. Bandow, Plasma Chem. Plasma Process., 2020, 40, 685–696 CrossRef CAS.
- M. Yusupov, A. Privat-Maldonado, R. M. Cordeiro, H. Verswyvel, P. Shaw, J. Razzokov, E. Smits and A. Bogaerts, Redox Biol., 2021, 43, 101968 CrossRef CAS PubMed.
- M. Yusupov, D. Dewaele, P. Attri, U. Khalilov, F. Sobott and A. Bogaerts, Plasma Processes Polym., 2023, 20, 2200137 CrossRef CAS.
- V. Veronico, P. Favia, F. Fracassi, R. Gristina and E. Sardella, Plasma Processes Polym., 2022, 19, e2100158 CrossRef CAS.
- G. T. Grant, E. R. Morris, D. A. Rees, P. J. C. Smith and D. Thom, FEBS Lett., 1973, 32, 195–198 CrossRef CAS.
- R. Zaplotnik, M. Bišćan, Z. Kregar, U. Cvelbar, M. Mozetič and S. Milošević, Spectrochim. Acta, Part B, 2015, 103–104, 124–130 CrossRef CAS.
- C. Canal, M. Modic, U. Cvelbar and M.-P. Ginebra, Biomater. Sci., 2016, 4, 1454–1461 RSC.
- J. Tornin, C. Labay, F. Tampieri, M.-P. Ginebra and C. Canal, Nat. Protoc., 2021, 16, 2826–2850 CrossRef CAS PubMed.
- F. Tampieri, M.-P. Ginebra and C. Canal, Anal. Chem., 2021, 93, 3666–3670 CrossRef CAS PubMed.
- N. Wang, C. J. Miller, P. Wang and T. D. Waite, Anal. Chim. Acta, 2017, 963, 61–67 CrossRef CAS PubMed.
- V. Veronico, P. Favia, F. Fracassi, R. Gristina and E. Sardella, Plasma Processes Polym., 2021, 18, 2100062 CrossRef CAS.
- M. Elstner, D. Porezag, G. Jungnickel, J. Elsner, M. Haugk, T. Frauenheim, S. Suhai and G. Seifert, Phys. Rev. B: Condens. Matter Mater. Phys., 1998, 58, 7260–7268 CrossRef CAS.
- M. Gaus, A. Goez and M. Elstner, J. Chem. Theory Comput., 2013, 9, 338–354 CrossRef CAS PubMed.
- H.-J. Qian, A. C. T. van Duin, K. Morokuma and S. Irle, J. Chem. Theory Comput., 2011, 7, 2040–2048 CrossRef CAS PubMed.
- M. Elstner, T. Frauenheim and S. Suhai, J. Mol. Struct.: THEOCHEM, 2003, 632, 29–41 CrossRef CAS.
- M. Gaus, X. Lu, M. Elstner and Q. Cui, J. Chem. Theory Comput., 2014, 10, 1518–1537 CrossRef CAS PubMed.
- M. Kubillus, T. Kubař, M. Gaus, J. Řezáč and M. Elstner, J. Chem. Theory Comput., 2015, 11, 332–342 CrossRef CAS PubMed.
- M. Yusupov, E. C. Neyts, U. Khalilov, R. Snoeckx, A. C. T. van Duin and A. Bogaerts, New J. Phys., 2012, 14, 093043 CrossRef.
- M. Yusupov, A. Bogaerts, S. Huygh, R. Snoeckx, A. C. T. van Duin and E. C. Neyts, J. Phys. Chem. C, 2013, 117, 5993–5998 CrossRef CAS.
- M. Yusupov, E. C. Neyts, C. C. Verlackt, U. Khalilov, A. C. T. van Duin and A. Bogaerts, Plasma Processes Polym., 2015, 12, 162–171 CrossRef CAS.
- H. J. C. Berendsen, J. P. M. Postma, W. F. van Gunsteren, A. DiNola and J. R. Haak, J. Chem. Phys., 1984, 81, 3684–3690 CrossRef CAS.
- B. Aradi, B. Hourahine and T. Frauenheim, J. Phys. Chem. A, 2007, 111, 5678–5684 CrossRef CAS PubMed.
- B. Hourahine, B. Aradi, V. Blum, F. Bonafé, A. Buccheri, C. Camacho, C. Cevallos, M. Y. Deshaye, T. Dumitrică, A. Dominguez, S. Ehlert, M. Elstner, T. van der Heide, J. Hermann, S. Irle, J. J. Kranz, C. Köhler, T. Kowalczyk, T. Kubař, I. S. Lee, V. Lutsker, R. J. Maurer, S. K. Min, I. Mitchell, C. Negre, T. A. Niehaus, A. M. N. Niklasson, A. J. Page, A. Pecchia, G. Penazzi, M. P. Persson, J. Řezáč, C. G. Sánchez, M. Sternberg, M. Stöhr, F. Stuckenberg, A. Tkatchenko, V. W.-Z. Yu and T. Frauenheim, J. Chem. Phys., 2020, 152, 124101 CrossRef CAS PubMed.
- L. Coluccino, P. Stagnaro, M. Vassalli and S. Scaglione, J. Appl. Biomater. Funct. Mater., 2016, 14, 42–52 Search PubMed.
- A. Espona-Noguera, J. Ciriza, A. Cañibano-Hernández, L. Fernandez, I. Ochoa, L. Saenz del Burgo and J. L. Pedraz, Int. J. Biol. Macromol., 2018, 107, 1261–1269 CrossRef CAS PubMed.
- F. Tampieri, A. Durighello, O. Biondo, M. Gąsior, A. Knyś, E. Marotta and C. Paradisi, Plasma Chem. Plasma Process., 2019, 39, 545–559 CrossRef CAS.
- R. Molina, P. Jovancic, S. Vilchez, T. Tzanov and C. Solans, Carbohydr. Polym., 2014, 103, 472–479 CrossRef CAS PubMed.
- I. Hamouda, C. Labay, M. P. Ginebra, E. Nicol and C. Canal, Polymer, 2020, 192, 122308 CrossRef CAS.
- A. Dodero, S. Vicini, M. Alloisio and M. Castellano, Rheol. Acta, 2020, 59, 365–374 CrossRef CAS.
- S. Lemeune, J. M. Barbe, A. Trichet and R. Guilard, Ozone: Sci. Eng., 2000, 22, 447–460 CrossRef CAS.
- H. Zhang and S.-M. Park, Carbohydr. Res., 1995, 266, 129–142 CrossRef CAS.
- C. R. Pottenger and D. C. Johnson, J. Polym. Sci., Part A-1: Polym. Chem., 1970, 8, 301–318 CrossRef CAS.
- R. O. C. Norman and J. M. Coxon, Principles of Organic Synthesis, CRC Press, 3rd edn, 1993 Search PubMed.
- Y. Gorbanev, D. O'Connell and V. Chechik, Chem. – Eur. J., 2016, 22, 3496–3505 CrossRef CAS PubMed.
- B. Myers, P. Ranieri, T. Smirnova, P. Hewitt, D. Peterson, M. Herrera Quesada, E. Lenker and K. Stapelmann, J. Phys. D: Appl. Phys., 2021, 54, 145202 CrossRef CAS.
Footnote |
| † Electronic supplementary information (ESI) available: Molecular structure of the glucuronic acid, time evolution of the temperature and total energy of the glucuronic acid model system, additional size exclusion chromatography results, detailed results of the molecular dynamics simulations. See DOI: https://doi.org/10.1039/d3bm00212h |
| This journal is © The Royal Society of Chemistry 2023 |