
 Open Access Article
 This Open Access Article is licensed under a
 Creative Commons Attribution 3.0 Unported Licence
On the use of Carbograph 5TD as an adsorbent for sampling VVOCs: validation of an analytical method†
Morgane
Even
 ,
Elevtheria
Juritsch
and
Matthias
Richter
*
,
Elevtheria
Juritsch
and
Matthias
Richter
*
Bundesanstalt für Materialforschung und -prüfung (BAM), Unter den Eichen 87, 12205 Berlin, Germany. E-mail: matthias.richter@bam.de
First published on 13th July 2023
Abstract
A standardised method for the analysis of very volatile organic compounds (VVOCs) in indoor air is still missing. This study evaluates the use of Carbograph 5TD as an adsorbent for 60 compounds (47 VVOCs + 13 VOCs) by comparing their recoveries with different spiking modes. The influence of the spiking of the tubes in dry nitrogen, humidified air or along the whole flushing duration mimicking real sampling was investigated. 49 substances (36 VVOCs from C1 to C6) had recoveries over 70% on the adsorbent in humidified air and were validated. The linearity of the calibration curves was verified for every spiking mode and the limits of detection (LOD) and quantification (LOQ) were determined. The LOQs were lower than the existing indoor air guideline values. The robustness of the method was considered by studying the influence of the sampling volume, the sampling flow rate, the humidity level and the storage of the tubes. In general, the most volatile or polar substances were the less robust ones. The combined measurement uncertainty was calculated and lies below 35% for a vast majority of the substances. An example of an emission chamber test using polyurethane foam is shown: Carbograph 5TD performs much better than Tenax® TA for VVOCs and emissions from n-butane were quantified with combined measurement uncertainty.
1 Introduction
Very volatile organic compounds (VVOCs) are ubiquitous in indoor air as they are emitted from human activities, wood and wood-based materials, building materials or indoor chemistry.1 According to the standards ISO 16000-6 and EN 16516, VVOCs are a group of compounds of the retention range before that of n-hexane on a (5%-phenyl)-methylpolysiloxane column.2,3 ISO 16000-6 describes a procedure for the analysis of VOCs and states that the use of the thermal desorption gas chromatography technique (TD-GC) is appropriate for VVOCs, if adaptations, inter alia on the standards, the sampling strategy or GC columns are considered. However, it only gives directions and an efficient procedure for the analysis of VVOCs in indoor air and emission test chamber samples is still lacking. The points that need to be addressed towards the standardization of an analytical method for VVOCs were detailed in our last review article and addressed in our recent publication.4,5 In the latter, an extensive study of suitable chromatography columns and adsorbents was carried out, which will not be further discussed in this paper.In the latest study, 16 adsorbents were compared and Carbograph 5TD 40/60 was the most efficient adsorbent with 53 out of 60 substances having a recovery between 70% and 120%. Due to its hydrophobicty, no water management is needed for Carbograph 5TD.5 The great performance of Carbograph 5TD 40/60 was also observed by Richter et al. in 2020, where 27 out of 34 substances had recoveries above 70% at a relative humidity of the sampling air of 50%.6
Several studies that compared adsorbents directly with one another also found Carbograph 5TD to be the most appropriate single adsorbent for VVOCs.7,8 Schieweck et al. (2018) demonstrated the use of Carbograph 5TD with a mesh size of 20/40 to adsorb VVOCs with carbon numbers from C3 to C6 and validated a method for 18 compounds. In another paper the use of Carbograph 5TD for the analysis of acrolein in indoor air samples is presented.9 However, this approach only considered a limited number of analytes, and the standards were prepared in methanolic solutions. Moreover, the influence of humidity and the loading of the tube along the whole sampling time were not considered. Indeed, the analytes may behave differently on the adsorbent if they are adsorbed within a few minutes in humidified air compared to when they are spiked all at once in dry nitrogen.
This publication presents extensive experimental results on the evaluation of the use of Carbograph 5TD as an adsorbent for 47 VVOCs and 13 VOCs in gas standards. The recovery of the analytes on the adsorbent was determined in dry nitrogen as well as in humidified air, with and without the use of a syringe pump to spike the tube for longer periods of time. The use of liquid standards was also considered for 38 substances. Subsequently, the limits of detection and quantification of the substances were determined. The influence of the sampling volume, the sampling flow rate, the humidity and the storage duration was also studied. Finally, the measurement uncertainty was calculated and an example of quantification from an emission test chamber sample is given.
2 Experimental
2.1 Analysis
| Group | CAS | Substance | Cal range (ng) | Commercial gas mixture 1 (CGM1) | ||
|---|---|---|---|---|---|---|
| CAS | Substance | Cal range (ng) | ||||
| a Substances that do not belong to the group of VVOCs according to the definition of ISO 16000-6 and EN 16516. b Substances that could not be validated in this study. | ||||||
| 1 | 67-56-1 | Methanolb | 0.4–160 | 115-07-1 | Propeneb | 0.3–153 |
| 64-17-5 | Ethanolb | 0.4–162 | 75-19-4 | Cyclopropaneb | 0.3–160 | |
| 67-63-0 | Isopropanol | 0.2–96 | 115-10-6 | Dimethyl etherb | 0.3–172 | |
| 75-65-0 | tert-Butanol | 0.2–100 | 106-99-0 | 1,3-Butadiene | 0.4–196 | |
| 71-23-8 | 1-Propanol | 0.4–162 | 75-28-5 | Isobutane | 0.5–218 | |
| 75-15-0 | Carbon disulfide | 0.2–87 | 106-97-8 | n-Butane | 0.5–222 | |
| 71-43-2 | Benzenea | 0.2–72 | 624-64-6 | trans-2-butene | 0.5–219 | |
| 2 | 79-20-9 | Methyl acetate | 0.4.-185 | 590-18-1 | cis-2-butene | 0.5–214 |
| 108-05-4 | Vinyl acetate | 0.4–165 | 75-07-0 | Acetaldehydeb | 0.4–175 | |
| 141-78-6 | Ethyl acetatea | 0.3–148 | 78-78-4 | Isopentane | 0.6–269 | |
| 108-21-4 | Isopropyl acetatea | 0.3–141 | 109-66-0 | n-Pentane | 0.6–268 | |
| 107-31-3 | Methyl formateb | 0.4–160 | 107-02-8 | Acrolein | 0.5–212 | |
| 3 | 67-64-1 | Acetone | 0.3–129 | 110-54-3 | n-Hexane | 0.7–317 |
| 78-93-3 | 2-Butanone | 0.2–110 | ||||
| 96-33-3 | Methyl acrylatea | 0.2–92 | Commercial gas mixture 2 (CGM2) | |||
| 4 | 78-79-5 | Isoprene | 0.2–112 | CAS | Substance | Cal range (ng) |
| 287-92-3 | Cyclopentane | 0.2–82 | 75-45-6 | Chlorodifluoromethaneb | 0.8–190 | |
| 107-83-5 | 2-Methylpentane | 0.2–80 | 74-87-3 | Chloromethaneb | 0.4–99 | |
| 5 | 123-38-6 | Propanal | 0.4–188 | 75-01-4 | Vinyl chlorideb | 0.5–136 |
| 110-62-3 | Pentanala | 0.2–112 | 75-71-8 | Dichlorodifluoromethane | 1.0–239 | |
| 78-84-2 | Isobutanal | 0.2–97 | 75-00-3 | Chloroethane | 0.5–131 | |
| 78-85-3 | Methacrolein | 0.3–120 | 75-69-4 | Trichlorofluoromethane | 0.5–290 | |
| 123-72-8 | Butanala | 0.3–118 | 75-29-6 | 2-Chloropropane | 0.7–164 | |
| 6 | 110-00-9 | Furan | 0.2–95 | 67-66-3 | Chloroforma | 0.2–75 |
| 60-29-7 | Diethyl ether | 0.3–120 | ||||
| 109-99-9 | Tetrahydrofurana | 0.2–95 | Internal gas standard | |||
| 123-91-1 | 1,4-Dioxanea | 0.2–93 | CAS | Substance | Amount (ng) | |
| 1634-04-4 | Methyl tert-butyl ether | 0.2–99 | 1076-43-3 | Benzene-d6 | 18.6 | |
| 7 | 107-13-1 | Acrylonitrile | 0.2–79 | |||
| 75-05-8 | Acetonitrileb | 0.2–79 | ||||
| 126-98-7 | Methacrylonitrile | 0.2–80 | ||||
| 107-12-0 | Propanenitrile | 0.2–77 | ||||
| 8 | 56-23-5 | Tetrachloromethanea | 0.2–76 | |||
| 107-06-2 | 1,2-Dichloroethanea | 0.2–77 | ||||
| 75-35-4 | 1,1-Dichloroethene | 0.1–66 | ||||
| 74-96-4 | Bromoethane | 0.3–129 | ||||
| 75-09-2 | Dichloromethane | 0.3–118 | ||||
| 79-01-6 | Trichloroethenea | 0.2–80 | ||||
| As ISTD | 142-82-5 | n-Heptanea | 0.2–75 | |||
The other 39 compounds were part of a self-made gas mixture. It was prepared in a gas collecting tube with a volume of 437.6 mL (commercially given as 500 mL) and equipped with a septum and a valve for additional tightness. The liquid standards were mixed with syringes into eight groups of solutions (see Table 1) to a total volume of 1500 or 3000 μL to increase spiking accuracy without creating possible reactivity in each solution. Small defined volumes of n-heptane were added to each group: being in the upper volatility range and non-reactive, a change in the ratio of the compounds to n-heptane is indicative of leakage or reactivity. In this way, n-heptane served as an additional safeguard but was not used in the determination of the evaluation parameters as described in the following section. The groups were then spiked with a gas-tight syringe (Hamilton, Reno, Nevada, USA) through the septum of the GCT where the substances evaporate into the gas phase. The stock solutions were stored in a freezer at −18 °C.
Benzene-d6 served as an internal standard (ISTD): a gas standard was manufactured in-house with a concentration of 266 ppm in nitrogen in a pressurized cylinder, and a gas collecting tube (GCT) was filled with it for further handling. The reactivity and stability of the gas mixtures were checked.5 The spiking of gas mixtures was compared to the spiking of methanolic solutions. For this purpose, the liquid standards used for the self-made gas mixture were directly diluted in methanol.
Tenax® TA tubes from Gerstel were also used for comparison and conditioned at 300 °C.
The tubes were subsequently doped with the gas mixture by use of gas-tight syringes (Hamilton, Switzerland) with volumes of 10 to 250 μL, depending on the calibration point. The calibration ranges are displayed in Table 1 and detailed in ESI Table S2.† The adsorbents were then flushed at 23 ± 2 °C and 80 ± 2 mL min−1 using different spiking modes:
• manually on a TSPS and flushed in parallel with dry nitrogen for 10 min,
• manually on a spiking device different from the TSPS and subsequently flushed with humidified synthetic air at 50 ± 5% RH for 10 min,
• with a syringe pump to mimic a real sampling: the gas mixture was automatically spiked onto the adsorbent for 9 min while a humidified air flow (50 ± 5% RH) was passed through the tube for 10 min (additional 1 min after spiking).
• manually on a TSPS and flushed with dry nitrogen for 3 min. Subsequently, humidified air (50 ± 5% RH) from an empty emission chamber was drawn through the tubes with a pump for 10 min. This method allowed a high sample throughput, as six tubes could be simultaneously spiked on the TSPS and the humidified air could be drawn through six tubes simultaneously thanks to a multiple pump. Thus, it was used for the validation of the method (limits of detection and quantification, robustness and measurement uncertainty).
Tenax® TA tubes from Gerstel were desorbed at 300 °C with the same method.
A mass selective detector MSD 5975C inert XL from Agilent Technologies was connected to the GC. The temperatures of the transfer line, quadrupole, and ion source were 300 °C, 150 °C, and 230 °C, respectively. The MS was operated in full-scan mode: the m/z scan range was between 29 and 150 and a low mass tune was performed. With the selected column (PoraBOND Q), the lower m/z was only necessary for the early-eluting analytes. Thus, the scan started at m/z 35 after 12.5 min.
The retention times and quantifier ions used are displayed in Table S3 ESI.† Blank values of the tubes were subtracted before data analysis: for tubes spiked in dry nitrogen, the analysis of the unloaded tube was considered, whereas for tubes spiked in humidified air, the air sampled from an empty emission test chamber on the same tube was considered. Data were processed by using the MassHunter Quant Software (version 10.2, Agilent). An example chromatogram is depicted in ESI Fig. S1.†
2.2 Validation
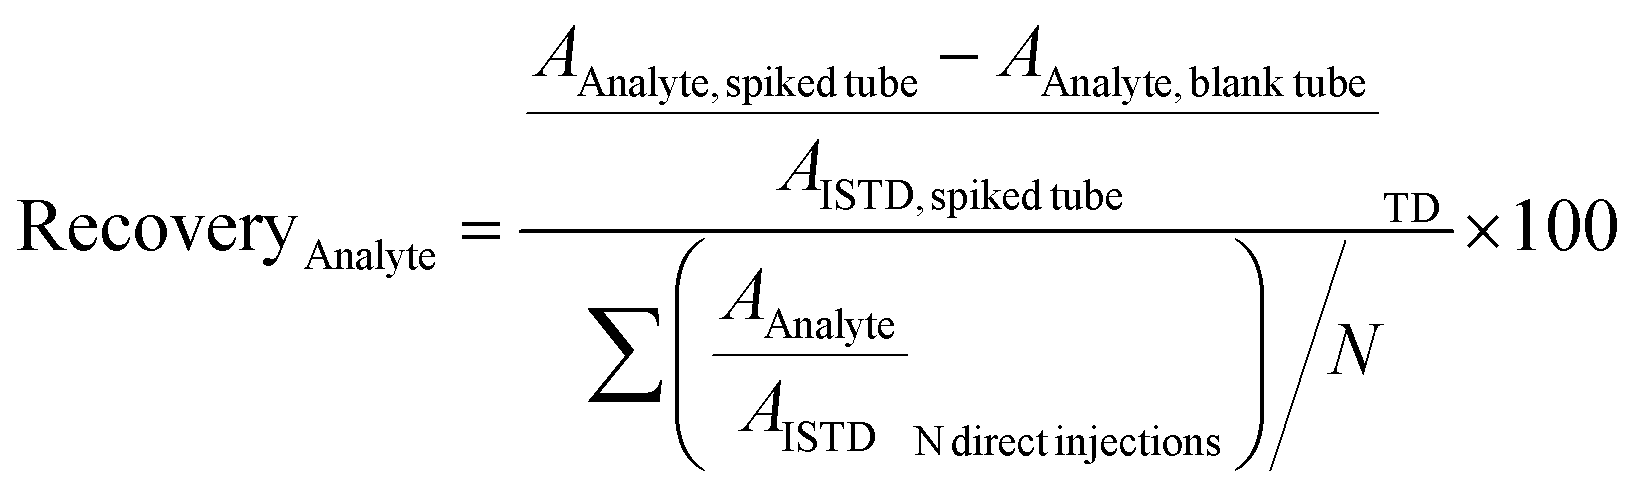 | (1) |
The recoveries were determined with the doped amount corresponding to the calibration level Cal 9 (see Table S2 ESI†). A recovery of 70% to 120% was indicative of a satisfying adsorption of the analyte on the tube.10
For 14 substances, the decision limit was beyond the calibration range from the indirect method and another method was used. The LOD and LOQ were calculated as described in the Eurachem guide to method validation:12
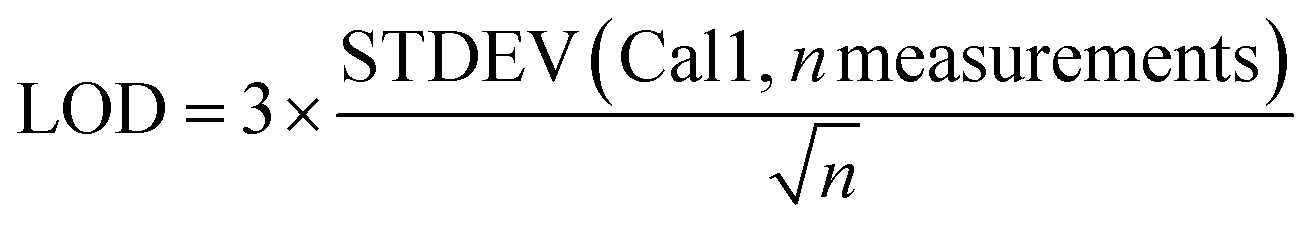 | (2) |
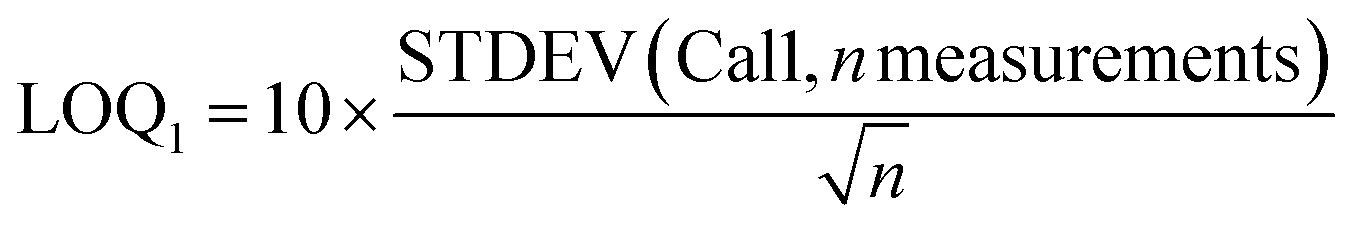 | (3) |
As the value of the LOQ determined with this method seems to be too low compared to the observed calibration curves for the lower calibration levels, another definition is proposed for the LOQ: the limit of quantification (LOQ2) was the lowest calibration level n for which the correlation coefficient of the calibration Cal1–Caln was greater than 0.99.
• Sampling volume: 0.8, 1.6 and 4.0 L at a sampling flow rate of 80 mL min−1
• Sampling flow rate: 40, 80 and 120 mL min−1 at a sample volume of 0.8 L
• Relative humidity: 30, 50 and 70% RH at 0.8 L and 80 mL min−1
Moreover, the influence of the stability of the analytes in the tubes was examined by analyzing them 7, 14 and 28 days after spiking and storage at (23 ± 2) °C.
 | (4) |
The budgets are determined as follows:
For analytes from the self-made gas standard, the uncertainty of the analyte concentration in the GCT was calculated as follows:
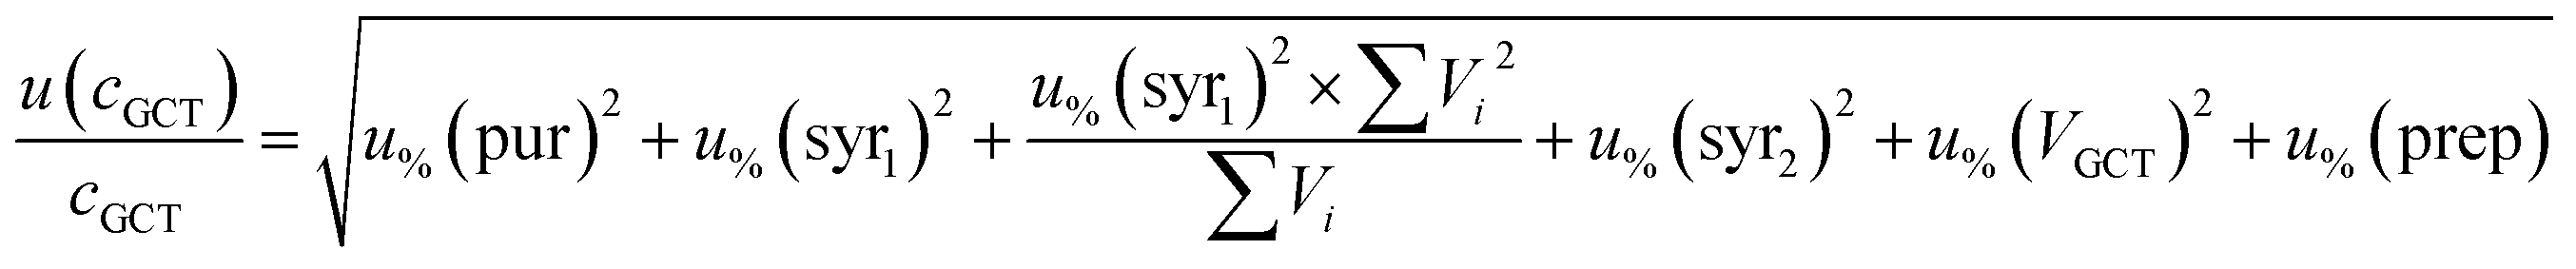 | (5) |
For analytes from the commercial gas mixtures, the uncertainty of the analyte concentration in the GCT was calculated as follows:
 | (6) |
As human error from the doping of the tube is already considered in the measurement precision (see below), the uncertainty from the tube spiking was only the bias of the syringe.
The uncertainty from the calibration was calculated as follows:13
 | (7) |
![[m with combining macron]](https://www.rsc.org/images/entities/i_char_006d_0304.gif) is the mean value of the different calibration amounts, and mi is the calibration level.
is the mean value of the different calibration amounts, and mi is the calibration level.
In accordance with ref. 14, the method precision u(prec) (eqn (8)) is calculated by using a combination of the repeatability u(rep) (eqn (9)) and the reproducibility u(repr) (eqn(10)):
 | (8) |
 | (9) |
i is the average of the measurement on day i, and tot is the average of all measurements; and | (10) |
Of note, the uncertainty of the GC/MS measurement is considered three times in this combined measurement uncertainty (u(VCGCT,%), u(rep) and u(repr)). However, it is inevitable as these uncertainties are all determined from measurements.
2.3 Emission chamber measurement
Polyurethane foam was applied in an aluminum bowl. The sample was placed in a 270 L emission test chamber made of stainless steel, equipped with a ventilator. It was operated in compliance with EN 16516 ref. 3 at a temperature of (23 ± 1) °C, a relative humidity of (50 ± 5)% and an air change rate of 0.5 h−1. The air samples were simultaneously taken after 7 days with a pump at 100 mL min−1 during 10 min. Pictures from the sample and the emission test chamber are shown in ESI Fig. S2.†3 Results and discussion
3.1 Recoveries
The recoveries of the 60 analytes following different doping modes are displayed in Fig. 1. For the recoveries in dry nitrogen, the results of our previous work were confirmed:5 under the conditions selected for this study, i.e. with 0.8 L gas passing through the sorbent tube during analyte loading, 51 out of 60 substances showed recoveries over 70%. Only methyl acrylate had a very low value (17 ± 2%) compared to the last study (95 ± 9%). The reason for this striking change is unknown. However, methyl acrylate had much better recoveries (over 70%) for doping modes in humidified air, and this is also the case for dichlorodifluoroethane. These substances were therefore selected for further validation. Substances with recoveries over 70% for both spiking modes with humidified air [spiking device in Fig. 1b and syringe pump in Fig. 1c] were chosen for the method validation. | ||
| Fig. 1 Recoveries of the 60 analytes on Carbograph 5TD following different spiking modes: (a) spiking of the tube in dry nitrogen (n = 15), (b) spiking of the tube in humidified air (n = 3), (b) spiking of the tube in humidified air over 9 min with a syringe pump (n = 3), (d) short spiking of the tube in dry nitrogen followed by flushing with humidified air (n = 3), and (e) spiking of liquid standards in dry nitrogen (n = 3). The sample volume in all cases was 0.8 L. | ||
Following this criterion, the method cannot be validated for 11 substances: chlorodifluoromethane, methanol, propene, chloromethane, cyclopropane, dimethylether, acetaldehyde, vinyl chloride, methyl formate, ethanol and acetonitrile. These substances have either very high volatilities or very high polarities. Interestingly, methanol, dimethyl ether, acetaldehyde, and acetonitrile had very poor recoveries in humidified air in comparison to their satisfactory recoveries in dry nitrogen. They all have a very high affinity to water (see log![[thin space (1/6-em)]](https://www.rsc.org/images/entities/char_2009.gif) Kow values in Table S1 of the ESI†), so it is logical that they adsorb much less on the adsorbent when water is present in the air flow. In comparison, ethanol, vinyl chloride and methyl formate had high recoveries in humidified air when a syringe pump was used, whereas they had poor recoveries when the gas mixture was injected at once. In this case, the substances are either less volatile or less polar than the previous ones: the adsorption is efficient when the gas mixture is doped throughout the whole flushing time but a breakthrough seems to appear when the substances are spiked in the first few seconds. One likely explanation for this is that a spiking of the analytes at once introduces a more concentrated band of the compounds which can therefore more quickly saturate the active sites in the affected section of the sorbent causing more rapid movement through the sorbent bed. The other unvalidated substances chlorodifluoromethane, propene, chloromethane and cyclopropane showed recoveries below 70% with each spiking mode. In a previous study, ethanol and acetaldehyde were validated but the tubes were only spiked in dry nitrogen.8 It can be concluded that Carbograph 5TD is well suitable for compounds with carbon numbers in the range of C3–C6. However, this must not be taken as a general rule as compounds with 3 carbon atoms such as cyclopropane or propene did not adsorb on the adsorbent while compounds with only one or two carbon atoms such as tetrachloromethane or bromoethane did.
Kow values in Table S1 of the ESI†), so it is logical that they adsorb much less on the adsorbent when water is present in the air flow. In comparison, ethanol, vinyl chloride and methyl formate had high recoveries in humidified air when a syringe pump was used, whereas they had poor recoveries when the gas mixture was injected at once. In this case, the substances are either less volatile or less polar than the previous ones: the adsorption is efficient when the gas mixture is doped throughout the whole flushing time but a breakthrough seems to appear when the substances are spiked in the first few seconds. One likely explanation for this is that a spiking of the analytes at once introduces a more concentrated band of the compounds which can therefore more quickly saturate the active sites in the affected section of the sorbent causing more rapid movement through the sorbent bed. The other unvalidated substances chlorodifluoromethane, propene, chloromethane and cyclopropane showed recoveries below 70% with each spiking mode. In a previous study, ethanol and acetaldehyde were validated but the tubes were only spiked in dry nitrogen.8 It can be concluded that Carbograph 5TD is well suitable for compounds with carbon numbers in the range of C3–C6. However, this must not be taken as a general rule as compounds with 3 carbon atoms such as cyclopropane or propene did not adsorb on the adsorbent while compounds with only one or two carbon atoms such as tetrachloromethane or bromoethane did.
Fig. 1e displays the recoveries for the spiking of the methanolic solutions of the standards on the adsorbent. Even if polar substances typically had lower recoveries than nonpolar ones, all the validated substances displayed recoveries between 79 and 120%, except for acetone. In principle, methanolic solutions would lead to similar quantification results in comparison to gas mixtures but the use of a solvent has several drawbacks as reported elsewhere.4
3.2 Calibrations
The coefficients of determination of the calibrations of the 49 validated substances with different spiking modes are shown in Table 2. Example of calibration curves for each gas mixture are displayed in Fig. S3 ESI.† Except for dichlorofluoromethane, all the substances had coefficients of determination over 0.99 when spiked with humidified air. The poor coefficients of determination for dichlorofluoromethane (still over 0.98) were due to high standard deviations of the signal (poor precision, see Section 3.5.). 2-Chloropropane, cyclopentane and isobutanal had a coefficient of determination below 0.99 for the calibration in dry nitrogen (b). These results are due to the high number of repetitions (from n = 4 to n = 19 depending on the calibration level, over three months) while other calibrations were only based on three repetitions over two weeks. For real samples, the calibration would be repeated more often and these compounds performed much better in these later calibrations in humidified air (c, d and e), indicating the suitability of the method.| a | B | c | d | e | |
|---|---|---|---|---|---|
| a Isomers with identical mass contained in commercial gas mixture 1; no distinction possible as no individual substances available. | |||||
| Dichlorodifluoromethane | 0.9988 | 0.9821 | 0.9839 | 0.9883 | 0.9818 |
| Isobutane | 0.9982 | 0.9911 | 0.9993 | 0.9969 | 0.9999 |
| 1.3-Butadiene | 0.9984 | 0.9973 | 0.9991 | 0.9972 | 0.9998 |
| Chloroethane | 0.9993 | 0.9911 | 0.9989 | 0.9937 | 0.9927 |
| cis/trans-2-butenea | 0.9986 | 0.9959 | 0.9991 | 0.9972 | 0.9998 |
| n-Butane | 0.9979 | 0.9958 | 0.9988 | 0.9966 | 0.9997 |
| cis/trans-2-butenea | 0.9991 | 0.9969 | 0.9995 | 0.9977 | 0.9999 |
| Acrolein | 0.9994 | 0.9935 | 0.9979 | 0.9922 | 0.9999 |
| Furan | 0.9975 | 0.9946 | 0.9992 | 0.9933 | 0.9959 |
| Propanal | 0.9981 | 0.9910 | 0.9997 | 0.9963 | 0.9976 |
| Acetone | 0.9976 | 0.9992 | 0.9993 | 0.9928 | 0.9936 |
| Dichloromethane | 0.9980 | 0.9977 | 0.9994 | 0.9940 | 0.9946 |
| Acrylonitrile | 0.9988 | 0.9970 | 0.9998 | 0.9955 | 0.9966 |
| Carbon disulfide | 0.9956 | 0.9951 | 0.9967 | 0.9929 | 0.9934 |
| Isopropanol | 0.9987 | 0.9967 | 0.9995 | 0.9937 | 0.9935 |
| Trichlorofluoromethane | 0.9986 | 0.9913 | 0.9994 | 0.9928 | 0.9987 |
| 1.1-Dichloroethene | 0.9979 | 0.9984 | 0.9995 | 0.9944 | 0.9965 |
| Bromoethane | 0.9978 | 0.9953 | 0.9996 | 0.9942 | 0.9977 |
| Methyl acetate | 0.9985 | 0.9958 | 0.9997 | 0.9953 | 0.9958 |
| 2-Chloropropane | 0.9990 | 0.9841 | 0.9997 | 0.9945 | 0.9998 |
| 1-Propanol | 0.9985 | 0.9980 | 0.9988 | 0.9917 | 0.9946 |
| Diethyl ether | 0.9979 | 0.9976 | 0.9994 | 0.9944 | 0.9958 |
| Isopentane | 0.9988 | 0.9952 | 0.9996 | 0.9981 | 0.9998 |
| Propanenitrile | 0.9985 | 0.9967 | 0.9995 | 0.9940 | 0.9959 |
| Isoprene | 0.9984 | 0.9924 | 0.9996 | 0.9947 | 0.9971 |
| n-Pentane | 0.9979 | 0.9968 | 0.9991 | 0.9975 | 0.9995 |
| tert-Butanol | 0.9975 | 0.9974 | 0.9995 | 0.9947 | 0.9961 |
| Methacrolein | 0.9973 | 0.9979 | 0.9989 | 0.9913 | 0.9919 |
| Cyclopentane | 0.9987 | 0.9854 | 0.9998 | 0.9960 | 0.9983 |
| Isobutanal | 0.9987 | 0.9641 | 0.9991 | 0.9959 | 0.9991 |
| Vinyl acetate | 0.9983 | 0.9902 | 0.9994 | 0.9953 | 0.9972 |
| Methacrylonitrile | 0.9983 | 0.9940 | 0.9998 | 0.9957 | 0.9962 |
| Chloroform | 0.9976 | 0.9906 | 0.9981 | 0.9921 | 0.9987 |
| Butanal | 0.9973 | 0.9973 | 0.9992 | 0.9960 | 0.9925 |
| Tetrahydrofuran | 0.9988 | 0.9959 | 0.9997 | 0.9964 | 0.9953 |
| 2-Butanone | 0.9982 | 0.9991 | 0.9996 | 0.9963 | 0.9944 |
| Methyl acrylate | 0.9976 | 0.9991 | 0.9997 | 0.9958 | 0.9957 |
| Ethyl acetate | 0.9979 | 0.9970 | 0.9997 | 0.9955 | 0.9953 |
| 1.2-Dichloroethane | 0.9972 | 0.9987 | 0.9996 | 0.9953 | 0.9951 |
| Methyl tert-butyl ether | 0.9986 | 0.9972 | 0.9998 | 0.9952 | 0.9966 |
| 2-Methylpentane | 0.9985 | 0.9953 | 0.9998 | 0.9963 | 0.9976 |
| Benzene | 0.9966 | 0.9904 | 0.9966 | 0.9925 | 0.9930 |
| Tetrachloromethane | 0.9971 | 0.9962 | 0.9990 | 0.9938 | 0.9971 |
| Trichloroethene | 0.9944 | 0.9948 | 0.9989 | 0.9939 | 0.9944 |
| n-Hexane | 0.9980 | 0.9951 | 0.9989 | 0.9972 | 0.9995 |
| 1.4-Dioxan | 0.9977 | 0.9985 | 0.9992 | 0.9916 | 0.9909 |
| Isopropyl acetate | 0.9975 | 0.9962 | 0.9996 | 0.9956 | 0.9953 |
| Pentanal | 0.9966 | 0.9957 | 0.9991 | 0.9960 | 0.9941 |
| n-Heptane | 0.9969 | 0.9948 | 0.9996 | 0.9944 | 0.9927 |
Interestingly, ethanol, vinyl chloride and methyl formate which had high recoveries in humidified air when a syringe pump was used (see Section 3.1.), displayed satisfactory calibration curves for this spiking mode (see ESI Fig. S4†). However, they were not considered for further validation as the spiking mode with a short spiking in dry nitrogen and a longer flushing with humidified air was used.
3.3 Robustness
The results from the variation of the sampling volume, the sampling flow rate, the relative humidity and the storage duration are displayed in Table 3 expressed by its impact on the recovery.| Compared to 0.8 L | Compared to 80 mL min−1 | Compared to 50% RH | Compared to 0 d (tube storage) | ||||||
|---|---|---|---|---|---|---|---|---|---|
| Substance | 1,6 L, % | 4 L, % | 40 mL min−1, % | 120 mL min−1, % | 30, % RH | 70, % RH | 7 d, % | 14 d, % | 28 d, % |
| a Isomers with identical mass contained in commercial gas mixture 1; no distinction possible as no individual substances available. | |||||||||
| Dichlorodifluoromethane | 10 | 7 | 114 | 31 | 94 | 37 | 113 | 61 | 90 |
| Isobutane | 108 | 111 | 94 | 94 | 98 | 95 | 111 | 93 | 83 |
| 1,3-Butadiene | 106 | 105 | 95 | 94 | 98 | 94 | 108 | 95 | 84 |
| Chloroethane | 21 | 1 | 94 | 81 | 91 | 93 | 106 | 102 | 88 |
| cis/trans-2-butenea | 106 | 105 | 96 | 94 | 98 | 95 | 112 | 101 | 92 |
| n-Butane | 109 | 114 | 96 | 94 | 98 | 95 | 112 | 95 | 89 |
| cis/trans-2-butenea | 106 | 106 | 96 | 94 | 98 | 95 | 111 | 100 | 90 |
| Acrolein | 99 | 94 | 98 | 91 | 100 | 87 | 112 | 106 | 86 |
| Furan | 107 | 108 | 95 | 94 | 96 | 99 | 113 | 112 | 107 |
| Propanal | 100 | 97 | 100 | 97 | 98 | 75 | 103 | 102 | 65 |
| Acetone | 107 | 107 | 100 | 100 | 104 | 100 | 121 | 128 | 163 |
| Dichloromethane | 102 | 29 | 99 | 97 | 97 | 98 | 105 | 99 | 85 |
| Acrylonitrile | 104 | 95 | 99 | 100 | 100 | 101 | 107 | 99 | 91 |
| Carbon disulfide | 105 | 106 | 96 | 97 | 98 | 99 | 109 | 107 | 91 |
| Isopropanol | 100 | 95 | 101 | 101 | 112 | 99 | 97 | 114 | 104 |
| Trichlorofluoromethane | 99 | 96 | 93 | 91 | 96 | 97 | 107 | 114 | 108 |
| 1,1-Dichloroethene | 105 | 106 | 96 | 95 | 99 | 100 | 107 | 106 | 100 |
| Bromoethane | 103 | 99 | 98 | 95 | 96 | 91 | 96 | 95 | 45 |
| Methyl acetate | 103 | 102 | 100 | 98 | 99 | 97 | 106 | 104 | 83 |
| 2-Chloropropane | 97 | 91 | 94 | 91 | 95 | 96 | 104 | 110 | 89 |
| 1-Propanol | 102 | 98 | 102 | 102 | 124 | 101 | 87 | 85 | 69 |
| Diethyl ether | 104 | 102 | 100 | 98 | 99 | 95 | 107 | 107 | 103 |
| Isopentane | 105 | 105 | 97 | 95 | 98 | 93 | 112 | 102 | 96 |
| Propanenitrile | 104 | 103 | 101 | 102 | 104 | 104 | 107 | 98 | 96 |
| Isoprene | 105 | 105 | 96 | 95 | 97 | 98 | 109 | 109 | 101 |
| n-Pentane | 106 | 105 | 96 | 95 | 98 | 94 | 112 | 95 | 89 |
| tert-Butanol | 101 | 99 | 100 | 102 | 115 | 104 | 86 | 87 | 73 |
| Methacrolein | 109 | 107 | 101 | 98 | 102 | 109 | 137 | 122 | 118 |
| Cyclopentane | 105 | 108 | 97 | 96 | 96 | 97 | 109 | 110 | 101 |
| Isobutanal | 94 | 94 | 101 | 101 | 94 | 76 | 56 | 65 | 31 |
| Vinyl acetate | 101 | 94 | 86 | 104 | 100 | 98 | 109 | 114 | 70 |
| Methacrylonitrile | 104 | 102 | 101 | 101 | 100 | 100 | 108 | 104 | 102 |
| Chloroform | 97 | 91 | 95 | 92 | 93 | 92 | 108 | 120 | 108 |
| Butanal | 104 | 103 | 99 | 97 | 99 | 93 | 104 | 111 | 69 |
| Tetrahydrofuran | 104 | 102 | 101 | 100 | 101 | 98 | 106 | 103 | 100 |
| 2-Butanone | 105 | 103 | 102 | 100 | 103 | 99 | 109 | 115 | 97 |
| Methyl acrylate | 105 | 102 | 100 | 99 | 102 | 101 | 108 | 104 | 97 |
| Ethyl acetate | 105 | 102 | 100 | 98 | 100 | 99 | 108 | 107 | 102 |
| 1,2-Dichloroethane | 105 | 103 | 101 | 100 | 104 | 102 | 104 | 97 | 87 |
| Methyl tert-butyl ether | 103 | 102 | 101 | 101 | 104 | 99 | 101 | 103 | 98 |
| 2-Methylpentane | 104 | 104 | 98 | 98 | 99 | 98 | 107 | 107 | 102 |
| Benzene | 103 | 106 | 101 | 99 | 102 | 99 | 114 | 111 | 112 |
| Tetrachloromethane | 105 | 103 | 101 | 100 | 102 | 102 | 104 | 103 | 91 |
| Trichloroethene | 106 | 103 | 102 | 101 | 104 | 103 | 107 | 99 | 96 |
| n-Hexane | 104 | 103 | 98 | 96 | 97 | 94 | 111 | 103 | 96 |
| 1,4-Dioxane | 106 | 103 | 104 | 104 | 112 | 108 | 102 | 94 | 95 |
| Isopropyl acetate | 105 | 102 | 101 | 99 | 103 | 100 | 105 | 102 | 99 |
| Pentanal | 105 | 102 | 102 | 99 | 105 | 98 | 98 | 92 | 58 |
| n-Heptane | 105 | 104 | 101 | 100 | 101 | 102 | 110 | 103 | 101 |
A significant influence of the variation of the sampling volume was observed for dichlorodifluoromethane and chloroethane at 1.6 L and for dichloroethane at 4 L: these very volatile compounds with boiling points of respectively 8.9, 12.3 and 40 °C will be breaking through the adsorbent bed in the sampling tube. However, the volatility does not seem to be the only factor affecting the interaction of compounds with the adsorbent, as 1,3-butadiene (boiling point: −4.5 °C), butene (boiling point: 0.9 °C) or trichlorofluoromethane (boiling point: 23.7 °C) do not break through. Other possible explanations for the poor adsorption might be the polarity of the compounds but also steric effects, which could not be finally elucidated.
The variations of the sampling flow rate had a low influence, except for dichlorofluoromethane for which a breakthrough happened at 120 mL min−1. Chloroethane had a similar behavior, but to a smaller extent.
In emission test chamber studies, the humidity is typically kept at 50% RH3,15 but real indoor air samples can have higher and lower humidity levels. The recoveries of the alcohols isopropanol, 1-propanol and tert-butanol increased at lower humidity (30% RH). Indeed, they display better recoveries on the adsorbent as they interact with fewer water molecules from the air flow. Dichlorofluoromethane, acrolein, propanal, and isobutanal showed significant losses for the higher humidity (70% RH). It is possible that these polar hydrophilic substances either bind to the water molecules from the supply air or are displaced from the sorbent surface. Other polar substances, such as methyl acetate, propanenitrile and 1,4-dioxane stayed on the adsorbent, but they are less volatile.
The recovery of acetone and methacrolein increased during storage: acetone can be found as a blank in Carbograph 5TD, so this increase can most likely be explained that way. Methacrolein is not known to be a possible blank in the adsorbent and might be the result of ingress of contaminants from the lab air or a degradation reaction of other larger compounds with active sites in the adsorbent but this could not be verified. For a storage duration of 7 days, isobutanal displayed already consequent losses whereas 1-propanol and tert-butanol showed only minimal losses. The same results were obtained after 14 days of storage, except for dichlorodifluoromethane which had significantly decreased. After 28 days, losses were observed for most of the more polar substances such as propanal, bromoethane, butanal and pentanal. It cannot be excluded that such losses are the result of permeation through caps and/or seals of the sampling tubes. However, it is strongly recommended that the tubes should be analysed as soon as possible after sampling.
3.4 Limits of detection and quantification
For 35 substances, the limits of decision (LODE), detection (LOD), and quantification (LOQ) could be determined according to DIN 32645 (ref. 11) and are presented in Table 4. For 14 other substances, the limits determined according to the protocol described in Section 2.2.2. are shown in Table 5. These values are given as amounts on the tube (in ng) corresponding to a mass concentration in air in μg m−3, when a sample volume of 1 L is considered. For the vast majority of compounds, the LOQ achieved is much lower than the corresponding guideline values. Only for acrolein, the LOQ determined considering a 1 L air sample (47 μg m−3) is higher than the corresponding NIK value (14 μg m−3). By considering higher air sample volumes, a lower LOQ can be reached but the influence of the sampling volume on the result should be checked (see Section 3.3. and Table 3). As a low influence of the sampling volume was obtained for acrolein in our study, a LOQ of 12 μg m−3 can be reached, when a 4 L sample is taken. A previous study which considered a 4 L air sample reached a lower LOQ of 2 μg m−3 but was focused on this single compound.9 For the other common compounds, the LOQs achieved by considering a 4 L sample are in the same range as in the validation from Schieweck et al. (2018) in dry nitrogen.8| Substance | LODE (ng) | LOD (ng) | LOQ (ng) |
|---|---|---|---|
| Dichlorodifluoromethane | 7.8 | 15.5 | 50.4 |
| Isobutane | 0.9 | 1.8 | 4.4 |
| 1,3-Butadiene | 1.8 | 3.6 | 9.1 |
| Chloroethane | 1.3 | 2.7 | 6.7 |
| cis/trans-2-butene* | 1.6 | 3.2 | 7.9 |
| n-Butane | 2.3 | 4.6 | 12.2 |
| cis/trans-2-butene* | 1.5 | 3.0 | 7.6 |
| Propanal | 3.9 | 7.8 | 22.5 |
| Acetone | 1.6 | 3.2 | 9.6 |
| Dichloromethane | 0.9 | 1.8 | 4.5 |
| Carbon disulfide | 1.2 | 2.3 | 6.3 |
| Trichlorofluoromethane | 10.7 | 21.3 | 102.3 |
| 1,1-Dichloroethene | 0.4 | 0.9 | 2.2 |
| Bromoethane | 1.1 | 2.1 | 5.3 |
| 2-Chloropropane | 5.7 | 11.4 | 30.4 |
| Diethyl ether | 1.2 | 2.5 | 6.3 |
| Isopentane | 2.1 | 4.2 | 10.5 |
| Isoprene | 1.3 | 2.5 | 6.6 |
| n-Pentane | 1.2 | 2.4 | 6.0 |
| tert-Butanol | 1.7 | 3.4 | 9.4 |
| Methacrolein | 1.2 | 2.5 | 6.2 |
| Cyclopentane | 0.7 | 1.4 | 3.6 |
| Methacrylonitrile | 0.9 | 1.7 | 4.3 |
| Chloroform | 9.0 | 17.9 | 71.9 |
| Methyl acrylate | 0.9 | 1.8 | 4.7 |
| 1,2-Dichloroethane | 0.4 | 0.8 | 2.1 |
| Methyl tert-butyl ether | 0.4 | 0.8 | 1.9 |
| 2-Methylpentane | 0.8 | 1.6 | 4.0 |
| Benzene | 2.3 | 4.6 | 15.6 |
| Tetrachloromethane | 0.6 | 1.3 | 3.2 |
| Trichloroethene | 0.5 | 1.0 | 2.5 |
| n-Hexane | 1.6 | 3.3 | 8.1 |
| Isopropyl acetate | 1.1 | 2.3 | 5.7 |
| Pentanal | 1.2 | 2.4 | 6.2 |
| n-Heptane | 1.4 | 2.7 | 7.2 |
| Substance | LOD (ng) | LOQ1 (ng) | LOQ2 (Cal R2 > 0.99) |
|---|---|---|---|
| Acrolein | 0.25 | 0.82 | Cal8: 47 ng |
| Furan | 0.15 | 0.50 | Cal7: 11 ng |
| Acrylonitrile | 0.13 | 0.44 | Cal7: 8.8 ng |
| Isopropanol | 0.34 | 1.12 | Cal8: 21 ng |
| Methyl acetate | 0.11 | 0.38 | Cal7: 21 ng |
| 1-Propanol | 1.08 | 3.60 | Cal8: 54 ng |
| Propanenitrile | 0.15 | 0.50 | Cal7: 11 ng |
| Isobutanal | 0.23 | 0.75 | Cal7: 11 ng |
| Vinyl acetate | 0.33 | 1.10 | Cal7: 18 ng |
| Butanal | 0.54 | 1.81 | Cal7: 13 ng |
| Tetrahydrofuran | 0.06 | 0.19 | Cal7: 11 ng |
| 2-Butanone | 0.26 | 0.85 | Cal7: 12 ng |
| Ethyl acetate | 0.51 | 1.69 | Cal7: 16 ng |
| 1,4-Dioxane | 0.14 | 0.48 | Cal9: 31 ng |
The analytical method presented here was optimized for a very broad range of substances. Taking into account fewer analytes, especially of a specific compound group, a further optimization of the method could lead to a further reduction of the LOD/LOQ.
3.5 Measurement uncertainty
The results of the combined measurement uncertainty at calibration level Cal 9 are displayed in Table 6. The details of the calculation are given in ESI Table S4.† It was not calculated for isobutanal and methyl acrylate because the gas standards could not be prepared for a third repetition due to a lack of chemicals. For heptane, the results are not displayed because it was present in every solution, which make the calculation very complex. It did furthermore not belong to the target substances. Two compounds had uncertainties above 35%: dichlorodifluoromethane (91%) and pentanal (73%). For dichlorodifluoromethane, high deviations of the GC/MS signal over several repetitions were observed, which shows poor precision for this compound. As these deviations appear three times in the calculation (see Section 2.2.4.), the real measurement uncertainty might probably be lower but cannot be reliably determined here. For pentanal, the high value from the measurement uncertainty is caused by the high standard deviation from the preparation of the standards (34%): as the solutions were prepared in three different years and the pentanal signal decreased, pentanal is probably unstable in the solution of group 5. All the other substances had uncertainties below 35%, which is satisfactory for such volatile compounds.| Compound | u(cGCT)/cGCT | u(tube spiking) | u(cal)/mcalculated | u(prec)/mcalculated | k | u(mcalculated)/mcalculated |
|---|---|---|---|---|---|---|
| a Isomers with identical mass contained in commercial gas mixture 1; no distinction possible as no individual substances available. | ||||||
| Dichlorodifluoromethane | 14% | 1% | 8% | 42% | 2 | 91% |
| Isobutane | 4% | 1% | 1% | 12% | 2 | 26% |
| 1,3-Butadiene | 3% | 1% | 1% | 12% | 2 | 26% |
| Chloroethane | 12% | 1% | 5% | 11% | 2 | 35% |
| cis/trans-2-Butenea | 4% | 1% | 1% | 12% | 2 | 25% |
| n-Butane | 4% | 1% | 1% | 13% | 2 | 28% |
| cis/trans-2-Butenea | 4% | 1% | 1% | 12% | 2 | 25% |
| Acrolein | 5% | 1% | 1% | 9% | 2 | 20% |
| Furan | 8% | 1% | 4% | 7% | 2 | 23% |
| Propanal | 13% | 1% | 3% | 7% | 2 | 30% |
| Acetone | 8% | 1% | 5% | 6% | 2 | 23% |
| Dichloromethane | 5% | 1% | 5% | 7% | 2 | 19% |
| Acrylonitrile | 7% | 1% | 4% | 6% | 2 | 21% |
| Carbon disulfide | 7% | 1% | 5% | 8% | 2 | 24% |
| Isopropanol | 8% | 1% | 5% | 8% | 2 | 25% |
| Trichlorofluoromethane | 13% | 1% | 2% | 8% | 2 | 31% |
| 1,1-Dichloroethene | 7% | 1% | 4% | 8% | 2 | 23% |
| Bromoethane | 7% | 1% | 3% | 7% | 2 | 21% |
| Methyl acetate | 7% | 1% | 4% | 6% | 2 | 21% |
| 2-Chloropropane | 12% | 1% | 1% | 10% | 2 | 31% |
| 1-Propanol | 9% | 1% | 5% | 8% | 2 | 27% |
| Diethyl ether | 9% | 1% | 4% | 7% | 2 | 24% |
| Isopentane | 5% | 1% | 1% | 11% | 2 | 24% |
| Propanenitrile | 10% | 1% | 4% | 6% | 2 | 25% |
| Isoprene | 2% | 1% | 4% | 8% | 2 | 18% |
| n-Pentane | 5% | 1% | 1% | 12% | 2 | 26% |
| tert-Butanol | 9% | 1% | 4% | 8% | 2 | 25% |
| Methacrolein | 7% | 1% | 6% | 5% | 2 | 21% |
| Cyclopentane | 4% | 1% | 3% | 8% | 2 | 18% |
| Vinyl acetate | 7% | 1% | 3% | 15% | 2 | 33% |
| Methacrylonitrile | 8% | 1% | 4% | 6% | 2 | 21% |
| Chloroform | 13% | 1% | 2% | 8% | 2 | 30% |
| Butanal | 4% | 1% | 6% | 7% | 2 | 20% |
| Tetrahydrofuran | 11% | 1% | 4% | 5% | 2 | 26% |
| 2-Butanone | 8% | 1% | 5% | 6% | 2 | 23% |
| Ethyl acetate | 7% | 1% | 4% | 5% | 2 | 20% |
| 1,2-Dichloroethane | 7% | 1% | 5% | 5% | 2 | 20% |
| Methyl tert-butyl ether | 8% | 1% | 4% | 5% | 2 | 21% |
| 2-Methylpentane | 5% | 1% | 3% | 8% | 2 | 20% |
| Benzene | 8% | 1% | 5% | 5% | 2 | 22% |
| Tetrachloromethane | 6% | 1% | 3% | 5% | 2 | 17% |
| Trichloroethene | 6% | 1% | 5% | 4% | 2 | 18% |
| n-Hexane | 6% | 1% | 1% | 9% | 2 | 22% |
| 1,4-Dioxan | 10% | 1% | 6% | 6% | 2 | 26% |
| Isopropyl acetate | 5% | 1% | 4% | 5% | 2 | 17% |
| Pentanal | 35% | 1% | 5% | 6% | 2 | 73% |
3.6 Example of an emission test chamber measurement
The chromatogram of the air sampled from the emission test chambers on day 7 after loading of the polyurethane foam is displayed in Fig. 2. Propene, dimethyl ether, isobutane and butane displayed high signals. For all these compounds, the signals resulting from the same air volume sampled on Tenax® TA were much lower than those on Carbograph 5TD, while the signal of ISTD benzene-d6 was constant. This demonstrates again the low suitability of Tenax® TA for sampling VVOCs, as shown in previous studies.5,6 As propene and dimethyl ether could not be validated in this study and the isobutane signal was above the calibration range used during validation, butane was chosen as an example for quantification.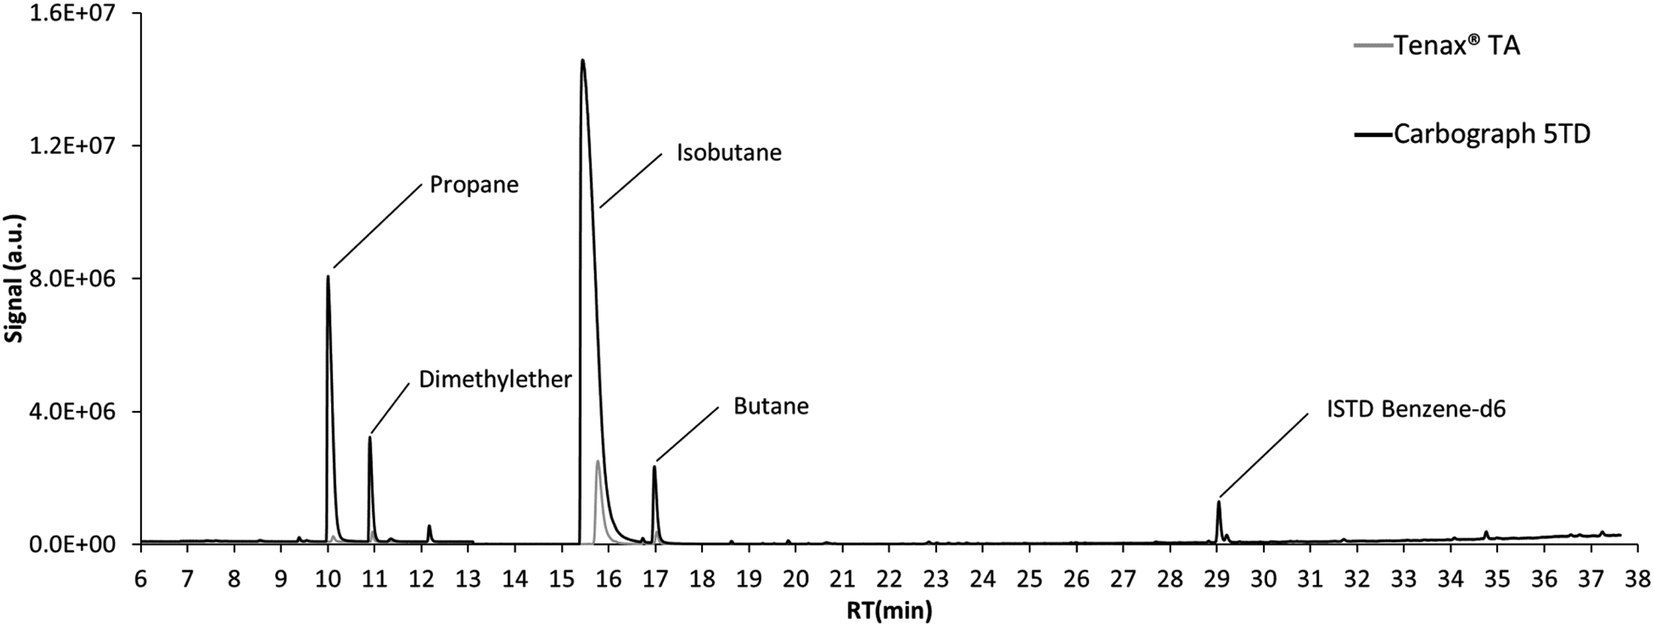 | ||
| Fig. 2 Chromatogram of the emissions of the polyurethane foam after 7 days in the emission test chamber. | ||
While considering an uncertainty based only on the standard deviation from 3 air samples, the butane air concentration in the emission test chamber was 155.4 ± 2.7 μg m−3. For the calculation of the combined uncertainty, the uncertainty of the sampling pump (5%) was added here, and the result of the quantification is then 155 ± 46 μg m−3. This shows the importance of the consideration of measurement uncertainty for VVOC air analysis.
4 Conclusions
This work presents a thorough study of the capability of Carbograph 5TD for VVOC analysis. The main progress lies in the consideration of a wide range of compounds and the study of the influence of different parameters on the performance of the method. Satisfactory recoveries (above 70%) and calibrations were achieved for 49 compounds (36 VVOCs) considering different spiking modes. The most volatile and polar substances are sometimes vulnerable to changes in the parameters: they can display losses at a high sampling volume, high relative humidity or longer storage duration. Dichlorofluoromethane has satisfactory recoveries, but the method is not robust for this analyte. LOQs in indoor air or emission guideline values and combined measurement uncertainties under 35% can be achieved with this approach. To extend the capacities of the method to the whole VVOC range, Carbograph 5TD should be combined with a stronger hydrophilic adsorbent but a reliable method for water management is still needed.Author contributions
Morgane Even: conceptualization, methodology, validation, formal analysis, investigation, data curation, writing – original draft preparation, visualization, project administration. Elevtheria Juritsch: conceptualization, methodology, validation, formal analysis, investigation, writing – reviewing and editing. Matthias Richter: conceptualization, writing – reviewing and editing, supervision, project administration, funding acquisition.Conflicts of interest
There are no conflicts of interest to declare.Acknowledgements
This project was commissioned by the German Federal Environment Agency (UBA) as part of the Environmental research Plan – Grant no. 3719622090 and financed with federal funds. The authors thank Dr Ana Maria Scutaru and Robert Bethke for fruitful discussions on the experimental results. We want to acknowledge Ulrike Siemers, Dr Astrid Gräff, Prof. Tunga Salthammer, Dr Frank Kuebart, Dr Thomas Neuhaus, Dr Erik Uhde and Dr Oliver Jann for taking part in the advisory board of the project. The authors also thank Dr Heinrich Kipphardt for technical support.References
- T. Salthammer, Indoor Air, 2016, 26, 25–38 CrossRef CAS PubMed.
- ISO 16000-6, Indoor air - Part 6: Determination of organic compounds (VVOC, VOC, SVOC) in indoor and test chamber air by active sampling on sorbent tubes, thermal desorption and gas chromatography using MS or MS FID (ISO 16000-6:2021), 2021 Search PubMed.
- EN 16516, Construction products - Assessment of release of dangerous substances - Determination of emissions into indoor air (EN 16516:2017 + A1:2020), 2020 Search PubMed.
- M. Even, E. Juritsch and M. Richter, TrAC, Trends Anal. Chem., 2021, 140, 116265 CrossRef CAS.
- M. Even, E. Juritsch and M. Richter, Anal. Chim. Acta, 2023, 1238, 340561 CrossRef CAS.
- M. Richter, E. Juritsch and O. Jann, J. Chromatogr. A, 2020, 1626, 461389 CrossRef CAS.
- A. Pech, O. Wilke, W. Horn and O. Jann, Proceedings of Indoor Air 2016 – The 14th International Conference on Indoor Air Quality and Climate, Ghent, Belgium, 2016 Search PubMed.
- A. Schieweck, J. Gunschera, D. Varol and T. Salthammer, Anal. Bioanal. Chem., 2018, 410, 3171–3183 CrossRef CAS PubMed.
- A. Schieweck, E. Uhde and T. Salthammer, Environ. Sci.: Processes Impacts, 2021, 23, 1729–1746 RSC.
- J. Vogelgesang and J. Hadrich, Accredit. Qual. Assur., 1998, 3, 242–255 CrossRef CAS.
- DIN 32645, Chemical analysis – Decision limit, detection limit and determination limit under repeatability conditions – Terms, methods, evaluation (DIN 32645), 2008 Search PubMed.
- Eurachem Guide: The Fitness for Purpose of Analytical Methods - A Laboratory Guide to Method Validation and Related Topics, ed. B. Magnusson and U. Örnemark, 2nd edn, 2014 Search PubMed.
- EURACHEM/CITAC Guide CG 4 - Quantifying Uncertainty in Analytical Measurement, ed. S. L. R. Ellison and A. Williams, 3rd edn, 2012 Search PubMed.
- J. Wellmitz and M. Gluschke, UBA-Texte 01/05 - Leitlinie zur Methodenvalidierung [in German], Umweltbundesamt (UBA), Dessau, 2005 Search PubMed.
- ISO 16000-9, Indoor air – Part 9: Determination of the emission of volatile organic compounds from building products and furnishing - Emission test chamber method (ISO/DIS16000-9, 2023 Search PubMed.
Footnote |
| † Electronic supplementary information (ESI) available. See DOI: https://doi.org/10.1039/d3ay00677h |
| This journal is © The Royal Society of Chemistry 2023 |