
 Open Access Article
 This Open Access Article is licensed under a Creative Commons Attribution-Non Commercial 3.0 Unported Licence
A green methodology for the determination of cocaine in camouflaged samples†
D.
Gallart-Mateu
 *,
A.
Gallardo
,
S.
Garrigues
and
M.
de la Guardia
*,
A.
Gallardo
,
S.
Garrigues
and
M.
de la Guardia
Department of Analytical Chemistry, University of Valencia, Jeroni Munoz Building, 50th Dr Moliner St., 46100 Burjassot, Valencia, Spain. E-mail: Daniel.gallart@uv.es; Tel: +34 963 543 158
First published on 27th March 2023
Abstract
A methodology based on the ultrasound-assisted extraction with ethanol and the dry film attenuated total reflectance infrared spectroscopy (DF-ATR-FTIR) measurement of extracts has been developed for a fast evaluation of non-conventional (“exotic”) solid-sized cocaine samples. The method provides quantitative results in less than three minutes with a limit of detection in the solid sample of 1.6 μg g−1 of cocaine with a variation coefficient lower than 7%. Results found for seized samples of different natures were compared with those obtained by a reference gas chromatography method and the greenness of the whole proposed procedure was evaluated and compared using the analytical eco-scale, green analytical procedure index (GAPI), and analytical greenness metric (AGREE). The green evaluation of the proposed methodology provided green scores by considering different evaluation criteria.
Introduction
Drug trafficking is an illegal trade throughout the world,1,2 with cocaine being the second most consumed illicit drug in Europe.3–5 Cocaine is mainly present in two chemical forms; water-soluble cocaine salt (usually hydrochloride) and cocaine base.2,6,7 For illicit-market purposes, cocaine is mixed with several compounds such as pharmaceuticals: lidocaine, benzocaine, levamisole, caffeine, procaine, boric acid, hydroxyzine, and phenacetin, or diluents or cutting agents such as lactose, glucose, carbonates/bicarbonates, silicates, starch, and sulfates.7,8 On the other hand, to avoid cocaine detection using the usual drug identification tests, it is combined or camouflaged with other substances. For large-scale trafficking and transport of cocaine before mixing with other substances and street distribution, usually it is hidden in vehicles, luggage, suitcases, and even using the human body as a container.9 Another way of camouflage is to transport the drug dissolved or suspended in a liquid such as fruit juices, milk, beer, and alcohol, or pastes and solids such as honey, jam, toothpaste, rubber, and wax blocks,9,10 or within polymeric materials.10–12 In recent years, impregnated clothes and textiles have been reported in cocaine trafficking and transport.9–13Nowadays, according to the 2019 European Drug Report, the cocaine illicit market has kept increasing, highlighting the traffic of cocaine in large volumes, especially through ports.5 In this sense, new and original methods of transport and camouflage as mixtures of cocaine with other materials have been reported.8–11 The so-called black cocaine, is a mixture of cocaine with other substances, to mask efficiently the physico-chemical characteristics.11,14 Typically, these mixtures incorporate cobalt or copper thiocyanate salts and ferric chloride in order to confuse the results of colorimetric tests based on the use of thiocyanate (Scott test) and avoid its detection.15–17 Numerous cocaine-hiding strategies have been reported with different solid matrices that include toner cartridge powder, industrial dyes, soils, black carbon, and fertilizers.18
Following the recommendations of the United Nations Office of Drug and Crime (UNODC)2 when cocaine is mixed or impregnated with/into other materials, a previous full extraction procedure is required, followed by its determination by gas (GC) or liquid chromatography (LC). Normally, a single extraction is carried out using an ultrasound water bath, which involves long times and high consumption of organic solvents (ethanol, methanol, acetone, etc).19,20 However new analytical procedures based on the dilute and shoot approach have been proposed together with the use of sensitive and selective LC-MS/MS.21 Taking into consideration the high number of sample analyses required in forensic and drug analysis laboratories, it becomes necessary to develop rapid extraction and determination methodologies, suitable for providing quantitative data without the need for an extensive economy of solvents and waste generation.
The use of vibrational spectroscopy techniques allow minimal sample preparation and are non-destructive, providing relatively fast results and makes them ideal for the detection and identification of drugs in seized samples when the drug is present at a percentage level making direct measurements of the samples20 possible. Thus, Raman spectroscopy has been used for qualitative and quantitative analysis of abused drugs.22–25 NIR spectroscopy has been also used for the determination of heroin and cocaine in seized street samples20,26,27 or the direct quantification of cocaine in impregnated materials.13 MIR spectroscopy, especially using attenuated total reflection (ATR), has not only been employed for the direct discrimination and identification of cocaine and its adulterants in different types of seized samples7,22,28–30 but is also used for quantification using chemometrics.6,13,31,32
One of the limitations of direct sample IR-based measurements is the lack of sensitivity when cocaine is present below percentage levels or there is an important spectral interference due to the sample matrix or the presence of substances combined with cocaine.33 In this sense, de Oliveira-Penido et al.34 and Grobério et al.35 reached around 1% (w/w) cocaine detection limit values by employing direct ATR-FTIR and chemometrics. However, ATR measurements of solid samples lack precision due to difficulties in pressure control. The use of diffuse reflection (DR) measurements of solids in the near-infrared region (NIR) is more precise than the MIR data. So, DR-NIR has been employed for direct analysis of cocaine in seized samples by requiring multivariate calibration models prepared using well-characterized samples of the same nature. Pérez-Alfonso et al.20 reached 5% (w/w) cocaine quantification limits by DR-NIR. For ATR-FTIR measurements the use of a previous extraction step seems mandatory when cocaine is present at low concentrations in this type of sample in order to increase sensitivity and avoid spectral interferences due to the matrix.
To our knowledge, there are no references on the determination of cocaine in the extracts of camouflaged samples by using vibrational spectroscopy techniques. Direct quantification of cocaine extracts by transmittance or ATR measurements avoids or reduces matrix interferences but it can decrease the sensitivity of the method due to the analyte dilution. Because of that, the direct ATR of the extract using the dry film measurement technique could be proposed as an alternative providing sensitive determination and requiring only a few μL of the sample extract.
On the other side, the interest in the impact of chemistry36,37 and, in particular, analytical chemistry on the environment, operators, and consumption of solvents, reagents, and energy38,39 has increased in the last decades. Methods such as the green analytical procedure (GAPI),40 green certificate-modified Eco-Scale41 or analytical GREEnness metric approach (AGREE)42 and analytical greenness metric for sample preparation (AGREEprep)43 have been developed to evaluate the hazards, waste, solvent/reagents, and energy consumption of analytical methodologies. The aforementioned criteria can be considered the most widely used evaluation criteria for the greenness of the method.44
The objective of this study was to develop a new, green, and fast methodology to detect and quantify cocaine at low concentrations in camouflaged samples based on the ultrasound probe-assisted extraction with ethanol combined with the determination by dry film-ATR-MIR spectroscopy.
Experimental section
Apparatus and reagents
IR spectra were recorded using a Tensor 27 FT-IR spectrometer from Bruker (Karlsruhe, Germany) equipped with a DLaTGS detector and a DuraSamplIR attenuated total reflection module for liquids with a nine reflection diamond/ZnSe DuraDisk plate and module for solid samples with a three reflection diamond/ZnSe DuraDisk plate, both provided by Smiths Detection Inc. (Warrington, UK). For instrumental and measurement control, spectra treatment, and data manipulation, the OPUS program (version 6.5) from Bruker was employed.To conduct the cocaine extraction studies, classical 6 Liters Bransonic ultrasound water bath, model 2510 New demo (Barcelona, Spain), with a total power of 360 W, and a Bandelin Sonoplus ultrasound focused probe, with an HD2070 booster horn and a 2 mm diameter titanium microtip (model MS 72) (Berlin, Germany), with a total power of 70 W, with a Digicen 20 centrifuge (Madrid, Spain) were employed.
An Agilent 7697A Gas Chromatographer (California, USA) with a Zebron capillary column ZB-5MS (30 m × 250 μm × 0.25 μm) and an Agilent 5975C inert XL EI/CI MS triple axis single quadrupole detector were employed to determine cocaine by applying the reference procedure.
High-purity cocaine, obtained from a seized cocaine hydrochloride block provided by the official Valencia Drug Control Laboratory (Valencia, Spain) and characterized by GC-MS standard procedure, was employed for developing and conducting recovery assays for the infrared-based proposed methodology. A 1000 μg mL−1 cocaine standard prepared in acetonitrile (Sigma-Aldrich, Texas, USA) was employed as the standard for the GC-MS reference method. Lidocaine (99.9%), purchased from Guinama (Valencia, Spain), was used as the internal standard for gas chromatography reference methodology.
Absolute ethanol of HPLC grade purity from Scharlau Chemie S.A. (Barcelona, Spain) was used for the preparation of standard solutions and extracts.
Samples
Fourteen solid samples suspected of containing cocaine, including soils, powdered carbon, ground palm kernel shell, and coconut fibers, were provided by Official Valencia Drug Control Laboratory (Valencia, Spain). The samples were ground, homogenized, and stored in closed vials until their analysis.Different laboratory solid samples containing cocaine were prepared using two previously analyzed cocaine-free samples as matrices. For this purpose, cocaine-free samples of powdered carbon and soil were spiked well and homogenized with cocaine in order to reach concentrations between 5.5 and 90.1 mg g−1. The extraction and quantification of cocaine were performed to evaluate the recovery percentage of the proposed infrared method.
Sample characterization
ATR-FTIR spectra of solid samples were recorded from 4000 to 550 cm−1 by using the 3-reflection ATR accessory. Spectra were obtained by co-adding 50 scans with a 4 cm−1 resolution in front of a background spectrum corresponding to the clean ATR crystal before each sample measurement.Ultrasound-assisted extraction
![[thin space (1/6-em)]](https://www.rsc.org/images/entities/char_2009.gif) 200 μg g−1 taking into consideration the original sample mass and the proposed extraction procedure) prepared in ethanol and measured by the dry film technique in the same conditions that of samples.
200 μg g−1 taking into consideration the original sample mass and the proposed extraction procedure) prepared in ethanol and measured by the dry film technique in the same conditions that of samples.
Results and discussion
Direct characterization of the samples
Fig. S1† shows the direct ATR-IR spectra for cocaine standard and cocaine-positive carbon, soil, coconut fiber, and ground palm kernel shell seized camouflaged samples. It can be seen that the bands in the range of 550–1900 cm−1 allow the cocaine identification possibility due to the presence of its absorption bands. However, it must be noticed that in all cases, the cocaine bands are interfered with by the matrix bands avoiding the direct quantification of those samples containing low concentrations.DF-ATR-FTIR spectrum of ultrasound probe extracted samples
Fig. 1 shows the IR spectra in the region of 1800 to 550 cm−1, obtained using the dry film ATR technique, corresponding to 2 μL of the ethanolic extracts corresponding to carbon (a), soil (b and c), coconut fiber (d and e) and ground palm kernel shell (f) cocaine-positive camouflaged samples. As it can be seen, DF-ATR-FTIR spectra allow a clear identification of the main and characteristic band of cocaine centered at 1717 cm−1 due to the carbonyl group stretching, together with bands at 1271, 1232, and 1112 cm−1 due to the –(C![[double bond, length as m-dash]](https://www.rsc.org/images/entities/char_e001.gif) O)–O– group stretching. Moreover, the mono-substituted benzene ring stretching band, at 1071 cm−1 and 1025 cm−1 can also be observed together with a single band at 715 cm−1 due to the out-of-plane bending.7 However, attending to the wide range of matrix types employed to camouflage cocaine, the use of the most intense band at 1717 cm−1 for quantification purposes could be compromised by the presence of spectral interferences between 1600 and 1700 cm−1 for different matrices. This fact can be solved by employing the 715 cm−1 band, as a compromise between selectivity and sensitivity. For all the studied cases, the peak height of this band was employed for IR measurements of cocaine.
O)–O– group stretching. Moreover, the mono-substituted benzene ring stretching band, at 1071 cm−1 and 1025 cm−1 can also be observed together with a single band at 715 cm−1 due to the out-of-plane bending.7 However, attending to the wide range of matrix types employed to camouflage cocaine, the use of the most intense band at 1717 cm−1 for quantification purposes could be compromised by the presence of spectral interferences between 1600 and 1700 cm−1 for different matrices. This fact can be solved by employing the 715 cm−1 band, as a compromise between selectivity and sensitivity. For all the studied cases, the peak height of this band was employed for IR measurements of cocaine.
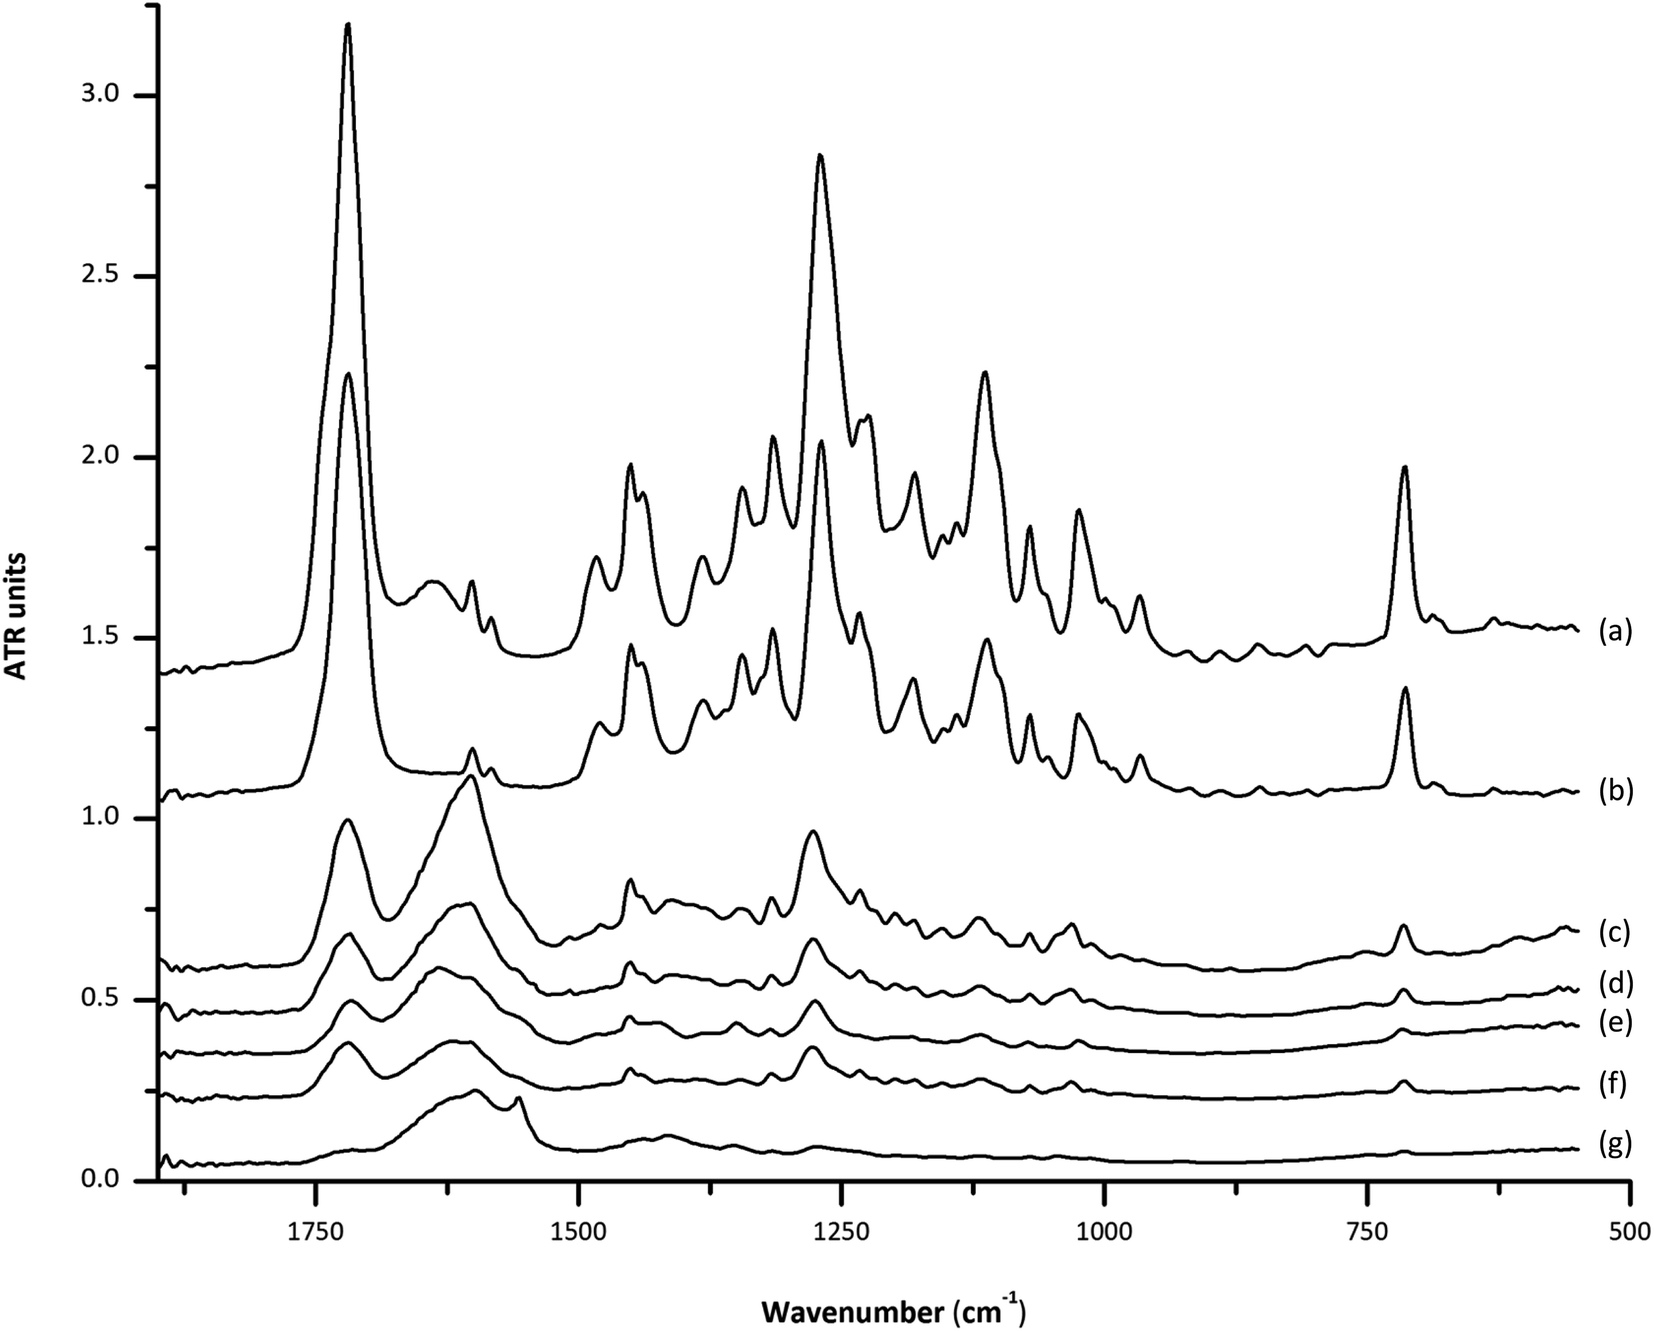 | ||
| Fig. 1 Dry film-ATR-FTIR spectra, in the range between 1800 and 550 cm−1, of cocaine standard (a), ethanolic extractions of powdered carbon (b), soil (c) and (d), coconut fiber (e) and (f) and ground palm kernel shell (g) cocaine positive camouflaged samples. Note: the most sensitive band of cocaine centered at 1717 cm−1 (showing interferences) and that at 715 cm−1 are shown inside the red frames. | ||
Selection of extraction parameters
The use of an ultrasound-assisted solid–liquid extraction has several advantages as enhanced speed, selectivity, reproducibility, and the possibility of working in soft energy conditions,45 making it an appropriate tool that follows the principles of green chemistry.46Following the recommendations of the UNODC,2 when the cocaine is dissolved, impregnated, or camouflaged with other materials, an extraction prior to analysis is required. The extraction efficiency is a crucial step in ensuring a correct and quantitative sample result. Typically, a single extraction carried out using the classical ultrasound water baths by the UNDOC recommended procedures requires 75 min of the extraction time. However, the use of a focused ultrasound probe can provide a tremendous reduction of the time required for a quantitative extraction, as compared with the ultrasound water bath.
Selection of ultrasound-assisted probe conditions
A cocaine-free sample spiked at 110 mg g−1 cocaine concentration level was employed to select the extraction conditions using the ultrasound probe. In all cases, consecutive extractions of the same sample aliquot were carried out and analyzed by DF-ATR-FTIR. The extraction volume of ethanol was set at 1 mL, this is the minimum volume required to use the probe.When extractions were performed using 50% power with 0.1 seconds pulses during 20, 15, and 10 min, no significant differences were found in the results obtained. However, the amount of cocaine extracted was under that expected with sonication times higher than 10 minutes, possibly due to the degradation of the analyte. On the other hand, in previous studies, the increase in the number of pulses with a medium probe power decreased the extraction time, being minimum when a continuous probe working mode was employed. Furthermore, the extraction efficiency increased with the power rising, and, subsequently decreased the extraction time. In this sense, the maximum extraction capability was obtained with extraction times lower than 2 minutes and 60% probe power, and a continuous working mode. As a consequence, and considering these facts, three extraction times, 2, 1.5, and 1 min, were studied by applying a 60% probe power and continuously working. The results are shown in Fig. 2. It can be seen that only significant differences were observed in the first extraction between the three extraction times studied. However, these differences were minimized in the following consecutive extractions, reaching comparable values statistically comparable to 100% for the final total recovery, thus evidencing that under these conditions and sonication time, no degradation of cocaine was observed. Thus, 1 min as the extraction time was selected to obtain a fast quantitative extraction.
 | ||
| Fig. 2 Amount of cocaine extracted with four consecutive extractions of a 110 mg g−1 cocaine spiked blank sample by employing 2, 1.5 and 1 minute as extraction tine (A) and total cocaine recovery (%) of a 110 mg g−1 cocaine spiked sample obtained at the three different extraction times (B). Part (C) indicates the recovery values obtained for powdered carbon samples spiked at 65 and 150 mg g−1 levels obtained by employing a single step extraction with different volumes of ethanol. | ||
To improve the efficiency of the extraction step, several studies were performed to determine the effect of consecutive or one-simple-step extraction strategies combined with the ethanol extraction volume (see Fig. 2). Two sample types, soil, and powdered carbon, were spiked at 65 and 150 mg g−1 cocaine levels, respectively. Consecutive extractions using 100 mg of the mass were carried out employing 1 mL ethanol, 60% power, and 1 min as extraction time in a continuous working mode, and the cocaine concentration was determined by DF-ATR-FTIR. Additionally, the effect of the sample/extraction solvent ratio was studied using 100 mg of each spiked sample and treated in a single extraction step by employing 1, 2, 3, 4, or 5 mL ethanol.
For consecutive extractions with 1 mL, total recovery was obtained for both samples (Fig. 2A and B). For a single-step extraction, recovery values from 50 to 60% were obtained using 1 mL of ethanol and this recovery increased with the ethanol volume, reaching values between 97 and 99% for 4 mL. On the other hand, for the single-step extraction assay, the use of 5 mL ethanol volume did not involve a significant recovery increase (Fig. 2C). Therefore, a compromise between selecting 4 mL as extraction ethanol volume and quantitative recovery values was considered. In this sense, the one single 4 mL extraction procedure was compared with four consecutive 1 mL extractions, with statistically comparable results (tcal: 1.21 for 65 mg g−1 cocaine level and 0.10 for 150 mg g−1 cocaine level compared with ttab: 4.30 for n = 3 and 95% probability level) were found. As a consequence, a single-step extraction with 4 mL ethanol was selected.
Comparison between ultrasound probe and ultrasound bath extractions
The extraction efficiency of the use of the ultrasound probe was compared with that found with the ultrasound water bath as suggested in the UNDOC recommendation. Four samples were extracted per triplicate following the proposed probe extraction (4 mL ethanol and 1 minute at 60% ultrasound power) and employing the reference ultrasound bath extraction with the same ethanol volume and 75 minutes extraction time. As can be seen in Fig. 3, in all cases, the extraction efficiency provided by the ultrasound probe was higher than that provided by the ultrasound bath. Similarly, the average standard deviation obtained for several replicates was lower for the probe than for the bath. So, the use of the ultrasound probe instead of the ultrasound bath can be strongly recommended.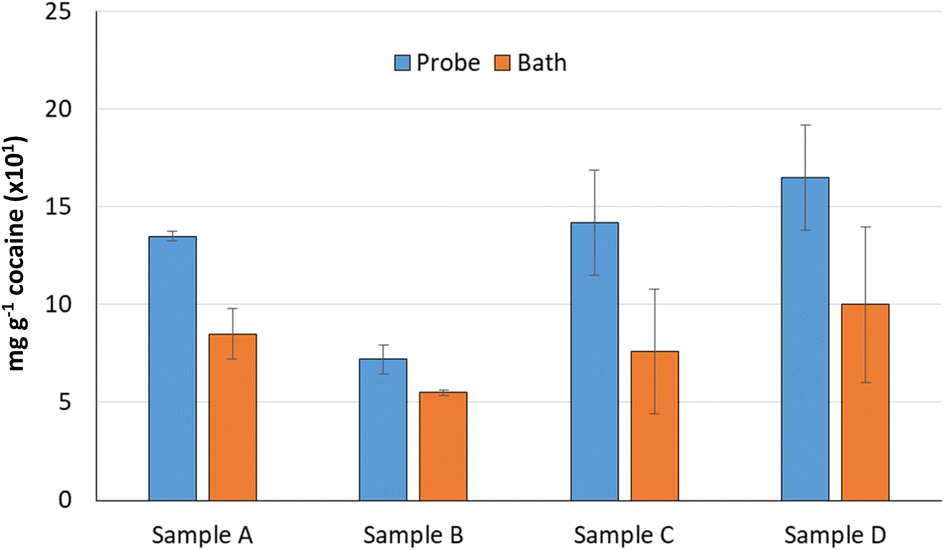 | ||
| Fig. 3 Comparison of cocaine amount extracted of four seized samples (n = 3) by employing the proposed ultrasound probe extraction (4 mL ethanol, 60% power, 1 minute extraction time, continuous mode) and ultrasound water bath extraction (4 mL ethanol and 75 minutes extraction time). | ||
Analytical features of the method
The linearity of the method was established for the cocaine-working range of 2720 to 27200 μg−1 cocaine in the ethanol extract. A regression coefficient (R2) of 0.9997 was obtained. The detection limit (LOD) and the quantification limit (LOQ) were calculated as 3 and 10 times the standard deviation of the intercept divided by the slope, respectively, and that for a sample mass of 100 mg are equivalent to 1.6 μg g−1 and 5.4 μg g−1 cocaine in the solid sample, respectively. Furthermore, the LOQ value in the original sample was verified through the triplicate analysis of a cocaine blank spiked at the LOQ level, according to UNODC validation guidance.47 A value of 80 ± 7% value was obtained, with an −18.5% bias value.
The trueness of the method was determined as the recovery values obtained for a cocaine-free sample spiked at four different and common cocaine concentration levels. Table 1 shows the obtained recovery results. In all cases, the recoveries varied from 84 to 105% with RSD values from 2 to 3%.
Determination of cocaine in seized samples
Cocaine content of samples was determined by using the extraction methodology described above, employing a focused ultrasound probe and pure ethanol as a solvent. The measurements of the extracts were made by DF-ATR-FTIR (see Table 2). Results were compared with those provided by the GC-MS reference procedure using Deming regression (Fig. 4A), considering the standard deviations of each method. The comparison of both methodologies provided a regression with a slope of 1.0770 (95%, confidence interval from 0.8875 to 1.2665) and an intercept of 3.5117 (95%, confidence interval from −15.4288 to 22.4523), being 0 and 1 values, for the intercept and the slope respectively, included in their confidence regions. A joint confidence region for the slope and the intercept test was performed,48,49 providing a 3.38 Fcal value (Ftab: 4.76 (α = 0.05, 2, 7)), being the slope statistically comparable with 1 and the intercept with zero, thus, indicating a good agreement between both assayed methods. Bland–Altman plot (Fig. 4B) shows that average values of both methods were randomly distributed around the average difference and they were inside the limits of agreement. Thus, the determination of cocaine in camouflaged samples by both methods provided statistically comparable results.| Sample type | Average of cocaine (mg g−1 ± s, n = 3) | Average of cocaine (mg g−1 ± s, n = 3) |
|---|---|---|
| DF-ATR-FTIR | GC-MS | |
| a <LOD. | ||
| Soil | —a | —a |
| Soil | 70 ± 10 | 60 ± 20 |
| Soil | 95.8 ± 0.4 | 80 ± 10 |
| Carbon | —a | —a |
| Carbon | 65 ± 2 | 66 ± 8 |
| Carbon | 120 ± 5 | 114 ± 10 |
| Carbon | 130 ± 4 | 120 ± 20 |
| Carbon | 150 ± 2 | 140 ± 6 |
| Kernel | —a | —a |
| Kernel | 68 ± 10 | 61 ± 5 |
| Kernel | 104 ± 6 | 90 ± 10 |
| Coconut | —a | —a |
| Coconut | 80 ± 10 | 70 ± 20 |
| Coconut | 110 ± 3 | 92 ± 5 |
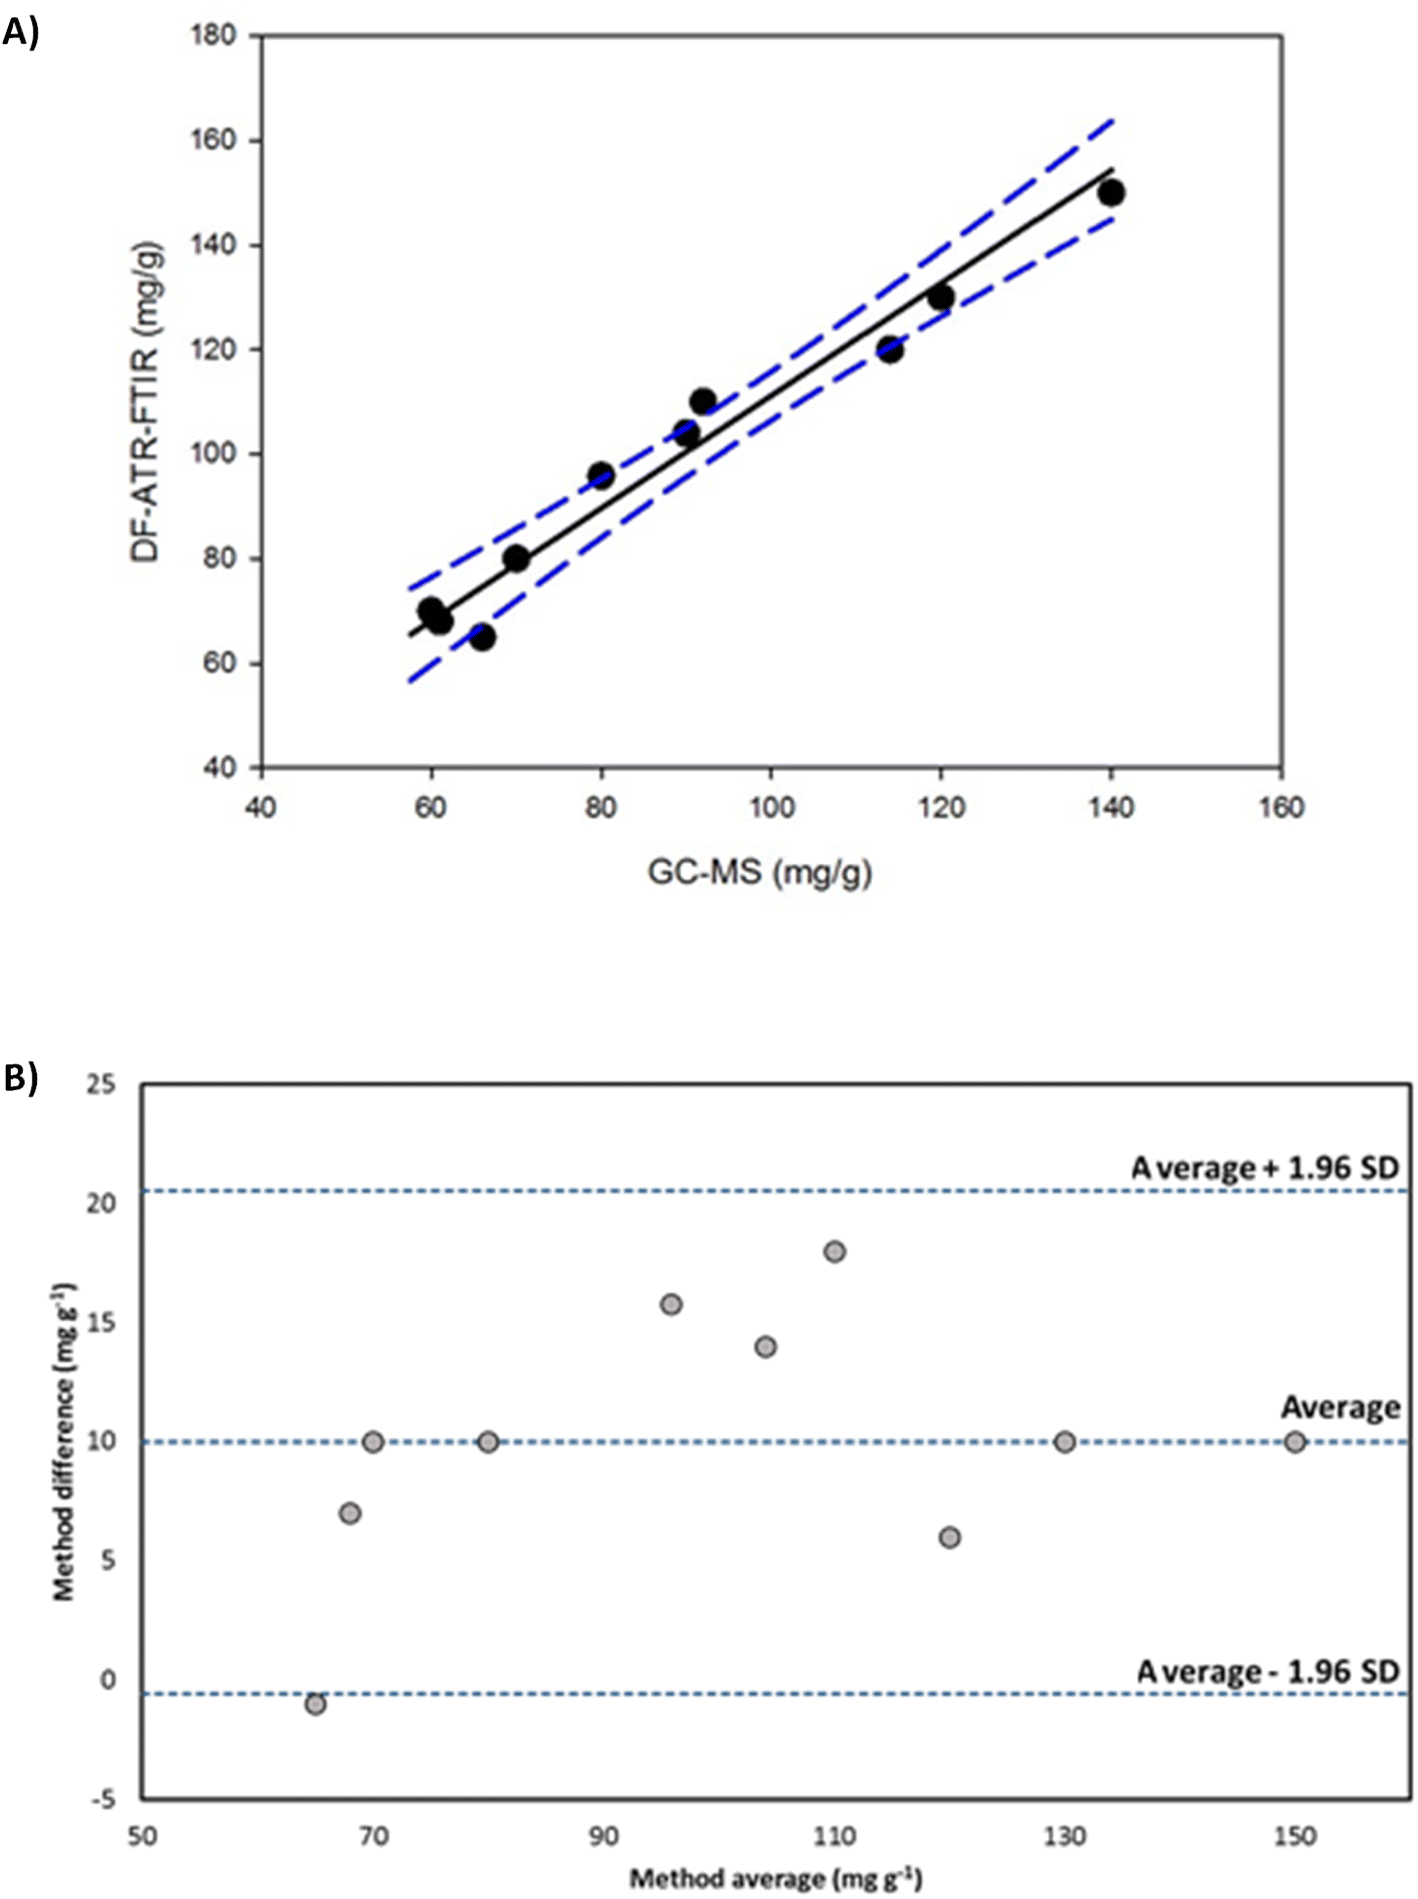 | ||
| Fig. 4 Deming regression (A) and Bland–Altman dispersion plot (B) for the comparison of results obtained for the determination of cocaine in camouflaged samples by DF-ATR-FTIR and GC-MS. | ||
Green evaluation of the proposed methodology
Three methods, Green Certificate-modified Eco-Scale, GAPI, and AGREE, were applied to evaluate the greenness of the proposed methodology to determine cocaine in camouflaged samples. The obtained evaluations are shown in Fig. 5. The evaluation performed by the Green Certificate involves characteristic parameters such as reagents toxicity, energy consumption, and emission of toxic compounds to the environment, especially, reagent and solvent volumes employed and the amount of the waste generated. These parameters were scored using a penalty-point system (see Table 3A) with a 95.4 due to the employed reduced volumes and wastes generated, although it did not involve a direct analysis.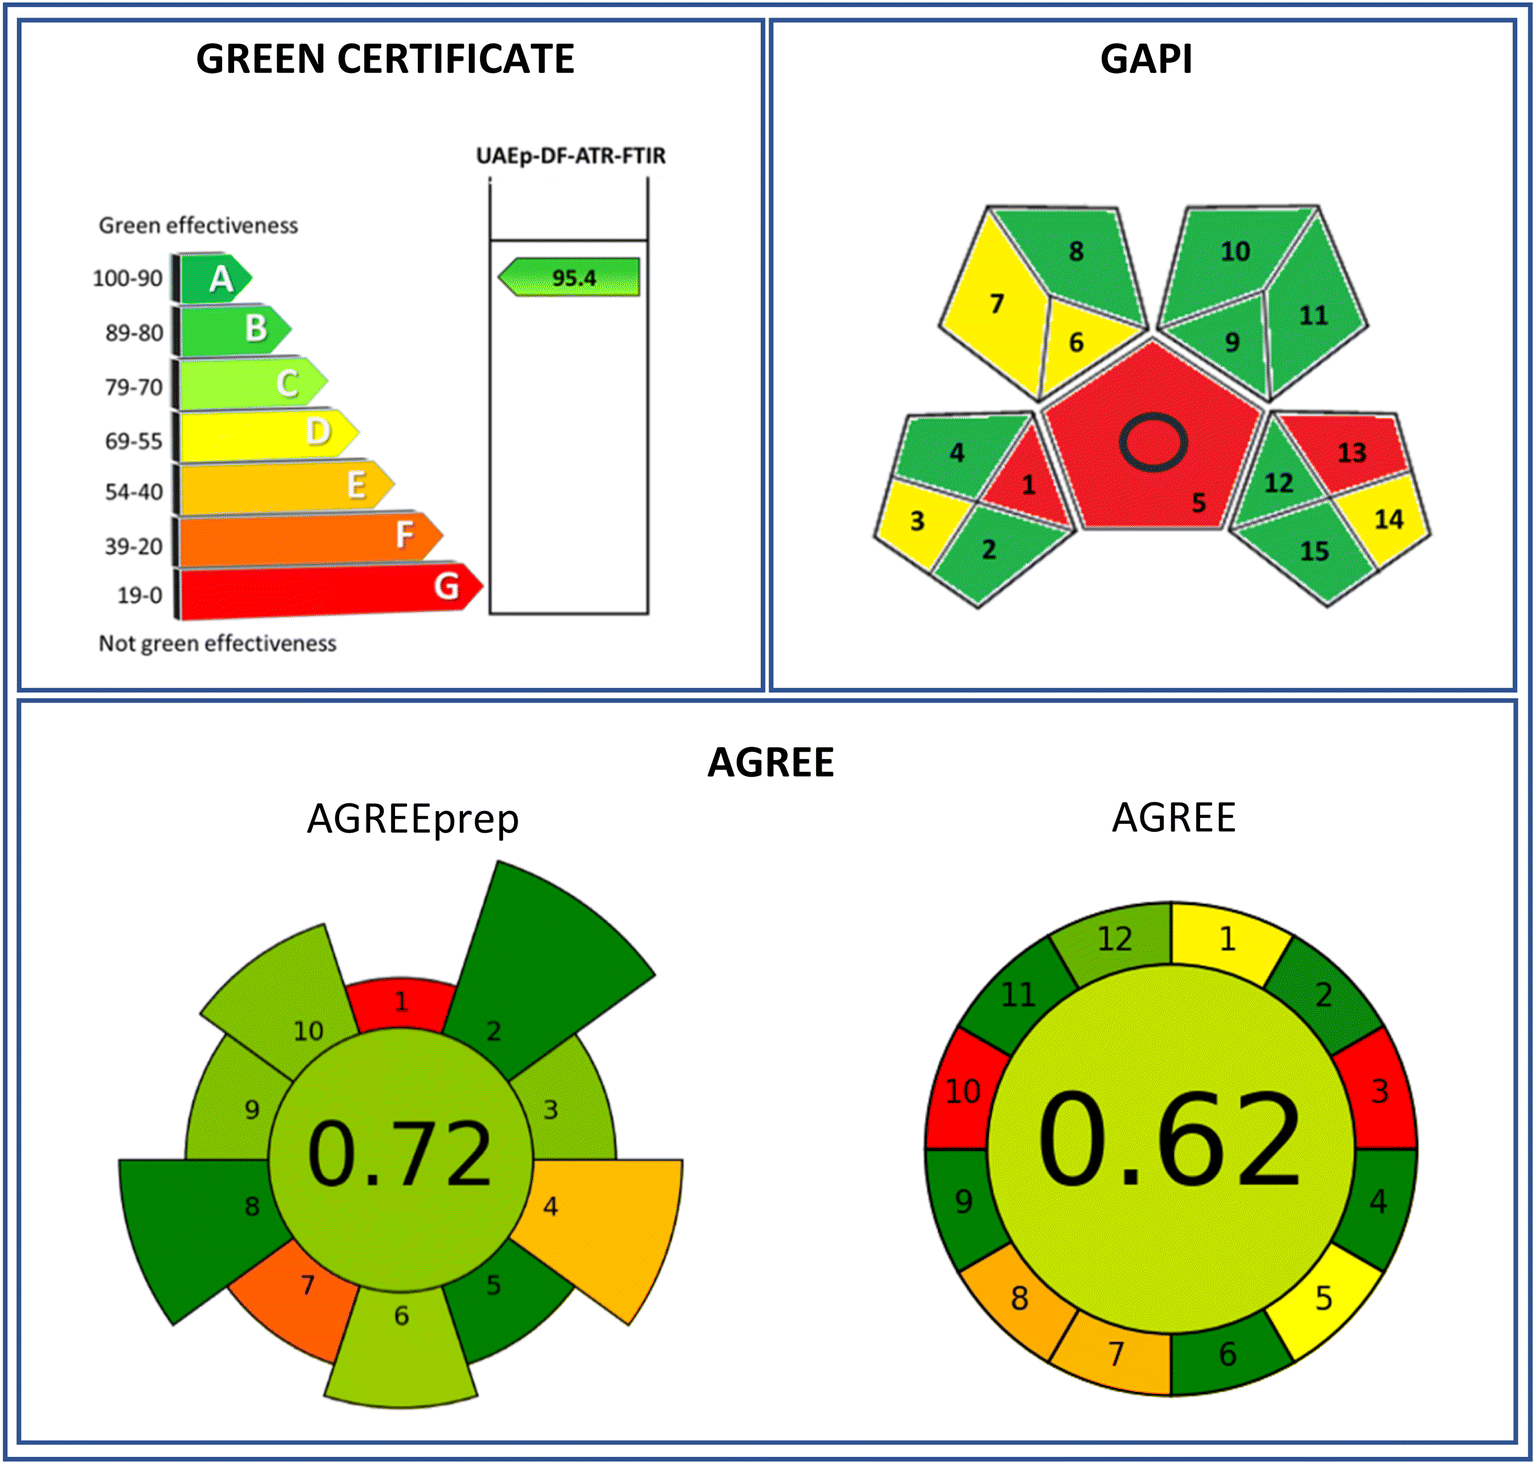 | ||
| Fig. 5 Evaluation of the determination of cocaine in camouflaged solid samples by the proposed DF-ATR-FTIR analytical procedure using the greenness evaluation tools. | ||
| (A) Green Certificate-modified Eco-Scale penalty points | ||
|---|---|---|
| Dry film-ATR-FTIR | ||
| a Weight pre-stablished by AGREEprep developers. | ||
| Reagents | Ethanol | 1.2 |
| Instrumental | Scale | 1 |
| Ultrasound probe | ||
| FTIR | ||
| Occupational hazard | 1 | |
| Waste | 2.4 | |
| Total score | Σ 4.6 | |
| 95.4 | ||
| (B) Metrics corresponding to the AGREEprep greenness evaluation for the sample preparation procedure | ||
|---|---|---|
| Sample preparation | ||
| Score | Weighta | |
| Criterion 1. Sample preparation placement: ex situ | 0.00 | 1 |
| Criterion 2. Hazardous materials: 0 | 1.00 | 5 |
| Criterion 3. Sustainability, renewability and reusability of materials: >75% reagents and materials are sustainable or renewable | 0.75 | 2 |
| Criterion 4. Waste: 5 g or mL waste | 0.37 | 4 |
| Criterion 5. Size economy of the sample: 0.1 | 1.00 | 2 |
| Criterion 6. Sample throughout: 20 samples per hour | 0.71 | 3 |
| Criterion 7. Integration and automation: 3 steps with manual systems | 0.19 | 2 |
| Criterion 8. Energy consumption: 10 | 1.00 | 4 |
| Criterion 9. Post-sample preparation configuration of analysis: spectroscopy | 0.75 | 2 |
| Criterion 10. Operator's safety: 1 hazard | 0.75 | 3 |
| (C) Metrics corresponding to the AGREE greenness approach for the whole proposed analytical procedure | |
|---|---|
| Dry film-ATR-FTIR | |
| Principle 1. Direct analytical techniques should be applied to avoid sample treatment | 0.48 |
| Principle 2. Minimal sample size and minimal number of samples are goals | 0.98 |
| Principle 3. In situ measurements should be performed | 0.00 |
| Principle 4. Integration of analytical processes and operations saves energy and reduces the use of reagents | 1.00 |
| Principle 5. Automated and miniaturized methods should be selected | 0.50 |
| Principle 6. Derivatization should be avoided | 1.00 |
| Principle 7. Generation of a large volume of analytical waste should be avoided and proper management of analytical waste should be provided | 0.36 |
| Principle 8. Multianalyte or multiparameter methods are preferred versus methods using one analyte at a time | 0.34 |
| Principle 9. The use of energy should be minimized | 1.00 |
| Principle 10. Reagents obtained from renewable source should be preferred | 0.00 |
| Principle 11. Toxic reagents should be eliminated or replaced | 1.00 |
| Principle 12. The safety of the operator should be increased | 0.80 |
On the other hand, the GAPI evaluation (see Fig. 5) was performed by the offline collection of the sample, the use of an extraction procedure, and the emission of vapours to the atmosphere, thus being a red evaluation assigned to these aspects. A yellow evaluation was assigned to the sample transport, the volume of solvents and wastes generated, and the scale of the extraction required. Green classifications were assigned to the remaining items.
Attending the AGREEprep tool, the proposed sample treatment procedure is classified with a 0.72 score (see Fig. 5). Zero red coloured point-score was assigned due to the ex situ sample preparation, while 0.19 and 0.37 points were due to the preparative integration/automation and waste generation, respectively, providing orange yellowish and orange coloured zones in the pictogram (Table 3B). Pale green zones were provided due to sustainability, sample throughput, post-sample preparation, and operator safety, with scores between 0.71 and 0.75 points. On the other side, 1 point-scores were assigned to hazardous materials, size of sample, and energy consumption, providing dark green colour zones. However, when the whole analytical procedure (including standards and total waste) was considered, also taking into account the twelve green analytical chemistry precepts and SIGNIFICANCE principles, the AGREE tool classified the proposed procedure with a 0.62 score, Fig. 5 and Table 3C, indicating the AGREE approach evaluation for the determination of cocaine in seized samples. The proposed DF-ATR-FTIR methodology was classified as zero point-score due to its off-line character and to the non-renewable character of the solvents employed. A yellow classification was assigned to the sampling procedure and to the manual and miniaturized characters with 0.48 and 0.5 scores, respectively. However, the amount of waste generated together with single analyte determination provided 0.36 and 0.34 point-scores, being orange coloured in these items of the evaluation. A green character in the other areas evaluated allowed a green-coloured assignment, spanning a point-score range between 0.8 and 1.
Conclusions
The procedure developed for the determination of cocaine camouflaged in different types of solid samples, based on an ultrasound probe-assisted extraction followed by DF-ATR-MIR analysis offers a fast, simple, and efficient way, of reaching detection limits of 1.6 μg g−1. The total time required was less than 5 minutes and recovery values were 80 to 105% for the concentration levels 5.5 to 91.0 mg g−1. The green evaluation of the method provided scores of 95.4 and 0.62 by using the Green Certificate37 and the AGREE evaluation tool.38 Compared with the use of GC-MS, infrared instruments are simpler, with low maintenance, and do not require a dilution of the organic extract, thus reducing the organic solvent consumption.Data availability
Data and materials are available from the authors at reasonable request.Author contributions
Conceptualization, methodology, validation, investigation, writing – original draft, review & editing: D. Gallart-Mateu, S. Garrigues, M. de la Guardia. Investigation: A. Gallardo.Conflicts of interest
The authors declare that there are no conflicts of interest.Acknowledgements
The authors gratefully acknowledge the financial support of the project PID2019-110788GB-I00 funded by MCIN/AEI/10.13039/501100011033. The authors also acknowledge the Official Valencia Drug Control Laboratory (Valencia, Spain) for providing samples.References
- United Nations Office on Drugs and Crime (UNODC), Drug Trafficking. Office on Drugs and Crime, https://www.unodc.org/unodc/en/drug-trafficking/index.html, last accessed Dec 28th, 2022 Search PubMed.
- United Nations Office on Drugs and Crime (UNODC), Recommended Methods for the Identification and Analysis of Cocaine in Seized Materials, United Nations publication, Vienna, 2012, vol. 1, pp. 7–48. https://www.unodc.org/documents/scientific/Cocaine_Manual_Rev_1.pdf, last accessed Jan 9th, 2023 Search PubMed.
- S. Armenta, M. de la Guardia, M. Alcalà and M. Blanco, Anal. Chem., 2013, 85(23), 11382–11390, DOI:10.1021/ac4023583.
- United Nations Office on Drugs and Crime (UNODC), World Drug Report 2022: Drug Market Trends of Cocaine, Amphetamine-Type Stimulants and New Psychoactive Substances, Office on Drugs and Crime, New York, 2023, https://www.unodc.org/unodc/en/data-and-analysis/world-drug-report-2022.html, last accesed Jan 9th, 2023 Search PubMed.
- European Monitoring Centre for Drugs and Drug Addiction and Europol, EU Drug Market: Cocaine — In-depth Analysis, Lisbon, Portugal, 2022. https://www.emcdda.europa.eu/publications/eu-drug-markets/cocaine_en, last accesed Jan 9th, 2023 Search PubMed.
- T. S. Grobério, J. J. Zacca, É. D. Botelho, M. Talhavini and J. W. B. Braga, Forensic Sci. Int., 2015, 257, 297–306, DOI:10.1016/j.forsciint.2015.09.012.
- N. V. S. Rodrigues, E. M. Cardoso, M. V. O. Andrade, C. L. Donnici and M. M. Sena, J. Braz. Chem. Soc., 2013, 24(3), 507–517, DOI:10.5935/0103-5053.20130066.
- A. D. Burnett, H. G. M. Edwards, M. D. Hargreaves, T. Munshi and K. Page, Drug Test. Anal., 2011, 3(9), 539–543, DOI:10.1002/dta.169.
- E. M. A. Ali and H. G. M. Edwards, J. Raman Spectrosc., 2014, 45, 253–258, DOI:10.1002/jrs.4444.
- L. Xiao, R. Alder, M. Mehta, N. Krayem, B. Cavasinni, S. Laracy, S. Cameron and S. Fu, J. Forensic Sci., 2015, 60(1), 171–178, DOI:10.1111/1556-4029.12666.
- M. J. Binette and P. Pilon, Microgram J., 2013, 10(1), 8–11 Search PubMed . https://www.dea.gov/sites/default/files/pr/microgram-journals/2013/mj10-1_8-11.pdf.
- S. Klemenc and T. Gostic, Forensic Sci. Int., 2007, 169, 210–219, DOI:10.1016/j.forsciint.2006.02.048.
- C. Pérez-Alfonso, N. Galipienso, S. Garrigues and M. de la Guardia, Microchem. J., 2018, 143, 110–117, DOI:10.1016/j.microc.2018.07.026.
- C. P. Krebs, M. T. Costelloe and D. Jenks, Int. J. Drug Policy, 2000, 11(5), 351–356, DOI:10.1016/S0955-3959(00)00052-9.
- C. A. Molina-Naranjo, Cultura y Droga, 2007, vol. 12, 14, pp. 59–69. https://revistasojs.ucaldas.edu.co/index.php/culturaydroga/article/view/5490 Search PubMed.
- Y. Tsumura, T. Mitome and S. Kimoto, Forensic Sci. Int., 2005, 155(2–3), 158–164, DOI:10.1016/j.forsciint.2004.11.011.
- T. Laussmann, I. Grzesiak, A. Krest, K. Stirnat, S. Meier-Giebing, U. Ruschewitz and A. Klein, Drug Test. Anal., 2015, 7(1), 56–64, DOI:10.1002/dta.1658.
- United States Drug Enforcement Administration, DEA National Drug Threat Assessment 2018 Report, 2018, https://www.dea.gov/sites/default/files/2018-11/DIR-032-182018NDTAfinallowresolution.pdf, last accesed 7th Dec 2022 Search PubMed.
- European Monitoring Centre for Drugs and Drug Addiction (EMCDDA), Coca and Cocaine Production, Lisbon (Portugal), 2022, https://www.emcdda.europa.eu/publications/eu-drug-markets/cocaine/production_en, last accesed 7th Dec 2022 Search PubMed.
- C. Pérez-Alfonso, N. Galipienso, S. Garrigues and M. de la Guardia, Forensic Sci. Int., 2014, 237, 70–77, DOI:10.1016/j.forsciint.2014.01.015.
- G. M. Merone, A. Tartaglia, S. Rossi, F. Santavenere, E. Bassotti, C. D'Ovidio, M. Bonelli, E. Rosato, U. de Grazia, M. Locatelli and F. Savini, Anal. Chem., 2021, 93(49), 16308–16313, DOI:10.1021/acs.analchem.1c03310.
- C. A. F. O. Penido, M. T. T. Pacheco, R. A. Zângaro and L. Silveira, J. Forensic Sci., 2015, 60(1), 171–178, DOI:10.1111/1556-4029.12666.
- C. A. F. D. O. Penido, L. Silveira and M. T. T. Pacheco, Instrum. Sci. Technol., 2012, 40(5), 441–456, DOI:10.1080/10739149.2012.686356.
- E. M. A. Ali, H. G. M. Edwards, D. M. Hargreaves and I. J. Scowen, Anal. Chim. Acta, 2008, 615(1), 63–72, DOI:10.1016/j.aca.2008.03.051.
- J. S. Day, H. G. M. Edwards, S. A. Dobrowski and A. M. Voice, Spectrochim. Acta, Part A, 2004, 60(8–9), 1725–1730, DOI:10.1016/j.saa.2003.09.013.
- J. Moros, N. Galipienso, R. Vilches, S. Garrigues and M. de la Guardia, Anal. Chem., 2008, 80(19), 7257–7265, DOI:10.1021/ac800781c.
- R. F. Kranenburg, H. J. Ramaker and A. C. van Asten, Drug Test. Anal., 2022, 14(10), 1762–1772, DOI:10.1002/dta.3356.
- P. H. R. Ng, S. Walker, M. Tahtouh and B. Reedy, Anal. Bioanal. Chem., 2009, 394(8), 2039–2048, DOI:10.1007/s00216-009-2806-9.
- D. Wielbo and I. R. Tebbett, J. Forensic Sci. Soc., 1993, 33(1), 25–32, DOI:10.1016/S0015-7368(93)72945-X.
- D. Mainali and J. Seelenbinder, Appl. Spectrosc., 2016, 70(5), 916–922, DOI:10.1177/0003702816638305.
- S. Materazzi, A. Gregori, L. Ripani, A. Apriceno and R. Risoluti, Talanta, 2017, 166, 328–335, DOI:10.1016/j.talanta.2017.01.045.
- M. Ravreby, Forensic Sci. Int., 1987, 32, 20–37 CAS.
- D. Kochenborger-John, K. dos Santos-Souza and M. Flôres-Ferrão, Forensic Sci. Int., 2023, 342, 111540, DOI:10.1016/j.forsciint.2022.111540.
- C. A. F. de Oliveira Penido, M. T. T. Pacheco, E. H. Novotny, I. K. Lednev and L. Silveira, J. Raman Spectrosc., 2017, 48, 1732–1743, DOI:10.1002/jrs.5231.
- T. S. Grobério, J. J. Zacca, É. D. Botelho, M. Talhavini and J. W. B. B. Braga, Forensic Sci. Int., 2015, 257, 297–306, DOI:10.1016/j.forsciint.2015.09.012.
- P. T. Anastas and M. M. Kirchhoff, Acc. Chem. Res., 2002, 35, 686–694, DOI:10.1021/ar010065m.
- A. Galuszka, Z. Migaszewski and J. Namiesnik, TrAC, Trends Anal. Chem., 2013, 50, 78–84, DOI:10.1016/j.trac.2013.04.010.
- P. T. Anastas and N. Eghbali, Chem. Soc. Rev., 2009, 39, 301–312, 10.1039/B918763B.
- S. Armenta, S. Garrigues and M. de la Guardia, TrAC, Trends Anal. Chem., 2008, 27, 497–511, DOI:10.1016/j.trac.2008.05.003.
- J. A. Plotka-Wasylka, Talanta, 2018, 181, 204–209, DOI:10.1016/j.talanta.2018.01.013.
- S. Armenta, M. de la Guardia and J. Namiesnik, Green Microextraction in Analytical Microextraction Techniques, ed. M. Valcarcel, Bentham Science, 2015, ebook, ISBN: 978-1-68108-379-7 Search PubMed.
- F. Pena-Pereira, W. Wojnowski and M. Tobiszewski, Anal. Chem., 2020, 92, 10076–10082, DOI:10.1021/acs.analchem.0c01887.
- W. Wojnowski, M. Tobiszewski, F. Pena-Pereira and E. Psillakis, Trends Anal. Chem., 2022, 149, 116553, DOI:10.1016/j.trac.2022.116553.
- M. Sajid and J. Plotka-Wasylka, Talanta, 2022, 238, 123046, DOI:10.1016/j.talanta.2021.123046.
- I. Lavilla and C. Bendicho, Fundamentals of Ultrasound-Assisted Extraction, ed. H. Dominguez-González, Elsevier Inc., 2017. ISSBN: 978-0-12-809380-1, DOI:10.1016/B978-0-12-809380-1.00011-5.
- P. T. Anastas and J. C. Warner, Green Chemistry: Theory and Practice, Oxford, England, 1998. ISBN: 9780198506980 Search PubMed.
- United Nations Office on Drugs and Crime (UNODC), Guidance for the Validation of Analytical Methodology and Calibration of Equipment used for Testing of Illicit Drugs in Seized Materials and Biological Specimens, https://www.unodc.org/documents/scientific/validation_E.pdf, last accessed on March 6th, 2023 Search PubMed.
- D. L. Massart, B. G. Vandeginste, L. C. M. Buydens, P. J. Lewi, J. Smeyers-Verbeke, and S. de Jong, Handbook of Chemometrics and Qualimetricss: Part A, Elsevier science Inc., New York, USA, 1997. ISBN:978-0-444-89724-4 Search PubMed.
- S. Sagrado, E. Bonet, M. J. Medina, and Y. Martín, Manual práctico de calidad en los laboratorios: Enfoque ISO 17025, AENOR ediciones, Madrid, Spain, 2nd edn, 2005, ISBN: 9788481434156 Search PubMed.
Footnote |
| † Electronic supplementary information (ESI) available. See DOI: https://doi.org/10.1039/d3ay00113j |
| This journal is © The Royal Society of Chemistry 2023 |