
 Open Access Article
 This Open Access Article is licensed under a
 Creative Commons Attribution 3.0 Unported Licence
Perovskite device efficiency is a poor predictor for the number of citations a paper will get†
Ayman
Maqsood
 and
T. Jesper
Jacobsson
*
and
T. Jesper
Jacobsson
*
Institute of Photoelectronic Thin Film Devices and Technology, Key Laboratory of Photoelectronic Thin Film Devices and Technology of Tianjin, College of Electronic Information and Optical Engineering, Nankai University, Tianjin 300350, China. E-mail: jacobsson.jesper.work@gmail.com
First published on 2nd November 2022
Abstract
One of the most common metrics of success for a perovskite solar cell is the device efficiency. Other metrics, like long-term stability and price, are also vital for commercialisation, but it is the increase in device efficiencies that has given the halide perovskites their place in the spotlight. From an academic perspective, another important metric is a paper's number of citations. That may be a flawed measure of a paper's importance but, for better or worse, it is used as a key indicator in evaluations and is thus of in-universe academic importance. A recurrent theme in perovskite research has been a race towards higher solar cell efficiency, and a common sentiment has been that efficiencies must be high for the work to be taken seriously and for it to attract citations. This paper looks closer at that assumption by analysing citation data, as a comparative measure of success, with respect to device efficiencies extracted from the Perovskite Database Project. An analysis of 7330 papers reporting original device data shows that except for papers that report record, or close to record, PCE-values, the device efficiency has little effect on the number of citations. Except for top papers, the device efficiency has close to zero predictive power with respect to the number of citations. The PCE-values are also only weakly linked to the journal impact factor. The device experimentalist can thus rest assured that unless top class efficiencies are near, the perovskite community will, on average, see beyond the device efficiencies and recognise the work for its other qualities. An increased focus on the core message may thus be more valuable with a better impact payoff than an intense optimisation endeavour increasing the efficiency with one or two more percent units.
Introduction
Device efficiency is central for any solar cell technology. For the halide perovskites, it has increased from 3.8% in Kojima et al.'s 2009 paper1 to the 25.7% which at the time of writing is the official record notation.2–4 Other metrics, like long-term stability and price, are also vital for commercial success, but it is the increase in device efficiencies that has given the halide perovskites their place in the spotlight and propelled the community to publish over 20![[thin space (1/6-em)]](https://www.rsc.org/images/entities/char_2009.gif) 000 perovskite papers.
000 perovskite papers.
While aspects other than efficiency merits attention and scrutiny, the race for efficiency easily gets the upper hand. What is the efficiency? That is regularly the first, and sometimes the only question asked to the experimentalist. Taking this question and the attention given to each new record into account, an implication is easily hypothesised. If only your devices were a bit better, your research would be more valuable, your conclusions more well founded, and the impact of your work would greatly increase. This assumption has some merits. High efficiencies are after all central for technological success, behaviour observed in poor devices may be artifacts absent in the more relevant case of better devices, and new records do get a disproportionate amount of attention. In this paper we show that in terms of impact, this idea may not be entirely true, which is interesting as it is an idea with potentially negative side effects. Examples of the latter is the slippery slope between considering efficiencies important and considering them as the only thing of importance. A mental shift in that direction can easily result in excessive resources being devoted to labour intensive device optimisation with limited outcome in terms of increased scientific understanding. In a worst-case scenario, it may even incentives sloppy statistics, cherry picking of results, and neglect of best practices during measurements. This could ultimately result in dissemination of overinflated device metrics, reproducibility problems, and a general erosion of trust.
A data analysis from the neighbouring organic PV community indicates a systematic problem with overinflated device performance.5 There are few reasons to believe that the perovskite community would be spared from such problems; especially given documented perovskite peculiarities like JV-hysteresis,6–8 initial burn-in,9 and problems with stability.10–12 The perovskite community is by no means oblivious to those perils, and much efforts has recently been given to development of measuring protocols, both for general evaluation of emerging solar cell materials,13–15 and for perovskites specifically.16–20
In this paper, we approach the problem by taking a closer look at the idea that a project's impact primarily is derived from device efficiencies by analysing citation data. The number of citations may be a flawed measure of a paper's importance.21–23 The underlying assumption that it correlates with the insights provided is, however, not unreasonable, and for better or worse, it is a key indicator when grants, positions, and prestige are distributed. Citations are thus by construction and usage a proxy of the in-universe academic importance of a paper, even if it may differ from its non-academic significance. Citation data thus provides an entry point for analysing the impact of device efficiencies. This is here done by utilising the Perovskite Database Project24,25 which records data for most of the perovskite solar cell devices described in the literature up to early 2020, and increasingly also for more recent devices. In December 2021, the database contained measured device efficiency for over 42000 devices, described in 7330 papers. The highest efficiency for each paper has been filtered out, and the corresponding citation data has been downloaded from Crossref.org on 2022-03-06.
Results
The development of efficiencies has been fast, and not only the highest but also the average efficiencies have increased (Fig. 1a and b). What a few years ago was state-of-the-art is today no more than decent mediocrity. Another important effect is that citations accumulate with time. To enable a reasonable comparison between papers, both with respect to efficiency and number of citations, the data has therefore been binned in the time dimension, and publications from each calendar year are analysed separately.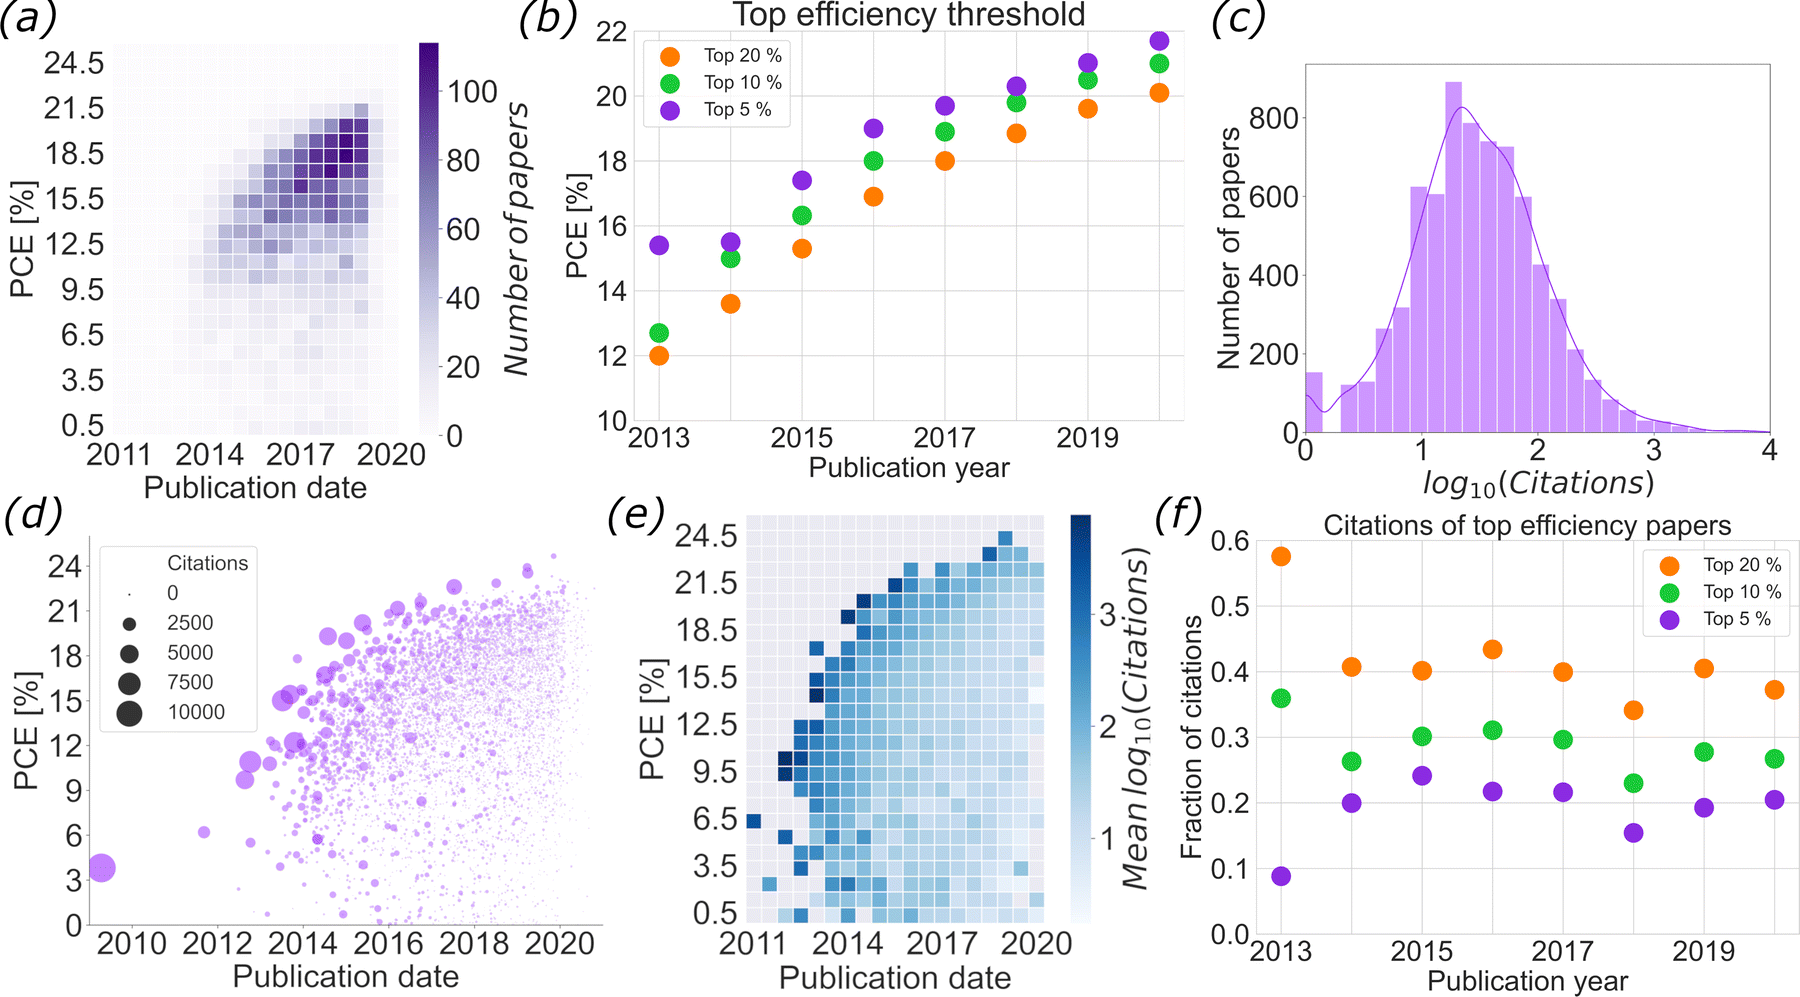 | ||
| Fig. 1 (a) Heatmap of the top device efficiency in papers vs. publication year. (b) Efficiency thresholds vs. publication year. I.e., the device efficiency required to belong to the 20, 10, or 5% of the papers that reports the highest device performance. (c) Distribution of citations per paper for the entire dataset. For data separated per year, see ESI.† To prevent undefined log-values, 1 has been added to papers with zero citations. (d) Highest reported PCE per paper vs. publication year with the number of citations given as point size. (e) The data in (d) averaged out into a heatmap. (f) The fraction of the citations attracted by the top papers. | ||
A few papers have gained the status of breakthrough papers and get a disproportionate number of citations. Not surprisingly, the papers with the highest efficiency at any given time tend to be among those (Fig. 1d and e). A record is, after all, state-of-the-art per default. It is, however, far from a winner takes all situation, and the number of citations per paper approximately follows a log-normal distribution with respect to device efficiency, both for the complete dataset and for data separated by year, (Fig. 1c and ESI†). This means that the top 5% papers, with respect to device efficiency, attract around 20% of the total number of citations, Fig. 1f.
What may be more interesting than the attention given to top papers is how the citations are distributed between the remaining papers. To address this, the papers have been sorted in order of their highest device efficiencies, and the cumulative citation count has been computed and divided with the total number of citations. This is illustrated for papers published in 2019 in Fig. 2a, where also the corresponding device efficiencies are given. The cumulative citation density takes the form of a straight line for papers with lower device efficiencies and bends upwards at the highest efficiencies. The upwards bend mirrors that the top papers attract a disproportionate number of citations. What may be surprising is how straight and smooth the part for lower efficiency papers is, and how far it stretches.
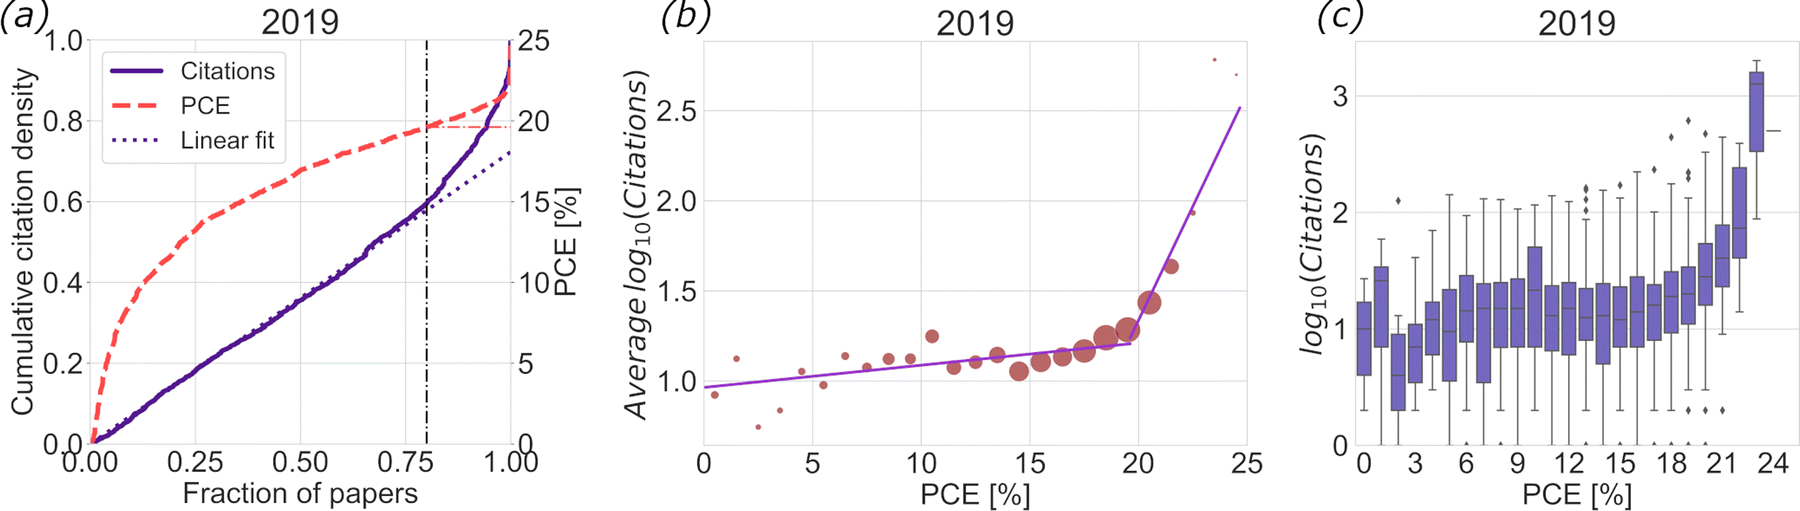 | ||
| Fig. 2 (a) Papers are ordered with respect to the efficiency of the best device reported in them. The cumulative density of citations (i.e., the cumulative sum divided by the total number of citations) is plotted with respect to paper number (divided by the total number of papers to get a scale between 0 and 1). A straight line is fitted to the data between 0 and 0.8. The corresponding device efficiency is given as a red dashed line. (b) Average of the logarithm of the citations vs. PCE. The PCE data has been binned in 0.5% intervals, and the size of the dots corresponds to the number of papers with that efficiency. Straight lines have been fitted to the data for the top 20% and bottom 80% of all papers. The analysis is done for papers published in 2019. Corresponding data for 2013–2020 is given in the ESI.† (c) The same data as in (b) but given in the form of a box plot which illustrates the spread of the data. | ||
This shows that for papers not competing in the higher echelons of device efficiencies, the PCE has little impact on the average number of citations. That holds true also for the small fraction of papers reporting very modest efficiencies, possibly because they focus on non-device related aspects.
There is no clear-cut boundary, but at around 80%, in terms of the number of papers sorted after device efficiency, the efficiency begins to have a more positive impact on the average number of citations. I.e., for any given year, only the papers among the top 20% will on average see a clear positive impact on the number of citations due to high device performance. The absolute PCE value for this threshold increases from year to year (Fig. 1e).
To analyse this further, the PCE values have been binned, and the average of the logarithm of the number of citations for the papers in each bin have been plotted with respect to PCE (Fig. 2b). In this representation we see a small increase in the number of citations when the PCE increases for the bottom 80% of the papers. A linear regression to that part of the data gives a positive slope of 1.04. One extra percent unit of reported efficiency thus on average leads to approximately 4% more citations (from 2014 and forward). If a line instead is fitted to the remaining top 20% papers, the sloop is 1.65.
The spread in the citation data with respect to device efficiency is, however, large (Fig. 2c). The predictive power of the linear regression is thus low. For the bottom 80% papers, the R2-value is only 0.02 (after 2013). There is thus essentially no statistically significant correlation between device efficiency and the number of citations for those papers. For the top 20% papers, the R2-value is higher (0.18), but the device efficiency still only explains a minority of the variance in the number of citations.
The analysis has been done for each year between 2013 and 2020 (Table 1 and ESI†). Slight variations in the details are seen between the years, but the overall trends are surprisingly consistent given that they are based on experimental citation data.
| Bottom 80% of papers | Top 20% of papers | ||||||||
|---|---|---|---|---|---|---|---|---|---|
| Year | PCEcutoff | dlog(C)/dx |
dC/dx | MEA | R2 | dlog(C)/dx |
dC/dx | MEA | R2 |
| 2013 | 12.0 | 0.08 | 1.20 | 0.41 | 0.15 | 0.01 | 1.01 | 0.34 | 0.00 |
| 2014 | 13.6 | 0.03 | 1.07 | 0.34 | 0.04 | 0.23 | 1.68 | 0.39 | 0.22 |
| 2015 | 15.3 | 0.02 | 1.05 | 0.36 | 0.02 | 0.20 | 1.57 | 0.37 | 0.19 |
| 2016 | 16.9 | 0.02 | 1.03 | 0.37 | 0.01 | 0.17 | 1.47 | 0.34 | 0.16 |
| 2017 | 18.0 | 0.01 | 1.03 | 0.37 | 0.01 | 0.20 | 1.60 | 0.32 | 0.17 |
| 2018 | 18.9 | 0.01 | 1.02 | 0.39 | 0.01 | 0.21 | 1.64 | 0.33 | 0.13 |
| 2019 | 19.6 | 0.01 | 1.03 | 0.36 | 0.02 | 0.25 | 1.79 | 0.35 | 0.15 |
| 2020 | 20.1 | 0.02 | 1.04 | 0.37 | 0.03 | 0.25 | 1.76 | 0.27 | 0.25 |
Another measure of a paper's significance is the journal impact factor. Given that a small fraction of papers stands for a disproportionate amount of all citations, the impact factor is a dubious measure of a single paper's merits. This is universally known, yet widely ignored, and in some countries, it remains a key performance measure in academic evaluations.
In the dataset, there are 335 journals represented. Many of them only feature one or two perovskite articles and 80% of all papers are found in 44 journals. 95% of papers are found in 120 journals (ESI†). Not surprisingly, also for perovskite papers the average number of citations correlates with the journal impact factor (Fig. 3a). The journals with highest impact factors not only get the most citations, but also feature reasonable high average device efficiencies (Fig. 3b). While breaking down the data on a year-by-year basis, the journal impact factor clearly correlates with the number of citations (Fig. 3c and ESI†). It also correlates with device efficiency over the entire range of journal impact factors (Fig. 3d and ESI†). The later correlation is not particularly strong. A linear fit of the PCE vs. impact factor shows an average R2-value of 0.11 (ESI†). It is, however, stronger than the correlation between PCE and the number of citations. This is curious as a higher PCE is correlated to a higher impact factor, which is correlated to more citations, but the PCE has as discussed above almost no correlation to the number of citations except for the best devices. It is difficult to entangle all possible reasons behind this observation. While speculative, one interpretation is that the idea that a paper's merits are based on its reported PCE-values is more strongly expressed in the review process than in the subsequent considerations that lead to the paper being cited. The top journals, e.g., Nature, Science, and a few more, are outliers. They tend to feature new records and larger breakthroughs and will score high in both reported PCE-values and citations frequency. For the remaining journals, the PCE-values seems to be one factor playing a role in the sorting that is a part of the review process where authors chaise the most prestigious journal possible for their manuscripts while reviewers judge their merits. Once published, most papers do, however, appear to be cited based on reasons extending beyond PCE-values, and those reasons appear to be correlated with the chance the manuscripts have of getting accepted by a more prestigious journal. This would imply that the perovskite community may judge the importance of high PCE-values differently while reviewing papers than while acting in the capacity of authors citing papers.
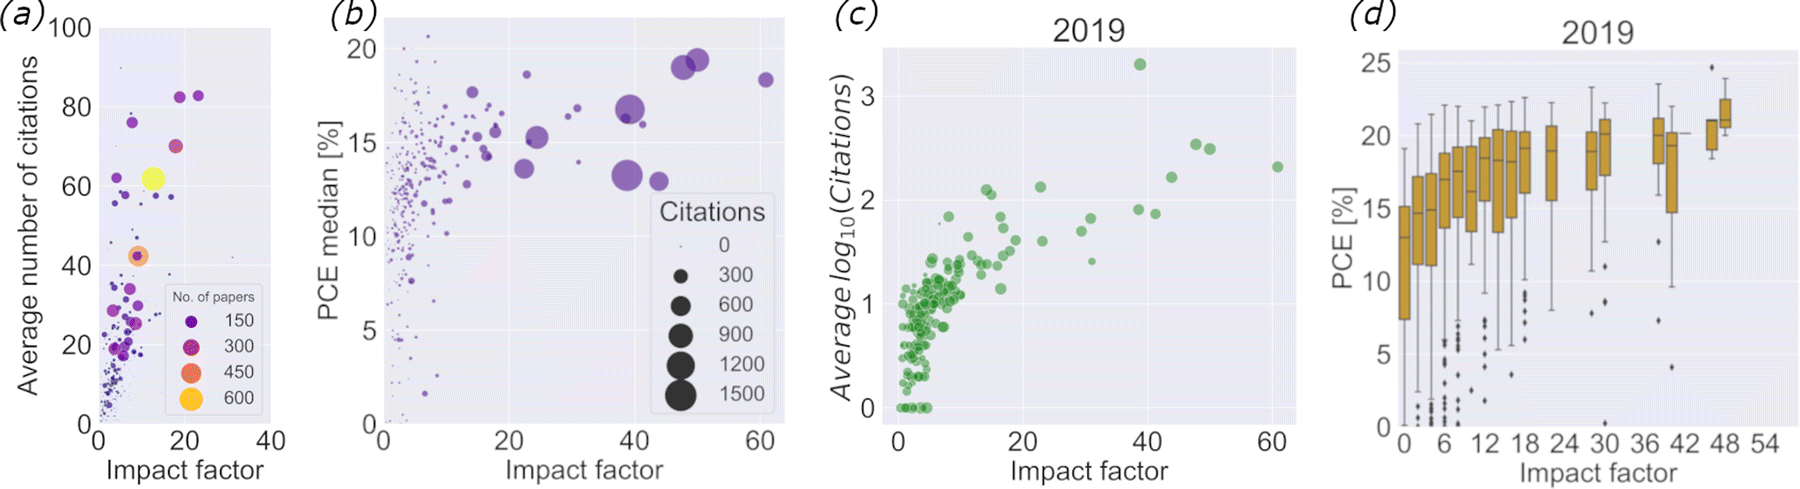 | ||
| Fig. 3 (a) Average number of citations vs. journal impact factor for journals with perovskite papers. Each circle corresponds to one journal, and the size of the circles corresponds to the number of perovskite papers. (b) Median top-PCE vs. journal impact factor for the complete dataset. Each circle corresponds to one journal and the size of the circles corresponds to the median of the citations for all perovskite papers in that journal. (c) Average of the logarithm of the number of citations per journal vs. journal impact factor for all papers published in 2019. (d) A boxplot of device efficiency binned in 0.5% intervals vs. journal impact factor for all papers published in 2019. Complementary figures are found in the ESI.† | ||
Conclusions
To the extent that the number of citations reflects a paper's academic significance, analysis of citation data here shows that except for papers that report record, or close to record, PCE-values, the device efficiency has little effect on the number of citations the paper will accumulate. Device efficiencies are by no means unimportant. In the higher echelons of the efficiency race it certainly matters. A state-of-the-art device efficiency could provide higher credibility to the rest of the paper and increase its chance of being considered a breakthrough paper, and a new record is essentially a guaranteed route to citations in abundance. Most papers are, however, not able to compete in that league. For those papers, the device efficiency turns out to play a smaller part as other factors will determine their impact. The perovskite community thus manage to value those papers based on merits beyond device efficiency. At least on average. This goes against the popular belief that a paper will not be taken seriously unless it reports high device efficiencies. We do, however, find some positive correlation between PCE values and journal impact factor, where the latter not surprisingly correlates with more citations. Once published, most papers do, however, appear to be cited based on reasons extending beyond PCE-values. A take home message for the device experimentalist and reviewers would thus be that unless top class efficiencies are within reach, an intense optimisation endeavour to reach one extra percent unit of absolute efficiency is unlikely to pay off in terms of more citations. That time may thus be better spent on the part of the work that truly provides new insight.Data acquisition
Data for perovskite devices are downloaded from the Perovskite Database Project.24,25 That dataset contains data for most perovskite solar cell described in the literature up to early 2020. In December 2021, when the data was downloaded for this analysis, the dataset contained data for 42443 devices described in 7330 papers. The highest efficiency for each paper was extracted, and the corresponding citation data was downloaded from Crossref on 2022-03-06. Journal impact factors were obtained from the InCites Journal Citation Reports from Clarivate on 2022-03-26. Impact factors missing from that dataset was manually extracted from the internet. The Bubble graph in the table of content image was generated with Rawgraphs.26
Data availability
The Perovskite Database Project was first described in Nature Energy (https://doi.org/10.1038/s41560-021-00941-3). The associated resources, like the full dataset, can be reach from the project's webpage https://www.perovskitedatabase.com. A copy of the data used in this analysis is available in the Github repository associated to this paper.Code availability
The code base and the dataset for the analysis and the figures presented in this paper are made available at Github. https://github.com/Jesperkemist/PCE-vs-citations. This includes two Jupiter notebooks that reproduce the figures and data analysis.Author contributions
T. J. J. has been responsible for conceptualization, project administration, and writing. T. J. J. and A. M. have jointly worked on data curation, formal analysis, visualization, writing the original draft, and reviewing the final manuscript.Conflicts of interest
The authors declare no competing financial interest.Acknowledgements
The authors are thankful for support from the Ministry of Science and Technology in China via the National Key Research and Development Program of China (Grant No. 2021YFF0500501).References
- A. Kojima, K. Teshima, Y. Shirai and T. Miyasaka, Organometal Halide Perovskites as Visible-Light Sensitizers for Photovoltaic Cells, J. Am. Chem. Soc., 2009, 131(17), 6050–6051, DOI:10.1021/ja809598r.
- M. A. Green, E. D. Dunlop, J. Hohl-Ebinger, M. Yoshita, N. Kopidakis and X. Hao, Solar Cell Efficiency Tables (Version 58), Prog. Photovoltaics Res. Appl., 2021, 29(7), 657–667, DOI:10.1002/pip.3444.
- H. Min, D. Y. Lee, J. Kim, G. Kim, K. S. Lee, J. Kim, M. J. Paik, Y. K. Kim, K. S. Kim, M. G. Kim, T. J. Shin and S. Il Seok, Perovskite Solar Cells with Atomically Coherent Interlayers on SnO2 Electrodes, Nature, 2021, 598(7881), 444–450, DOI:10.1038/s41586-021-03964-8.
- NREL Efficiency Chart https://www.nrel.gov/pv/assets/pdfs/cell-pv-eff-emergingpv-rev211214.pdf.
- E. Zimmermann, P. Ehrenreich, T. Pfadler, J. A. Dorman, J. Weickert and L. Schmidt-Mende, Erroneous Efficiency Reports Harm Organic Solar Cell Research, Nat. Photonics, 2014, 8(9), 669–672, DOI:10.1038/nphoton.2014.210.
- F. Wu, R. Pathak and Q. Qiao, Origin and Alleviation of J–V Hysteresis in Perovskite Solar Cells: A Short Review, Catal. Today, 2021, 374, 86–101, DOI:10.1016/j.cattod.2020.12.025.
- W. Tress, N. Marinova, T. Moehl, S. M. Zakeeruddin, M. K. Nazeeruddin and M. Grätzel, Understanding the Rate-Dependent J-V Hysteresis, Slow Time Component, and Aging in CH3NH3PbI3 Perovskite Solar Cells: The Role of a Compensated Electric Field, Energy Environ. Sci., 2015, 8(3), 995–1004, 10.1039/c4ee03664f.
- H. J. Snaith, A. Abate, J. M. Ball, G. E. Eperon, T. Leijtens, N. K. Noel, S. D. Stranks, J. T. W. Wang, K. Wojciechowski and W. Zhang, Anomalous Hysteresis in Perovskite Solar Cells, J. Phys. Chem. Lett., 2014, 5(9), 1511–1515, DOI:10.1021/jz500113x.
- K. Domanski, E. A. Alharbi, A. Hagfeldt, M. Grätzel and W. Tress, Systematic Investigation of the Impact of Operation Conditions on the Degradation Behaviour of Perovskite Solar Cells, Nat. Energy, 2018, 3(1), 61–67, DOI:10.1038/s41560-017-0060-5.
- D. Wang, M. Wright, N. K. Elumalai and A. Uddin, Stability of Perovskite Solar Cells, Sol. Energy Mater. Sol. Cells, 2016, 147, 255–275, DOI:10.1016/j.solmat.2015.12.025.
- J. P. Correa-Baena, M. Saliba, T. Buonassisi, M. Grätzel, A. Abate, W. Tress and A. Hagfeldt, Promises and Challenges of Perovskite Solar Cells, Science, 2017, 358(6364), 739–744, DOI:10.1126/science.aam6323.
- M. K. Rao, D. N. Sangeetha, M. Selvakumar, Y. N. Sudhakar and M. G. Mahesha, Review on Persistent Challenges of Perovskite Solar Cells’ Stability, Sol. Energy, 2021, 218, 469–491, DOI:10.1016/j.solener.2021.03.005.
- H. J. Snaith, The Perils of Solar Cell Efficiency Measurements, Nat. Photonics, 2012, 6(6), 337–340, DOI:10.1038/nphoton.2012.119.
- H. J. Snaith, How Should You Measure Your Excitonic Solar Cells?, Energy Environ. Sci., 2012, 5(4), 6513–6520, 10.1039/c2ee03429h.
- A. Cravino, P. Schilinsky and C. J. Brabec, Characterization of Organic Solar Cells: The Importance of Device Layout, Adv. Funct. Mater., 2007, 17(18), 3906–3910, DOI:10.1002/adfm.200700295.
- E. Zimmermann, K. K. Wong, M. Müller, H. Hu, P. Ehrenreich, M. Kohlstädt, U. Würfel, S. Mastroianni, G. Mathiazhagan, A. Hinsch, T. P. Gujar, M. Thelakkat, T. Pfadler and L. Schmidt-Mende, Characterization of Perovskite Solar Cells: Towards a Reliable Measurement Protocol, APL Mater., 2016, 4(9), 091901, DOI:10.1063/1.4960759.
- M. V. Khenkin, E. A. Katz, A. Abate, G. Bardizza, J. J. Berry, C. Brabec, F. Brunetti, V. Bulović, Q. Burlingame, A. Di Carlo, R. Cheacharoen, Y. B. Cheng, A. Colsmann, S. Cros, K. Domanski, M. Dusza, C. J. Fell, S. R. Forrest, Y. Galagan, D. Di Girolamo, M. Grätzel, A. Hagfeldt, E. von Hauff, H. Hoppe, J. Kettle, H. Köbler, M. S. Leite, S. (Frank) Liu, Y. L. Loo, J. M. Luther, C. Q. Ma, M. Madsen, M. Manceau, M. Matheron, M. McGehee, R. Meitzner, M. K. Nazeeruddin, A. F. Nogueira, Ç. Odabaşı, A. Osherov, N. G. Park, M. O. Reese, F. De Rossi, M. Saliba, U. S. Schubert, H. J. Snaith, S. D. Stranks, W. Tress, P. A. Troshin, V. Turkovic, S. Veenstra, I. Visoly-Fisher, A. Walsh, T. Watson, H. Xie, R. Yıldırım, S. M. Zakeeruddin, K. Zhu and M. Lira-Cantu, Consensus Statement for Stability Assessment and Reporting for Perovskite Photovoltaics Based on ISOS Procedures, Nat. Energy, 2020, 5(1), 35–49, DOI:10.1038/s41560-019-0529-5.
- E. Unger, G. Paramasivam and A. Abate, Perovskite Solar Cell Performance Assessment, J. Phys. Energy, 2020, 2(4), 044002, DOI:10.1088/2515-7655/abaec8.
- J. A. Christians, J. S. Manser and P. V. Kamat, Best Practices in Perovskite Solar Cell Efficiency Measurements. Avoiding the Error of Making Bad Cells Look Good, J. Phys. Chem. Lett., 2015, 6(5), 852–857, DOI:10.1021/acs.jpclett.5b00289.
- R. B. Dunbar, B. C. Duck, T. Moriarty, K. F. Anderson, N. W. Duffy, C. J. Fell, J. Kim, A. Ho-Baillie, D. Vak, T. Duong, Y. Wu, K. Weber, A. Pascoe, Y. B. Cheng, Q. Lin, P. L. Burn, R. Bhattacharjee, H. Wang and G. J. Wilson, How Reliable Are Efficiency Measurements of Perovskite Solar Cells? The First Inter-Comparison, between Two Accredited and Eight Non-Accredited Laboratories, J. Mater. Chem. A, 2017, 5(43), 22542–22558, 10.1039/c7ta05609e.
- G. Walter, S. Bloch, G. Hunt and K. Fisher, Counting on Citations: A Flawed Way to Measure Quality, Med. J. Aust., 2003, 178(6), 280–281, DOI:10.5694/j.1326-5377.2003.tb05196.x.
- L. Bornmann and H. D. Daniel, What Do Citation Counts Measure? A Review of Studies on Citing Behavior, J. Doc., 2008, 64(1), 45–80, DOI:10.1108/00220410810844150.
- D. W. Aksnes, L. Langfeldt and P. Wouters, Citations, Citation Indicators, and Research Quality: An Overview of Basic Concepts and Theories, SAGE Open, 2019, 9(1) DOI:10.1177/2158244019829575.
- T. J. Jacobsson, A. Hultqvist, A. García-Fernández, A. Anand, A. Al-Ashouri, A. Hagfeldt, A. Crovetto, A. Abate, A. G. Ricciardulli, A. Vijayan, A. Kulkarni, A. Y. Anderson, B. P. Darwich, B. Yang, B. L. Coles, C. A. R. Perini, C. Rehermann, D. Ramirez, D. Fairen-Jimenez, D. Di Girolamo, D. Jia, E. Avila, E. J. Juarez-Perez, F. Baumann, F. Mathies, G. S. A. González, G. Boschloo, G. Nasti, G. Paramasivam, G. Martínez-Denegri, H. Näsström, H. Michaels, H. Köbler, H. Wu, I. Benesperi, M. I. Dar, I. Bayrak Pehlivan, I. E. Gould, J. N. Vagott, J. Dagar, J. Kettle, J. Yang, J. Li, J. A. Smith, J. Pascual, J. J. Jerónimo-Rendón, J. F. Montoya, J. P. Correa-Baena, J. Qiu, J. Wang, K. Sveinbjörnsson, K. Hirselandt, K. Dey, K. Frohna, L. Mathies, L. A. Castriotta, M. H. Aldamasy, M. Vasquez-Montoya, M. A. Ruiz-Preciado, M. A. Flatken, M. V. Khenkin, M. Grischek, M. Kedia, M. Saliba, M. Anaya, M. Veldhoen, N. Arora, O. Shargaieva, O. Maus, O. S. Game, O. Yudilevich, P. Fassl, Q. Zhou, R. Betancur, R. Munir, R. Patidar, S. D. Stranks, S. Alam, S. Kar, T. Unold, T. Abzieher, T. Edvinsson, T. W. David, U. W. Paetzold, W. Zia, W. Fu, W. Zuo, V. R. F. Schröder, W. Tress, X. Zhang, Y. H. Chiang, Z. Iqbal, Z. Xie and E. Unger, An Open-Access Database and Analysis Tool for Perovskite Solar Cells Based on the FAIR Data Principles, Nat. Energy, 2022, 7(1), 107–115, DOI:10.1038/s41560-021-00941-3.
- E. Unger and T. J. Jacobsson, The Perovskite Database Project: A Perspective on Collective Data Sharing, ACS Energy Lett., 2022, 1240–1245, DOI:10.1021/acsenergylett.2c00330.
- M. Mauri, T. Elli, G. Caviglia, G. Uboldi and M. Azzi, RAWGraphs: A Visualisation Platform to Create Open Outputs, ACM Int. Conf. Proceeding Ser., 2017, Part F131371 DOI:10.1145/3125571.3125585.
Footnote |
| † Electronic supplementary information (ESI) available. See DOI: https://doi.org/10.1039/d2ya00261b |
| This journal is © The Royal Society of Chemistry 2022 |