
 Open Access Article
 This Open Access Article is licensed under a
 Creative Commons Attribution 3.0 Unported Licence
Enhanced photocatalytic activity of brown H4Nb6O17/g-C3N4 composite for visible-light driven H2O2 production†
Luona
Zhang
a,
Shiqi
Zhao
a,
Xiaorong
Cheng
b,
Zijie
Liu
a,
Ruochen
Liu
a and
Graham
Dawson
 *a
*a
aDepartment of Chemistry, Xi’an Jiaotong Liverpool University, Suzhou, Jiangsu 215123, P. R. China. E-mail: graham.dawson@xjtlu.edu.cn
bSuzhou Vocational Institute of Industrial Technology, Suzhou, Jiangsu 215104, P. R. China
First published on 3rd February 2022
Abstract
A novel form of brown H4Nb6O17 was synthesised by annealing niobate nanoscrolls at 300 °C. A composite heterojunction between this brown niobate and g-C3N4 was formed, and shown to have enhanced photocatalytic activity for the ORR and H2O2 production of 1.8 μmol after 3 hours. The formation of a heterojunction between the two components was shown to alter the chemical environment and suppress the PL signal, and a band diagram of the system is proposed based on our results.
1. Introduction
The global energy crisis has solicited a widespread decarbonization imperativeness pushing for the advancement of clean energy conversion processes. Solar-driven photocatalytic production of H2O2 has emerged as one of the most attractive solutions in the past decade. According to a large body of research, H2O2 has arisen not only as a strong oxidant for organic pollutant degradation but also as an alternative fuel cell energy carrier to hydrogen gas (H2).1,2 This solar fuel can be used in the design of advanced one-compartment cells with theoretical energy density close to that of two-compartment H2-based fuel cells, and aqueous H2O2 can be stored and transported more conveniently and safely than compressed H2.3–5 At present, commercial-scale synthesis of H2O2 involves the anthraquinone oxidation process, also called the Riedl–Pfleiderer process, which is a hazardous method with intensive consumption of energy and organic solvents.6,7 Therefore, the development of cost-effective, efficient photocatalytic routes to synthesize H2O2via the oxygen reduction reaction (ORR) is in great demand.Among semiconductor photocatalysts, niobium oxides (e.g., KNbO3, K4Nb6O17) have attracted much attention as promising candidates. K4Nb6O17 has a unique structure, consisting of stacked asymmetrical negatively-charged Nb6O174− lamellas with edge- and corner-shared NbO6 octahedra and interlayer regions occupied by the alkaline cations.8,9 In the study conducted by Zhou et al., porous K4Nb6O17 microspheres exhibit good activity for the degradation of the organic dye Rhodamine B, two times higher than that of the commercial Degussa P25 TiO2.10 Similarly, Li et al. demonstrate that nano-structuring of niobates greatly benefit the specific surface area, triggering enormous improvements to the photocatalytic activity.11 Further to this point, research work on niobate nanotubes can be still considered in its infancy, and several enhancement techniques yet remain to be tested. To this end, we investigated the impact of the annealing treatment, carried out to potentially induce useful chemo-physical alterations. We postulate that the structure of proton-exchanged H4Nb6O17 is subject to partial destruction of the tubes during the annealing treatment, which results in incorporation of the interlayer exfoliating agent within the tube interlayers. This feature bestows the resulting brown niobate with interesting optical properties. However, major constraints on its photocatalytic performance, including the inadequate solar spectrum absorption and recombination of photogenerated charge carriers, entails the necessity of additional aid from secondary species.
A wide array of synergistic strategies has been successfully applied to alter the properties of transition metal oxides, such as surface modification using organic compounds and composite construction. For instance, Liu et al. found that catechol coatings selectively generate a signal in the surface-enhanced Raman scattering of trititanate nanotubes (TiNT).12 Also, the construction of a heterojunction with secondary species has been proven to be significant to boost the solar-to-fuel conversion efficiency. In fact, mixing two components at the nanoscale provides strong interfacial interaction, improving thus the charge carrier dynamics. For example, Wu et al. and Tan et al. both report g-C3N4/TiO2 heterojunctions showing a lower recombination rate and enhanced photocatalytic activity.13,14 Recently, polymeric g-C3N4 has been extensively studied because of its versatility and metal-free 2D structure. First reported as a photocatalyst by Wang et al., it is earth-abundant, thermally stable, and can be easily fabricated from nitrogen-rich precursors (e.g. urea, thiourea, melamine and cyanamide).15,16 More importantly, it exhibits appropriate band levels for visible light absorption with a bandgap of approx. 2.7 eV. However, this material is still far from optimum given the presence of critical shortcomings: weak exciton dissociation, poor charge carrier mobility and high recombination rate.15,17 Nevertheless, combining H4Nb6O17 and g-C3N4 ensures appropriate surface contact which can greatly promote mutual charge transfer. To the best of our knowledge, few attempts have been made to modify nanostructured H4Nb6O17 by either the adsorption or intercalation of g-C3N4 in the interlayer regions.
Herein, we discuss the profound effect of the annealing treatment on pristine H4Nb6O17. Thus, a novel phase of niobate was found and characterized. Its unique absorption profile and surface bonding are particularly fascinating and, therefore, have been thoroughly investigated. Moreover, this study firstly reports a heterojunction between annealed H4Nb6O17 nanotubes and g-C3N4 with superior ORR performance under visible light irradiation. Specifically, the photocatalytic activity of the as-prepared composite was evaluated by quantifying the photogenerated H2O2 in an aqueous solution. Composite-construction provides a suitable band structure and close affiliation between the components for improving the charge separation. The charge transport pathway and a possible mechanism for the photocatalytic reduction of O2 to H2O2 over the hybrid catalyst are also proposed.
2. Experimental section
2.1 Preparation of photocatalysts
Pristine g-C3N4 was obtained via pyrolysis of urea under ambient pressure without additive assistance. The precursor urea was placed in a covered crucible and then calcinated at 550 °C for 4 h.18The precursor K4Nb6O17 was synthesized by heating a mixture of Nb2O5 and K2CO3 with a defined stoichiometric ratio of 3![[thin space (1/6-em)]](https://www.rsc.org/images/entities/char_2009.gif) :2 at 1100 °C for 24 h. The as-obtained K4Nb6O17 powder was washed with deionized water and dried at 80 °C for 3 h. K4Nb6O17 was then subject to a proton exchange process to substitute the K+ cations with protons. 1.15 g K4Nb6O17 was suspended in 30 mL 6 M HNO3 aqueous solution and stirred with a rate of 550 rpm at 60 °C for 7 days. The product H4Nb6O17 was then recovered by vacuum filtration and dried at 80 °C for 1 h.
:2 at 1100 °C for 24 h. The as-obtained K4Nb6O17 powder was washed with deionized water and dried at 80 °C for 3 h. K4Nb6O17 was then subject to a proton exchange process to substitute the K+ cations with protons. 1.15 g K4Nb6O17 was suspended in 30 mL 6 M HNO3 aqueous solution and stirred with a rate of 550 rpm at 60 °C for 7 days. The product H4Nb6O17 was then recovered by vacuum filtration and dried at 80 °C for 1 h.
Niobate nanotubes were formed by the exfoliation action of tetrabutylammonium-hydroxide (TBA-OH) and subsequent scrolling. 1 g H4Nb6O17 powder was dispersed in deionized water, and 25% TBA-OH aqueous solution was added dropwise until the pH of the suspension was adjusted to 9.5–10. The dispersion was stirred at a rate of 600 rpm at 45 °C for 3 days. Finally, 1 M HNO3 was added drop-wise to the niobate dispersion until a pH between 1 and 2 was measured. The solid sample was washed with Milli-Q water using vacuum filtration and dried at 60 °C overnight. The product was annealed at 300 °C for 4 h with a heating rate of 3 °C min−1.
The coupling process of H4Nb6O17 and g-C3N4 was based on the surface charge-induced hetero-aggregation phenomenon, in which the electrostatic attraction between the species was promoted via mechanical mixing. g-C3N4 and H4Nb6O17 were suspended in deionized water according to the ratio 0.5 mg mL−1. After being sonicated for 30 min, the niobate dispersion was transferred into a different flask, and g-C3N4 was then poured slowly under magnetic stirring at 650 rpm. The mixing continued without interruptions for 3 hours. Finally, the mixture was washed with Milli-Q water using vacuum filtration and dried in the oven at 80 °C for one hour. The process is shown schematically in Fig. 1. More information on the optimisation of the composite is given in the ESI,† Section 2.
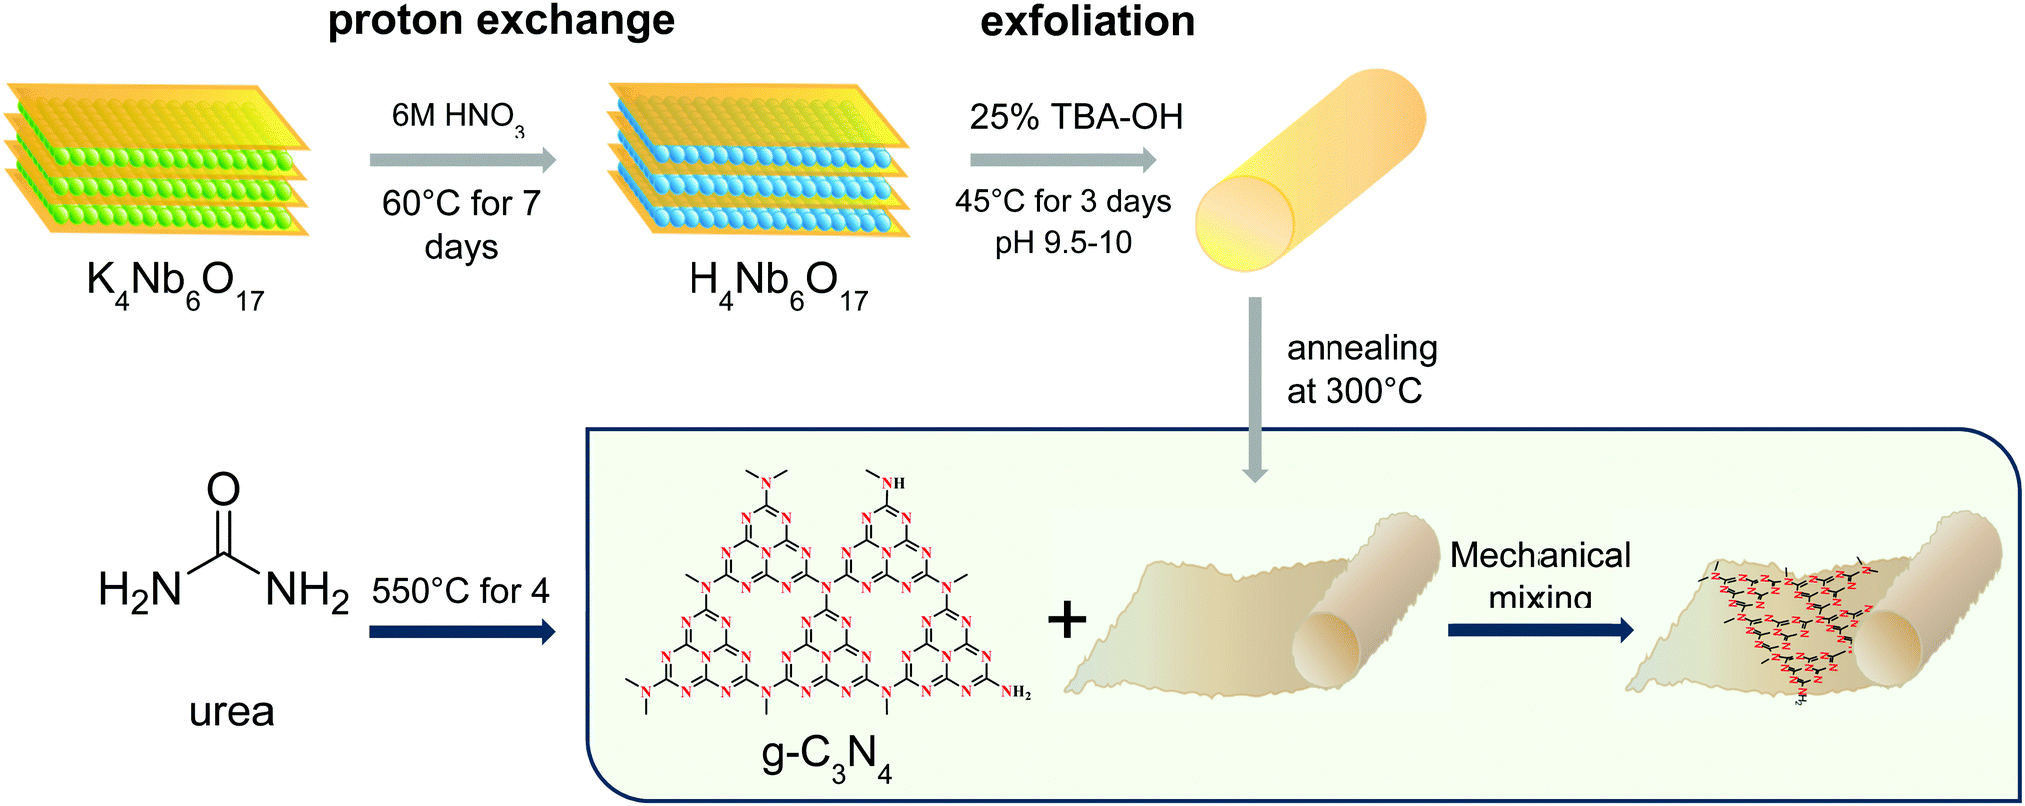 | ||
| Fig. 1 Schematic representation of the reactions involved to prepare the composite materials. | ||
2.2 Characterization
X-Ray diffraction (XRD) patterns were acquired on a Bruker D8 ADVANCE powder X-ray diffractometer with Cu-Kα radiation, operating at 40 kV and 40 mA. Transmission electron microscopy (TEM) images were collected on a FEI Tecnai G2 F20 S-TWIN TMP microscope at an acceleration voltage of 200 kV. Fourier-transform infrared spectra were acquired on a Cary 660 FTIR spectrometer from Agilent Technologies. X-Ray photoelectron spectroscopic (XPS) analysis was performed using a Thermo Scientific ESCALAB 250 XI spectrometer. UV-visible spectra were measured with an Agilent Cary 300 spectrophotometer. Photoluminescence was measured using a Horiba LabRAM HR Raman spectrometer.2.3 Photocatalytic oxygen reduction
H2O2 was synthesized via photocatalytic reduction of molecular oxygen under visible light irradiation (λ > 400 nm) using a 300 W Xe lamp with a 400 nm cutoff filter as the light source. 0.100 g of catalyst was uniformly dispersed in 100 mL of aqueous solution containing 5 vol% methanol according to a ratio of 1 g L−1. The suspension was sonicated for 10 min and transferred in a quartz photoreactor, which was connected to a circulating water system to remove the thermal effect of light. While O2 was continually bubbled through the suspension, the system was stirred in the dark for 2 hours to ensure the adsorption–desorption equilibrium among the catalyst, dissolved O2 and water. During the irradiation, the reaction temperature was kept at 20 °C. At given time intervals, 1.5 mL aliquots were collected and filtered to separate the liquid samples from the solid catalyst. The amount of H2O2 was measured by iodometric titration.3. Results and discussion
3.1 Crystallinity and morphology
The XRD patterns of the samples were used to investigate their crystalline structure. As shown in Fig. 2, the main peaks of K4Nb6O17 can be found at 4.73° and 9.41°, which match well with the (020) and (040) crystal planes of pure orthorhombic K4Nb6O17 (JCPDS, No. 76-0977 and Fig. S1, ESI†).11 As a result of the subsequent proton exchange and exfoliation treatment, the layered structure was demolished, causing the related peaks to disappear. The remaining peaks of the exfoliated H4Nb6O17 are observed at 15.74°, 22.31°, 29.25° and 31.76°, corresponding to the (060), (200), (032) and (132) crystal planes. The annealing process at 300 °C does not affect the crystalline structure of H4Nb6O17, and the same diffraction peaks were detected without distinguishable variations in the relative intensity.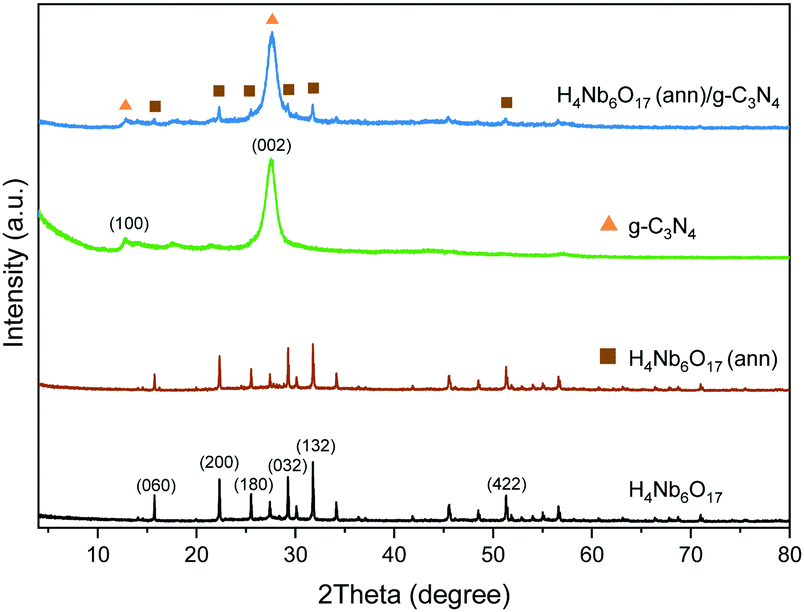 | ||
| Fig. 2 XRD patterns of the as-prepared H4Nb6O17 before and after annealing at 300 °C and g-C3N4 and their composites samples. | ||
The (100) and (002) crystal planes of g-C3N4 exhibit their characteristic peaks at 12.79° and 27.52°. The first is associated with the in-plane repeating units of the continuous heptazine framework, and the second is related to the stacking of the conjugated aromatic structure around the c-axis.19 The respective d-spacing values are equal to 0.692 nm and 0.324 nm, which are consistent with the reported lengths.16,18,19 The H4Nb6O17 (ann)/g-C3N4 composite possesses the typical peaks of both components with a clear overlapping because of the higher amount of g-C3N4.
The morphology of the photocatalysts was observed by TEM. The H4Nb6O17 nanotubes can be observed in Fig. 3a and b. The scrolled tubular structure, which results from the exfoliation and scrolling of the niobate sheets,20 incorporating the TBAO-between the layers. The annealing treatment provokes a dramatic increase in the degree of aggregation as well as a substantial degradation of the tubular structure (Fig. 3b and c, schematically in Fig. 1).
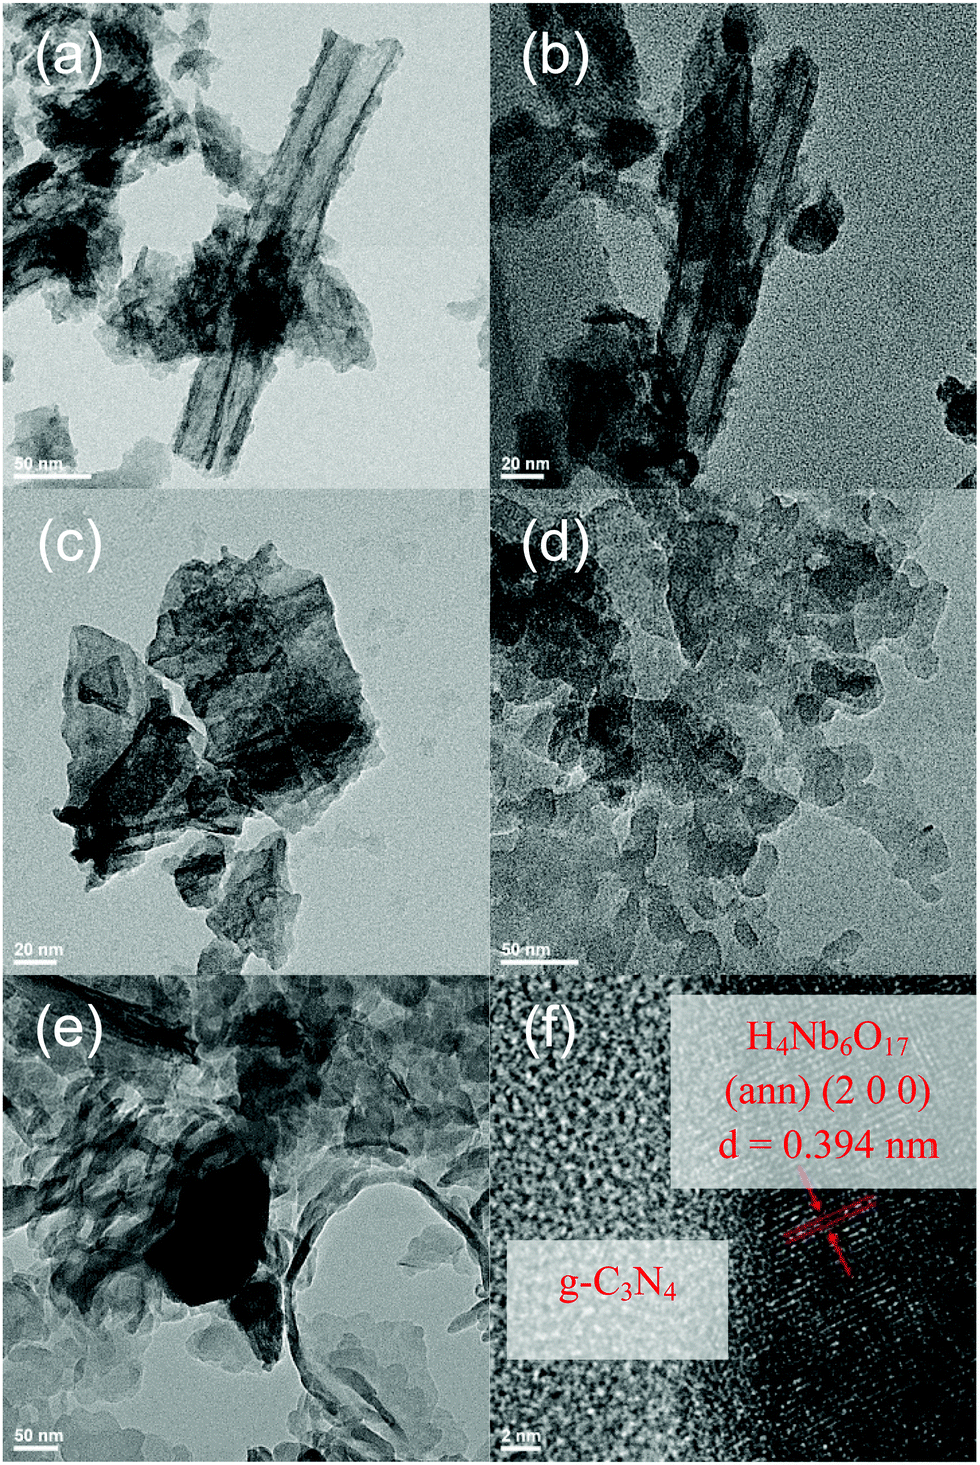 | ||
| Fig. 3 TEM images of (a and b) H4Nb6O17, (c) H4Nb6O17 (ann) and (d) g-C3N4. (e) TEM and (f) HRTEM images of the H4Nb6O17 (ann)/g-C3N4 composite. | ||
In great contrast to H4Nb6O17, untreated carbon nitride has an amorphous and irregular 3-dimensional disposition as well as a bulky structure (Fig. 3d). Moreover, the low crystallinity prevents the formation of obvious lattice fringes. These features are expected to hinder light absorption, charge transport and mass transportation. On the other hand, the observed porosity can increase the specific surface area, and more active sites might lead to greater photocatalytic activity. This is supported by the BET surface area results, shown in Fig. S2 (ESI†). The composite displays a type IV hysteresis according to the IUPAC classification with H3 type hysteresis loops for both components and composites, suggesting their mesoporous nature with aggregates of plate-like particles and irregular slit-shaped pores.
In Fig. 3e, the TEM image of the H4Nb6O17 (ann)/g-C3N4 (1:10) composite is displayed, evidencing that H4Nb6O17 nanostructures have been anchored on the surface of g-C3N4. Fig. 3f confirms the coexistence of H4Nb6O17 nanostructures and g-C3N4, and the lattice spacing of 0.394 nm is consistent with the (200) plane of H4Nb6O17 (ann). These results provide evidence of the successful formation of a heterojunction in the H4Nb6O17 (ann)/g-C3N4 composite. The electrostatic interaction between the components is indicated by the zeta potential results, shown in Fig. S3 (ESI†).
3.2 Optical absorption
The optical absorption ability of the as-prepared samples was investigated using UV-visible absorption spectra, shown in Fig. 4. H4Nb6O17 shows no absorption of visible light and holds the same absorption profile as K4Nb6O17, as reported by Tian et al.,21 with the main absorption edge at 372 nm. Meanwhile, g-C3N4 has a sharp absorption edge at 447 nm with the maximum absorption at 390 nm, in good accordance with previous reports.22,23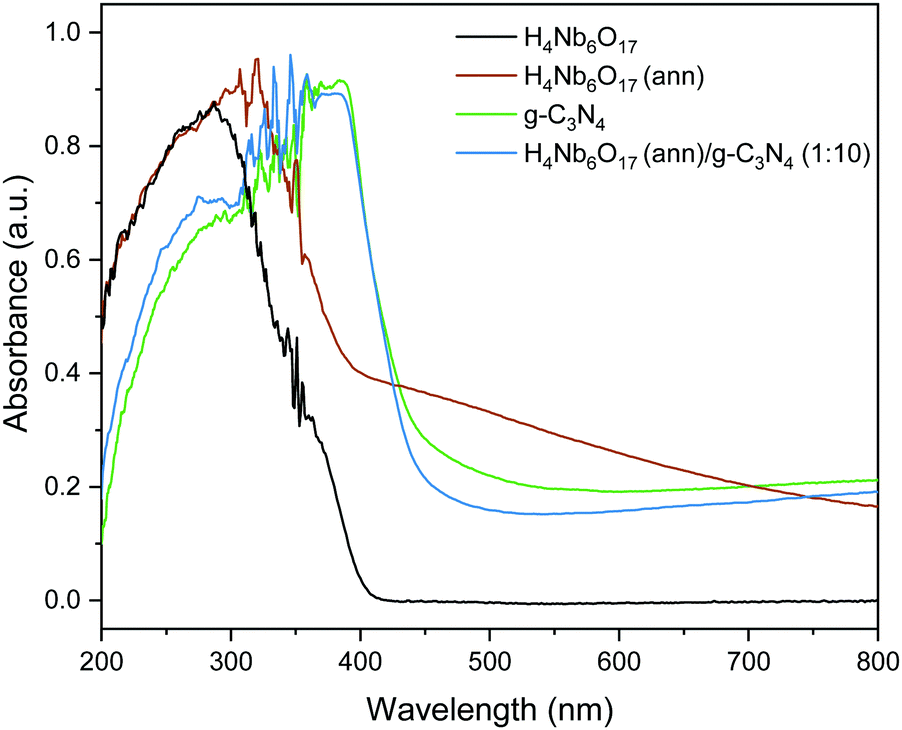 | ||
| Fig. 4 UV/vis spectra of the samples. | ||
Furthermore, it can be observed that the annealing treatment (at 300 °C) substantially impacted the absorption profile of H4Nb6O17, as hinted by the distinctive change in the powder colouring from white to brown. The peak of highest absorption exhibits a red shift, and a broad shoulder-like curve stretches through the visible-light region. This shoulder is ascribed to charge transfer between the niobate and the organic material within the tubular structure after annealing, in accordance with our previous work on organic surface modification of nanostructures.24 According to the Kubelka–Munk plots, shown in Fig. S4, (ESI†) the calculated bandgaps of g-C3N4, H4Nb6O17 and H4Nb6O17 (ann) are 2.82, 3.44 and 3.01 eV, respectively. Because of the dominating presence of g-C3N4, the absorption spectrum of the H4Nb6O17 (ann)/g-C3N4 (1:10) composite replicates the response of this component, without showing relevant differences, and a calculated band gap of 2.87 eV. The UV/vis spectra of H4Nb6O17 annealed at different temperatures is shown in Fig. S5 (ESI†).
3.3 FT-IR
The FT-IR spectra of the samples are displayed in Fig. 5. H4Nb6O17 exhibits broad bands in the range 400–1000 cm−1 due to the vibrational modes of octahedral NbO6.11 The annealed sample retains these characteristic peaks, indicating an unvaried chemical composition after the annealing process. In the g-C3N4 sample, the peaks between 1200 and 1700 cm−1 are typical absorption bands, related to the skeletal stretching of C–N heterocycles.22 Furthermore, the peak at 816 cm−1 is associated to the breathing vibrations of triazine units, and the broad band between 3000 and 3400 cm−1 is ascribed to either –NH or –OH stretching vibrations. The H4Nb6O17 (ann)/g-C3N4 (1:10) composite exhibits all the peaks as pristine g-C3N4.
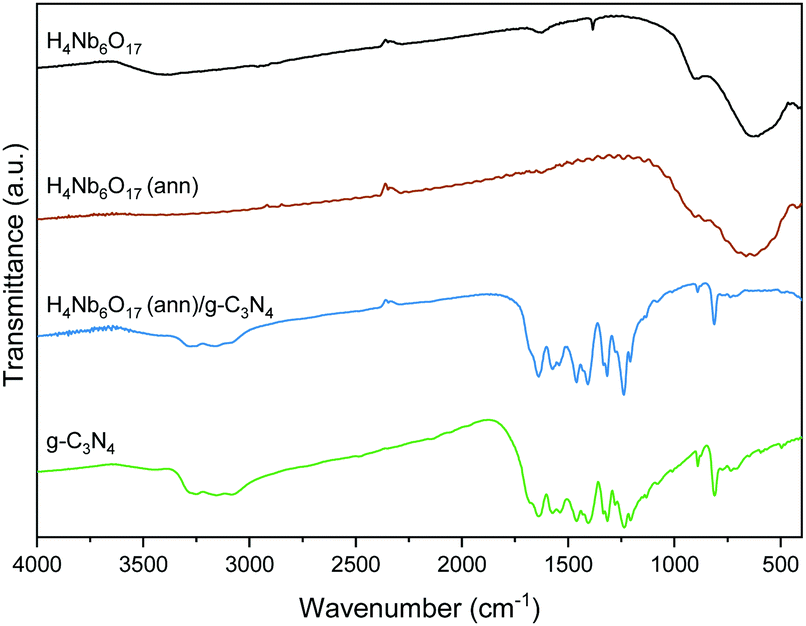 | ||
| Fig. 5 FTIR spectra of the samples. | ||
3.4 Raman
Additionally, Raman spectra were collected to further study the annealing effect on the skeletal structure of H4Nb6O17, shown in Fig. 6. Several new peaks are observed and the two main peaks in the original niobate sample are shifted. New peaks are observed at 116.5 and 254.2 cm−1, which are characterized as bending modes of NbO6 octahedral units.11 However, the strongest characteristic band located at 645 cm−1, corresponding to the stretching vibrations of the longer Nb–O bond in the NbO6 octahedral units, is blue-shifted to 619.80 cm−1.25 Moreover, the peak at 868.4 is slightly red-shifted to 890.5 cm−1 which is associated to stretching modes of the shorter Nb–O terminal group resulting from the replacement of K+ with H3O+. A new peak at 980.7 cm−1 is also observed after annealing. The three newly observed peaks are indicative of the incorporation of the organic exfoliating agent into the niobate structure.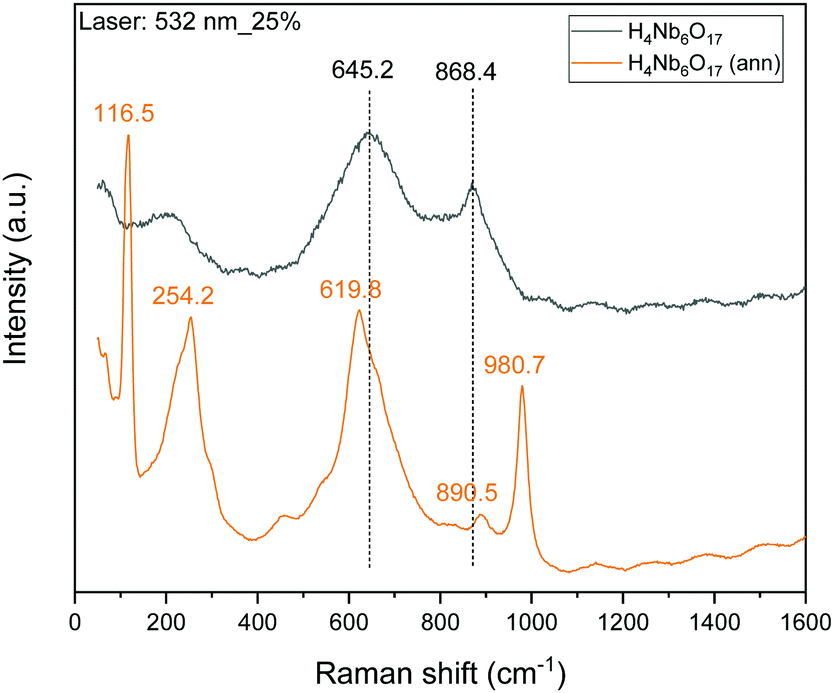 | ||
| Fig. 6 Raman spectra of H4Nb6O17 before and after annealing. | ||
3.5 XPS
A deeper study of the interaction between the species was then provided by XPS analysis to investigate the surface composition and chemical states of the as-prepared samples. Specimen charge was referenced to the C 1s peak of adventitious hydrocarbon, which is assumed to have a binding energy of 284.8 eV. As displayed in the survey spectra (Fig. 7a), H4Nb6O17 contains the elements Nb and O with a small contamination of adventitious carbon. The overall elemental composition was retained in the annealed sample. However, important differences can be observed in the high-resolution XPS measurements. Furthermore, compared to the spectrum of H4Nb6O17 (ann), the composite shows distinct signals of C 1s and N 1s due to the introduction of g-C3N4, demonstrating that the two materials were successfully coupled.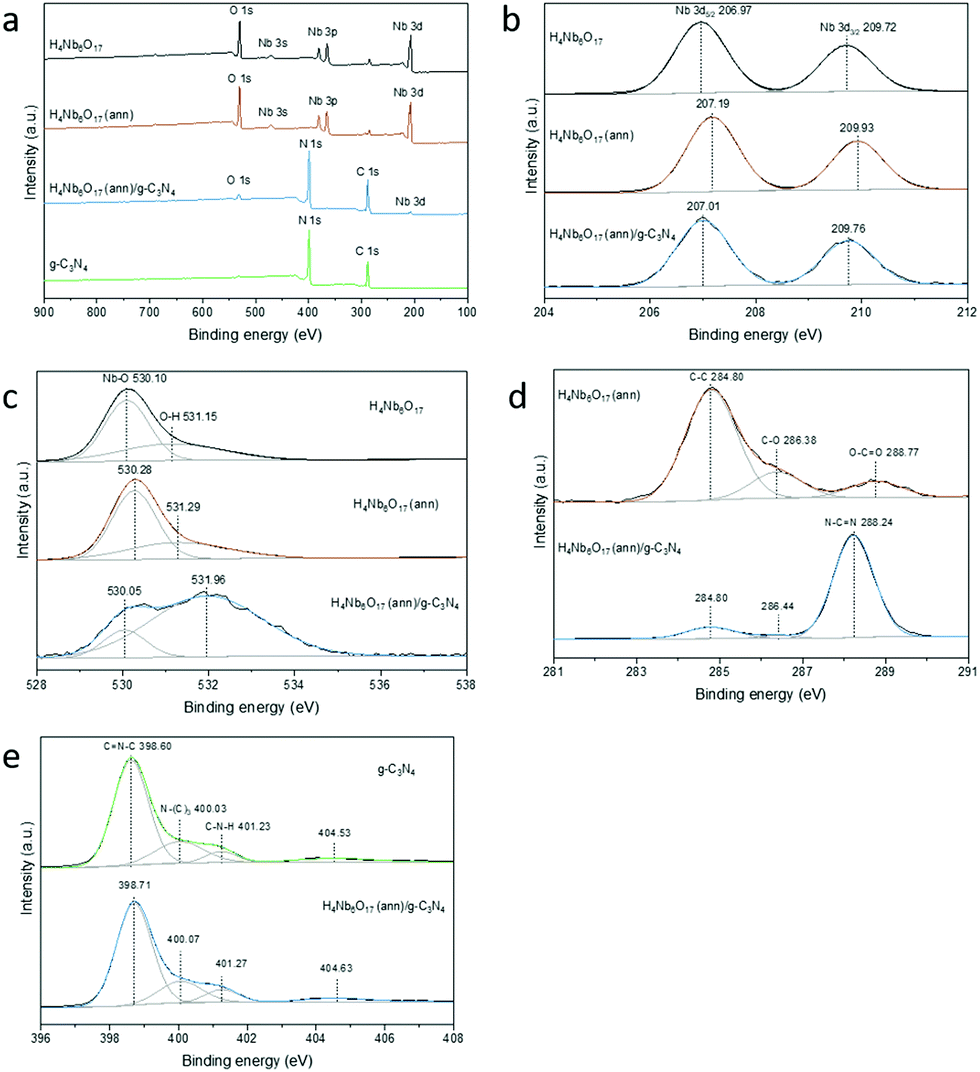 | ||
| Fig. 7 XPS survey spectrum (a), Nb 3d (b), 1s (c), C 1s (d) and N 1s (e) spectra of H4Nb6O17 before and after annealing and H4Nb6O17 (ann)/g-C3N4 composite samples. | ||
In the Nb 3d spectrum of H4Nb6O17 (Fig. 7b), two typical peaks can be observed at 206.97 and 209.72 eV with a peak area ratio of 3:2 due to the spin-orbital splitting into Nb 3d5/2 and Nb 3d3/2, respectively.26,27 The Nb5+–O bond is also responsible for the peak at 530.10 eV in the O 1s spectrum, while the broad peak at 531.15 eV could be ascribed to surface-adsorbed oxygen species (Fig. 7c). The annealing process of H4Nb6O17 at 300 °C induces a noticeable shift of approx. 0.2 eV towards higher binding energies in both O 1s and Nb 3d spectra. This means that, despite the preservation of the same crystalline structure and composition, the annealed H4Nb6O17 possesses remarkable differences in terms of intramolecular and intermolecular interactions that are worth further investigation.
The coupling process with g-C3N4 also changes the surface electron density in the heterojunction photocatalyst.28 The characteristic peaks of Nb 3d shifted to lower binding energies compared to those of H4Nb6O17 (ann). However, the spin–orbit separation value between Nb 3d5/2 and Nb 3d3/2 did not change from H4Nb6O17 to H4Nb6O17 (ann)/g-C3N4, indicating the exclusive presence of Nb5+.29 Similarly, the distinct peak corresponding to the lattice oxygen in the O 1s spectrum, significantly shifted to lower binding energies. Moreover, the new peak at 531.96 eV could suggest the formation of C![[double bond, length as m-dash]](https://www.rsc.org/images/entities/char_e001.gif) O bonds between H4Nb6O17 (ann) and g-C3N4.28
O bonds between H4Nb6O17 (ann) and g-C3N4.28
As shown in Fig. 7d for the C 1s spectrum, the H4Nb6O17 (ann) sample shows a weak signal for the characteristic bonds of adventitious carbon, which are reproduced in the H4Nb6O17 (ann)/g-C3N4 composite. Additionally, the profile of the composite clearly inherited the major peak associated with the sp2-bonded carbon of the s-triazine rings in g-C3N4 (N–CN).30 The N 1s spectra of both g-C3N4 and H4Nb6O17 (ann)/g-C3N4 are deconvoluted into three peaks, shown in Fig. 7d. The first can be assigned to the sp2-bonded nitrogen (CN–C), the second is related to the tertiary nitrogen groups N–(C)3 and the third belongs to the amino groups (C–N–H).26,31 One additional band centred at approx. 404.7 eV might correspond to π-excitations and charging effects. All of them slightly shifted toward higher binding energies after the coupling process because of a different chemical environment, indicating the formation of a heterojunction. This is consistent with the TGA results (Fig. S6, ESI†), which indicate the incorporation of a small percentage of organic material in the annealed compound. From these results we propose that the annealing of the niobate tubular material at 300 °C causes stronger incorporation of the organic intercalation into the layer,32 and partial unscrolling of the tubular structure, resulting in the shoulder in the UV/vis.
3.6 ORR performances
The photocatalytic H2O2 production over the series of photocatalysts under visible light irradiation was evaluated with methanol as sacrificial agent. As shown in Fig. 8, no H2O2 was formed over H4Nb6O17 while the annealed sample (300 °C) revealed a slight H2O2 production ability. This difference could be easily justified by the fact that the annealed H4Nb6O17 moderately absorbs in the visible range in contrast to the pristine form. For the same reason, graphitic carbon nitride, which has a narrow bandgap falling in the visible region, was able to efficiently generate H2O2 with a steady increase over 2.5 hours. Among all the samples, the H4Nb6O17 (ann)/g-C3N4 composite exhibited the highest H2O2 production. This superior photocatalytic ORR performance can be ascribed to the enhanced charge separation efficiency.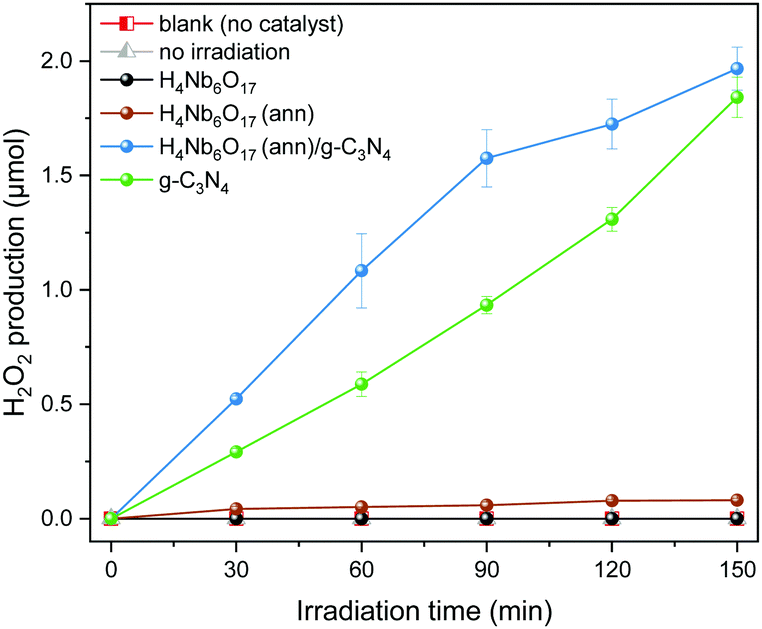 | ||
| Fig. 8 Time-dependent photocatalytic H2O2 production of the samples under visible light irradiation. | ||
Additionally, the ORR experiment was repeated without a photocatalyst or in the dark, and no H2O2 was generated throughout the whole time interval. These results confirm that any amount of H2O2 produced is directly associated to the presence of a photocatalyst and to its specific activity upon visible light irradiation, denoting the decisive role of photocatalysis in the O2 reduction process. The long term stability of the photocatalysts was investigated by recycling tests. The results are shown in Fig. S7 (ESI†).
3.7 PL
The charge carrier dynamics was studied using photoluminescence spectra. PL spectra were acquired under 325 nm excitation at room temperature to evaluate the ability of the samples to hold the absorbed photoenergy and direct it towards photocatalytic routes. As shown in Fig. 9, the major emission peak of g-C3N4 is centred at approx. 470 nm, and is assigned to the n–π* electron transitions of the lone pair electrons on the nitrogen atom.3 The PL intensity of the H4Nb6O17 (ann)/g-C3N4 composite is decreased by approx. 40% compared to pristine g-C3N4, and the signal was red-shifted by approx. 25 nm. This significant quenching demonstrates a more efficient charge separation with equal absorption ability. | ||
| Fig. 9 PL spectra of g-C3N4 and the H4Nb6O17 (ann)/g-C3N4 composite. | ||
3.8 Photocatalytic mechanism and band diagram
Based on the aforementioned results and references, a mechanism for the photocatalytic reduction of O2 to H2O2 by the hybrid catalysts is proposed. In addition, the VB-XPS spectra were employed to determine the valence band energies. As depicted in Fig. S8, (ESI†) the valence band positions of g-C3N4 and H4Nb6O17 (ann) are estimated at 2.10 and 2.72 eV, respectively. Therefore, the corresponding conduction band potentials are −0.72 and −0.29 eV vs. NHE, according to the equation: ΔEg = |ECB − EVB|. The resulting band alignment within the H4Nb6O17 (ann)/g-C3N4 composite, displayed in Fig. 10, follows the staggered gap model.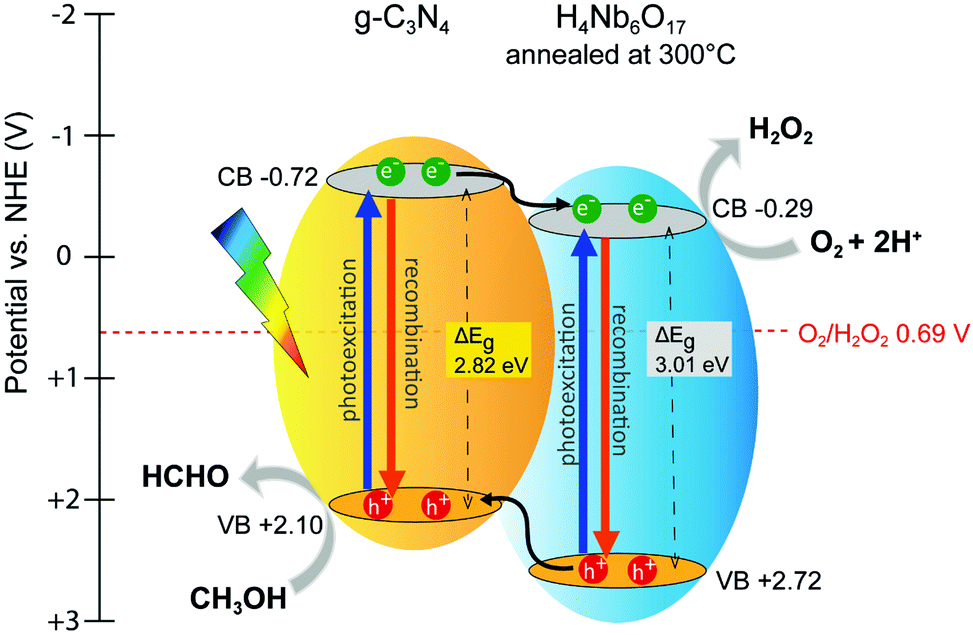 | ||
| Fig. 10 Schematic illustration of the band levels and charge transfer pathways in the H4Nb6O17 (ann)/g-C3N4 composite. | ||
A possible charge transfer pathways is also illustrated. Upon visible light irradiation, both components are activated and undergo exciton dissociation. The band discontinuity between the CB levels of the two components is narrow, favouring the formation of an interfacial channel for charge transfer.33,34 Suppression of PL intensity and increasing photocatalytic activities specifically support this trend. Therefore, photogenerated electrons accumulate in the CB of the annealed H4Nb6O17, while positively-charged holes of the niobate component tend to migrate to the VB of g-C3N4 because of its less positive potential. The annealed H4Nb6O17 also benefits from the presence of sub-band states due to the shoulder in the visible region, indicating the possibility of additional charge transfer pathways. The improved separation of the charge carriers is the major factor promoting a superior H2O2 production performance for the hybrid photocatalyst.
Moreover, the band levels of both g-C3N4 and H4Nb6O17 have straddled the potential difference for O2/H2O2 (0.69 V vs. NHE). Photoinduced electrons transfer to the photocatalyst surface to participate in the reduction of molecular oxygen. Meanwhile, the holes are consumed by the electron donor (methanol). Thus, water oxidation is prevented by using a hole scavenger, so only two-electron or multi-step single-electron O2 reduction is a possible photocatalytic pathway for H2O2 production. Fig. S9 (ESI†) shows the VB-XPS of H4Nb6O17 (ann)/g-C3N4 composite, revealing an increase of 0.2 eV from the valence band maximum of g-C3N4. The down-shift of the valence band is believed to enhance the hole oxidation activity, affecting thus the overall photocatalytic activity by inhibiting the recombination phenomenon.35
We investigated the formation of radical species in H4Nb6O17 (ann)/g-C3N4 and g-C3N4 samples using electron paramagnetic resonance (EPR) spectroscopy in the presence of a 5,5-dimethyl-pyrroline-N-oxide (DMPO) spintrap in methanol under full range illumination, shown in Fig. S10 (ESI†). The six characteristic peaks of the DMPO ˙O2− adduct were observed36,37 after 2 min irradiation indicating the formation of superoxide radicals in the ORR process.
4. Conclusions
A composite of novel brown niobate and g-C3N4 was synthesized and found to be active in the visible light induced ORR to produce H2O2. Brown niobate was formed by annealing nanoscrolled H4Nb6O17 at 300 °C, resulting in the incorporation of organic material and unscrolling of the tubes. The formation of a heterojunction between the two components was shown to alter the chemical environment and suppress the PL signal by hindering the annihilation of photoexcited electron–hole pairs. Based on these results, a band diagram is proposed.Author contributuion
L. Z. – data curation; investigation; formal analysis; writing – original draft; S. Z., Z. L., R. L. – data acquisition; X. C. – conceptualization; G. D. – conceptualization, project administration, supervision; writing – review and editing.Conflicts of interest
There are no conflicts to declare.Acknowledgements
This work was supported by Suzhou Institute of Industrial Technology Research Fund (Grant No. SGYKJ201705 and 2017kyqd010), Xi'an Jiaotong Liverpool University Research Development Fund and Key Programme Special Fund in XJTLU (KSF-E-02). National Natural Science Foundation of China (Grant No. 21650110446).References
- S. Hu, X. Sun, Y. Zhao, W. Li, H. Wang and G. Wu, J. Taiwan Inst. Chem. Eng., 2020, 107, 129–138 CrossRef CAS.
- S. Zhao and X. Zhao, J. Catal., 2018, 366, 98–106 CrossRef CAS.
- Z. Wei, M. Liu, Z. Zhang, W. Yao, H. Tan and Y. Zhu, Energy Environ. Sci., 2018, 11, 2581–2589 RSC.
- Y. Yang, Z. Zeng, G. Zeng, D. Huang, R. Xiao, C. Zhang, C. Zhou, W. Xiong, W. Wang, M. Cheng, W. Xue, H. Guo, X. Tang and D. He, Appl. Catal., B, 2019, 258, 117956 CrossRef CAS.
- T. Baran, S. Wojtyła, A. Vertova, A. Minguzzi and S. Rondinini, J. Electroanal. Chem., 2018, 808, 395–402 CrossRef CAS.
- M. Teranishi, R. Hoshino, S. Naya and H. Tada, Angew. Chem., Int. Ed., 2016, 55, 12773–12777 CrossRef CAS PubMed.
- X. Zeng, Y. Liu, Y. Kang, Q. Li, Y. Xia, Y. Zhu, H. Hou, M. H. Uddin, T. R. Gengenbach, D. Xia, C. Sun, D. T. McCarthy, A. Deletic, J. Yu and X. Zhang, ACS Catal., 2020, 10, 3697–3706 CrossRef CAS.
- M. A. Bizeto and V. R. L. Constantino, Mater. Res. Bull., 2004, 39, 1729–1736 CrossRef CAS.
- M. A. Bizeto, A. L. Shiguihara and V. R. L. Constantino, J. Mater. Chem., 2009, 19, 2512–2525 RSC.
- C. Zhou, G. Chen and Q. Wang, J. Mol. Catal. A: Chem., 2011, 339, 37–42 CrossRef CAS.
- D. Li, Q. Li, J. He, L. Hu and J. Hu, New J. Chem., 2016, 40, 136–143 RSC.
- R. Liu, E. Morris, X. Cheng, E. Amigues, K. Lau, B. Kim, Y. Liu, Z. Ke, S. E. Ashbrook, M. Bühl and G. Dawson, ChemistrySelect, 2018, 3, 8338–8343 CrossRef CAS.
- X. Xu, L. Xiao, Y. Jia, Z. Wu, F. Wang, Y. Wang, N. O. Haugen and H. Huang, Energy Environ. Sci., 2018, 11, 2198–2207 RSC.
- Y. Tan, Z. Shu, J. Zhou, T. Li, W. Wang and Z. Zhao, Appl. Catal., B, 2018, 230, 260–268 CrossRef CAS.
- M. S. Nasir, G. Yang, I. Ayub, S. Wang, L. Wang, X. Wang, W. Yan, S. Peng and S. Ramakarishna, Appl. Catal., B, 2019, 257, 117855 CrossRef CAS.
- X. Wang, M. Kazuhiko, T. Arne, K. Takanabe, X. Gang, J. M. Carlsson, K. Domen and M. Antonietti, Nat. Mater., 2009, 8, 76–80 CrossRef CAS PubMed.
- Y. Zheng, L. Lin, B. Wang and X. Wang, Angew. Chem., 2015, 54, 12868–12884 CrossRef CAS PubMed.
- J. Liu, T. Zhang, Z. Wang, G. Dawson and W. Chen, J. Mater. Chem., 2011, 21, 14398–14401 RSC.
- L. Shi, L. Yang, W. Zhou, Y. Liu, L. Yin, X. Hai, H. Song and J. Ye, Small, 2018, 14, 1703142 CrossRef PubMed.
- M. C. Sarahan, E. C. Carroll, M. Allen, D. S. Larsen, N. D. Browning and F. E. Osterloh, J. Solid State Chem., 2008, 181, 1678–1683 CrossRef CAS.
- L. Tian, K. Sun, Y. Rui, W. Cui and W. An, RSC Adv., 2018, 8, 29309–29320 RSC.
- F. Dong, L. Wu, Y. Sun, M. Fu, Z. Wu and S. C. Lee, J. Mater. Chem., 2011, 21, 15171–15174 RSC.
- Q. Huang, J. Wang, P. Wang, H. Yao and Z. Li, Int. J. Hydrogen Energy, 2017, 42, 6683–6694 CrossRef CAS.
- G. Dawson, J. Liu, L. Lu and W. Chen, ChemCatChem, 2012, 4, 1133–1138 CrossRef CAS.
- C. Guo, J. Zhu, J. He, L. Hu, P. Zhang and D. Li, Vacuum, 2020, 182, 109718 CrossRef CAS.
- G. T. S. T. da Silva, K. T. G. Carvalho, O. F. Lopes and C. Ribeiro, Appl. Catal., B, 2017, 216, 70–79 CrossRef CAS.
- P. Chen, P. Xing, Z. Chen, X. Hu, H. Lin, L. Zhao and Y. He, J. Colloid Interface Sci., 2019, 534, 163–171 CrossRef CAS PubMed.
- K. Wang, Y. Li, J. Li and G. Zhang, Appl. Catal., B, 2020, 263, 117730 CrossRef CAS.
- X. Kong, Q. Lu, J. Huang, L. Li, J. Zhang, X. Wang, J. Li, Y. Wang and Q. Feng, J. Alloys Compd., 2018, 746, 68–76 CrossRef CAS.
- F. Liang, X. Sun, S. Hu, H. Ma, F. Wang and G. Wu, Diamond Relat. Mater., 2020, 108, 107971 CrossRef CAS.
- M. A. Khan, S. Mutahir, F. Wang, W. Lei, M. Xia and S. Zhu, J. Hazard. Mater., 2019, 367, 293–303 CrossRef CAS PubMed.
- L. X. C. T. Rajh, K. Lukas, T. Liu, M. C. Thurnauer and D. M. Tiede, J. Phys. Chem. B, 2002, 106, 10543–10552 CrossRef.
- S. Li, C. Wang, M. Cai, F. Yang, Y. Liu, J. Chen, P. Zhang, X. Li and X. Chen, Chem. Eng. J., 2022, 428, 131158 CrossRef CAS.
- J. Bai, R. Shen, W. Chen, J. Xie, P. Zhang, Z. Jiang and X. Li, Chem. Eng. J., 2022, 429, 132587 CrossRef CAS.
- Y. Zhu, E. Li, H. Zhao, S. Shen, J. Wang, Z. Lv, M. Liu, Y. Wen, L. Lu and J. Liu, Surf. Interfaces, 2021, 25, 101262 CrossRef CAS.
- Y. Yang, Z. Zeng, G. Zeng, D. Huang, R. Xiao, C. Zhang, C. Zhou, W. Xiong, W. Wang, M. Cheng, W. Xue, H. Guo, X. Tang and D. He, Appl. Catal., B, 2019, 258, 117956 CrossRef CAS.
- S. Li, G. Dong, R. Hailili, L. Yang, Y. Li, F. Wang, Y. Zeng and C. Wang, Appl. Catal., B, 2016, 190, 26–35 CrossRef CAS.
Footnote |
| † Electronic supplementary information (ESI) available: Further XRD, UV/vis spectra; valence band edge spectra. See DOI: 10.1039/d1ya00038a |
| This journal is © The Royal Society of Chemistry 2022 |